> ## Documentation Index
> Fetch the complete documentation index at: https://parabola.io/docs/llms.txt
> Use this file to discover all available pages before exploring further.

# Sending data

<Frame>
  <iframe src="https://www.youtube.com/embed/1xZlNHSHK-o" title="Sending data" frameborder="0" allow="accelerometer; autoplay; clipboard-write; encrypted-media; gyroscope; picture-in-picture; web-share" referrerpolicy="strict-origin-when-cross-origin" allowfullscreen />
</Frame>

In this lesson, you'll learn the four categories of data exports in Parabola and see how to add send steps to your flow by prompting or searching the canvas.

***

<Card icon="sparkles" title="Building challenge">
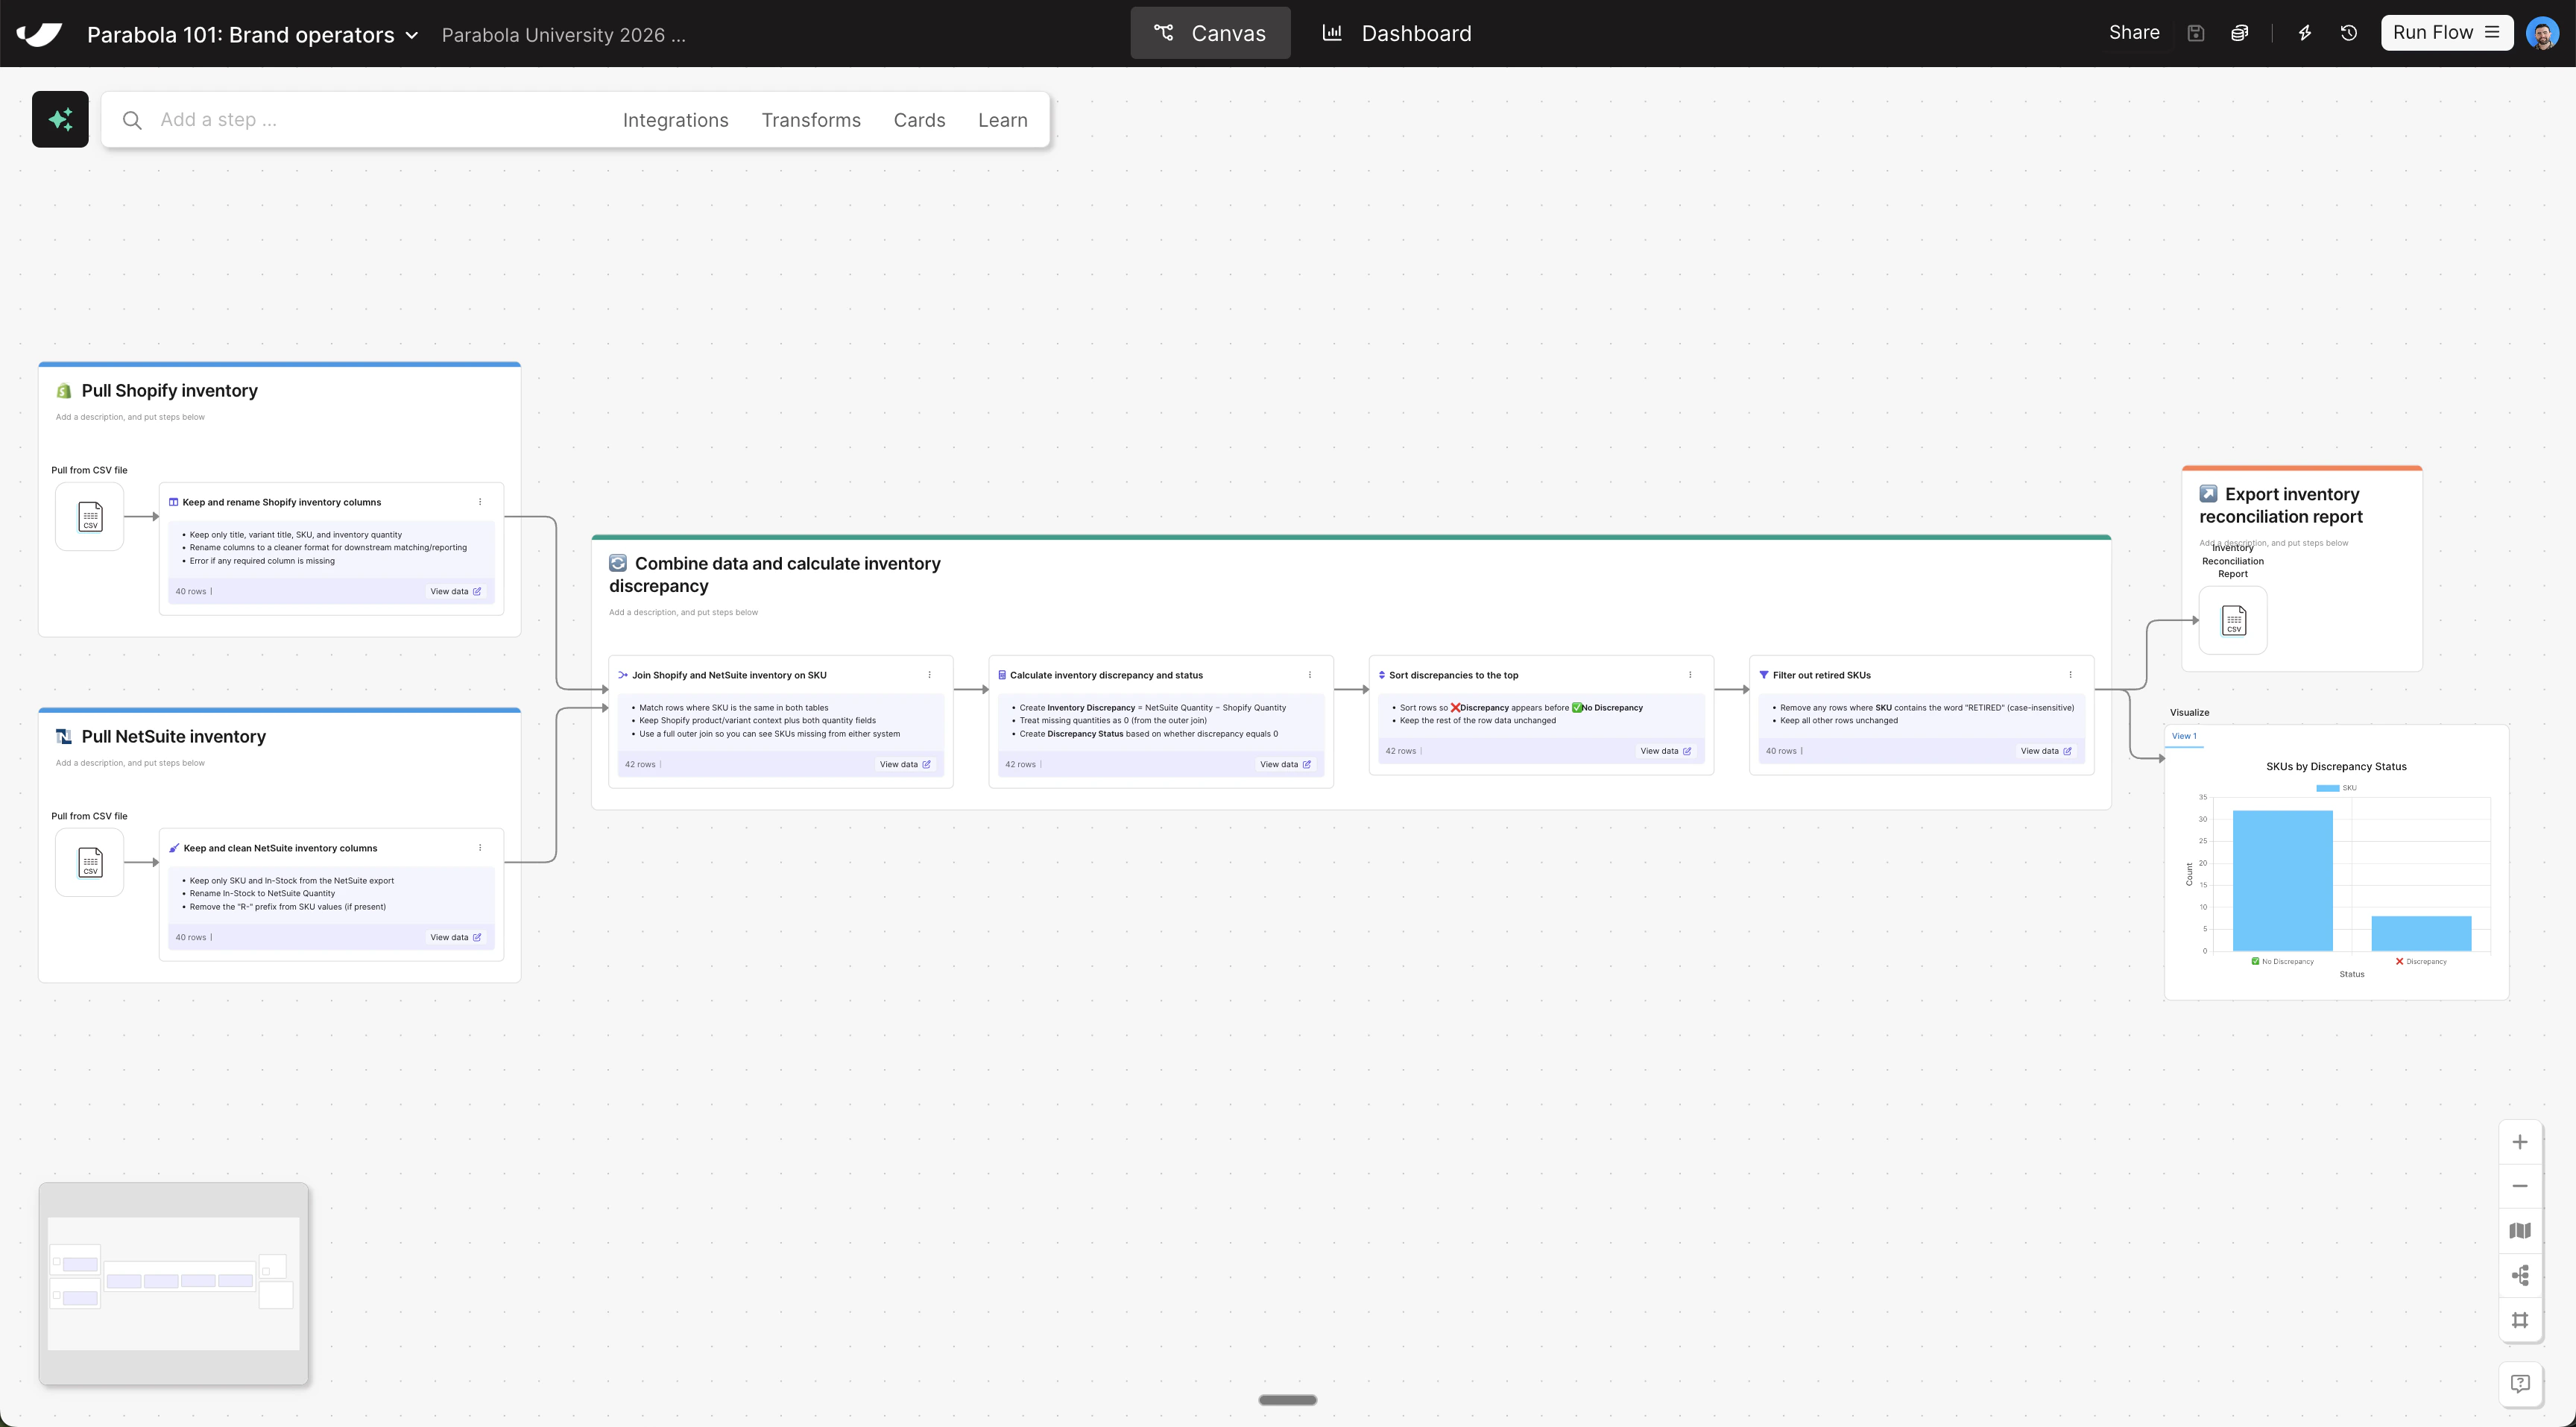
  Your reconciled inventory data is ready — now export it as a CSV and build a visualization to see how many SKUs have discrepancies at a glance.

  <Steps>
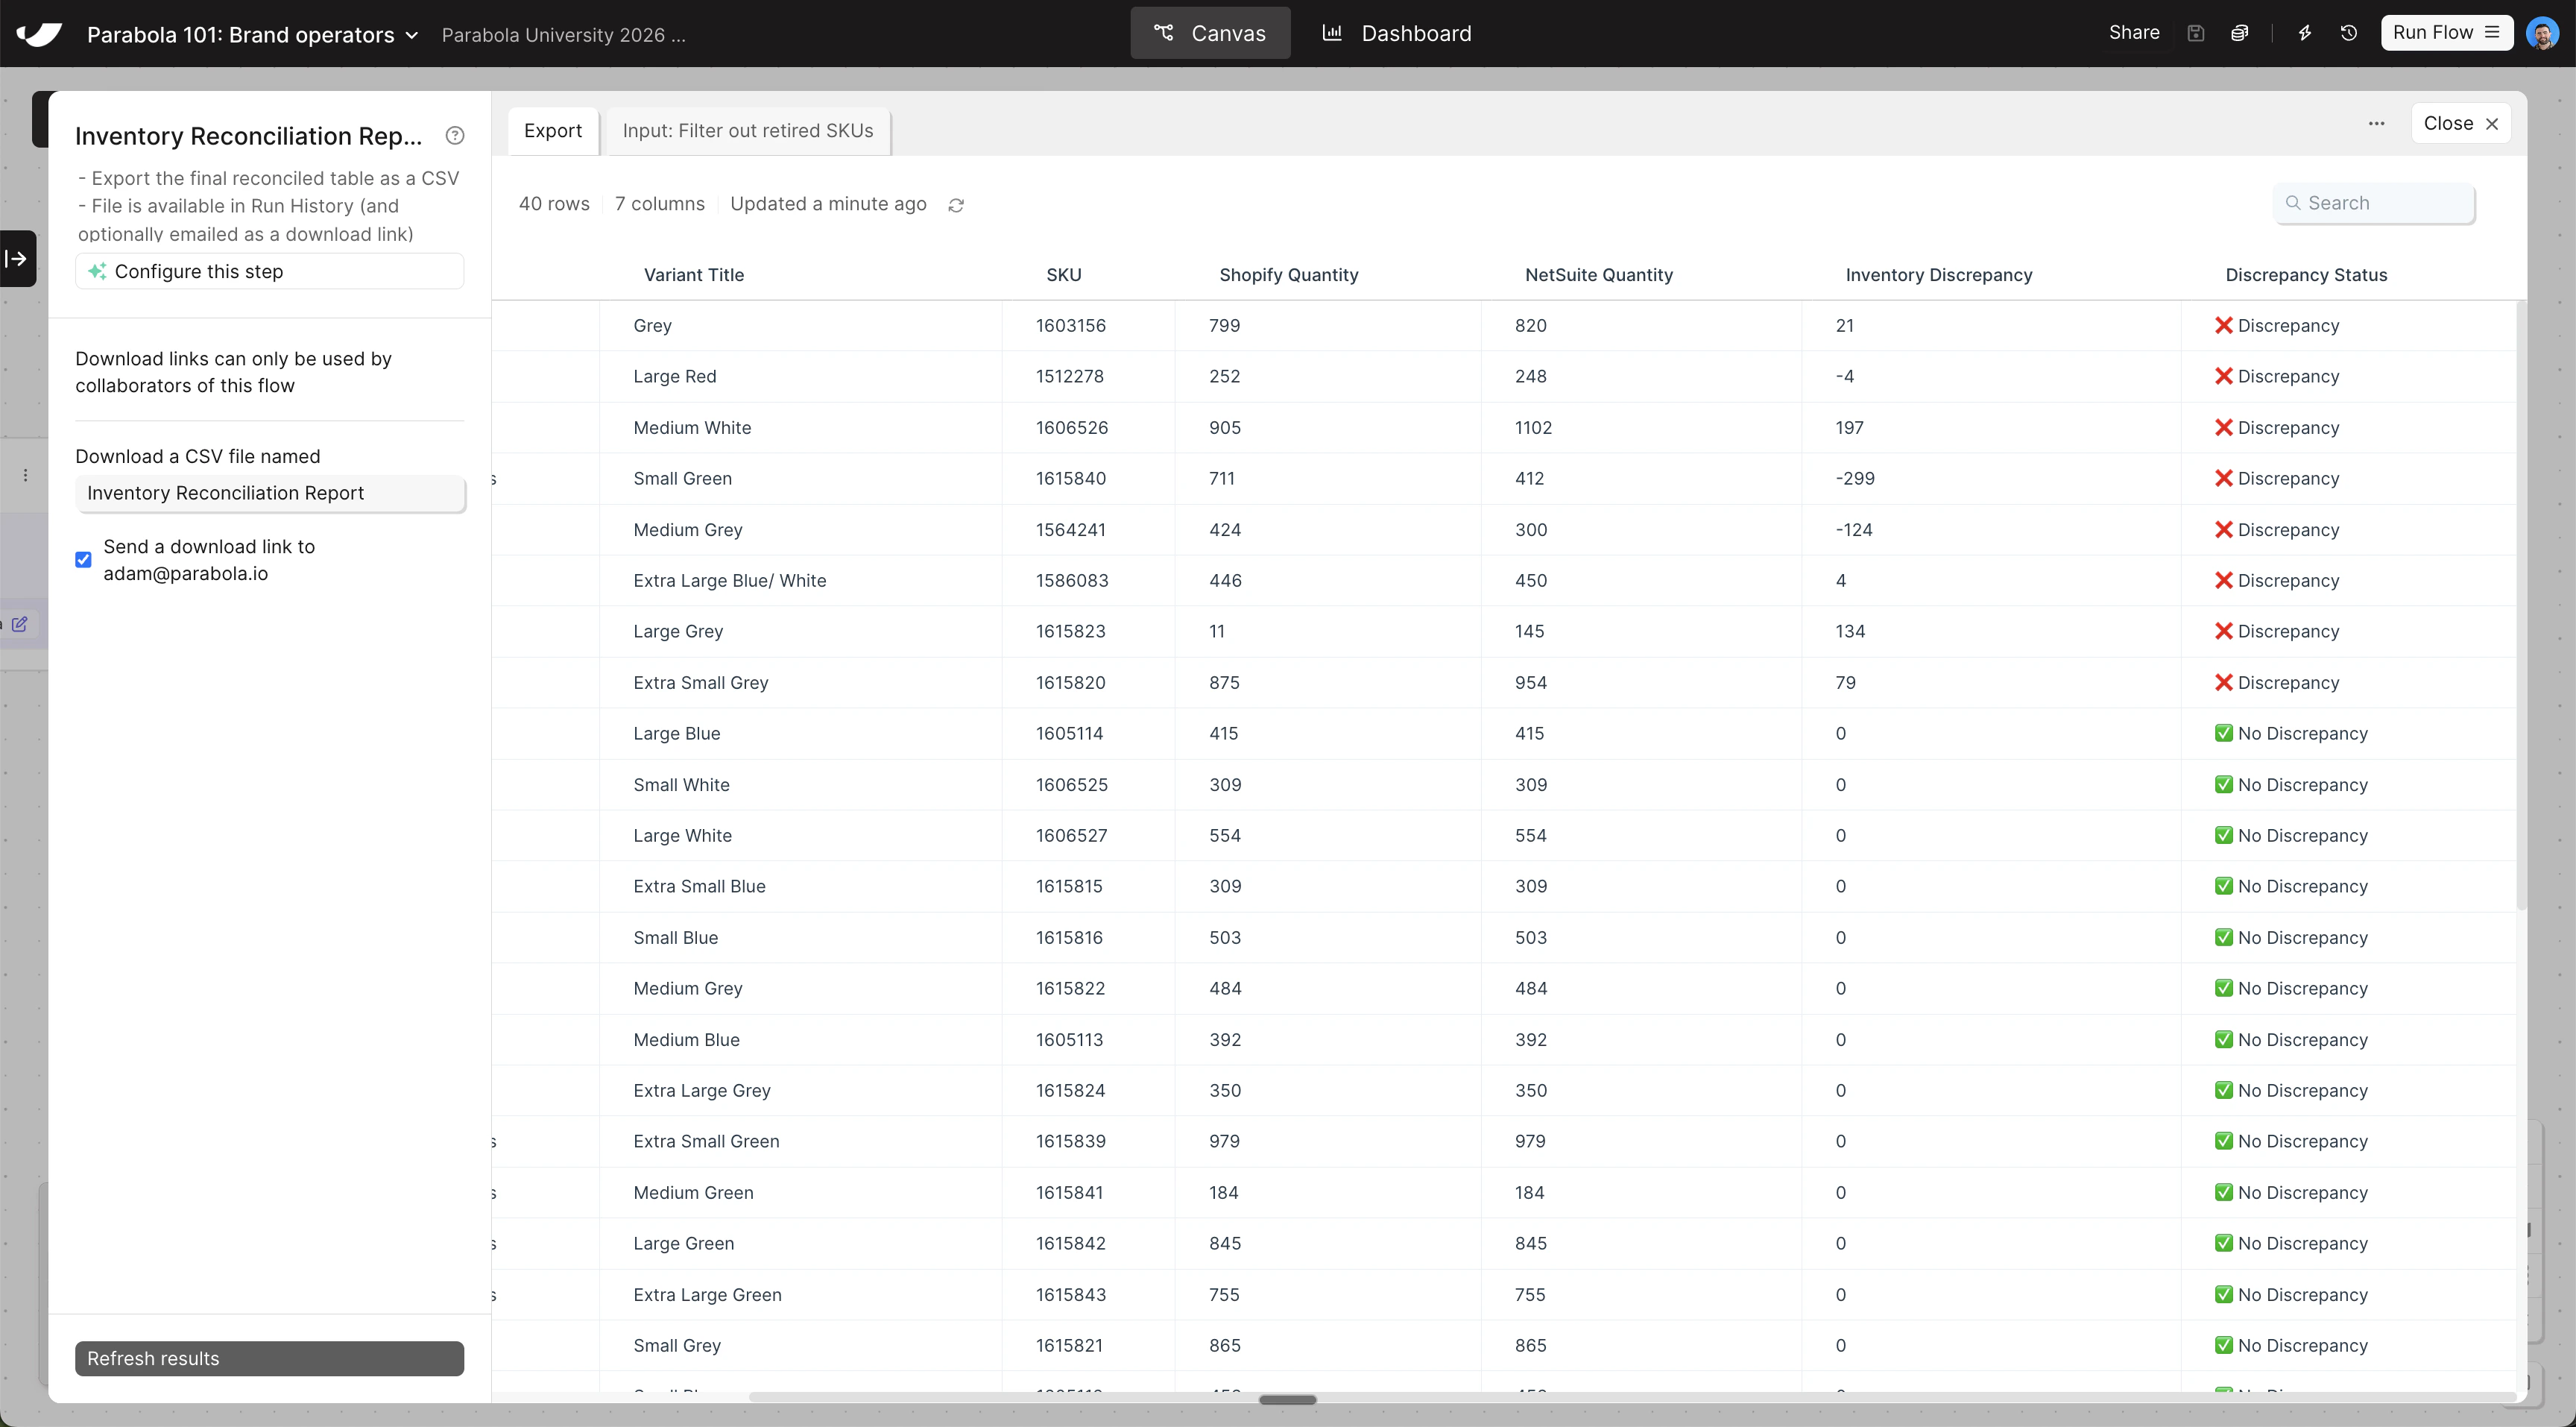
    <Step title="Copy and paste this prompt into Parabola to export your report as a CSV">
      ```text wrap theme={null}
      Export a CSV file at the end of the flow. Title the CSV file "Inventory Reconciliation Report".
      ```
    </Step>

    <Step title="Add a Visualization step and configure it as a column chart">
      * Search for the **Visualize** step and drag it onto the canvas below your **Generate CSV file** step
      * Grab an arrow from your previous data transformation step and connect it to your **Visualize** step so data is flowing in
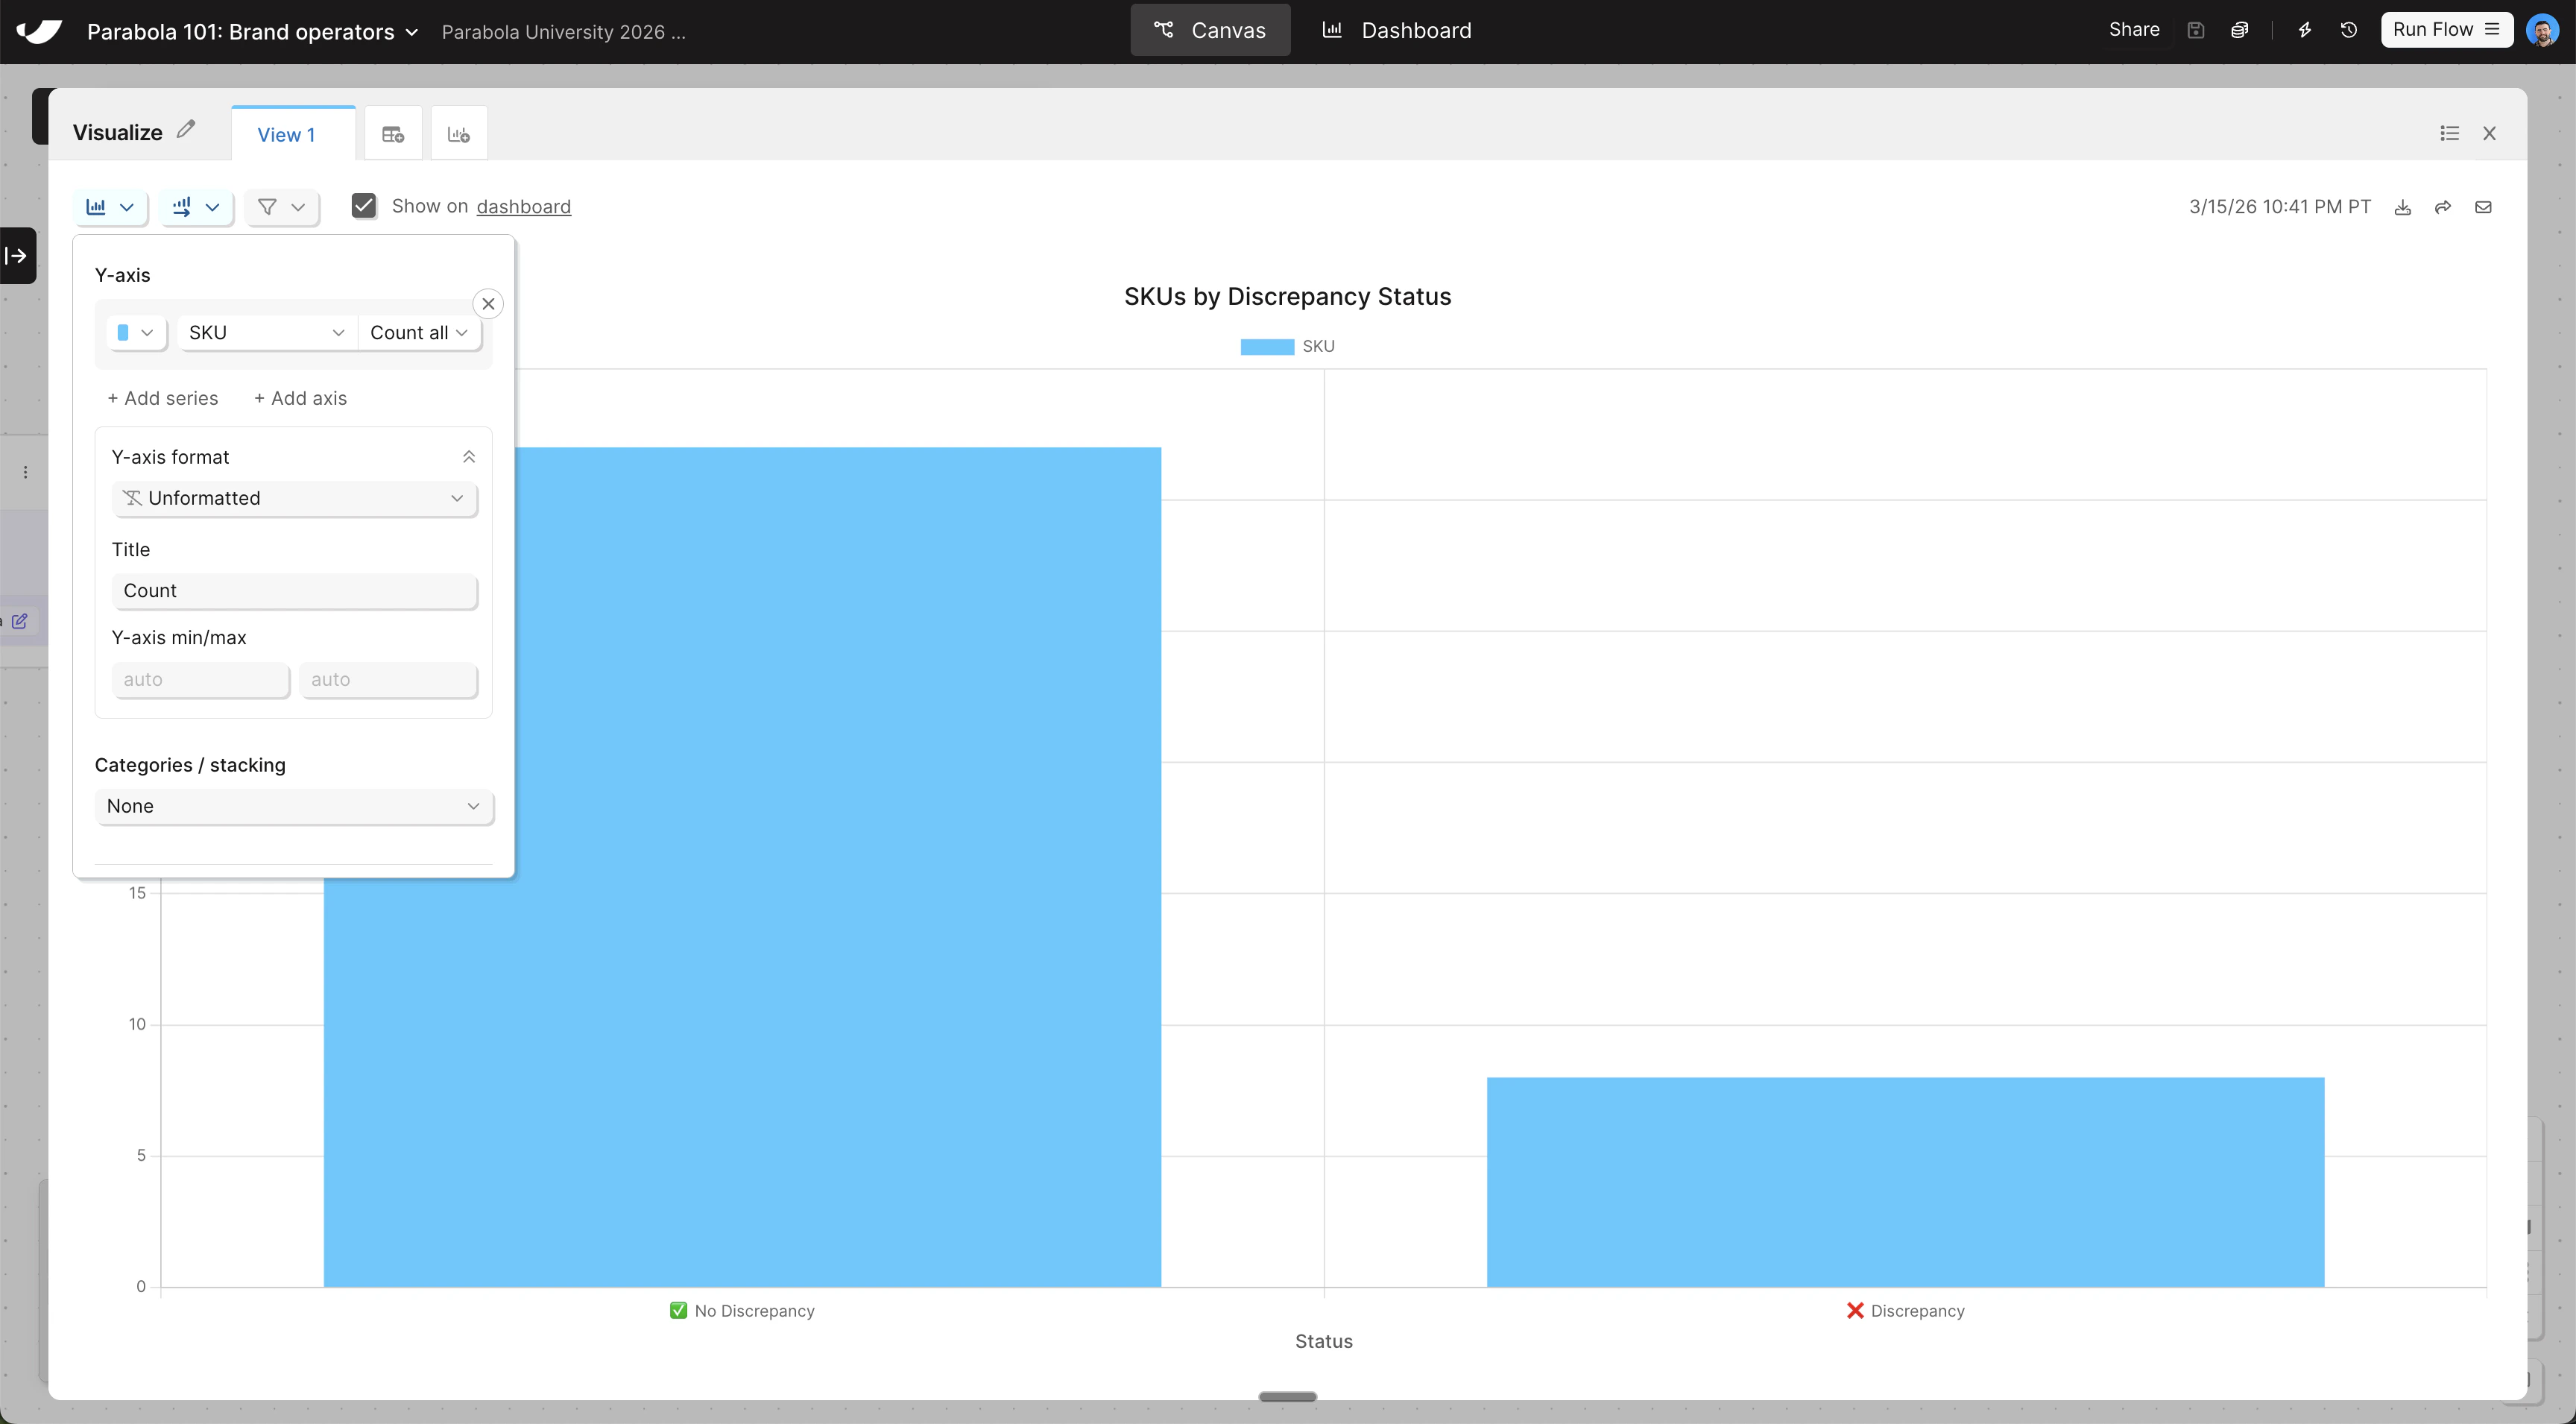
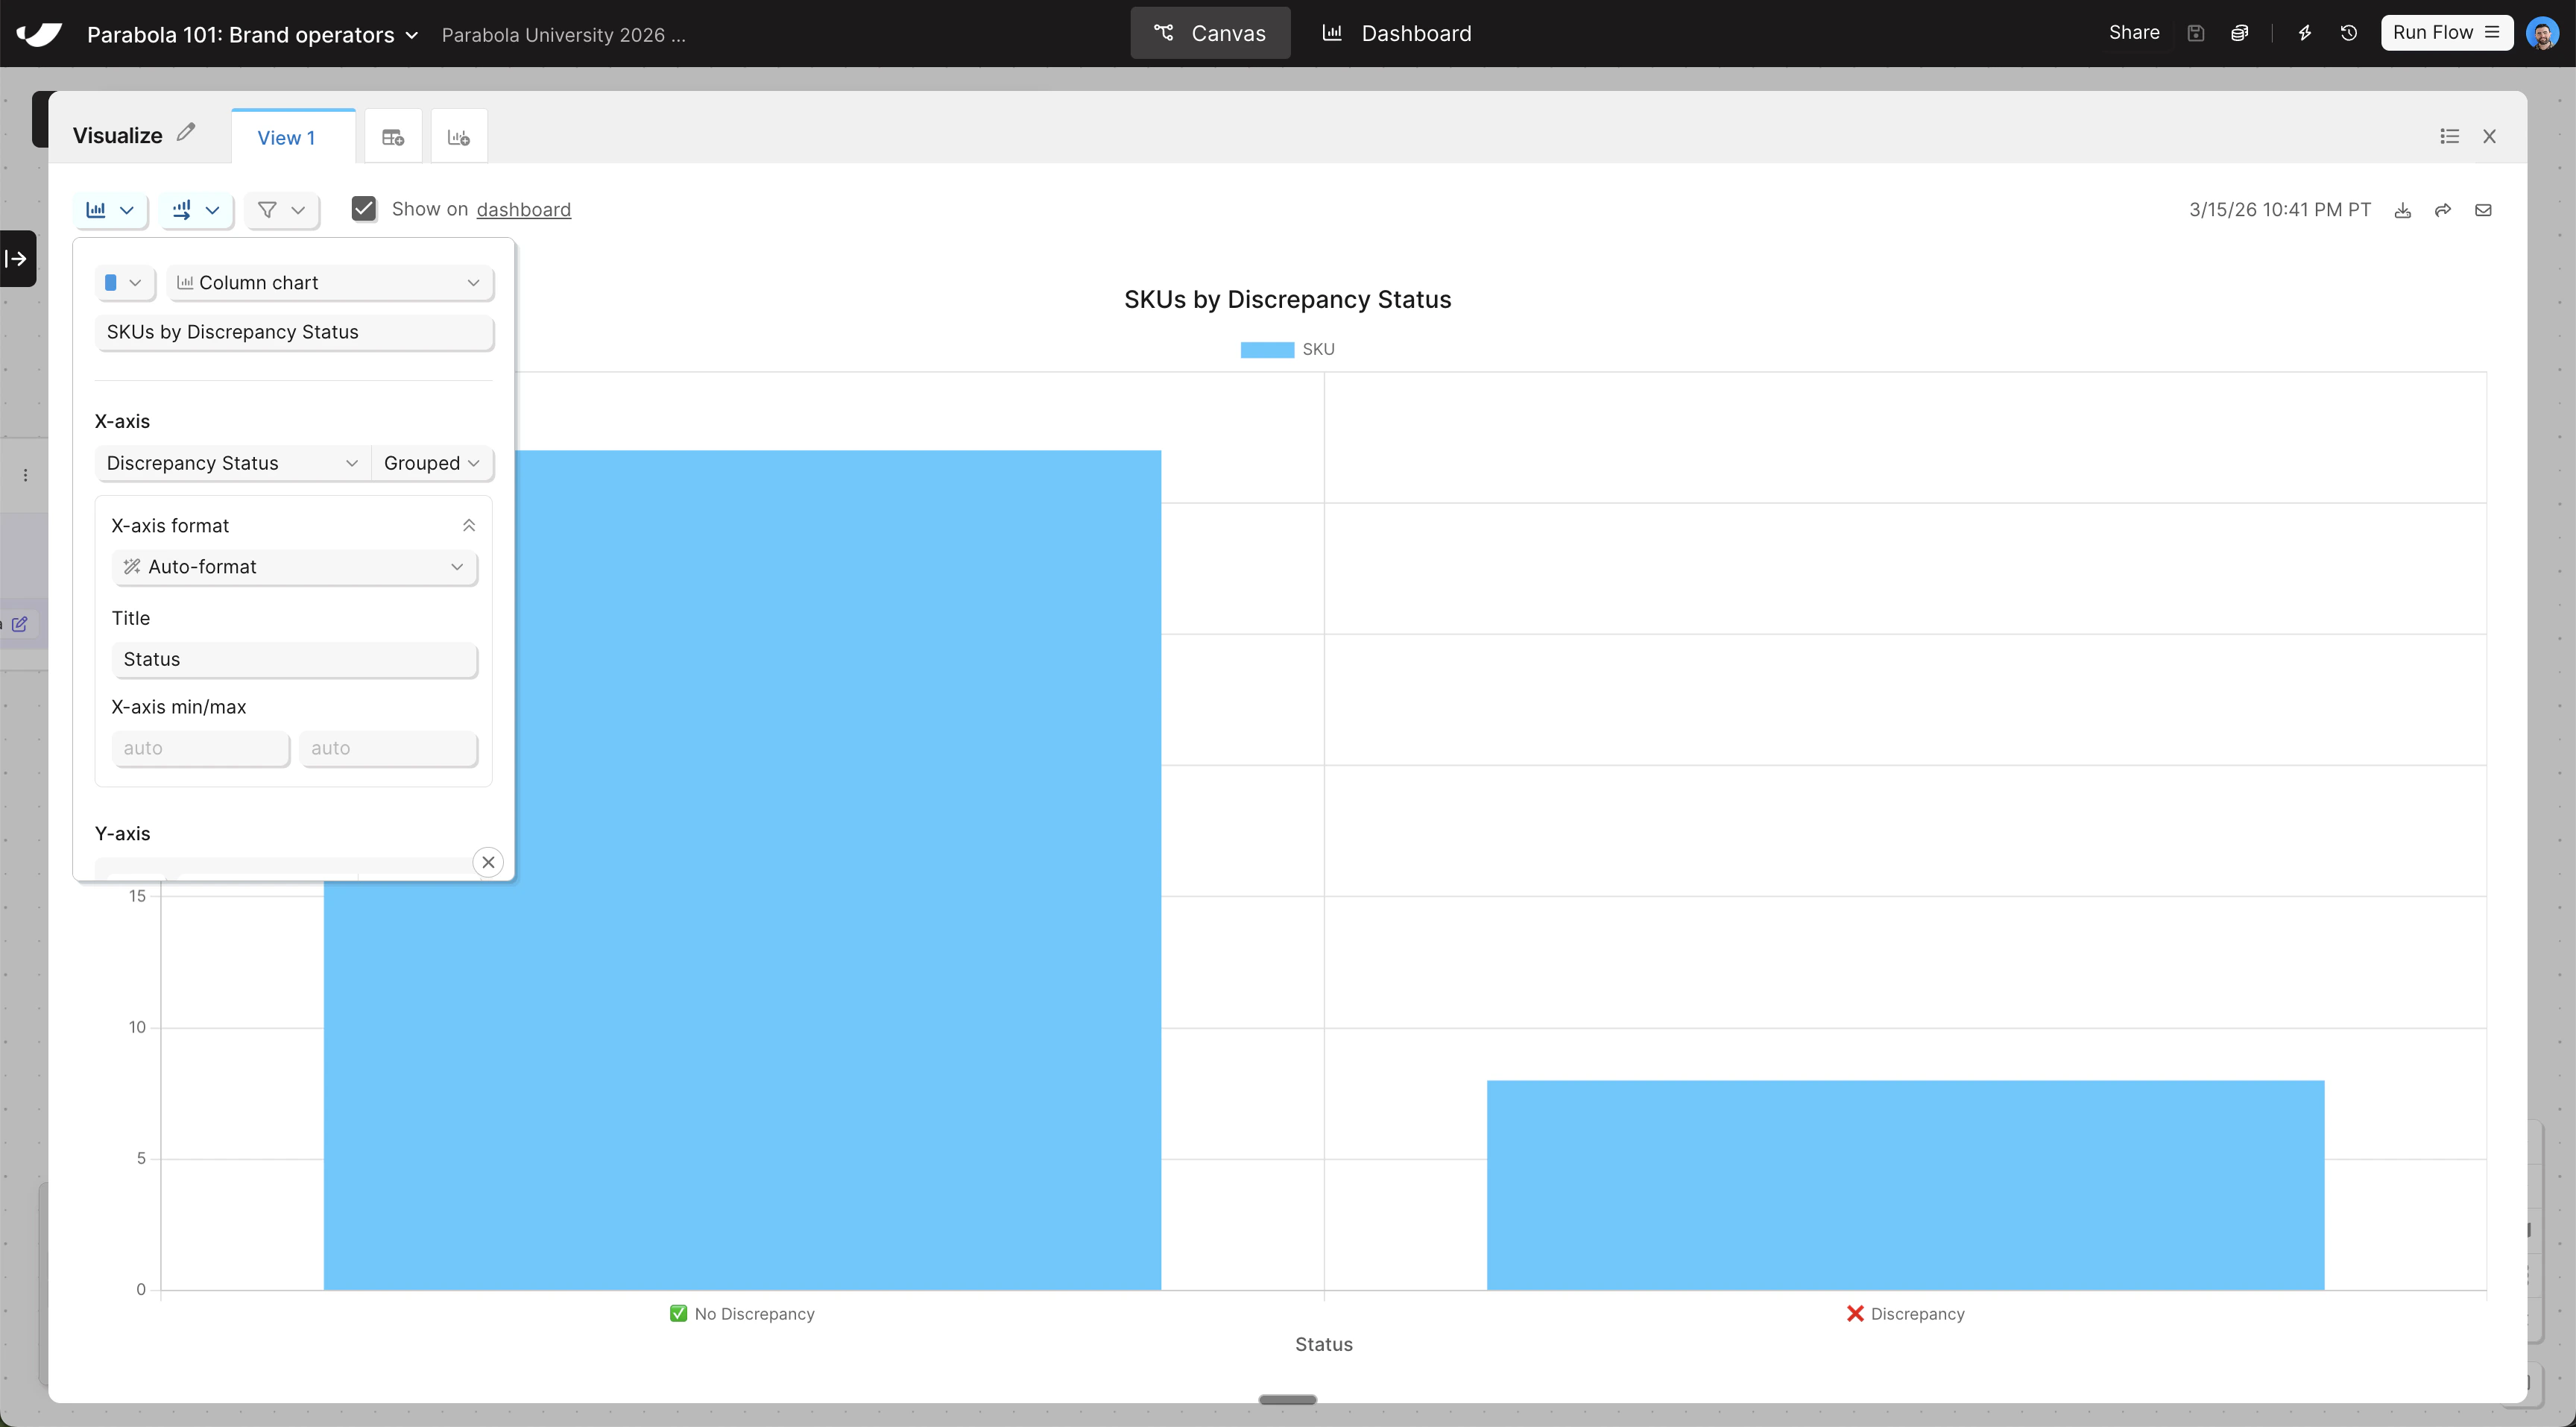
      * Open the step and change the chart type to **Column chart**. Title the chart "SKUs by Discrepancy Status" and set the X-axis to **Discrepancy Status**
      * To configure the Y-axis, click **Add Series** and set **SKU** as the Y-axis
      * Keep the aggregation method as **Count**, and give both your X and Y axes a title
    </Step>

    <Step title="Click &#x22;Run flow&#x22; in the top right to officially run your flow" />
  </Steps>
</Card>

<Accordion title="Check your work">
  <Note>The steps added to your canvas and their exact documentation may differ from what you see below — every AI response is unique. The important thing is that your resulting data set matches what you see here.</Note>

  <Frame>
    <img src="https://mintcdn.com/parabola-7119dfb0/-8HaJzuyyzC_BGUC/images/brand-operators-send-canvas.png?fit=max&auto=format&n=-8HaJzuyyzC_BGUC&q=85&s=f10a8745b557a68f82373c5d50827d32" alt="Send data canvas view" width="3456" height="1914" data-path="images/brand-operators-send-canvas.png" />

    <img src="https://mintcdn.com/parabola-7119dfb0/-8HaJzuyyzC_BGUC/images/brand-operators-send-csv.png?fit=max&auto=format&n=-8HaJzuyyzC_BGUC&q=85&s=171a40cd8289d444d27cadd4243a8138" alt="CSV export step" width="3456" height="1910" data-path="images/brand-operators-send-csv.png" />

    <img src="https://mintcdn.com/parabola-7119dfb0/-8HaJzuyyzC_BGUC/images/brand-operators-send-viz-xaxis.png?fit=max&auto=format&n=-8HaJzuyyzC_BGUC&q=85&s=892bf6126979f465c20af026155c66da" alt="Visualization X-axis config" width="3456" height="1914" data-path="images/brand-operators-send-viz-xaxis.png" />

    <img src="https://mintcdn.com/parabola-7119dfb0/-8HaJzuyyzC_BGUC/images/brand-operators-send-viz-yaxis.png?fit=max&auto=format&n=-8HaJzuyyzC_BGUC&q=85&s=4e4b59a166ca361e819866f07af0c889" alt="Visualization Y-axis config" width="3456" height="1914" data-path="images/brand-operators-send-viz-yaxis.png" />
  </Frame>
</Accordion>