> ## Documentation Index
> Fetch the complete documentation index at: https://parabola.io/docs/llms.txt
> Use this file to discover all available pages before exploring further.

# Pulling data

<Frame>
  <iframe src="https://www.youtube.com/embed/1d2VYkXvCNM" title="Pulling data" frameborder="0" allow="accelerometer; autoplay; clipboard-write; encrypted-media; gyroscope; picture-in-picture; web-share" referrerpolicy="strict-origin-when-cross-origin" allowfullscreen />
</Frame>

In this lesson, you'll learn the four general categories of data sources that you can pull into Parabola and see how you can pull data by prompting, dragging and dropping files onto the canvas, and searching for steps in the search bar.

***

<Card icon="sparkles" title="Building challenge">
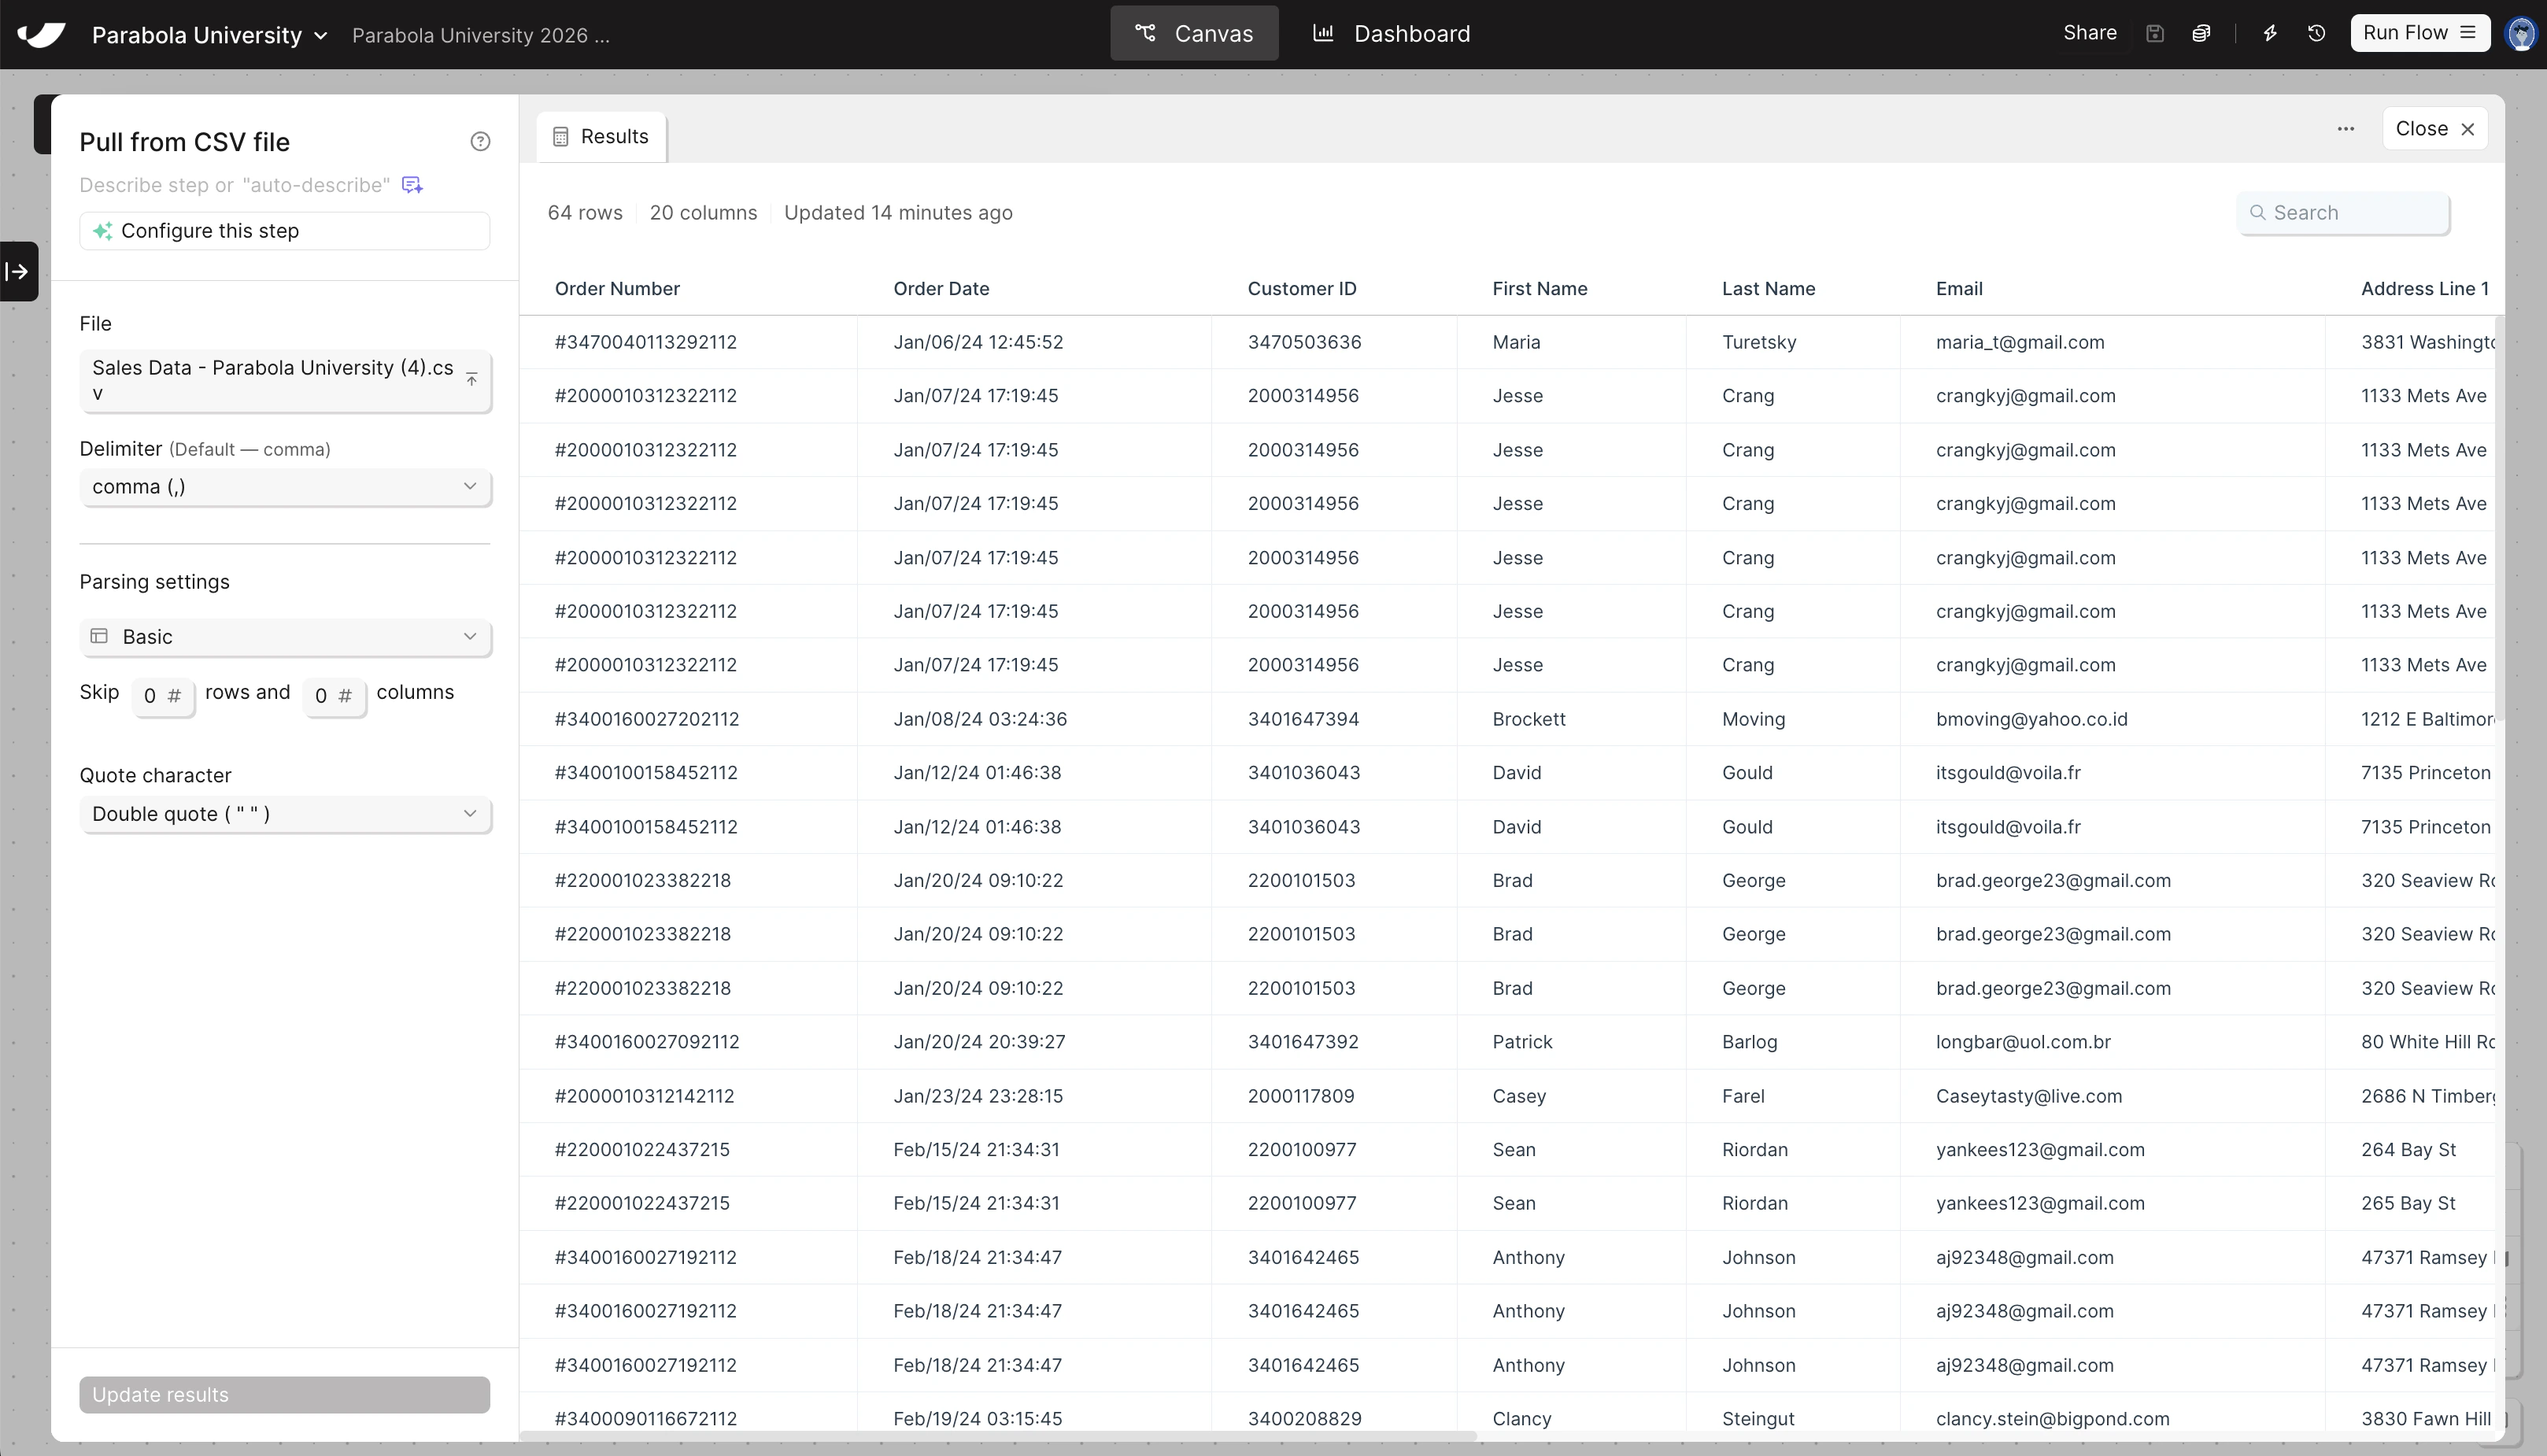
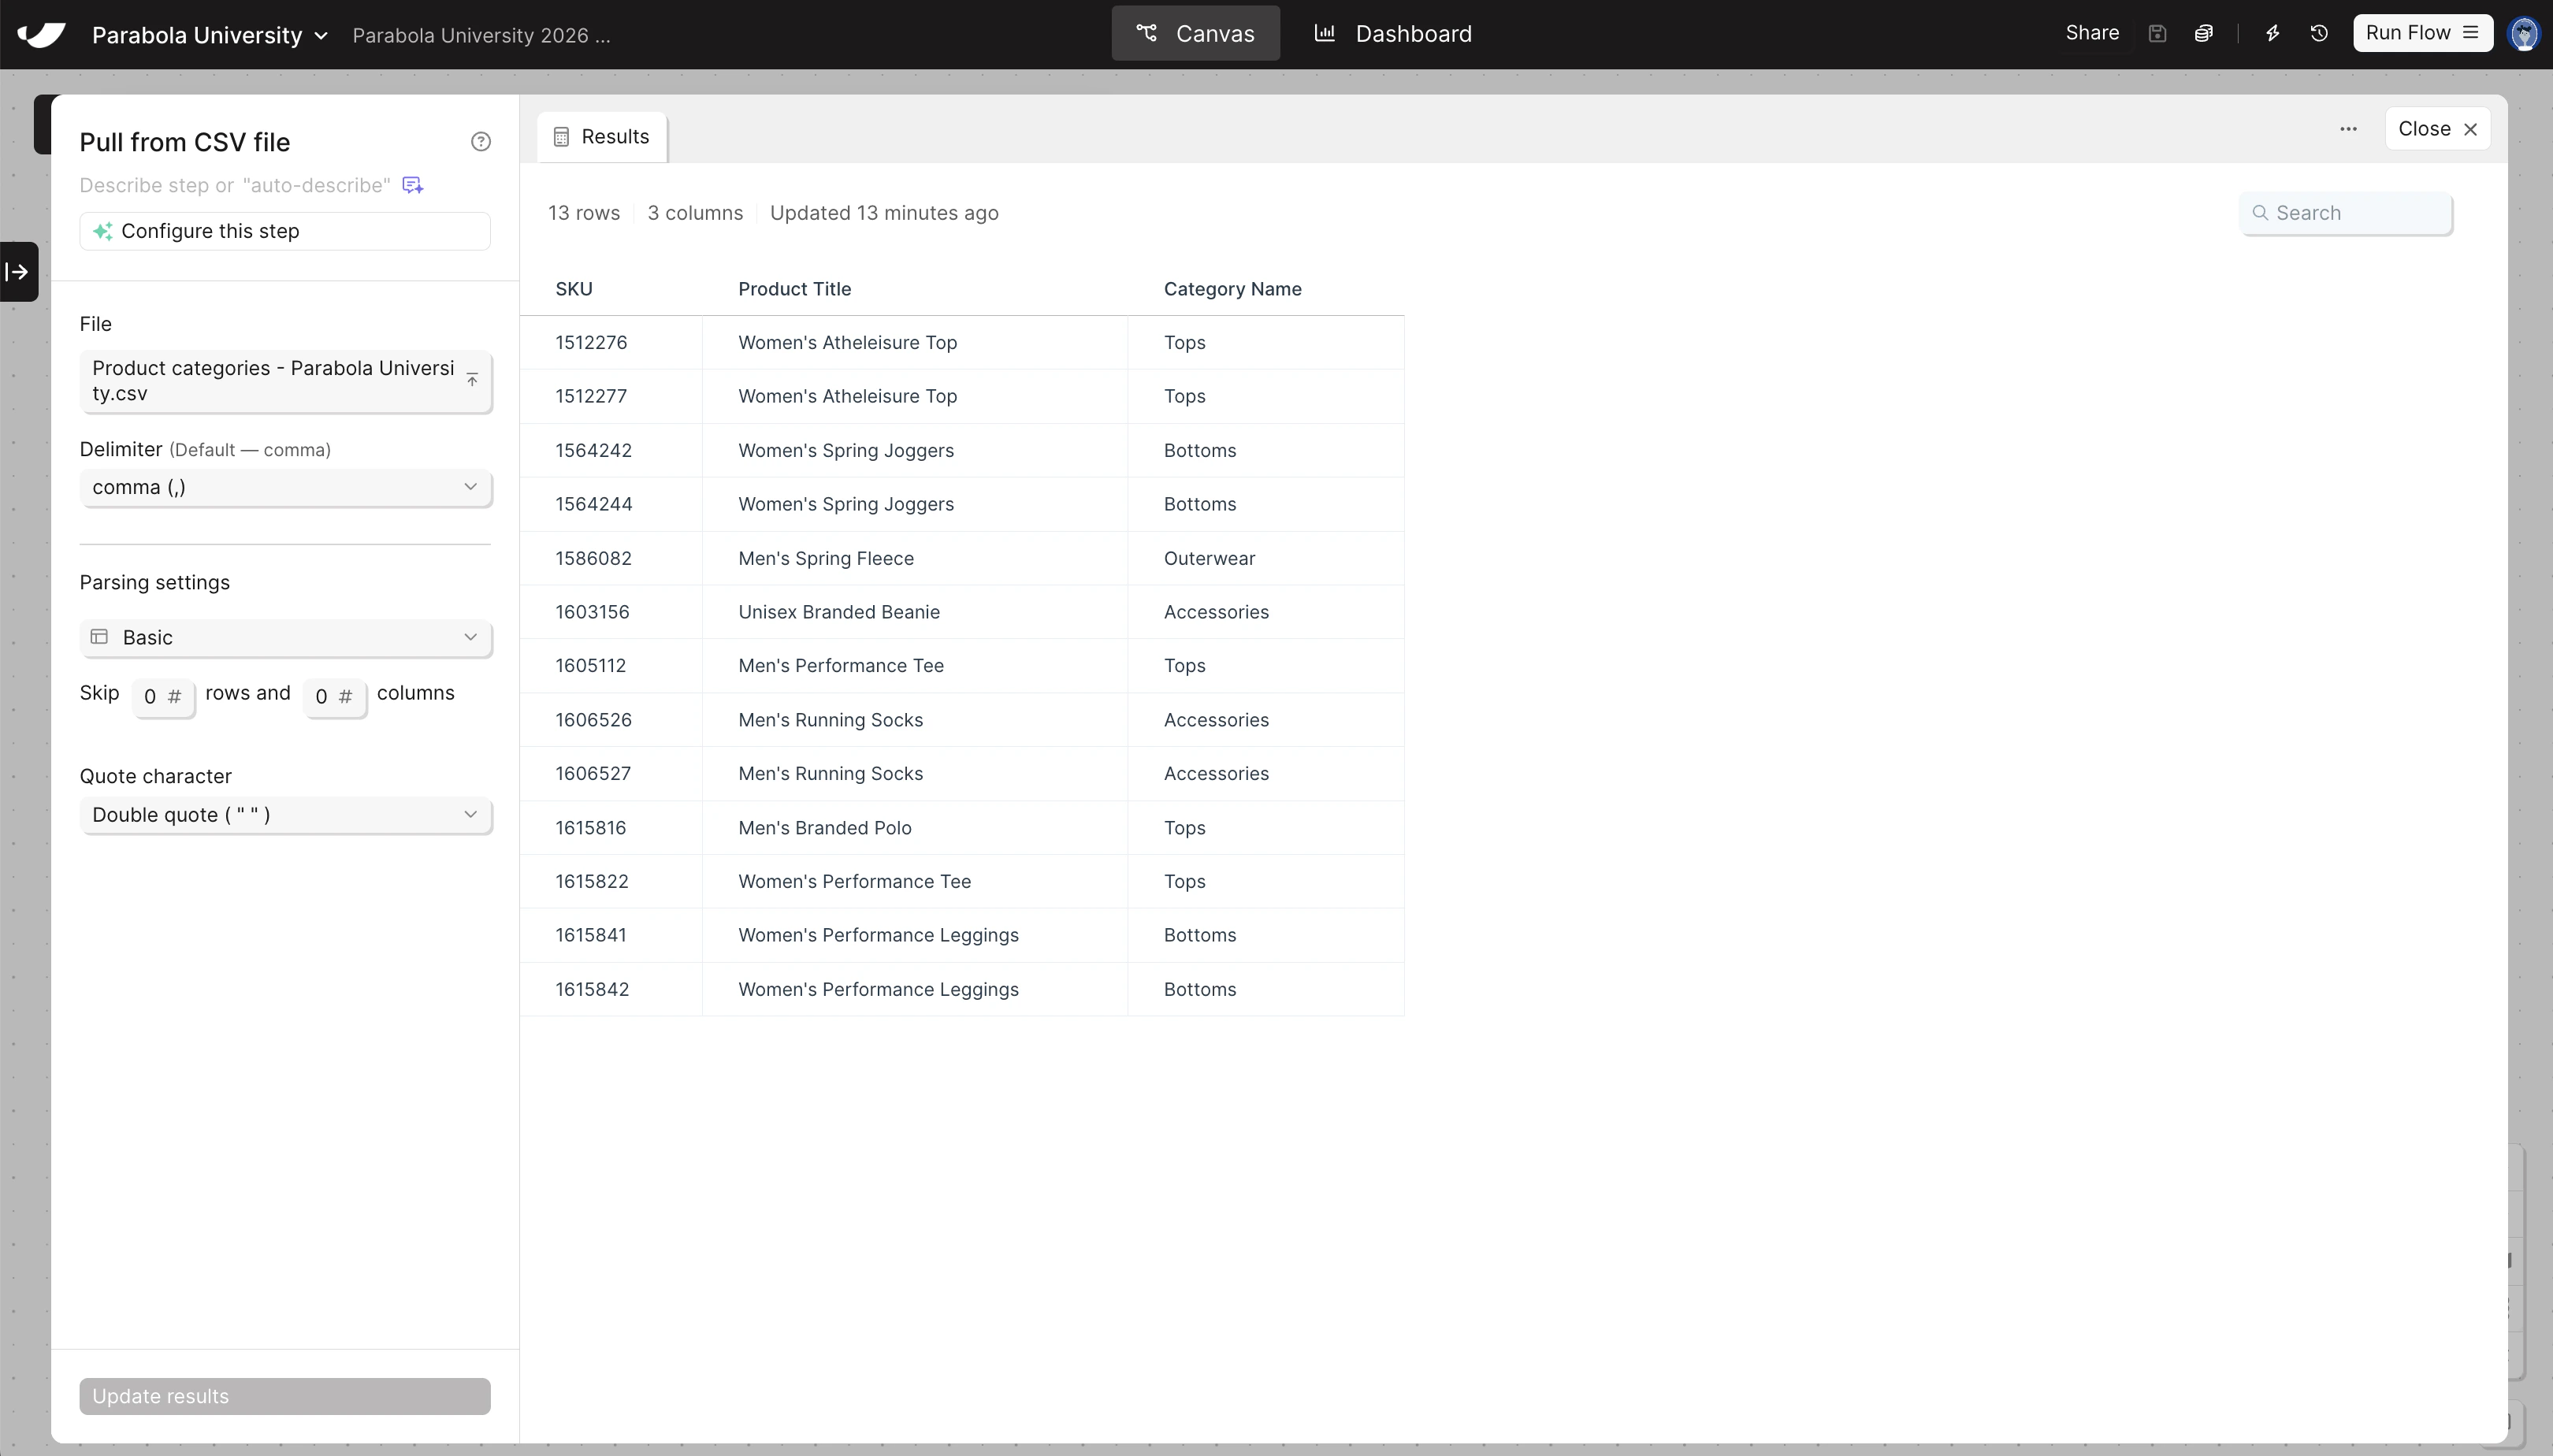
  Pull both of your sample data files into your flow — you'll need both to build the Sales by Category Report.

  <Warning>
    Need to create your flow and download your sample data files? Return to the [previous lesson](/parabola-university/101/general/3-fundamentals).
  </Warning>

  <Steps>
    <Step title="Drag and drop your sales data file directly onto the canvas">
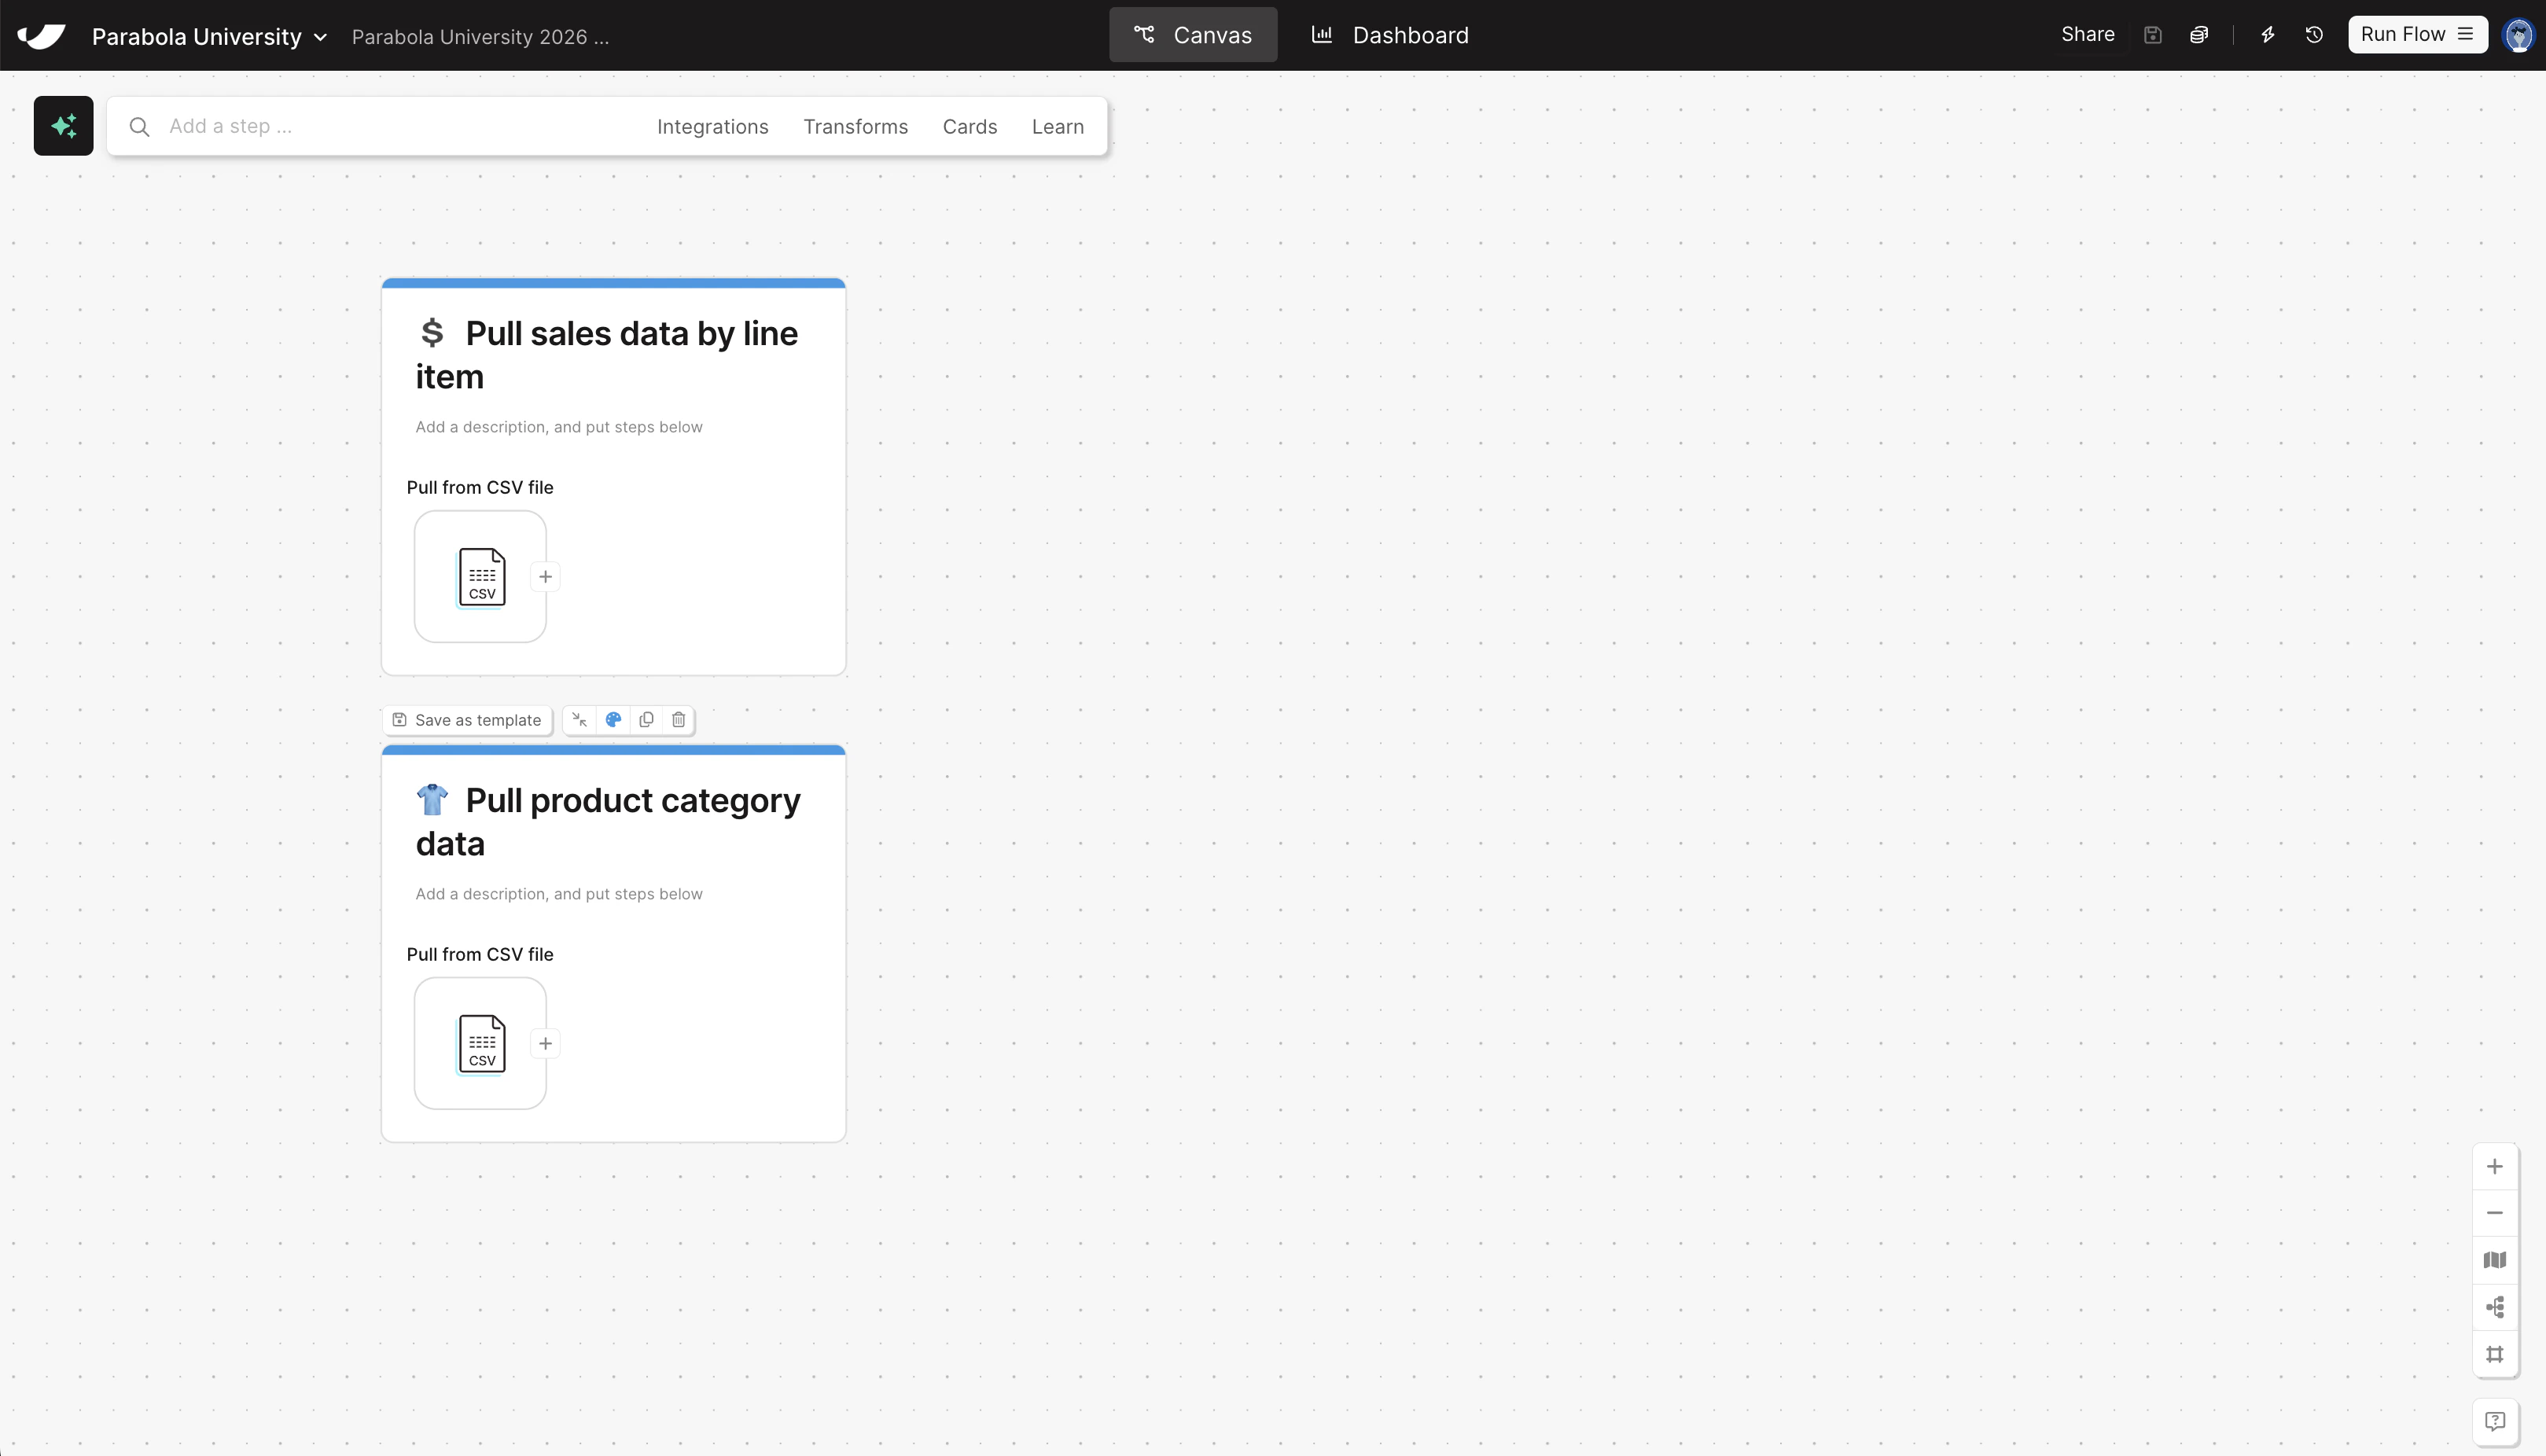
      This automatically creates a **Pull from CSV file** step and loads your data.
    </Step>

    <Step title="Search for Pull from CSV file and drag it onto the canvas, then upload your product categories file">
      Once the step is on the canvas, double-click to open the step, and then click "Upload a file" to pull in your data.
    </Step>

    <Step title="Put each step onto its own card to add documentation to your flow">
      You can add cards by right-clicking on the canvas, or by clicking **Cards** → **Add new card** in the search bar up top. Give your cards the following titles:

      * Pull sales data by line item
      * Pull product category data

      Optionally, add emojis and colors to your cards.
    </Step>
  </Steps>
</Card>

<Accordion title="Check your work">
  <Frame>
    <img src="https://mintcdn.com/parabola-7119dfb0/CAGXdc7-yLmtAwae/images/general-operators-pull-canvas.png?fit=max&auto=format&n=CAGXdc7-yLmtAwae&q=85&s=e623281ded6b486b2d06af9e45b7e01d" alt="Pull data canvas view" width="3238" height="1852" data-path="images/general-operators-pull-canvas.png" />

    <img src="https://mintcdn.com/parabola-7119dfb0/CAGXdc7-yLmtAwae/images/general-operators-pull-sales-data.png?fit=max&auto=format&n=CAGXdc7-yLmtAwae&q=85&s=9cc9d500247ceb34cbf6846375a1e2d3" alt="Pull sales data step" width="3236" height="1850" data-path="images/general-operators-pull-sales-data.png" />

    <img src="https://mintcdn.com/parabola-7119dfb0/CAGXdc7-yLmtAwae/images/general-operators-pull-categories.png?fit=max&auto=format&n=CAGXdc7-yLmtAwae&q=85&s=3f3acc6db5c51f837236c4669802d7cc" alt="Pull product categories step" width="3240" height="1848" data-path="images/general-operators-pull-categories.png" />
  </Frame>
</Accordion>
