> ## Documentation Index
> Fetch the complete documentation index at: https://parabola.io/docs/llms.txt
> Use this file to discover all available pages before exploring further.

# Operationalizing flows

<Frame>
  <iframe src="https://www.youtube.com/embed/QdHMD-VyrKg" title="Operationalizing flows" frameborder="0" allow="accelerometer; autoplay; clipboard-write; encrypted-media; gyroscope; picture-in-picture; web-share" referrerpolicy="strict-origin-when-cross-origin" allowfullscreen />
</Frame>

In this lesson, you'll learn how to truly finalize your flow so that it's easy to read, debug, share, and runs automatically.

***

<Card icon="sparkles" title="Building challenge">
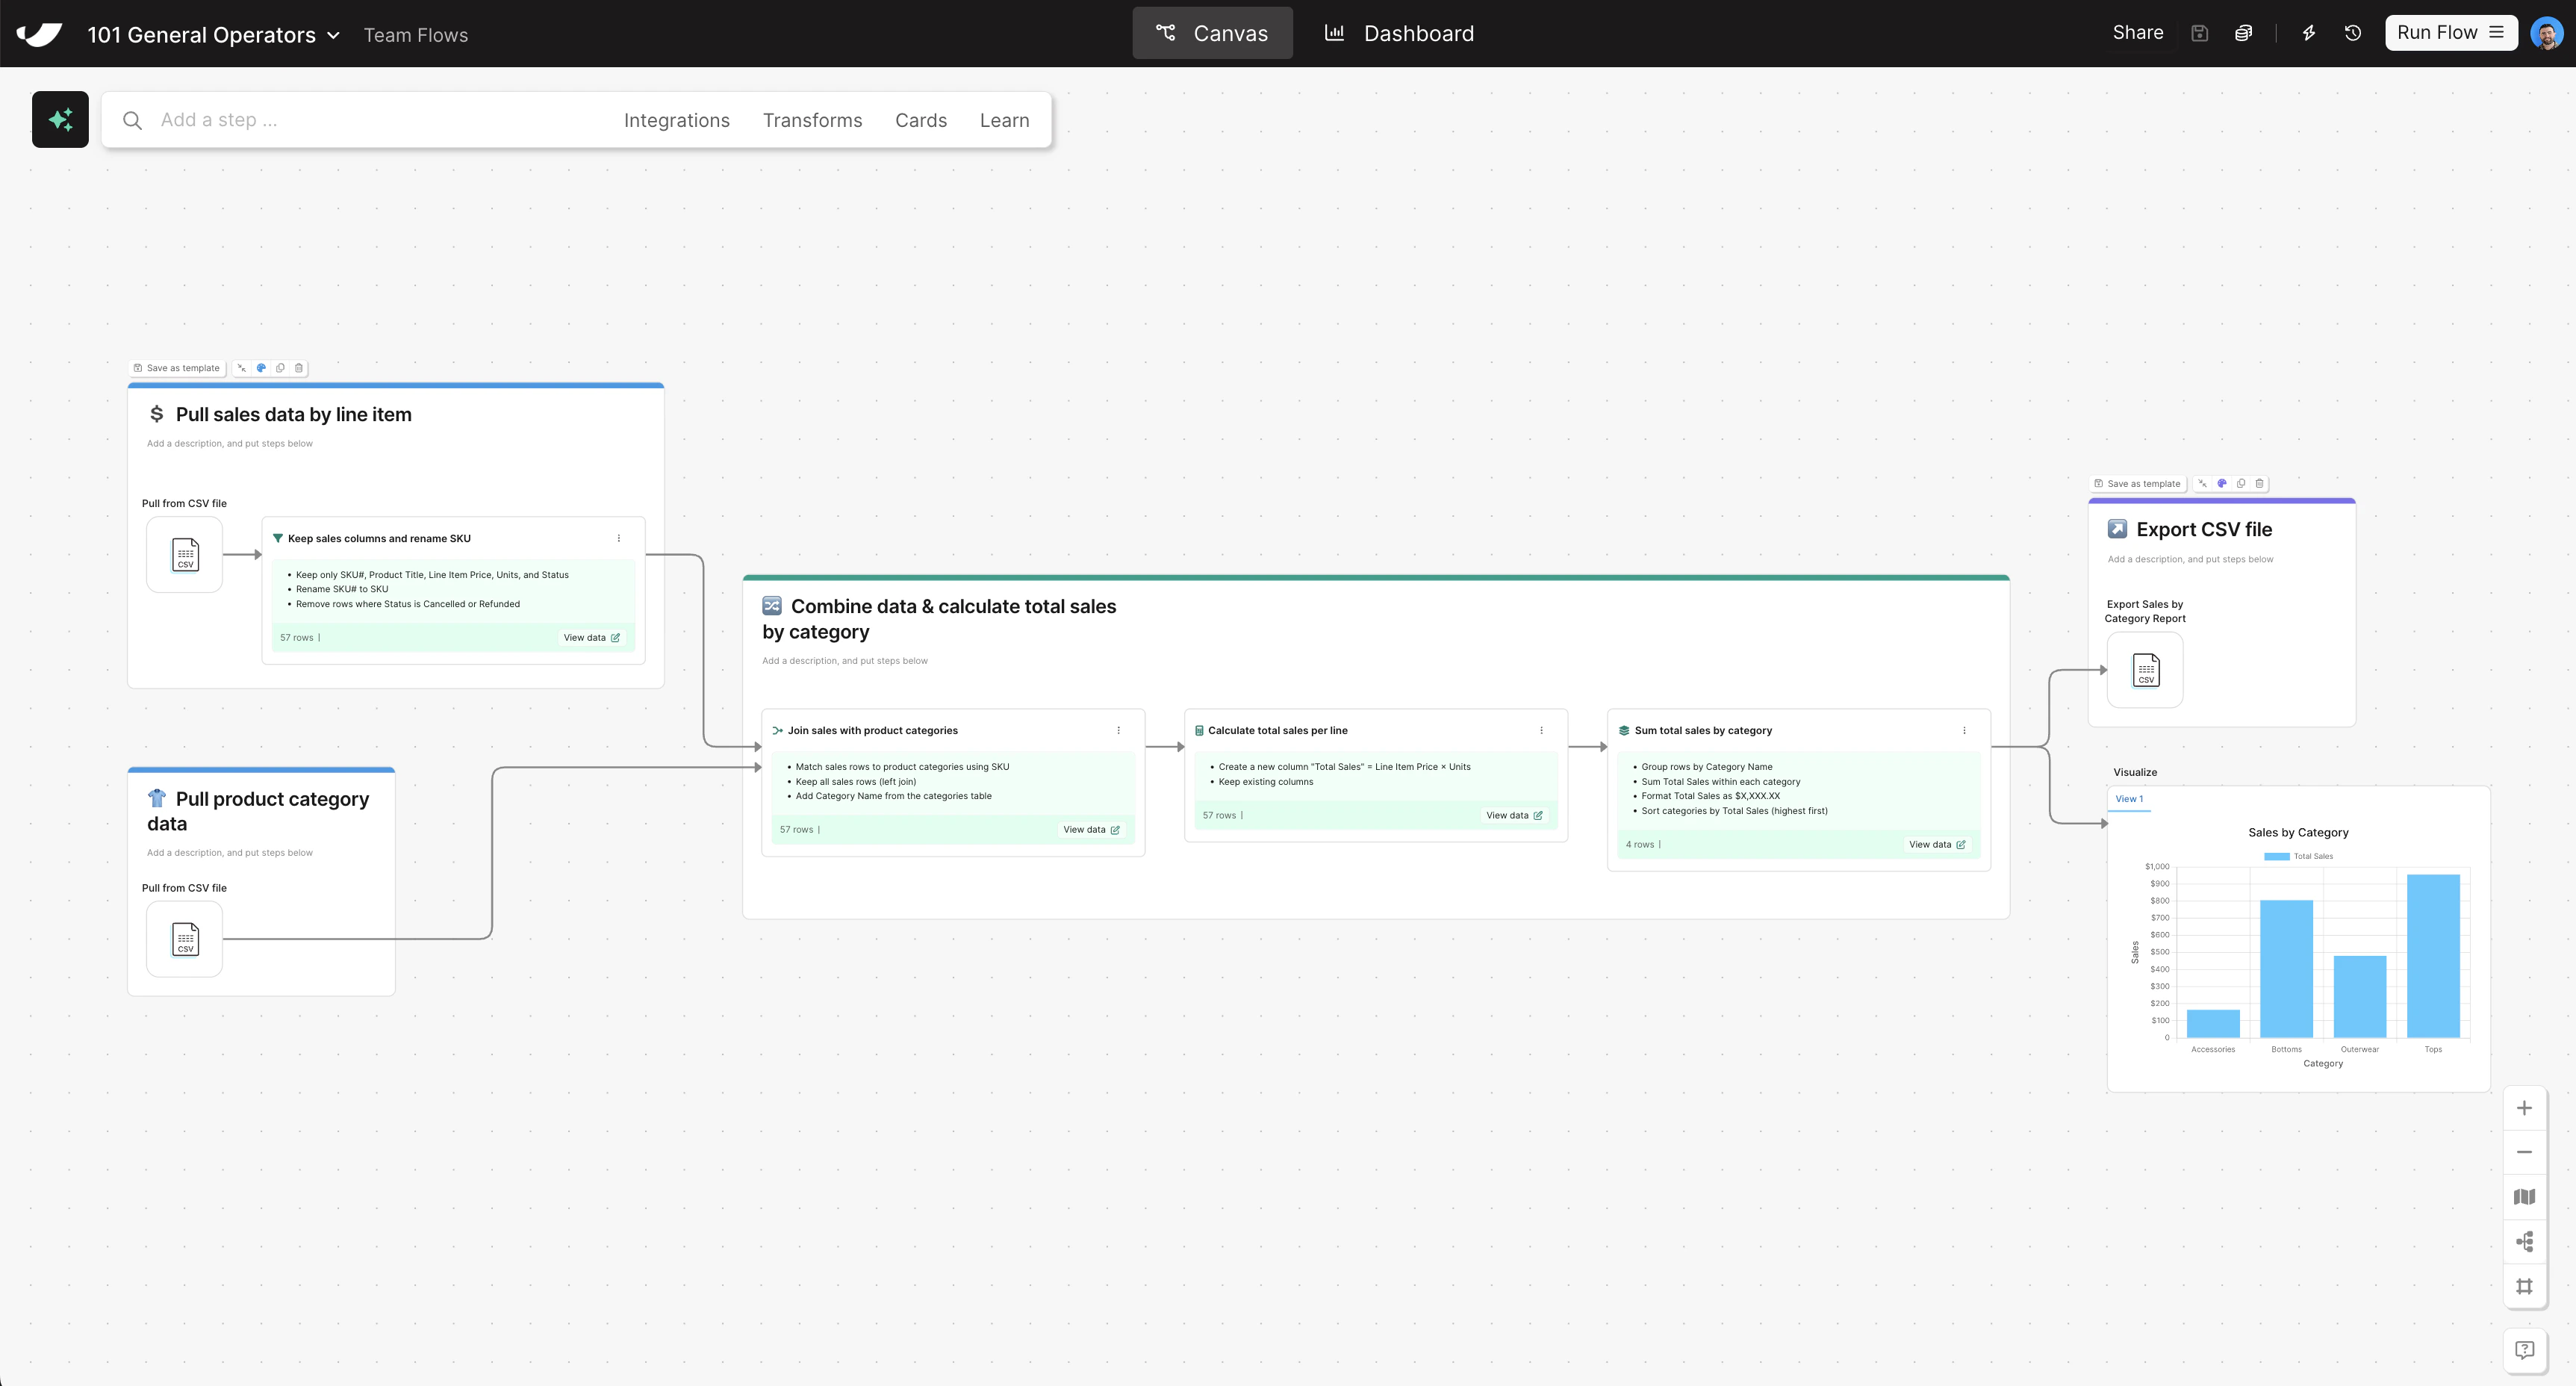
  Finish organizing your flow by grouping your remaining steps into cards so everything is clean and documented.

  <Steps>
    <Step title="Add all combining and transforming steps to one card titled Combine data and calculate total sales by category">
      * Pro tip: you can select multiple steps at once and right-click to automatically add multiple steps to a card at once
      * Optional: add an emoji and color to the card
    </Step>

    <Step title="Add your Generate CSV file step to a card titled Export CSV file">
      * Optional: add an emoji and color to the card

      Congratulations, you have now completed the building challenge for Parabola 101! Proceed to the next lesson to learn how to take what you've learned in this course and put it to action, and request your course certificate.
    </Step>
  </Steps>
</Card>

<Accordion title="Check your work">
  <Frame>
    <img src="https://mintcdn.com/parabola-7119dfb0/CAGXdc7-yLmtAwae/images/general-operators-operationalizing-canvas.png?fit=max&auto=format&n=CAGXdc7-yLmtAwae&q=85&s=fe2c56a717346ab01535b38436874dd1" alt="Operationalizing flows canvas view" width="3450" height="1856" data-path="images/general-operators-operationalizing-canvas.png" />
  </Frame>
</Accordion>
