> ## Documentation Index
> Fetch the complete documentation index at: https://parabola.io/docs/llms.txt
> Use this file to discover all available pages before exploring further.

# Cleaning data

<Frame>
  <iframe src="https://www.youtube.com/embed/wMlQY-vNWJI" title="Cleaning data" frameborder="0" allow="accelerometer; autoplay; clipboard-write; encrypted-media; gyroscope; picture-in-picture; web-share" referrerpolicy="strict-origin-when-cross-origin" allowfullscreen />
</Frame>

In this lesson, you'll learn the three main types of data cleanup — columns, rows, and values — and get prompting tips to get the best results when cleaning data in Parabola.

***

<Card icon="sparkles" title="Building challenge">
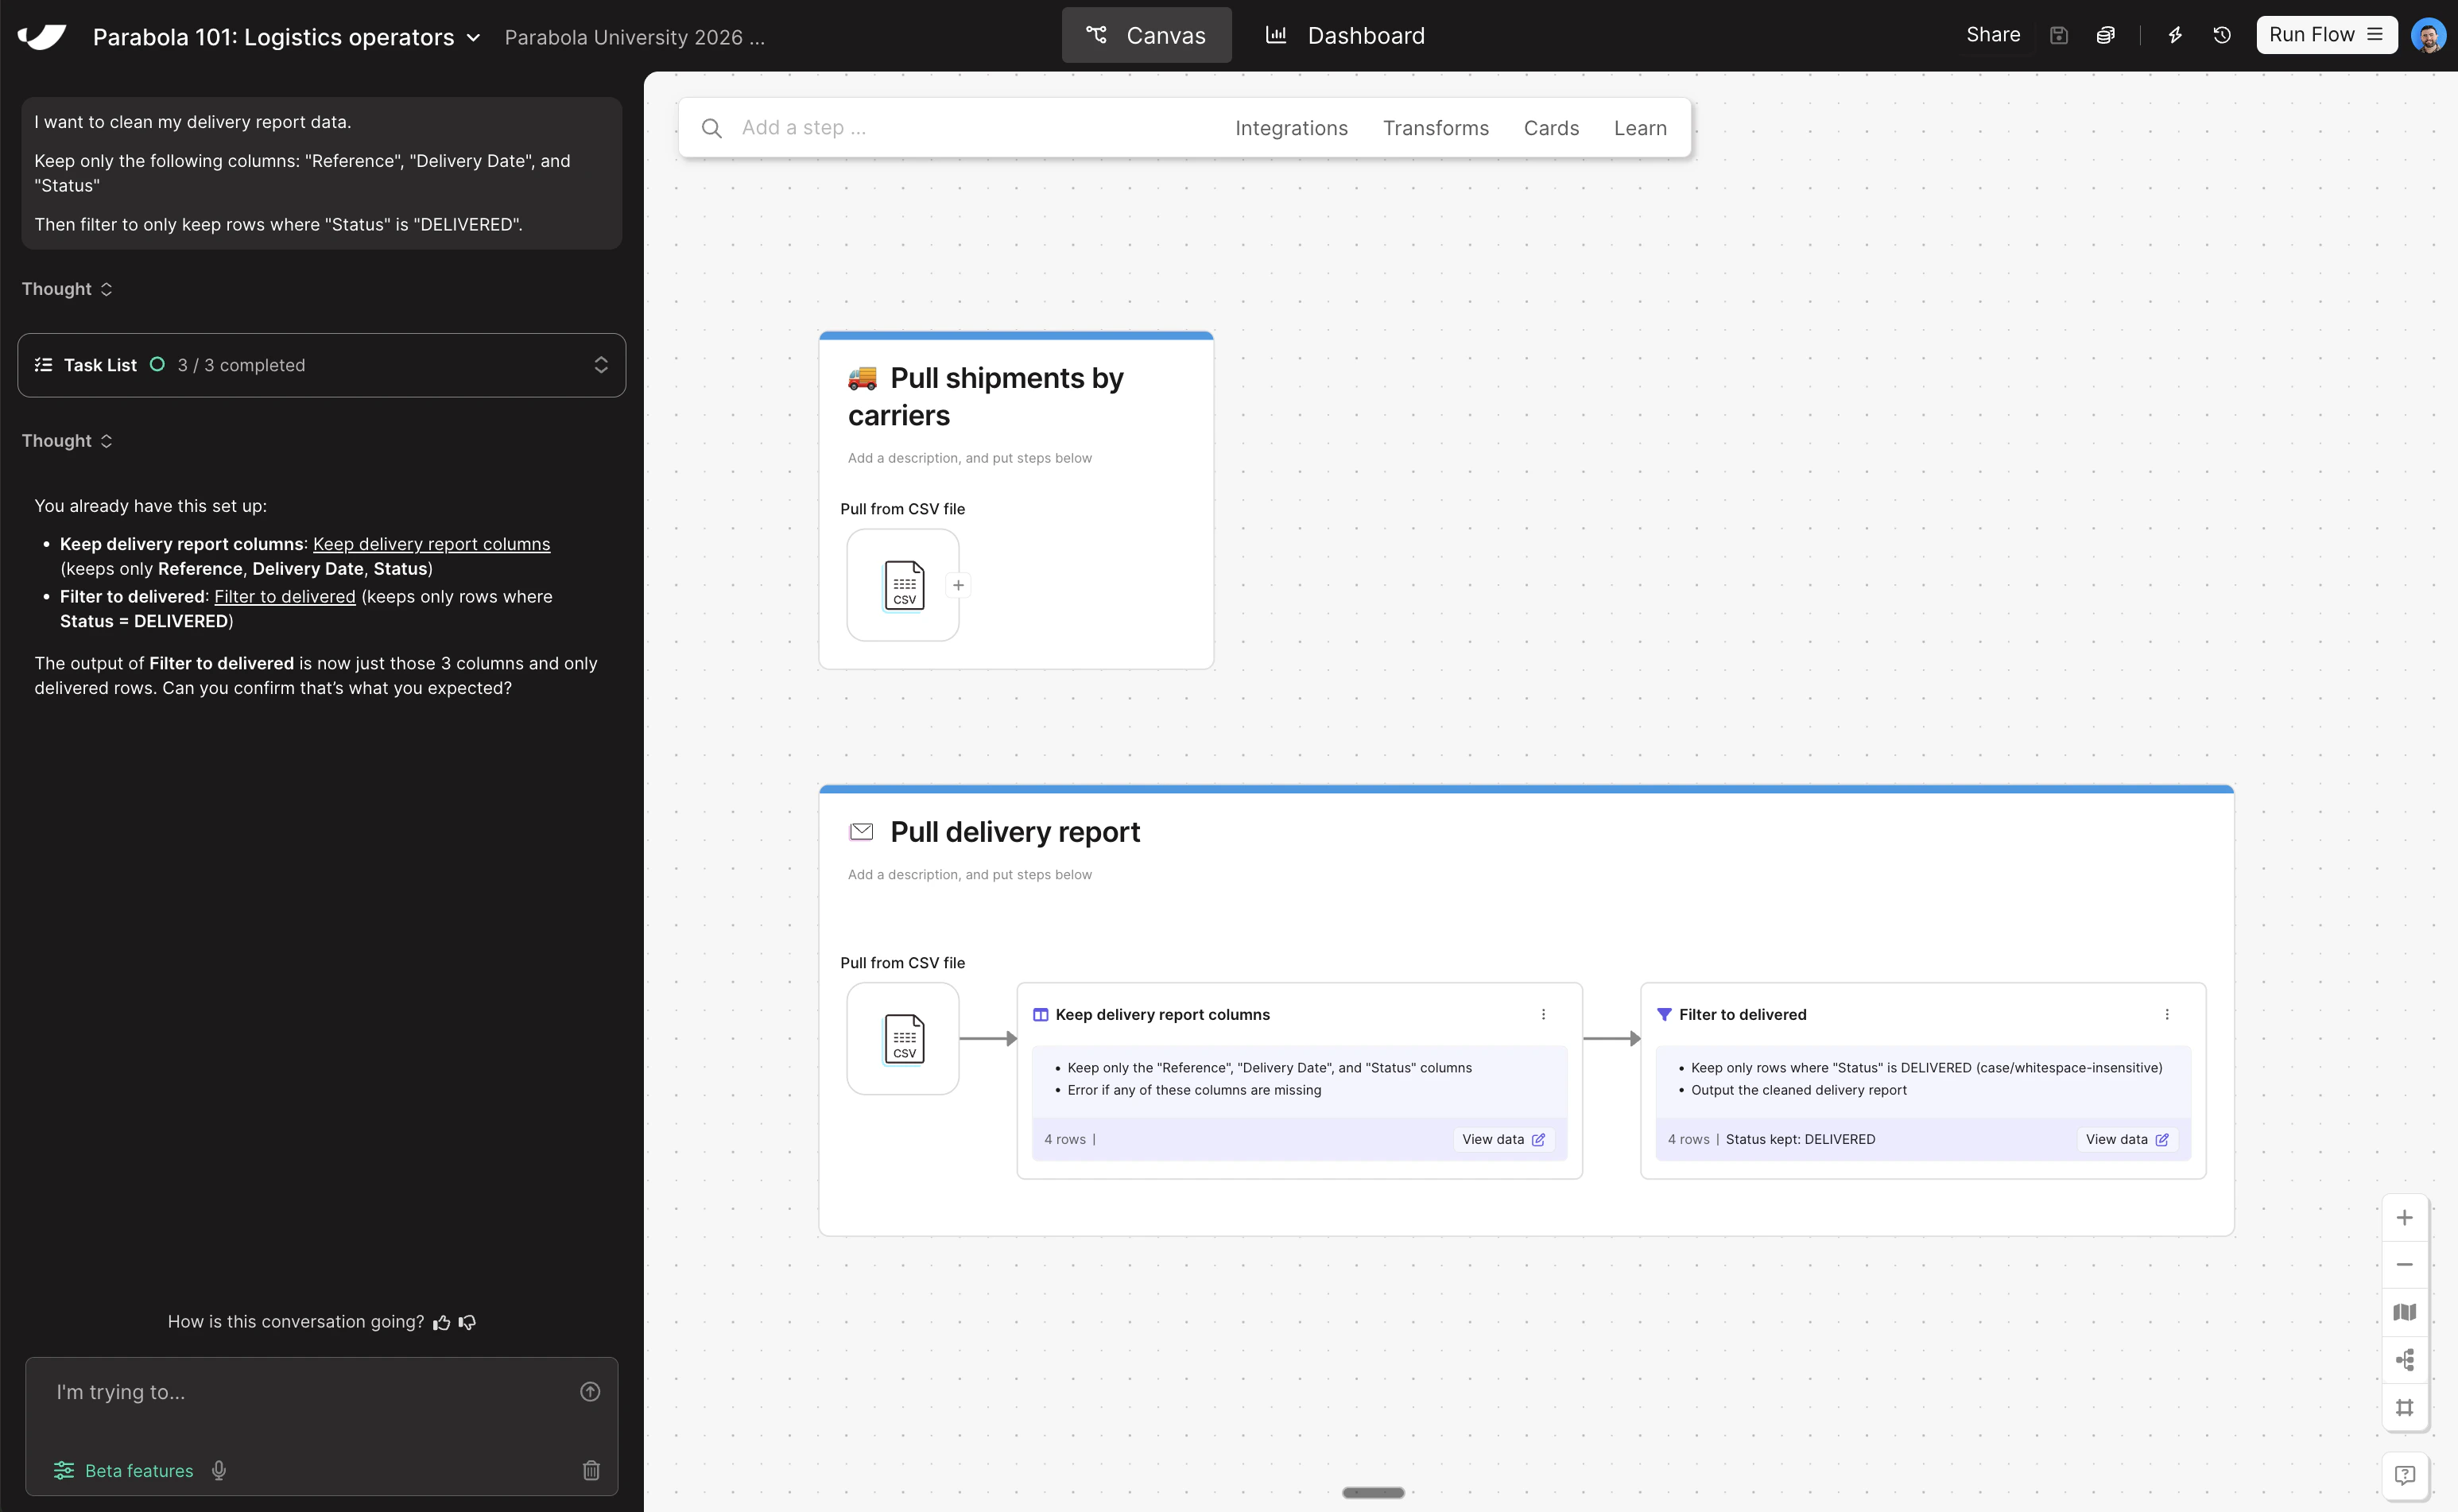
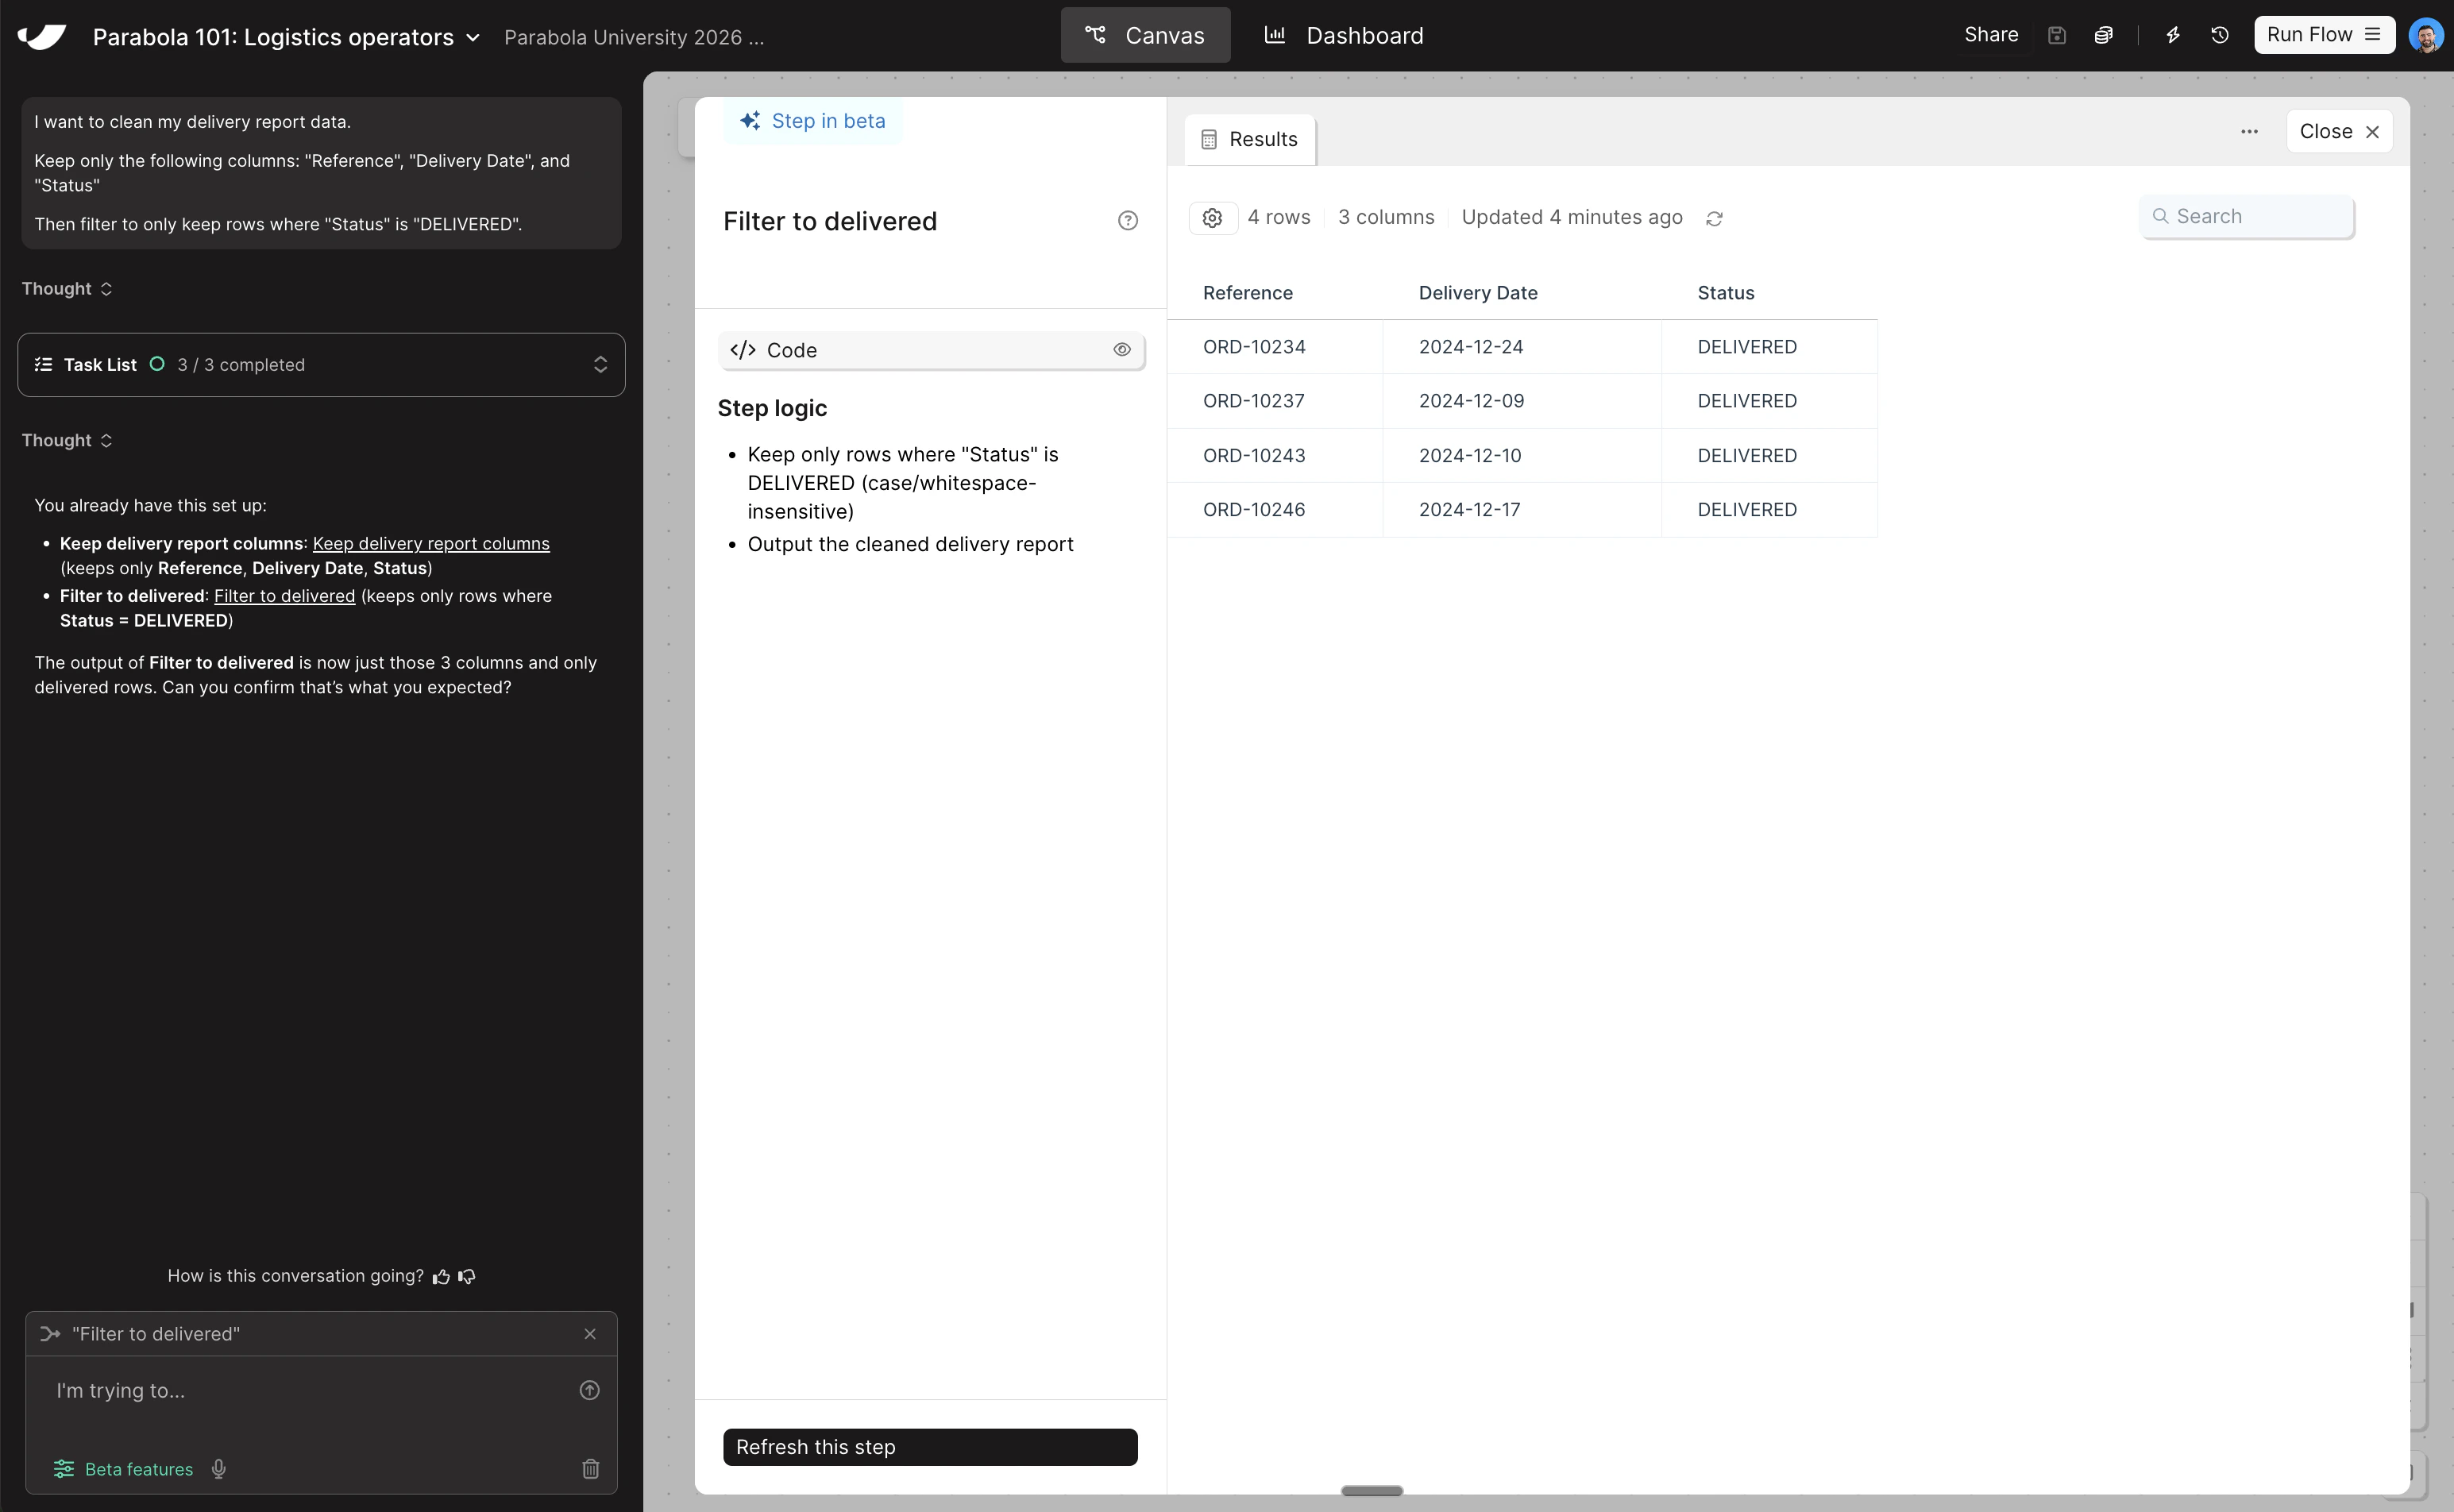
  Before combining your data sets, clean the delivery report so it only contains the columns you need. Copy and paste this prompt into Parabola:

  ```text wrap theme={null}
  I want to clean my delivery report data.

  Keep only the following columns: "Reference", "Delivery Date", and "Status"

  Then filter to only keep rows where "Status" is "DELIVERED".
  ```
</Card>

<Accordion title="Check your work">
  <Note>The steps added to your canvas and their exact documentation may differ from what you see below — every AI response is unique. The important thing is that your resulting data set matches what you see here.</Note>

  <Frame>
    <img src="https://mintcdn.com/parabola-7119dfb0/4oJXhMkpxpea7fKi/images/freight-logistics-clean-canvas.png?fit=max&auto=format&n=4oJXhMkpxpea7fKi&q=85&s=33a603979358c99a522c0b05cf29d31b" alt="Clean data canvas view" width="3092" height="1902" data-path="images/freight-logistics-clean-canvas.png" />

    <img src="https://mintcdn.com/parabola-7119dfb0/4oJXhMkpxpea7fKi/images/freight-logistics-clean-data.png?fit=max&auto=format&n=4oJXhMkpxpea7fKi&q=85&s=57acd4000488fe94f8080370d82abcea" alt="Clean data step results" width="3090" height="1904" data-path="images/freight-logistics-clean-data.png" />
  </Frame>
</Accordion>