> ## Documentation Index
> Fetch the complete documentation index at: https://parabola.io/docs/llms.txt
> Use this file to discover all available pages before exploring further.
# Average by group
The **Average by group** step calculates the average of all values in one or more columns. This step is similar to the AVERAGEIF function in Excel.
## Input/output
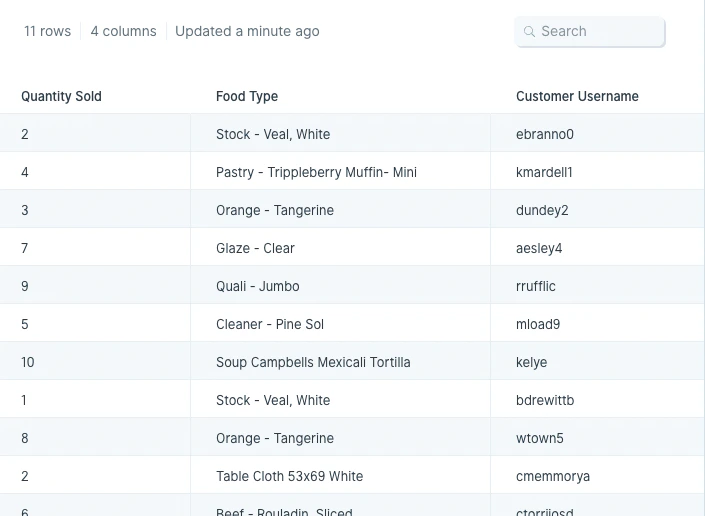
Our input data has 11 rows of order information showing how much of a particular food item was sold to a given customer.
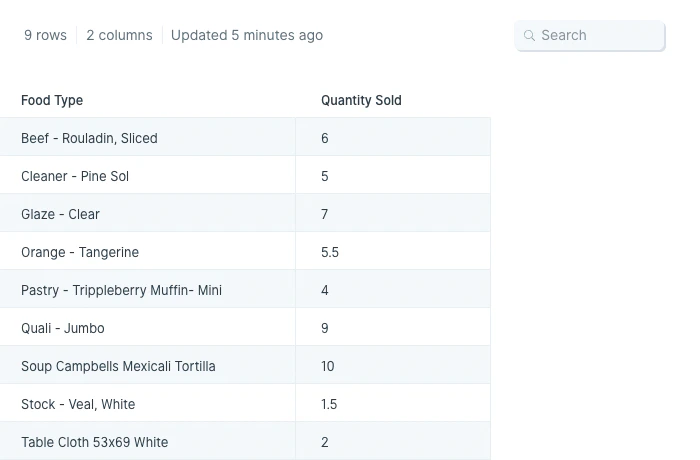
 After we run our dataset through the **Average by group** step, we find the average number of each food item sold per order.
 ## Default settings
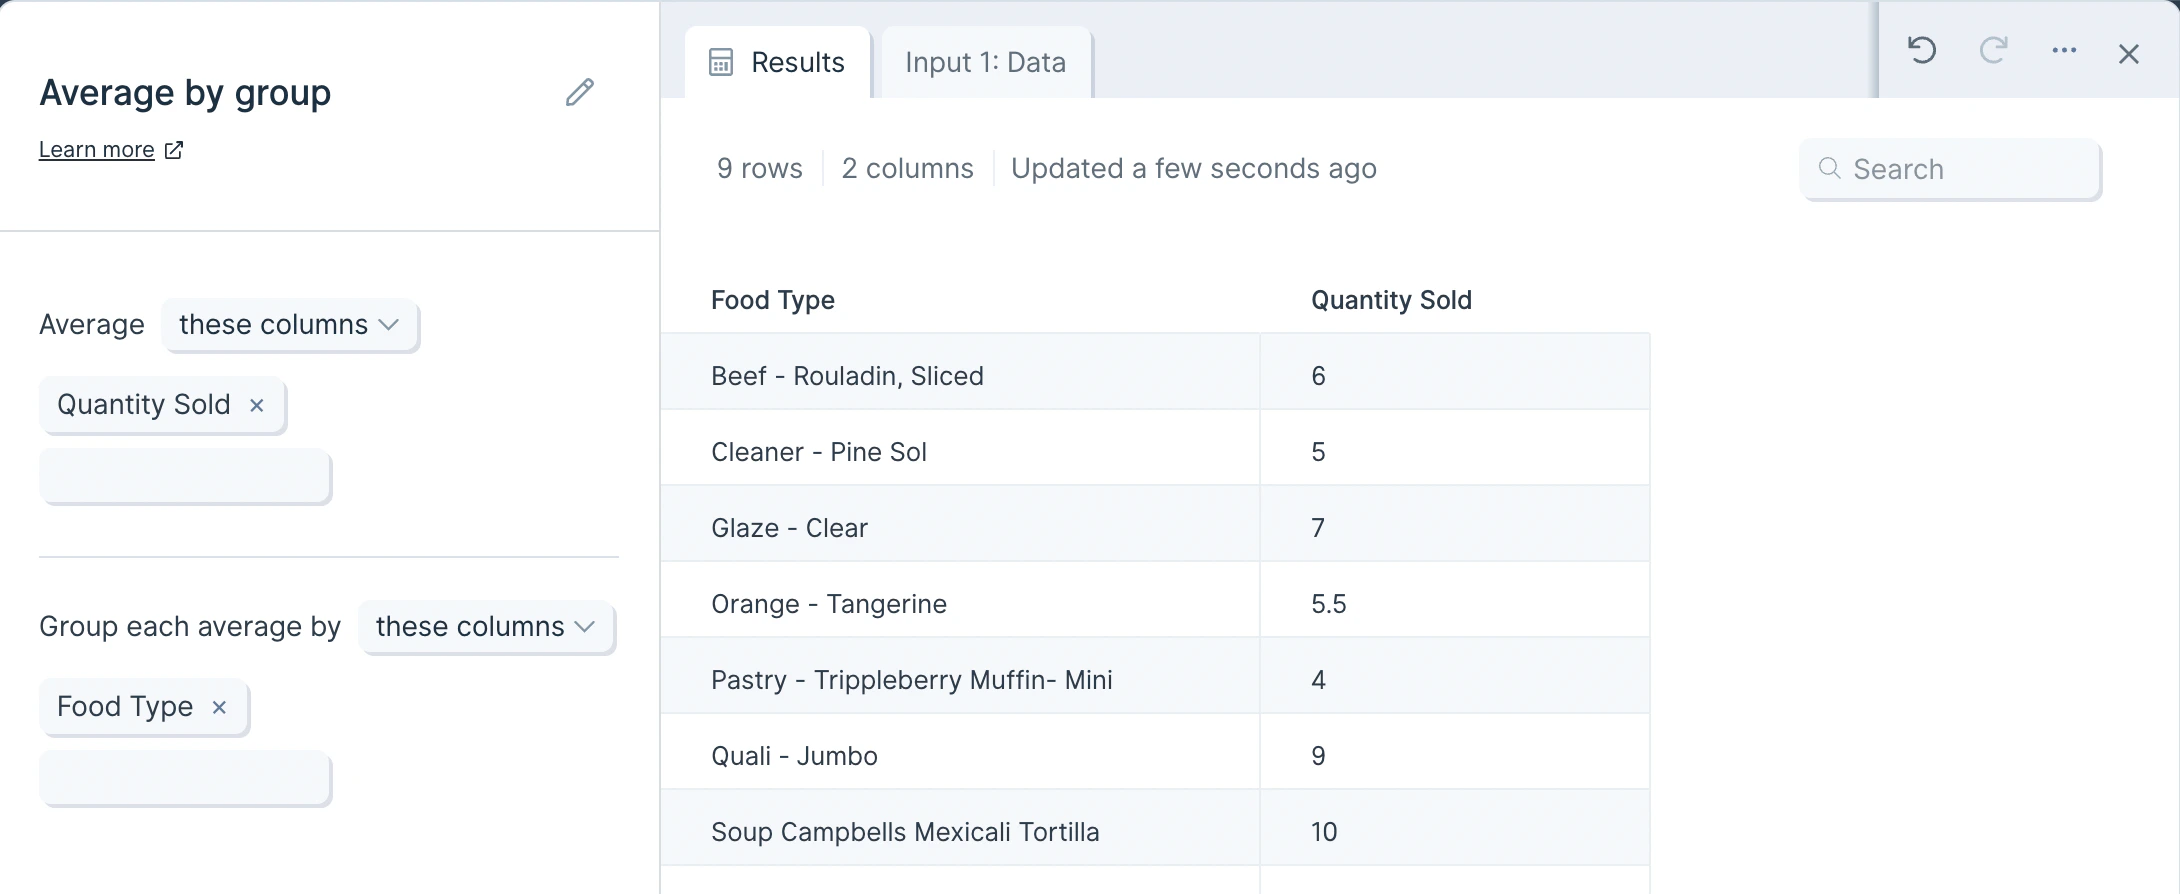
When a data source is first connected, this step will auto-select a numeric column (like 'Quantity Sold') and a data-type column to take a first pass at averaging by group.
## Default settings
When a data source is first connected, this step will auto-select a numeric column (like 'Quantity Sold') and a data-type column to take a first pass at averaging by group.
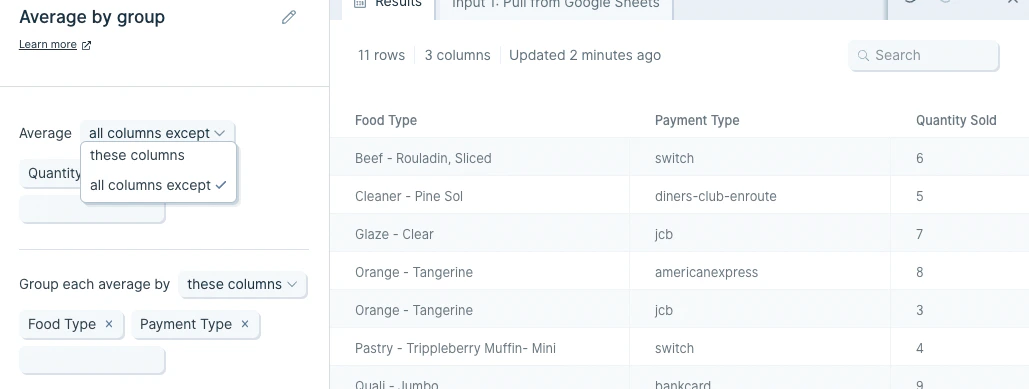
 ## Custom settings
You may choose any column to average, and group the average according to any one column, or multiple columns, in your data set.
## Custom settings
You may choose any column to average, and group the average according to any one column, or multiple columns, in your data set.
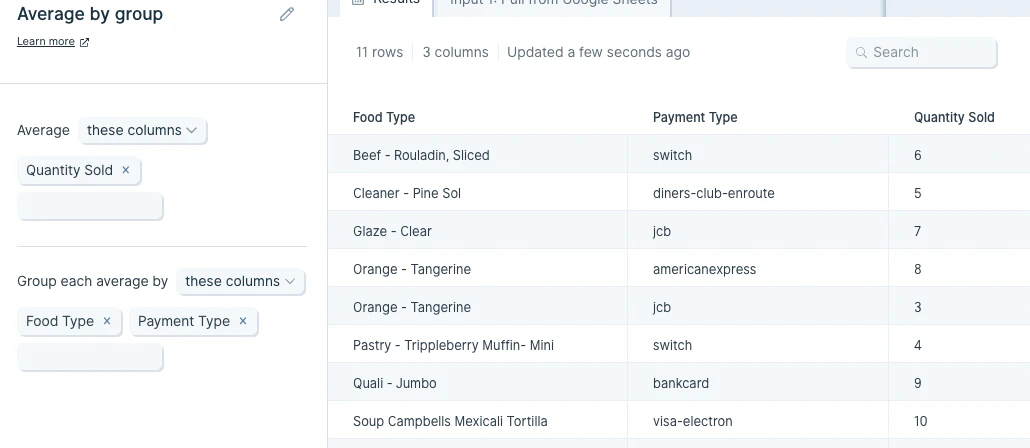 You can optionally apply this to only the selected columns or apply to 'all columns except'. We'd recommend using the option that requires fewer column selections to save yourself time.
 ## Related steps
* [Sum by group](/product/transform/sum-by-group)
* [Count by group](/product/transform/count-by-group)
* [Find maximum by group](/product/transform/find-maximum-by-group)
* [Find minimum by group](/product/transform/find-minimum-by-group)
* [Merge duplicate rows](/product/transform/merge-duplicate-rows)
## Related steps
* [Sum by group](/product/transform/sum-by-group)
* [Count by group](/product/transform/count-by-group)
* [Find maximum by group](/product/transform/find-maximum-by-group)
* [Find minimum by group](/product/transform/find-minimum-by-group)
* [Merge duplicate rows](/product/transform/merge-duplicate-rows)