> ## Documentation Index
> Fetch the complete documentation index at: https://parabola.io/docs/llms.txt
> Use this file to discover all available pages before exploring further.
# Combine Tables
> Join data from multiple sources. Match rows by key columns, merge datasets, and handle mismatches.
The principle is simple: if we have two tables of data that are related to each other, we can use the **Combine Tables** step to join them into one table by matching rows between those tables.
This step can handle combining two tables at a time. Once we set it up, we can use it repeatedly. Even if the quantity of rows changes, our step will continue working.
Check out the [Parabola University](https://parabola.io/resources/parabola-university) video below to learn more about the **Combine Tables** step.
## Input/output
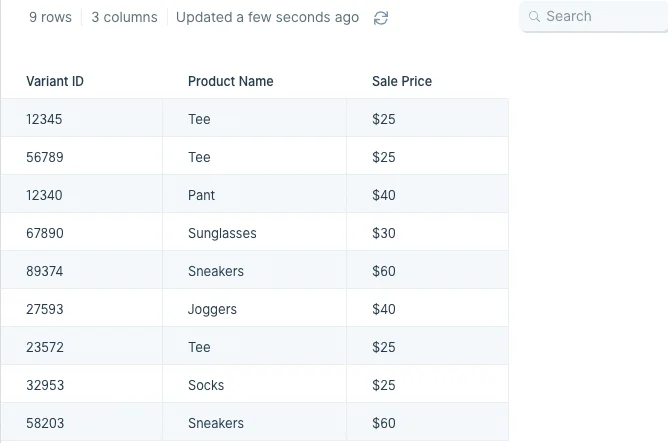
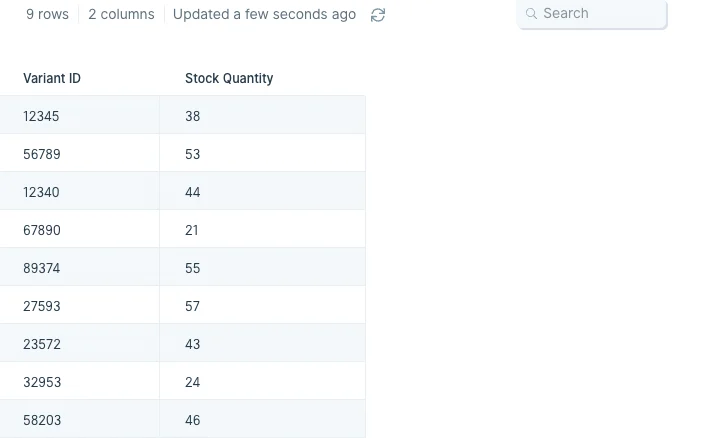
The **Combine Tables** step requires two data inputs to combine. In our example below, we have two tables feeding into it. The first one is a table with columns labeled 'Variant ID', 'Product Name', 'Variant Name', and 'Sale Price'. The second one is a table with headers 'Variant ID' and 'Stock Quantity'.
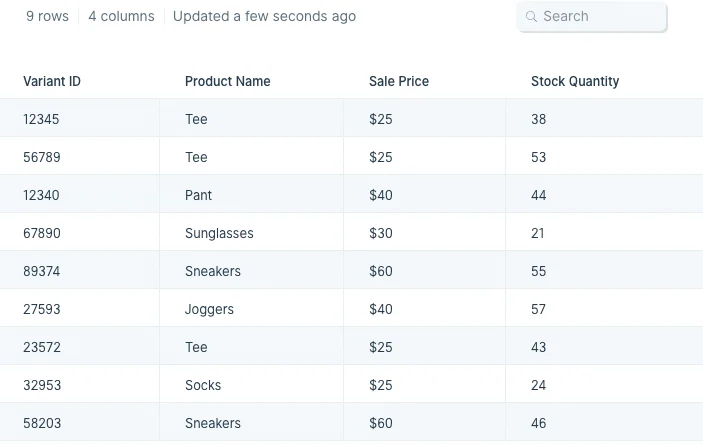
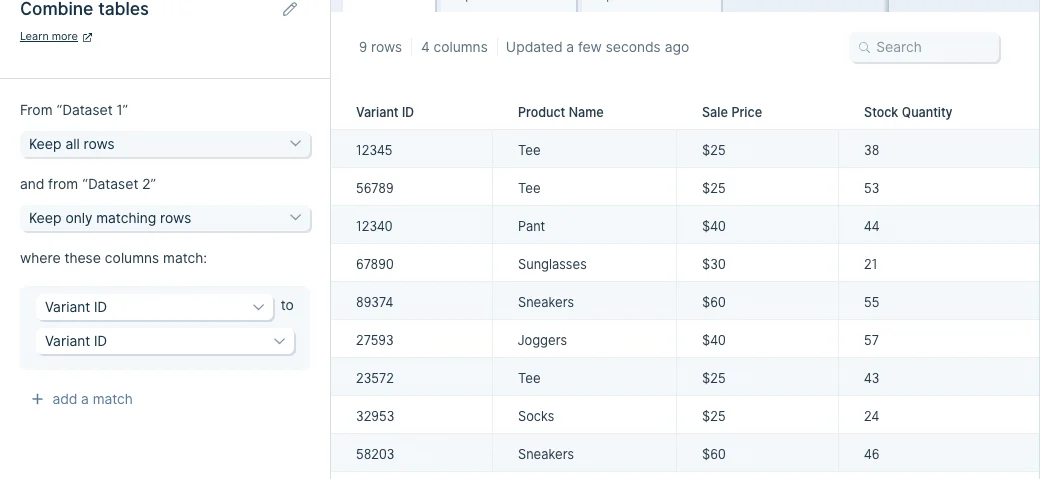
After using the **Combine Tables** step, our output data (shown below) has combined the 'Stock Quantity' column from the second table to the first table using 'Variant ID' as the matching identifier.
## Custom settings
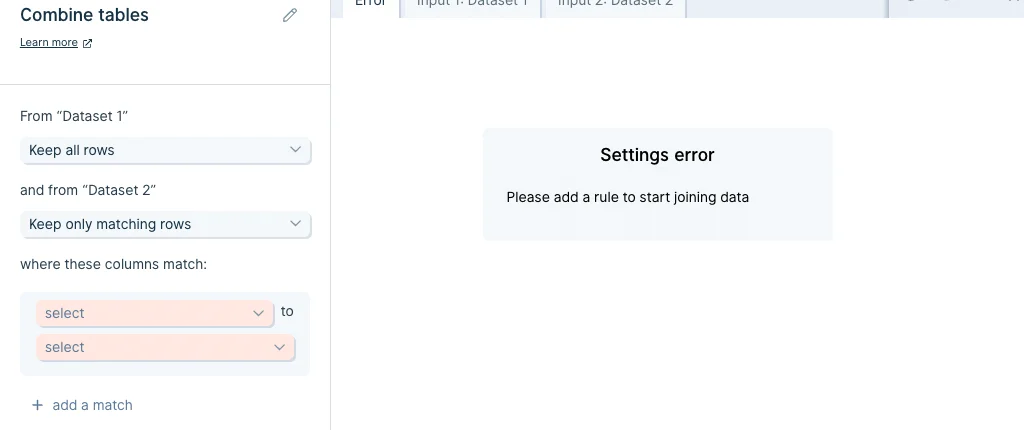
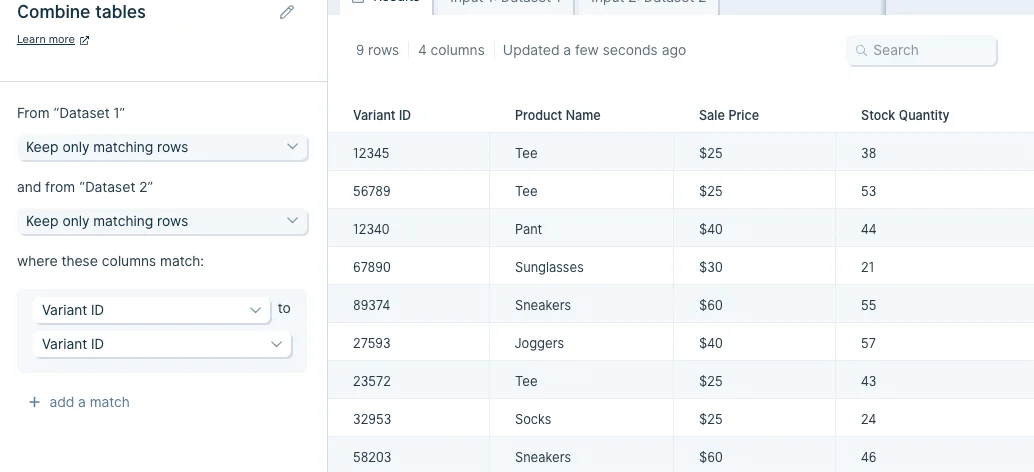
After connecting two datasets into this step, in the left-side toolbar choose whether you will 'Keep all rows' or 'Keep only matching rows' for your data sources using the drop down menus.
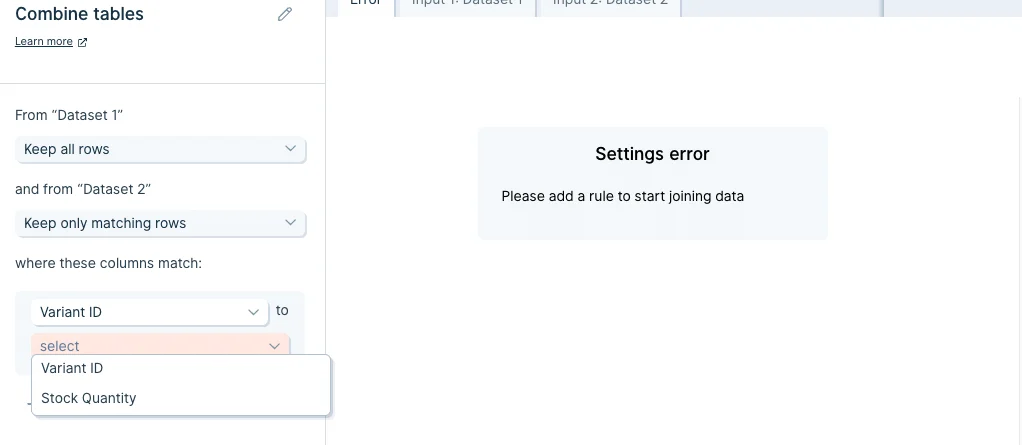
Then in the next set of options, click 'select' to access the dropdown menu of columns and select which ones to join the tables by. The column you choose should be present in both datasets, have identical values, and be used as the unique identifier between them.
Once you're done, click 'Show Updated Results' to save and display the newly-combined tables.
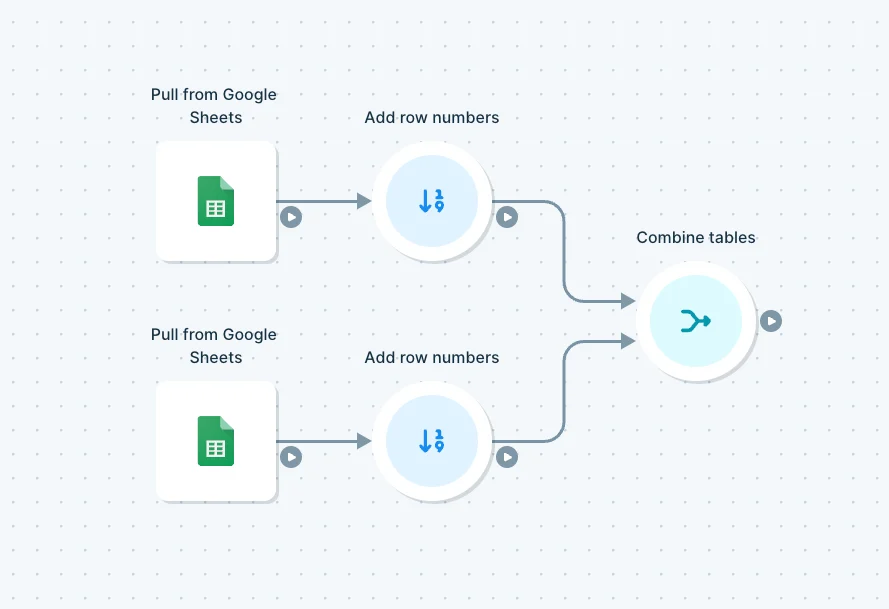
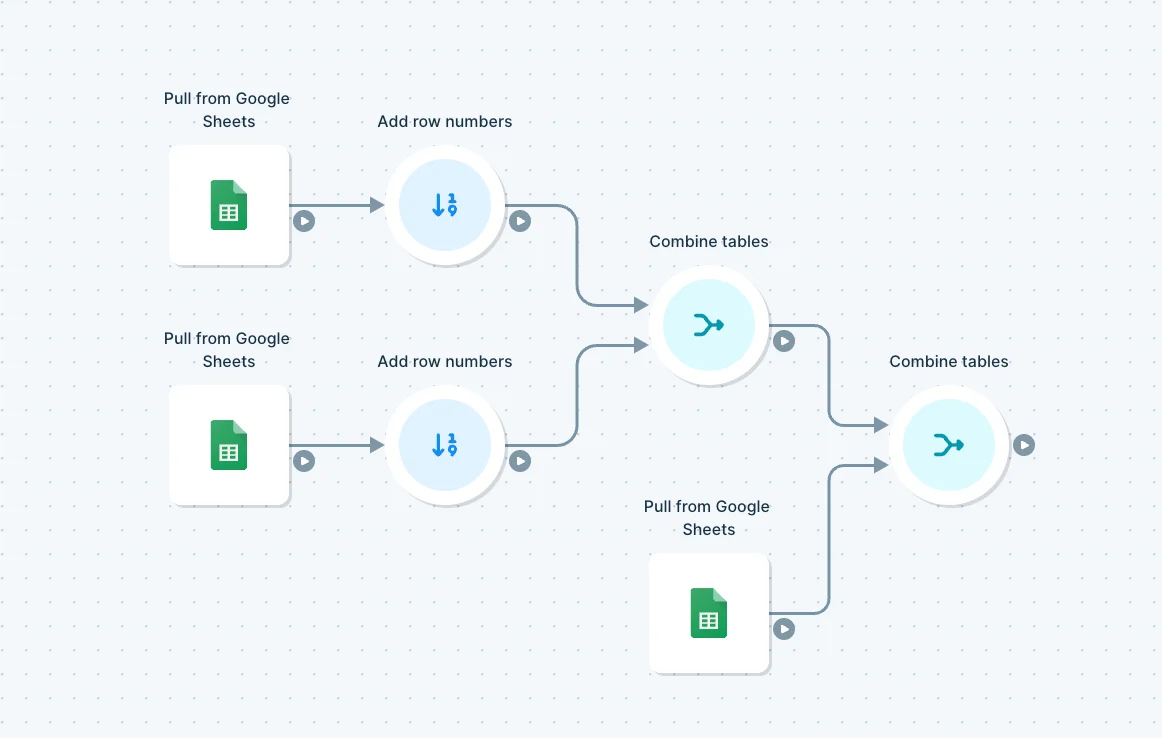
If the datasets you want to combine don't have a shared column of identical values, then you can use [Insert row numbers](/product/transform/insert-row-numbers) to make one in each table. You'd do this by connecting your import datasets to an **Insert row numbers** step to generate matching columns with incrementally-increasing numbers.
## Other ways to combine tables:
Now we've learned one example using our default settings. Let's explore the other ways that we can combine tables in Parabola. We can switch our **Combine tables** step to keep all rows that have matches in all tables. The resulting table will only contain rows that exist in every table we are combining.
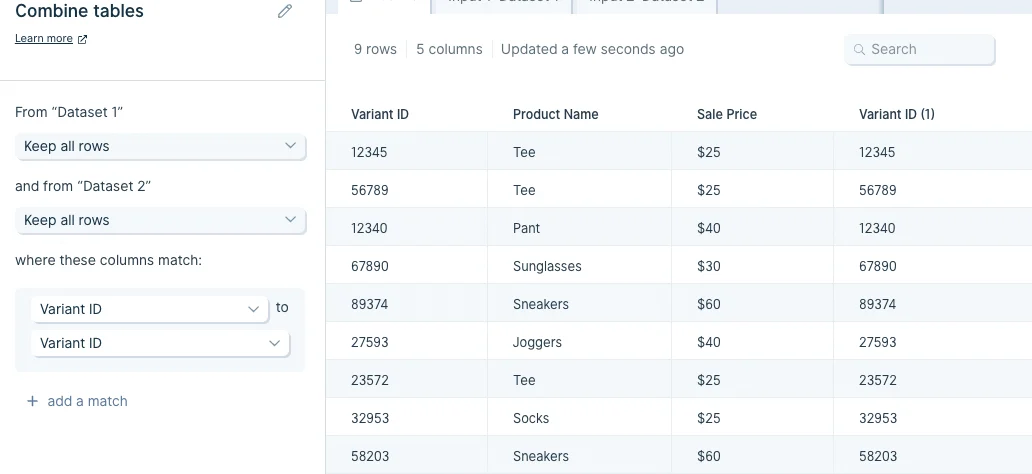
The last option is to keep all rows in all tables. This will create a resulting table that has every row from every table present. If no match was found for a specific row, it will still exist. This option has a tendency to create a lot of blank cells, and can be tricky to use properly.
## Helpful tips
* The default setting for the **Combine Tables** step is the most common way to combine tables. It keeps the entire primary table and finds matches in the other tables, fitting them in to their matched rows as we go. If a row doesn't have a match in the primary table, it won't show up in the results.
* Fuzzy match is not supported. [Find Overlap](/product/transform/find-overlap) is a better option, which supports fuzzy comparison
* To combine three or more tables together, chain together multiple **Combine Tables** steps to merge your data.
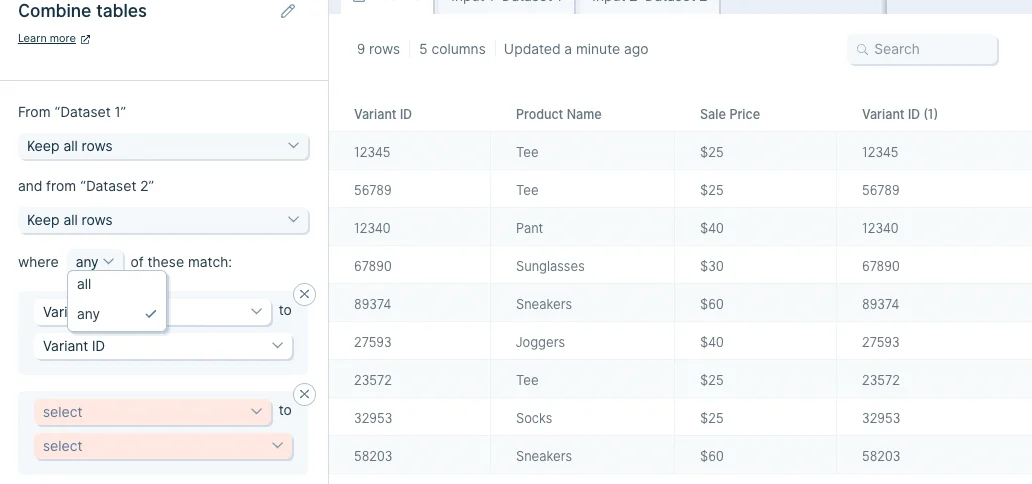
* If we need multiple rules to determine a match, the default setting will find a match where any rules apply. We can change this so that rows match only when all of the rules apply.
## Troubleshooting tips
Here are a few common questions that come up around the **Combine tables** steps and ways to troubleshoot them:
**Issue**: I'm seeing my rows multiplied in the results section of the **Combine tables** step.
**Solution:** It's possible that you are matching on data that shows up multiple times in one or both of your sources. Check your inputs to make sure the selected matching columns have unique data in both inputs. If you don't have a column with unique data, you may need to choose multiple columns to match on to make sure you're not duplicating your rows.
**Issue:** I'm seeing a 'Missing columns' error in the **Combine tables** step.
**Solution:** This can happen when you remove or rename columns in your inputs, after you've already keyed to those columns in your **Combine tables** step. You'll need to either reselect your matching columns in the step or pull in a new **Combine tables** step.
## Related steps
* [Find overlap](/product/transform/find-overlap)
* [Stack tables](/product/transform/stack-tables)
* [Look up rows](/product/transform/look-up-rows)
* [Merge duplicate rows](/product/transform/merge-duplicate-rows)
* [Insert row numbers](/product/transform/insert-row-numbers)
 This step can handle combining two tables at a time. Once we set it up, we can use it repeatedly. Even if the quantity of rows changes, our step will continue working.
Check out the [Parabola University](https://parabola.io/resources/parabola-university) video below to learn more about the **Combine Tables** step.
## Input/output
The **Combine Tables** step requires two data inputs to combine. In our example below, we have two tables feeding into it. The first one is a table with columns labeled 'Variant ID', 'Product Name', 'Variant Name', and 'Sale Price'. The second one is a table with headers 'Variant ID' and 'Stock Quantity'.
This step can handle combining two tables at a time. Once we set it up, we can use it repeatedly. Even if the quantity of rows changes, our step will continue working.
Check out the [Parabola University](https://parabola.io/resources/parabola-university) video below to learn more about the **Combine Tables** step.
## Input/output
The **Combine Tables** step requires two data inputs to combine. In our example below, we have two tables feeding into it. The first one is a table with columns labeled 'Variant ID', 'Product Name', 'Variant Name', and 'Sale Price'. The second one is a table with headers 'Variant ID' and 'Stock Quantity'.
 After using the **Combine Tables** step, our output data (shown below) has combined the 'Stock Quantity' column from the second table to the first table using 'Variant ID' as the matching identifier.
 ## Custom settings
After connecting two datasets into this step, in the left-side toolbar choose whether you will 'Keep all rows' or 'Keep only matching rows' for your data sources using the drop down menus.
## Custom settings
After connecting two datasets into this step, in the left-side toolbar choose whether you will 'Keep all rows' or 'Keep only matching rows' for your data sources using the drop down menus.
 Then in the next set of options, click 'select' to access the dropdown menu of columns and select which ones to join the tables by. The column you choose should be present in both datasets, have identical values, and be used as the unique identifier between them.
 Once you're done, click 'Show Updated Results' to save and display the newly-combined tables.
 If the datasets you want to combine don't have a shared column of identical values, then you can use [Insert row numbers](/product/transform/insert-row-numbers) to make one in each table. You'd do this by connecting your import datasets to an **Insert row numbers** step to generate matching columns with incrementally-increasing numbers.
 ## Other ways to combine tables:
Now we've learned one example using our default settings. Let's explore the other ways that we can combine tables in Parabola. We can switch our **Combine tables** step to keep all rows that have matches in all tables. The resulting table will only contain rows that exist in every table we are combining.
## Other ways to combine tables:
Now we've learned one example using our default settings. Let's explore the other ways that we can combine tables in Parabola. We can switch our **Combine tables** step to keep all rows that have matches in all tables. The resulting table will only contain rows that exist in every table we are combining.
 The last option is to keep all rows in all tables. This will create a resulting table that has every row from every table present. If no match was found for a specific row, it will still exist. This option has a tendency to create a lot of blank cells, and can be tricky to use properly.
 ## Helpful tips
* The default setting for the **Combine Tables** step is the most common way to combine tables. It keeps the entire primary table and finds matches in the other tables, fitting them in to their matched rows as we go. If a row doesn't have a match in the primary table, it won't show up in the results.
* Fuzzy match is not supported. [Find Overlap](/product/transform/find-overlap) is a better option, which supports fuzzy comparison
* To combine three or more tables together, chain together multiple **Combine Tables** steps to merge your data.
## Helpful tips
* The default setting for the **Combine Tables** step is the most common way to combine tables. It keeps the entire primary table and finds matches in the other tables, fitting them in to their matched rows as we go. If a row doesn't have a match in the primary table, it won't show up in the results.
* Fuzzy match is not supported. [Find Overlap](/product/transform/find-overlap) is a better option, which supports fuzzy comparison
* To combine three or more tables together, chain together multiple **Combine Tables** steps to merge your data.
 * If we need multiple rules to determine a match, the default setting will find a match where any rules apply. We can change this so that rows match only when all of the rules apply.
 ## Troubleshooting tips
Here are a few common questions that come up around the **Combine tables** steps and ways to troubleshoot them:
**Issue**: I'm seeing my rows multiplied in the results section of the **Combine tables** step.
**Solution:** It's possible that you are matching on data that shows up multiple times in one or both of your sources. Check your inputs to make sure the selected matching columns have unique data in both inputs. If you don't have a column with unique data, you may need to choose multiple columns to match on to make sure you're not duplicating your rows.
**Issue:** I'm seeing a 'Missing columns' error in the **Combine tables** step.
**Solution:** This can happen when you remove or rename columns in your inputs, after you've already keyed to those columns in your **Combine tables** step. You'll need to either reselect your matching columns in the step or pull in a new **Combine tables** step.
## Related steps
* [Find overlap](/product/transform/find-overlap)
* [Stack tables](/product/transform/stack-tables)
* [Look up rows](/product/transform/look-up-rows)
* [Merge duplicate rows](/product/transform/merge-duplicate-rows)
* [Insert row numbers](/product/transform/insert-row-numbers)
## Troubleshooting tips
Here are a few common questions that come up around the **Combine tables** steps and ways to troubleshoot them:
**Issue**: I'm seeing my rows multiplied in the results section of the **Combine tables** step.
**Solution:** It's possible that you are matching on data that shows up multiple times in one or both of your sources. Check your inputs to make sure the selected matching columns have unique data in both inputs. If you don't have a column with unique data, you may need to choose multiple columns to match on to make sure you're not duplicating your rows.
**Issue:** I'm seeing a 'Missing columns' error in the **Combine tables** step.
**Solution:** This can happen when you remove or rename columns in your inputs, after you've already keyed to those columns in your **Combine tables** step. You'll need to either reselect your matching columns in the step or pull in a new **Combine tables** step.
## Related steps
* [Find overlap](/product/transform/find-overlap)
* [Stack tables](/product/transform/stack-tables)
* [Look up rows](/product/transform/look-up-rows)
* [Merge duplicate rows](/product/transform/merge-duplicate-rows)
* [Insert row numbers](/product/transform/insert-row-numbers)