> ## Documentation Index
> Fetch the complete documentation index at: https://parabola.io/docs/llms.txt
> Use this file to discover all available pages before exploring further.
# Flip table
> The **Flip table** step flips an entire table on its side, turning it 90 degrees. Imagine your column headers transform into rows. This step's functionality is similar to the TRANSPOSE function in Excel.
## Input/output
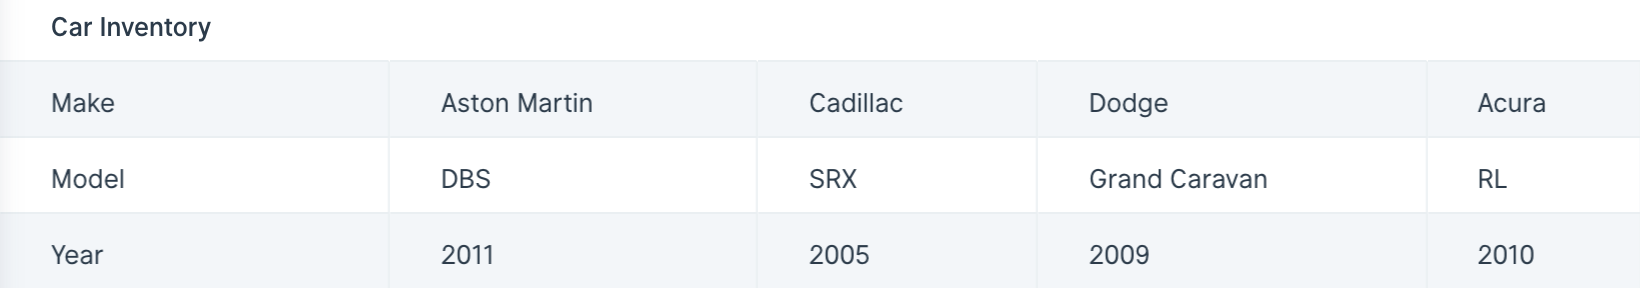
The input table we'll use for this step has 3 rows and over 100 columns. Every column represents a different car in our inventory.
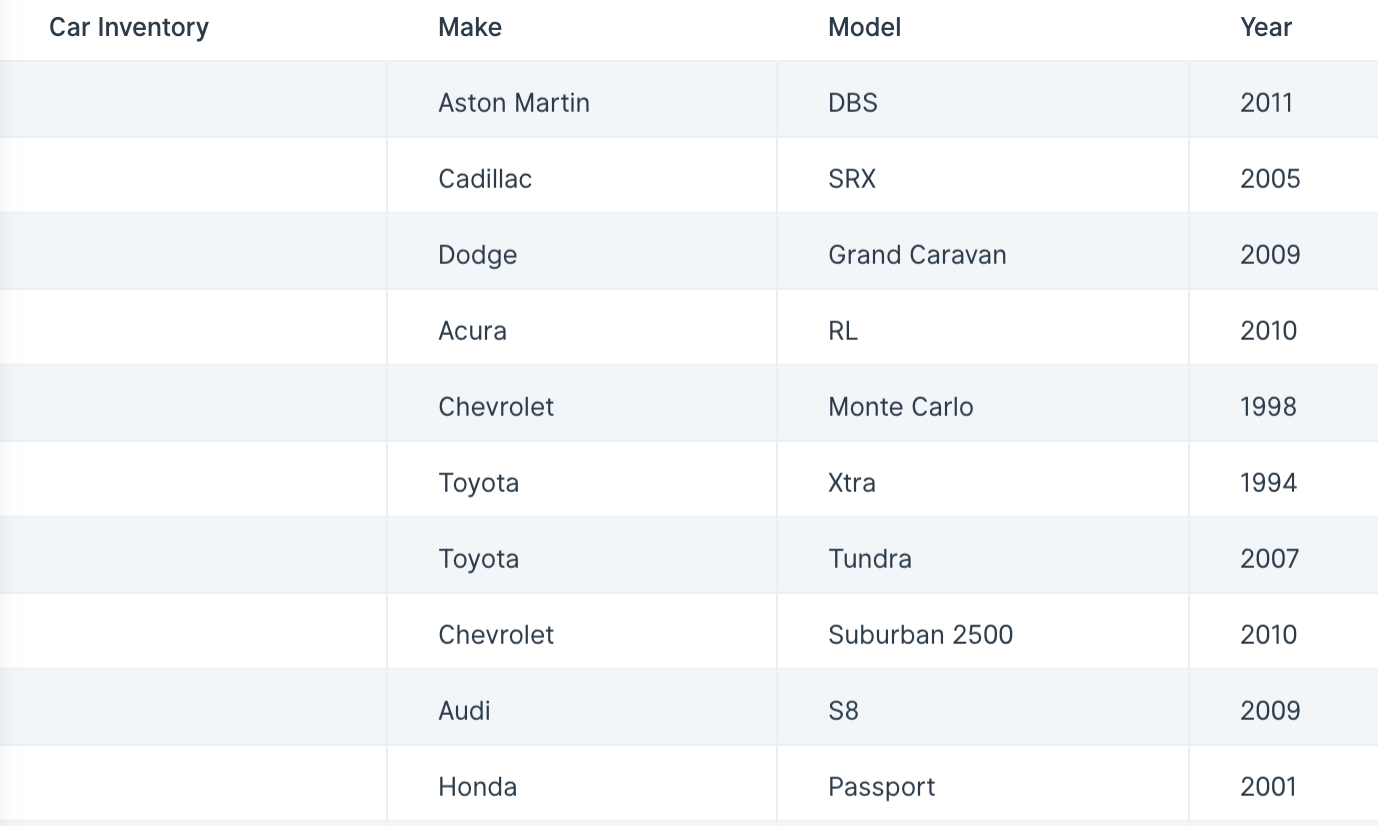
 By using the **Flip table** step, we can turn the table 90 degrees to make the previously 3 rows our columns ("Make", "Model" and "Year") and have the 100+ columns become 100+ rows. This transformed table of 3 columns with 100+ rows makes our data a lot easier to understand.
 ## Custom settings
This step doesn't require any additional configuration. Just connect a step containing data to this one and see your table immediately flipped 90 degrees.
## Related steps
* [Pivot columns](/product/transform/pivot-columns)
* [Unpivot columns](/product/transform/unpivot-columns)
* [Stack tables](/product/transform/stack-tables)
* [Edit columns](/product/transform/edit-columns)
* [Edit columns](/product/transform/edit-columns)
## Custom settings
This step doesn't require any additional configuration. Just connect a step containing data to this one and see your table immediately flipped 90 degrees.
## Related steps
* [Pivot columns](/product/transform/pivot-columns)
* [Unpivot columns](/product/transform/unpivot-columns)
* [Stack tables](/product/transform/stack-tables)
* [Edit columns](/product/transform/edit-columns)
* [Edit columns](/product/transform/edit-columns)