> ## Documentation Index
> Fetch the complete documentation index at: https://parabola.io/docs/llms.txt
> Use this file to discover all available pages before exploring further.
# Pivot columns
> The **Pivot columns** step takes a column and turns its values into multiple columns. It is particularly useful when needing to turn order line item information into a unique row per order.
## Input/Output
In the example below, our input data has duplicate values in the "Order ID" column, plus other columns specifying "Variant Option" and "Variant Value".
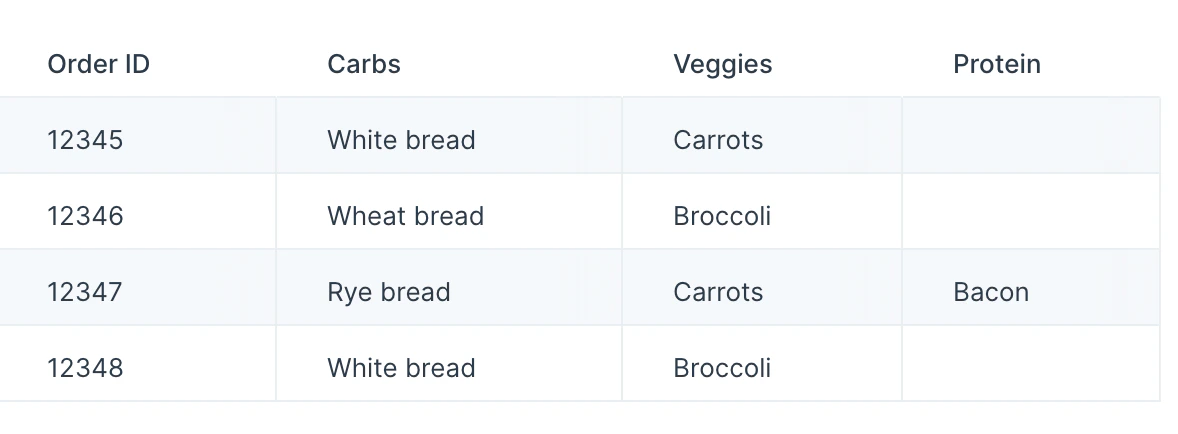
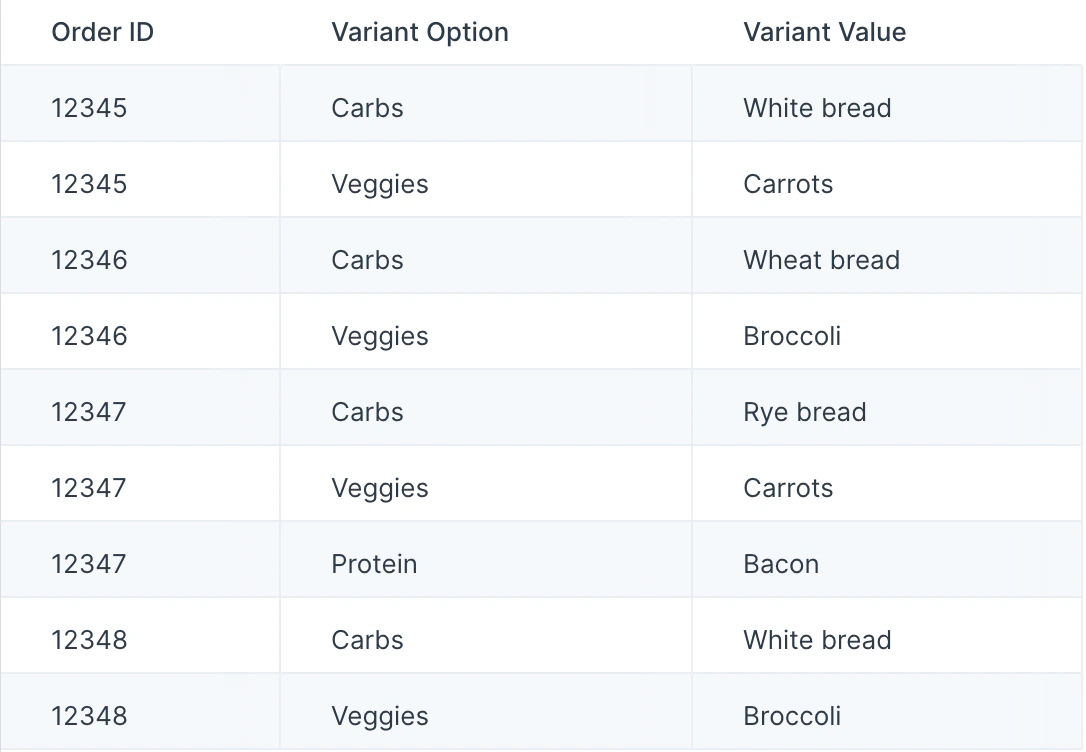 We'll want to create a unique row per "Order ID" where the "Variant Option" becomes the column headers and "Variant Value" becomes the cell value in the corresponding columns. The **Pivot columns** step accomplishes this for us.
 ## Custom settings
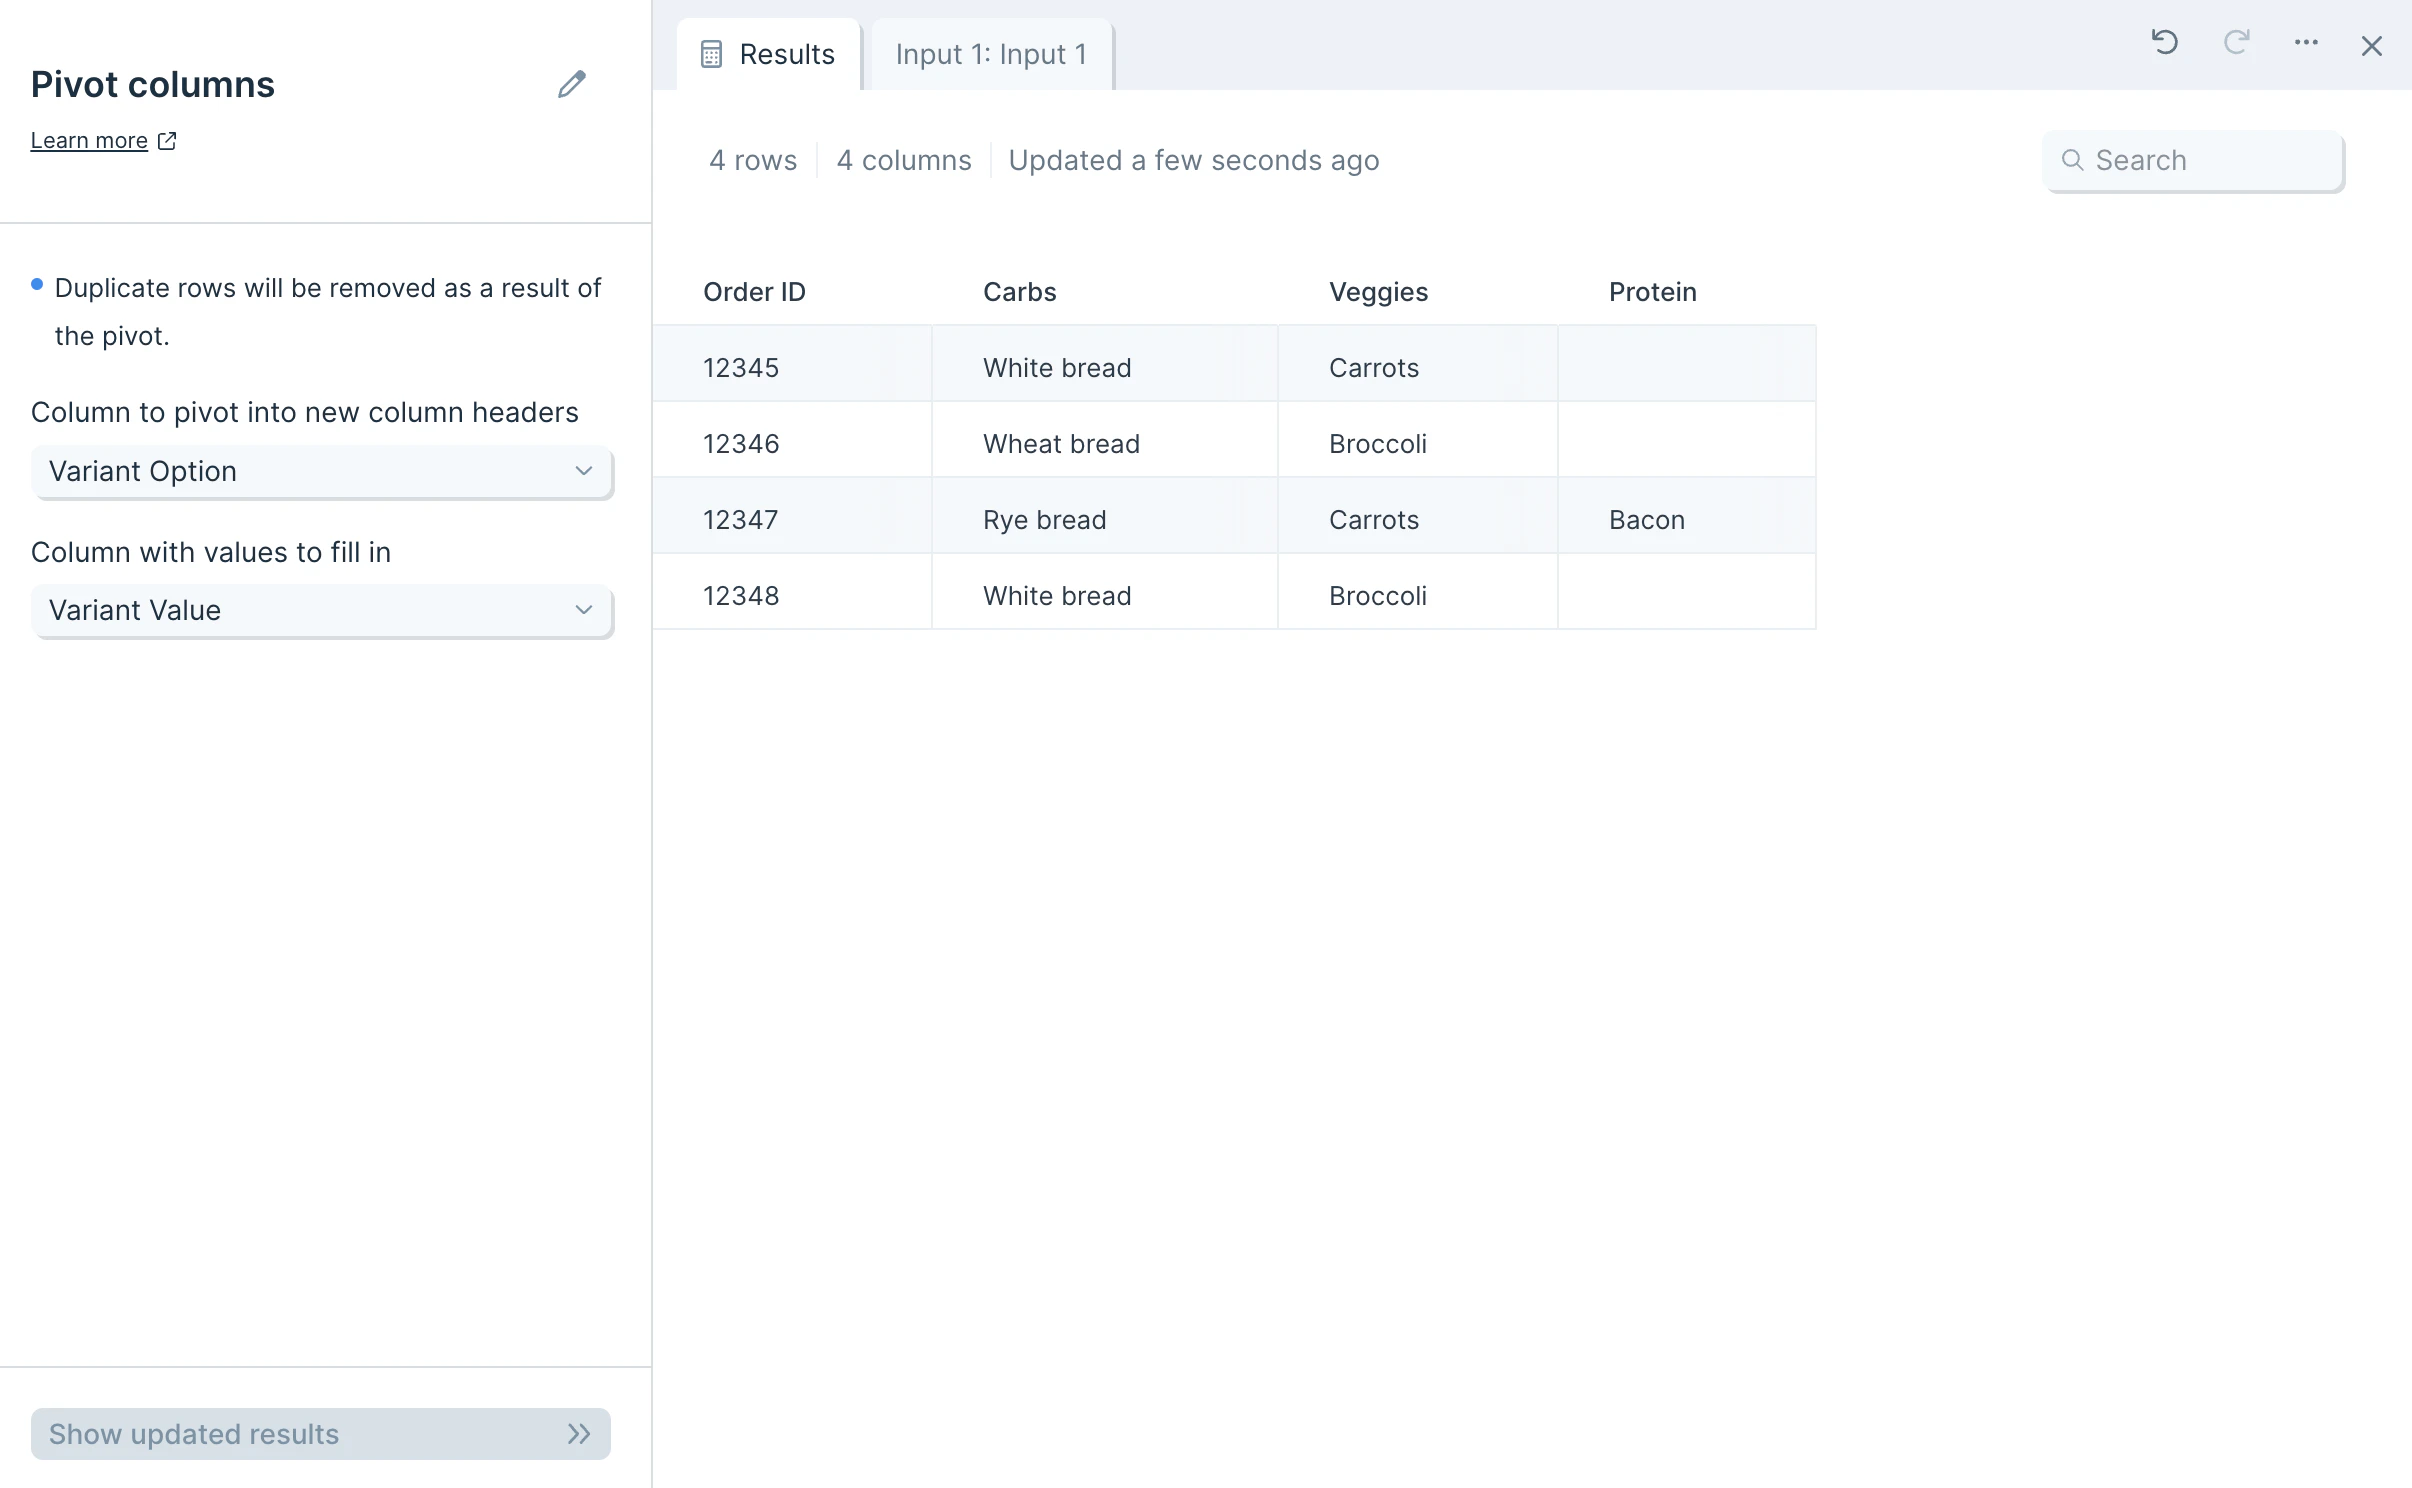
Once you connect data to the **Pivot columns** step, you'll select a **Column to pivot into new column headers**, and you'll select a **Column with values to fill in**
In the example below, we selected the "Variant Options" column to be the pivot column, and we selected "Variant Value" column to be the value column. If no "Variant Value" exists for the corresponding "Variant Options" column header, the cell is left blank.
## Custom settings
Once you connect data to the **Pivot columns** step, you'll select a **Column to pivot into new column headers**, and you'll select a **Column with values to fill in**
In the example below, we selected the "Variant Options" column to be the pivot column, and we selected "Variant Value" column to be the value column. If no "Variant Value" exists for the corresponding "Variant Options" column header, the cell is left blank.
 ## Frequently asked questions
**What if multiple rows share the same pivot column value?**
When several input rows have the same value in the column being pivoted, the **Pivot columns** step keeps the last matching value seen. To consolidate values before pivoting, use [Merge duplicate](/product/transform/merge-duplicate-rows) or [Sum by group](/product/transform/sum-by-group) first.
**How do I reverse a pivot?**
Use the [Unpivot columns](/product/transform/unpivot-columns) step to collapse pivoted columns back into a longer format with one row per value.
**Why are some cells blank in the output?**
A blank cell means the original input had no value for that combination of identifier and pivoted column header. This is expected when not every entity has every category of data.
## Related steps
* [Unpivot columns](/product/transform/unpivot-columns) — reverse a pivot by collapsing columns back into rows.
* [Merge duplicate](/product/transform/merge-duplicate-rows) — combine duplicate identifier rows before pivoting.
* [Sum by group](/product/transform/sum-by-group) — aggregate numeric values by category.
* [Flip table](/product/transform/flip-table) — swap rows and columns when reshaping data.
* [Combine tables](/product/transform/combine-tables) — join the pivoted output to another dataset.
## Frequently asked questions
**What if multiple rows share the same pivot column value?**
When several input rows have the same value in the column being pivoted, the **Pivot columns** step keeps the last matching value seen. To consolidate values before pivoting, use [Merge duplicate](/product/transform/merge-duplicate-rows) or [Sum by group](/product/transform/sum-by-group) first.
**How do I reverse a pivot?**
Use the [Unpivot columns](/product/transform/unpivot-columns) step to collapse pivoted columns back into a longer format with one row per value.
**Why are some cells blank in the output?**
A blank cell means the original input had no value for that combination of identifier and pivoted column header. This is expected when not every entity has every category of data.
## Related steps
* [Unpivot columns](/product/transform/unpivot-columns) — reverse a pivot by collapsing columns back into rows.
* [Merge duplicate](/product/transform/merge-duplicate-rows) — combine duplicate identifier rows before pivoting.
* [Sum by group](/product/transform/sum-by-group) — aggregate numeric values by category.
* [Flip table](/product/transform/flip-table) — swap rows and columns when reshaping data.
* [Combine tables](/product/transform/combine-tables) — join the pivoted output to another dataset.