
Documentation Index

Fetch the complete documentation index at: https://parabola.io/docs/llms.txt

Use this file to discover all available pages before exploring further.

In this lesson, you’ll learn the three broad categories of data transformations — calculations, business logic, and formatting — and see how to apply them in your flow.

Building challenge

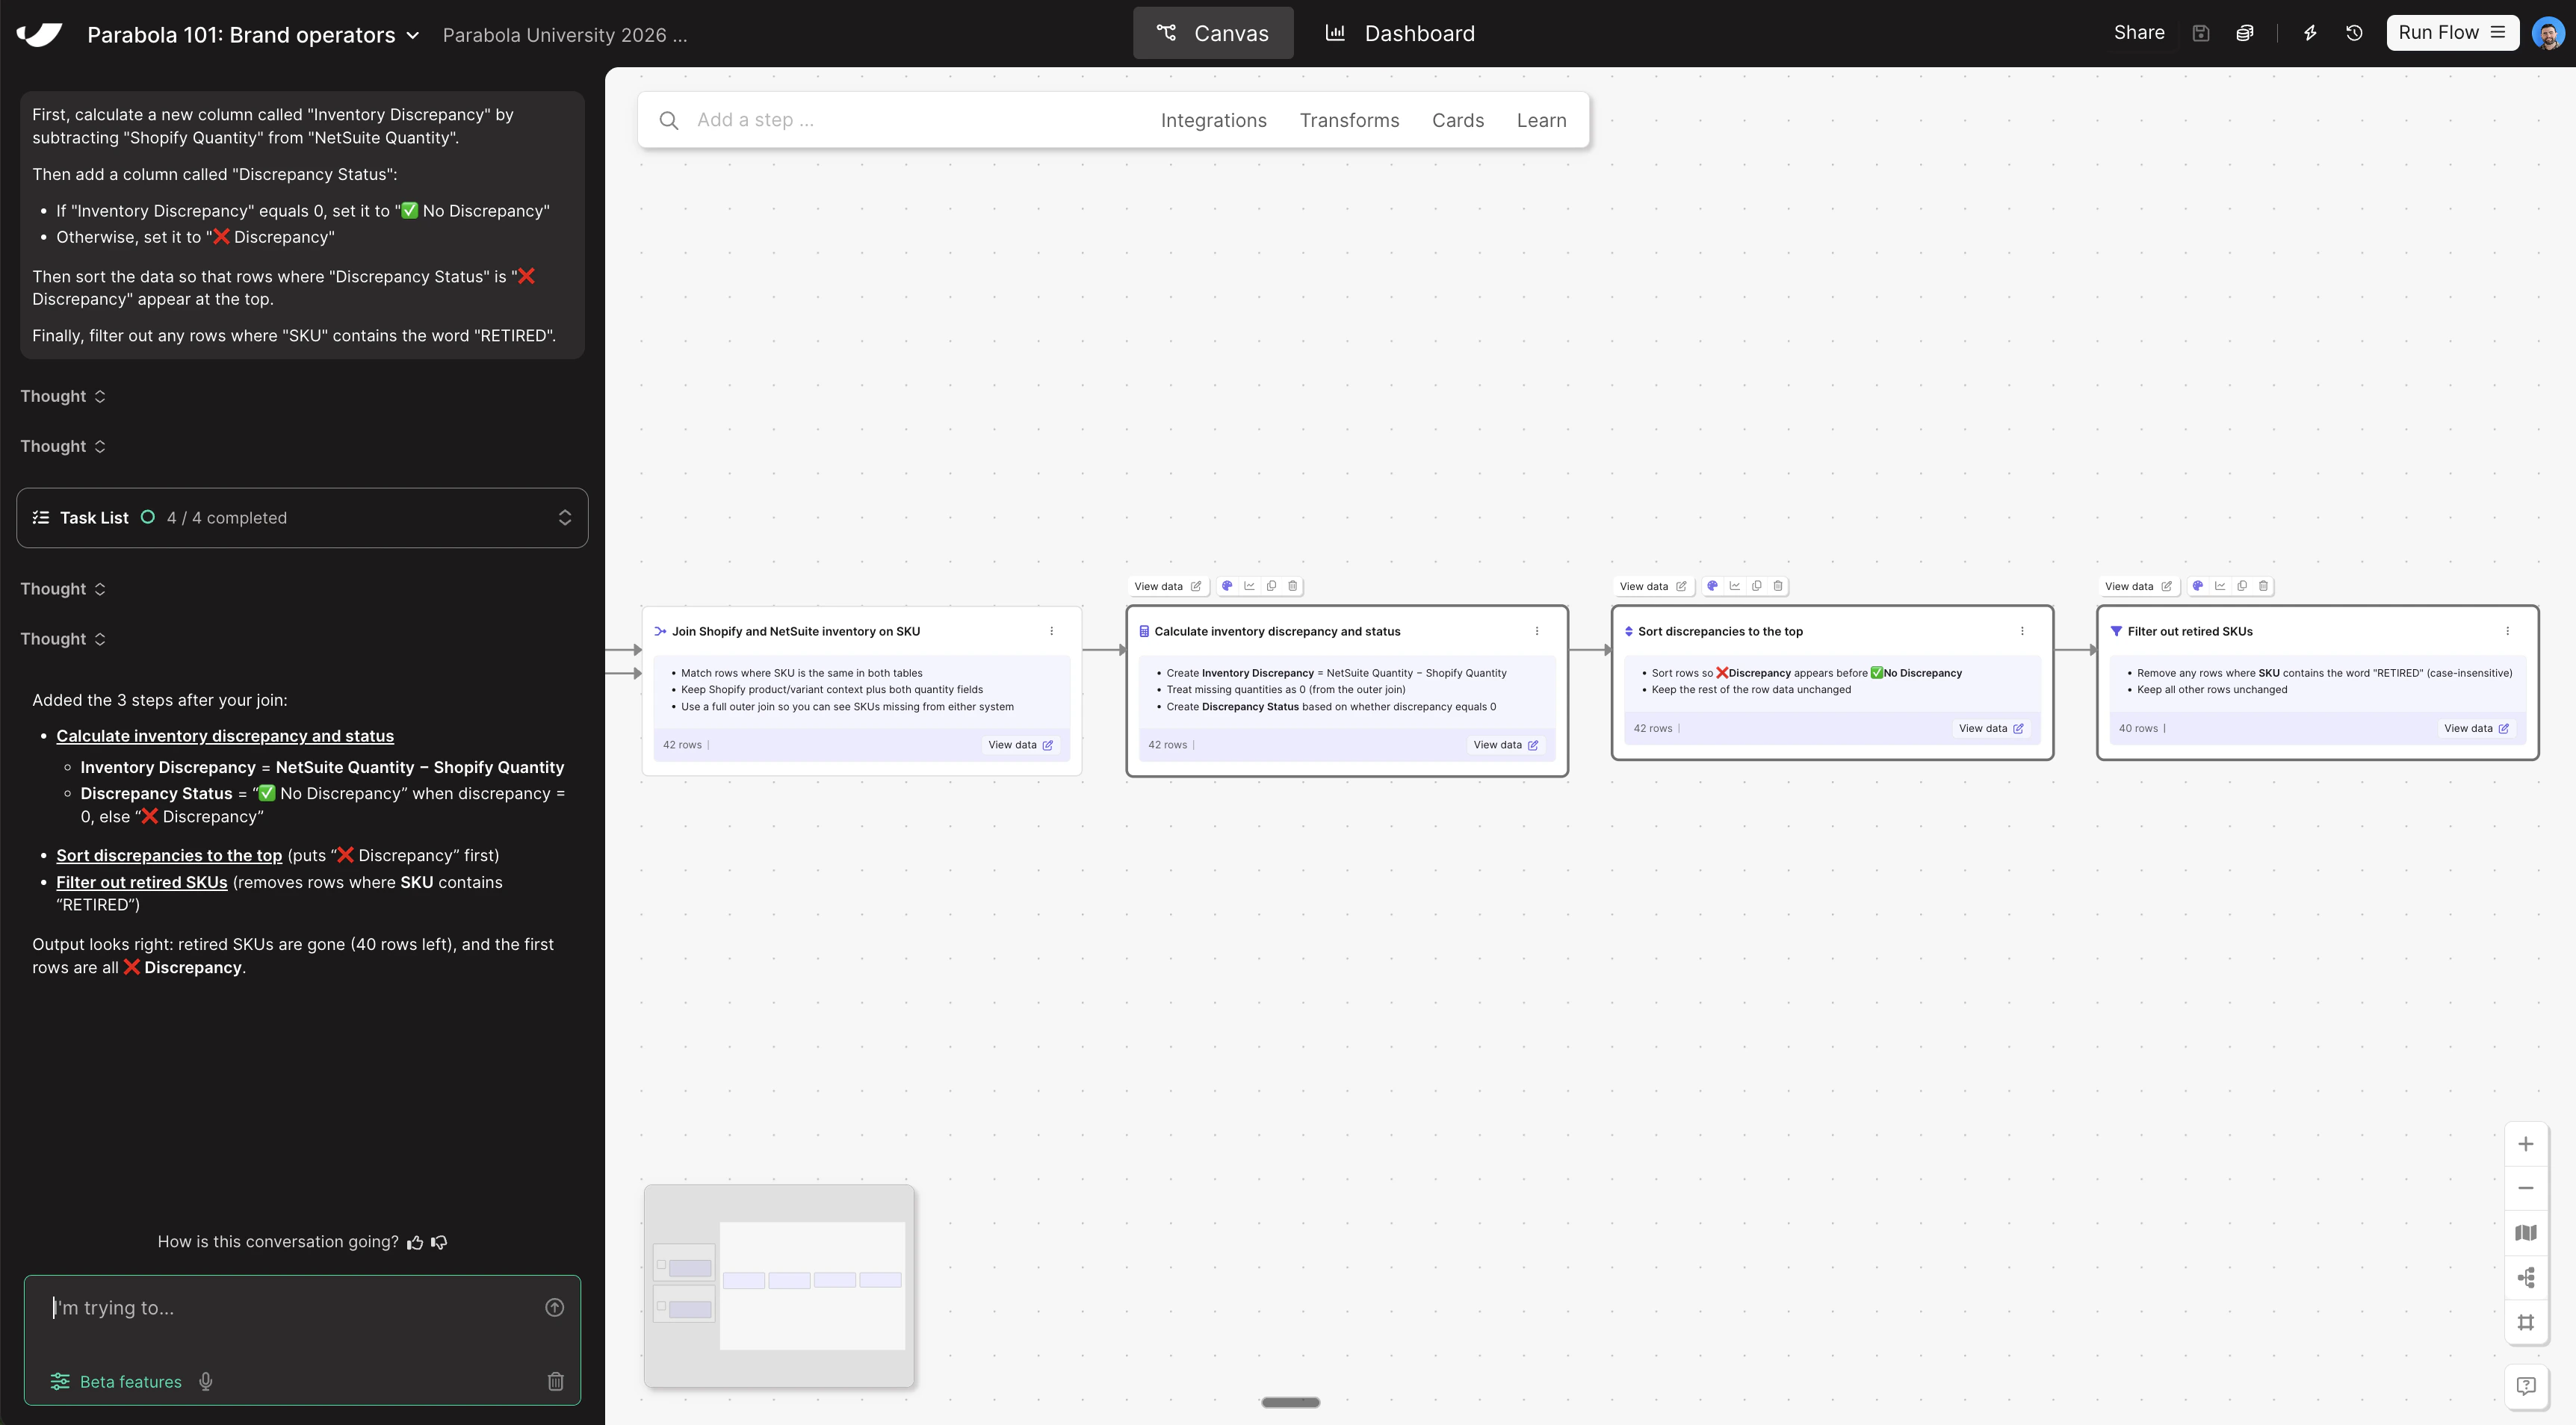
With your inventory data combined, calculate discrepancies, flag which SKUs are out of sync, and sort the results so discrepancies appear first. Copy and paste this prompt into Parabola:
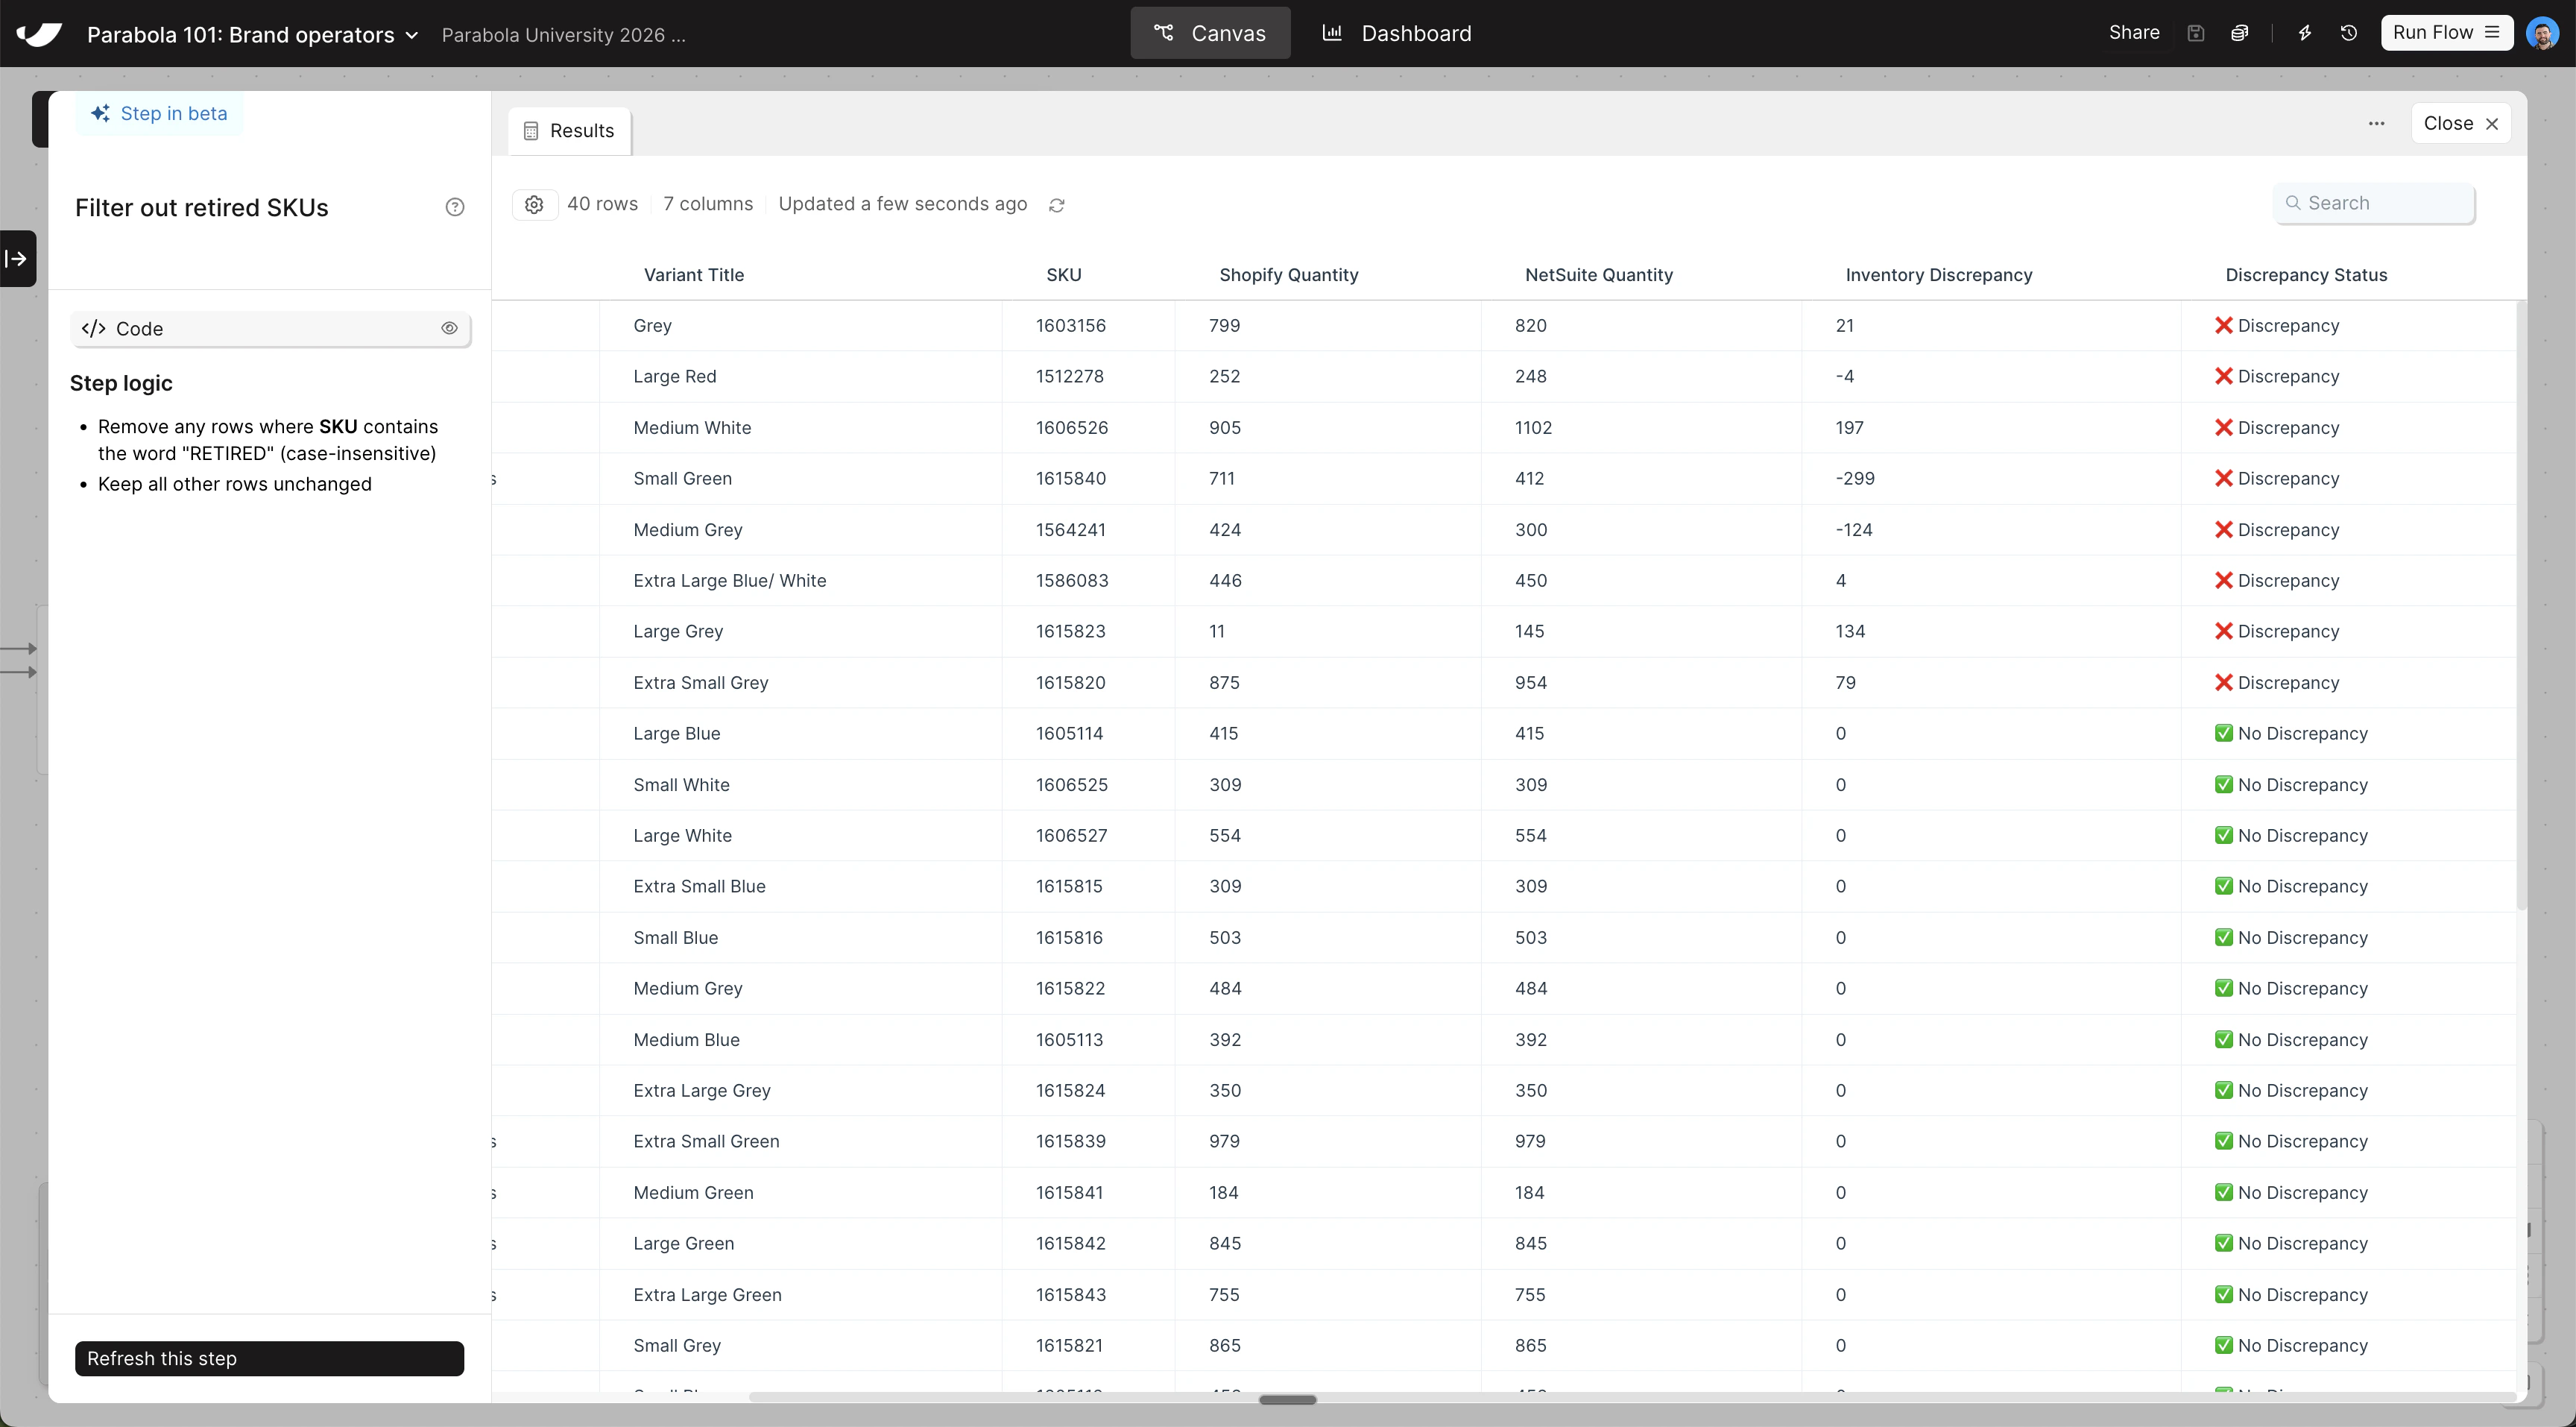
First, calculate a new column called "Inventory Discrepancy" by subtracting "Shopify Quantity" from "NetSuite Quantity".

Then add a column called "Discrepancy Status":
- If "Inventory Discrepancy" equals 0, set it to "✅ No Discrepancy"
- Otherwise, set it to "❌ Discrepancy"

Then sort the data so that rows where "Discrepancy Status" is "❌ Discrepancy" appear at the top.

Finally, filter out any rows where "SKU" contains the word "RETIRED".
The steps added to your canvas and their exact documentation may differ from what you see below — every AI response is unique. The important thing is that your resulting data set matches what you see here.
Transform data canvas viewTransform data step results
Last modified on May 4, 2026