
Documentation Index

Fetch the complete documentation index at: https://parabola.io/docs/llms.txt

Use this file to discover all available pages before exploring further.

In this lesson, you’ll learn the three broad categories of data transformations — calculations, business logic, and formatting — and see how to apply them in your flow.

Building challenge

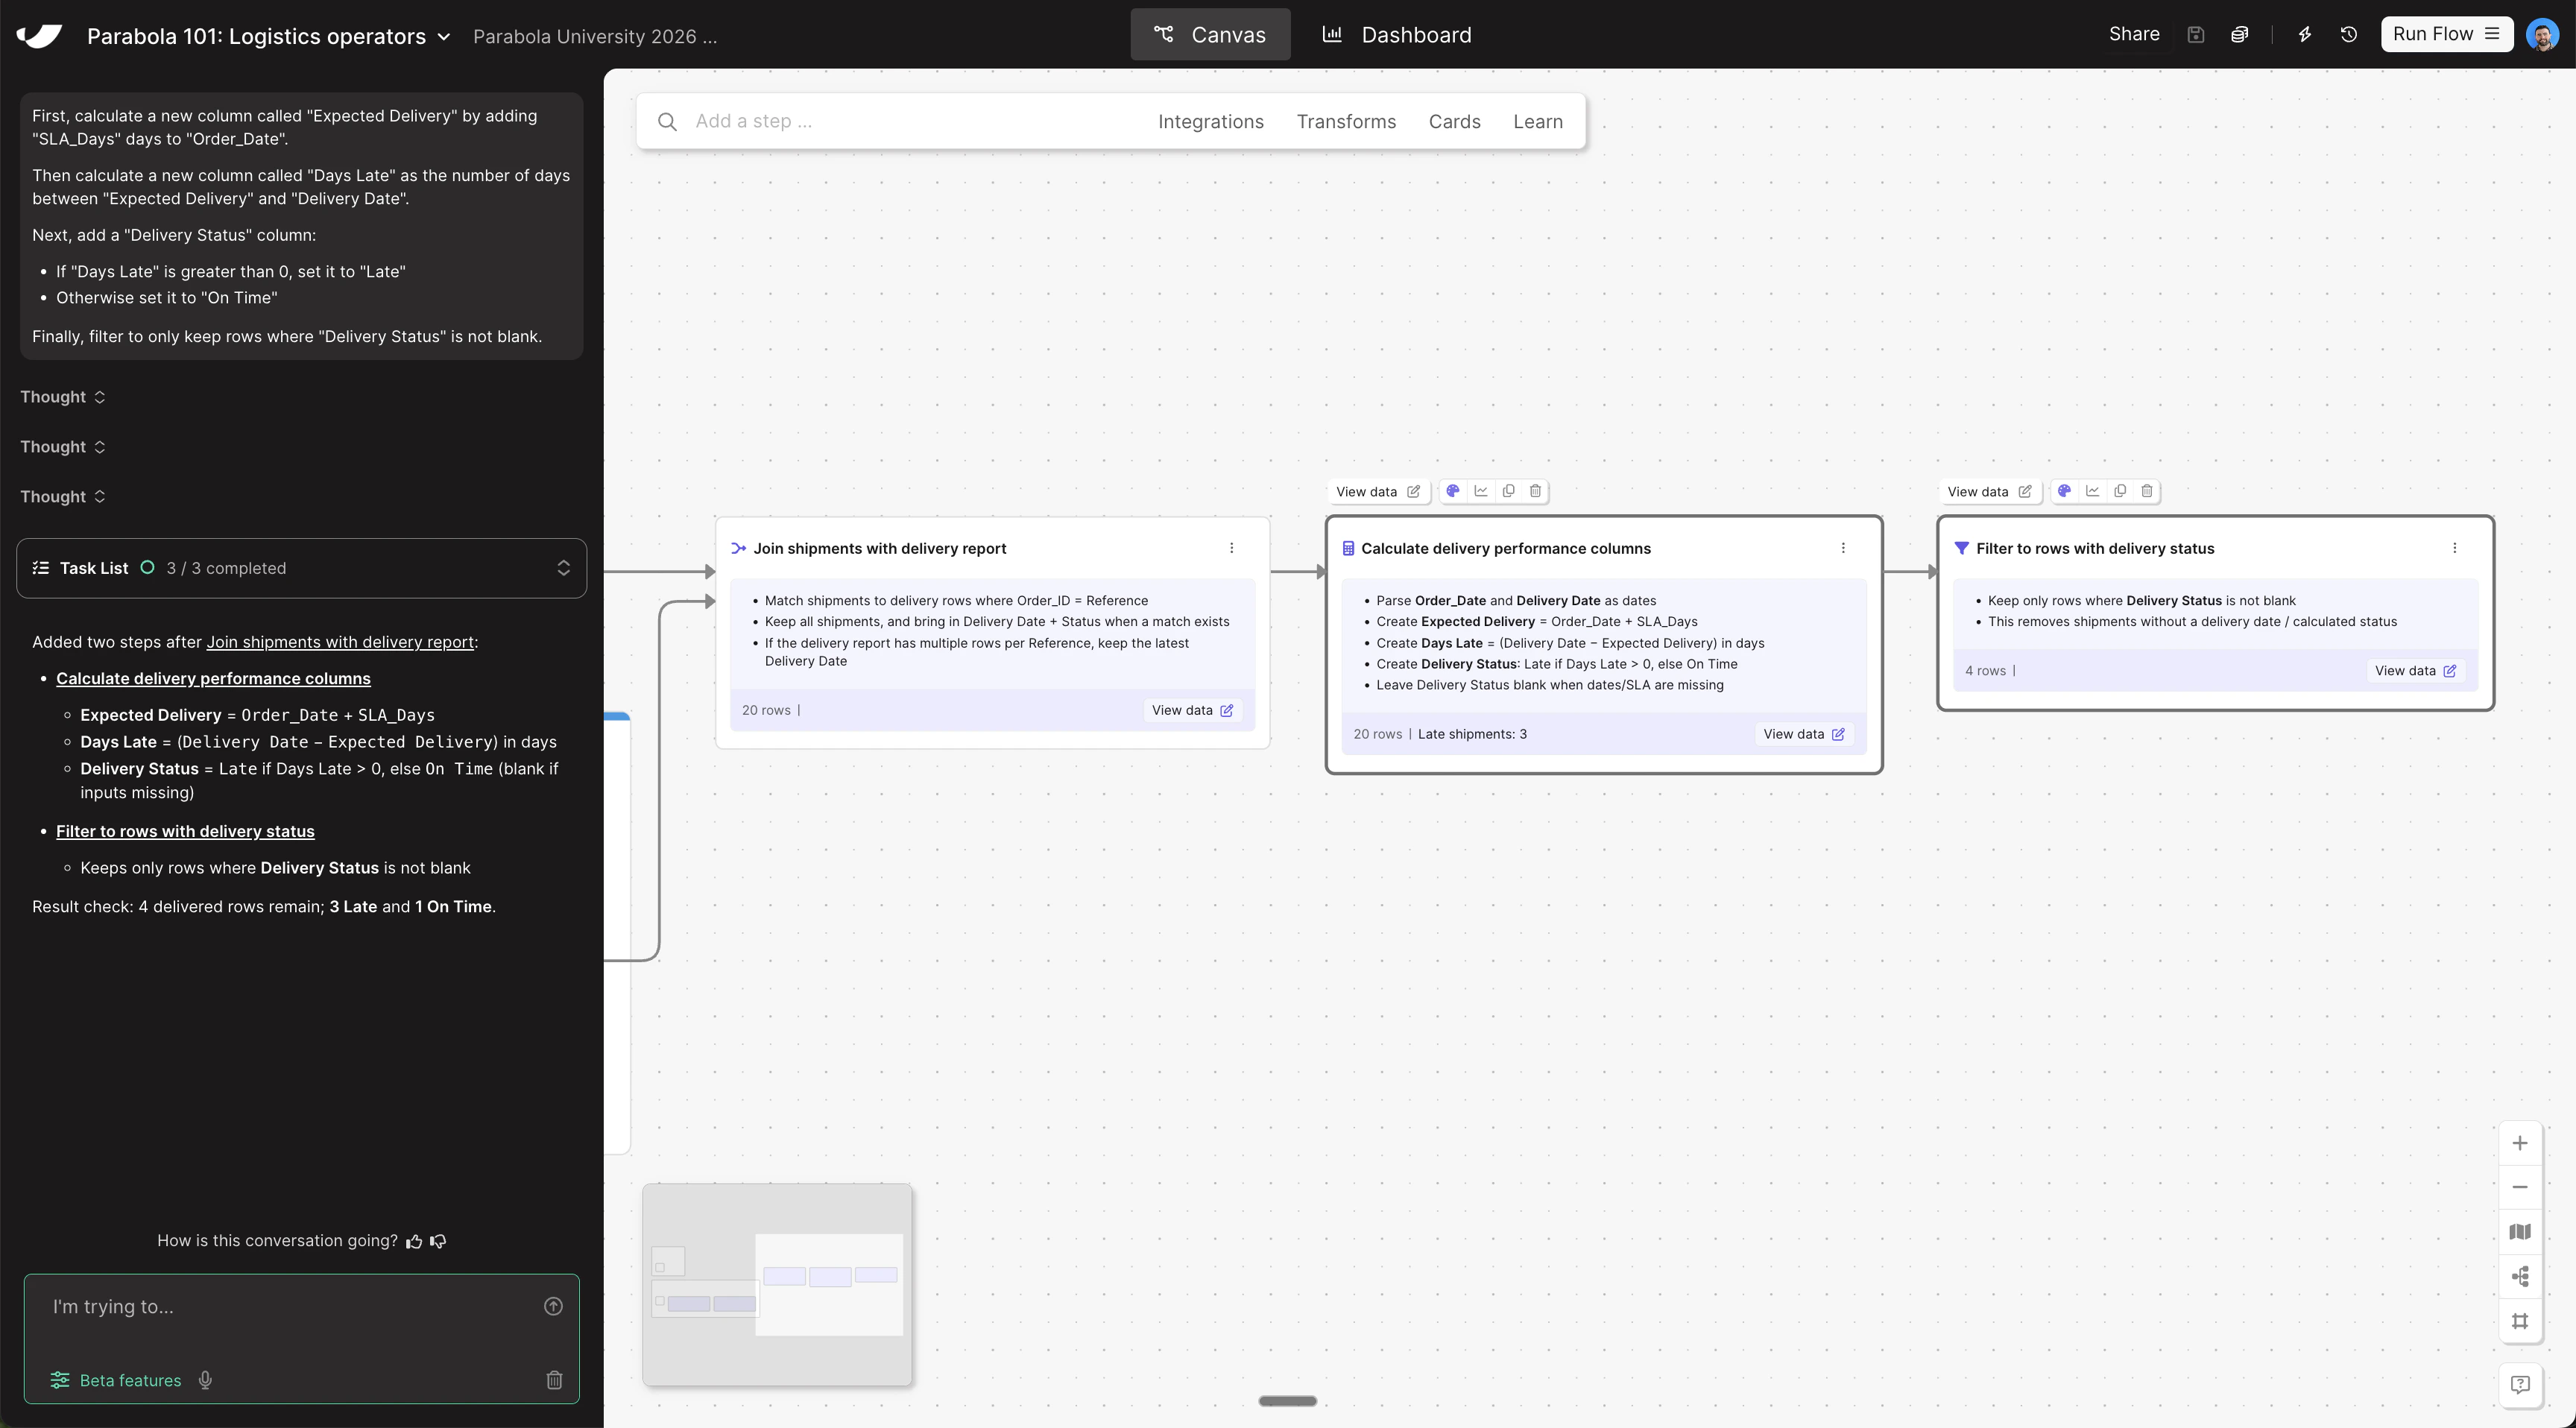
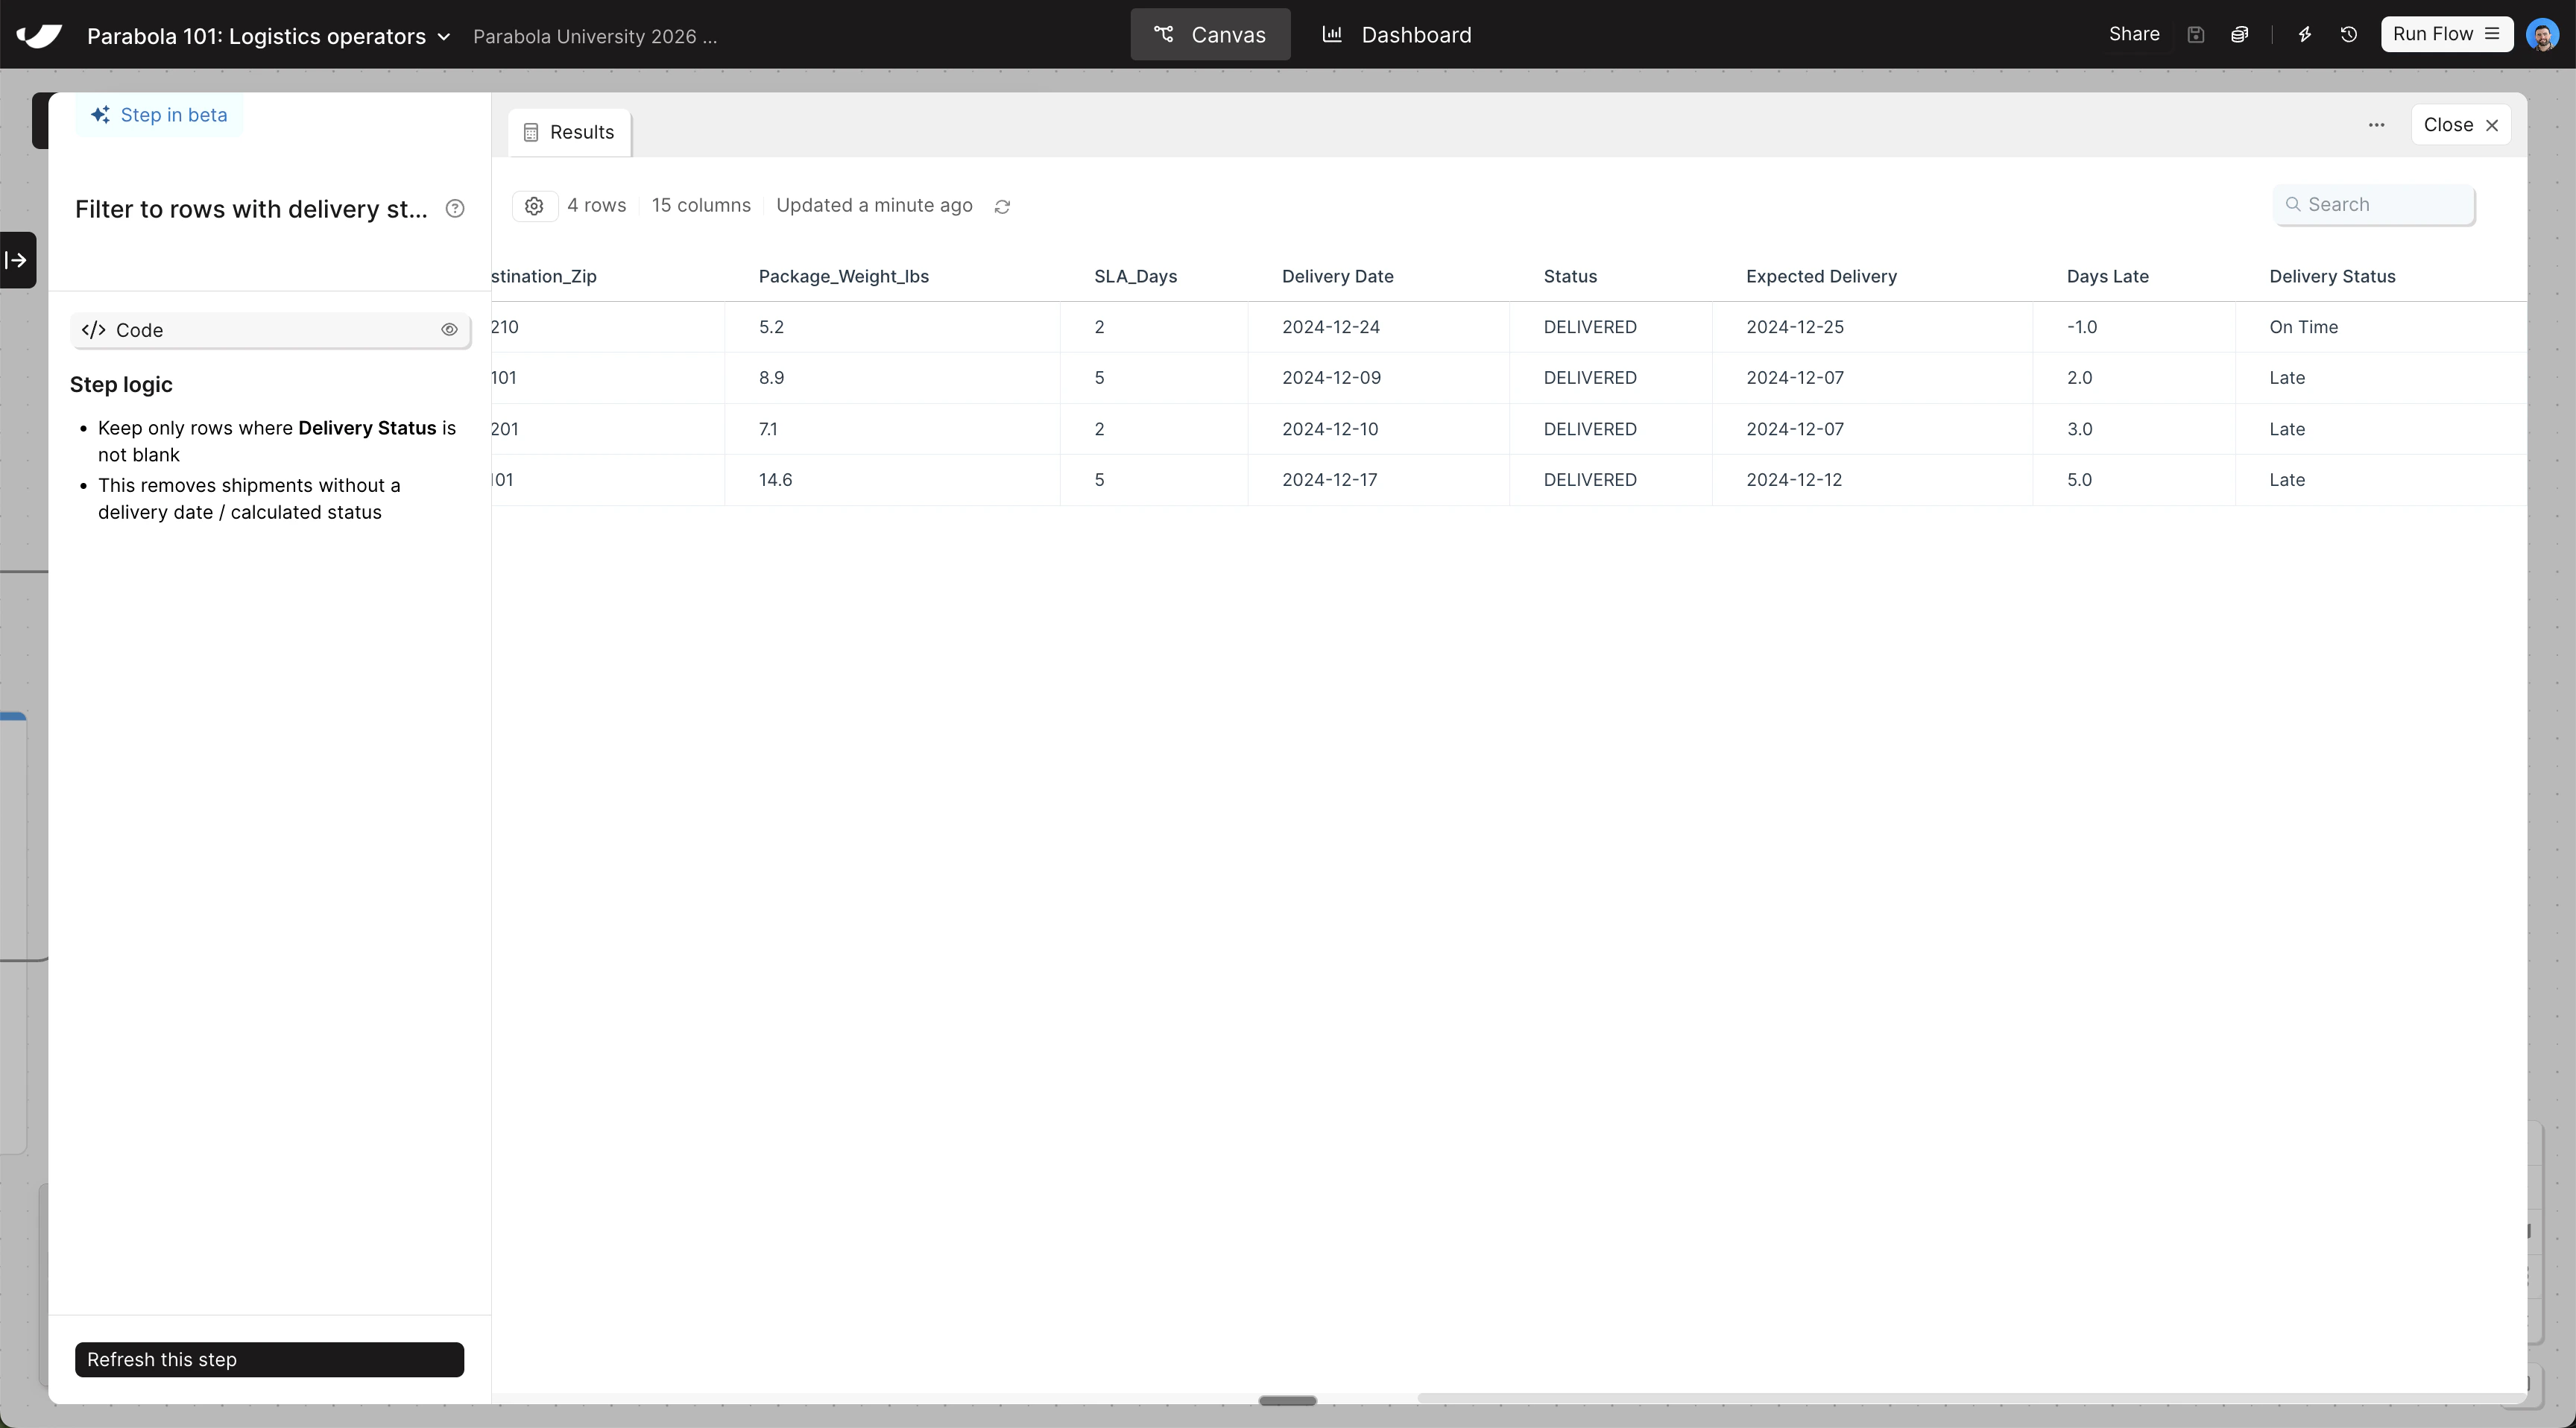
With your shipments and delivery data combined, calculate expected delivery dates, flag late shipments, and filter down to only the shipments that missed their SLA by 2 or more days. Copy and paste this prompt into Parabola:
First, calculate a new column called "Expected Delivery" by adding "SLA_Days" days to "Order_Date".

Then calculate a new column called "Days Late" as the number of days between "Expected Delivery" and "Delivery Date".

Next, add a "Delivery Status" column:
* If "Days Late" is greater than 0, set it to "Late"
* Otherwise set it to "On Time"

Finally, filter to only keep rows where "Delivery Status" is not blank.
The steps added to your canvas and their exact documentation may differ from what you see below — every AI response is unique. The important thing is that your resulting data set matches what you see here.
Transform data canvas viewTransform data step results
Last modified on May 4, 2026