Building challenge
Pull both of your sample data files into your flow — you’ll need both to build the Sales by Category Report.
1
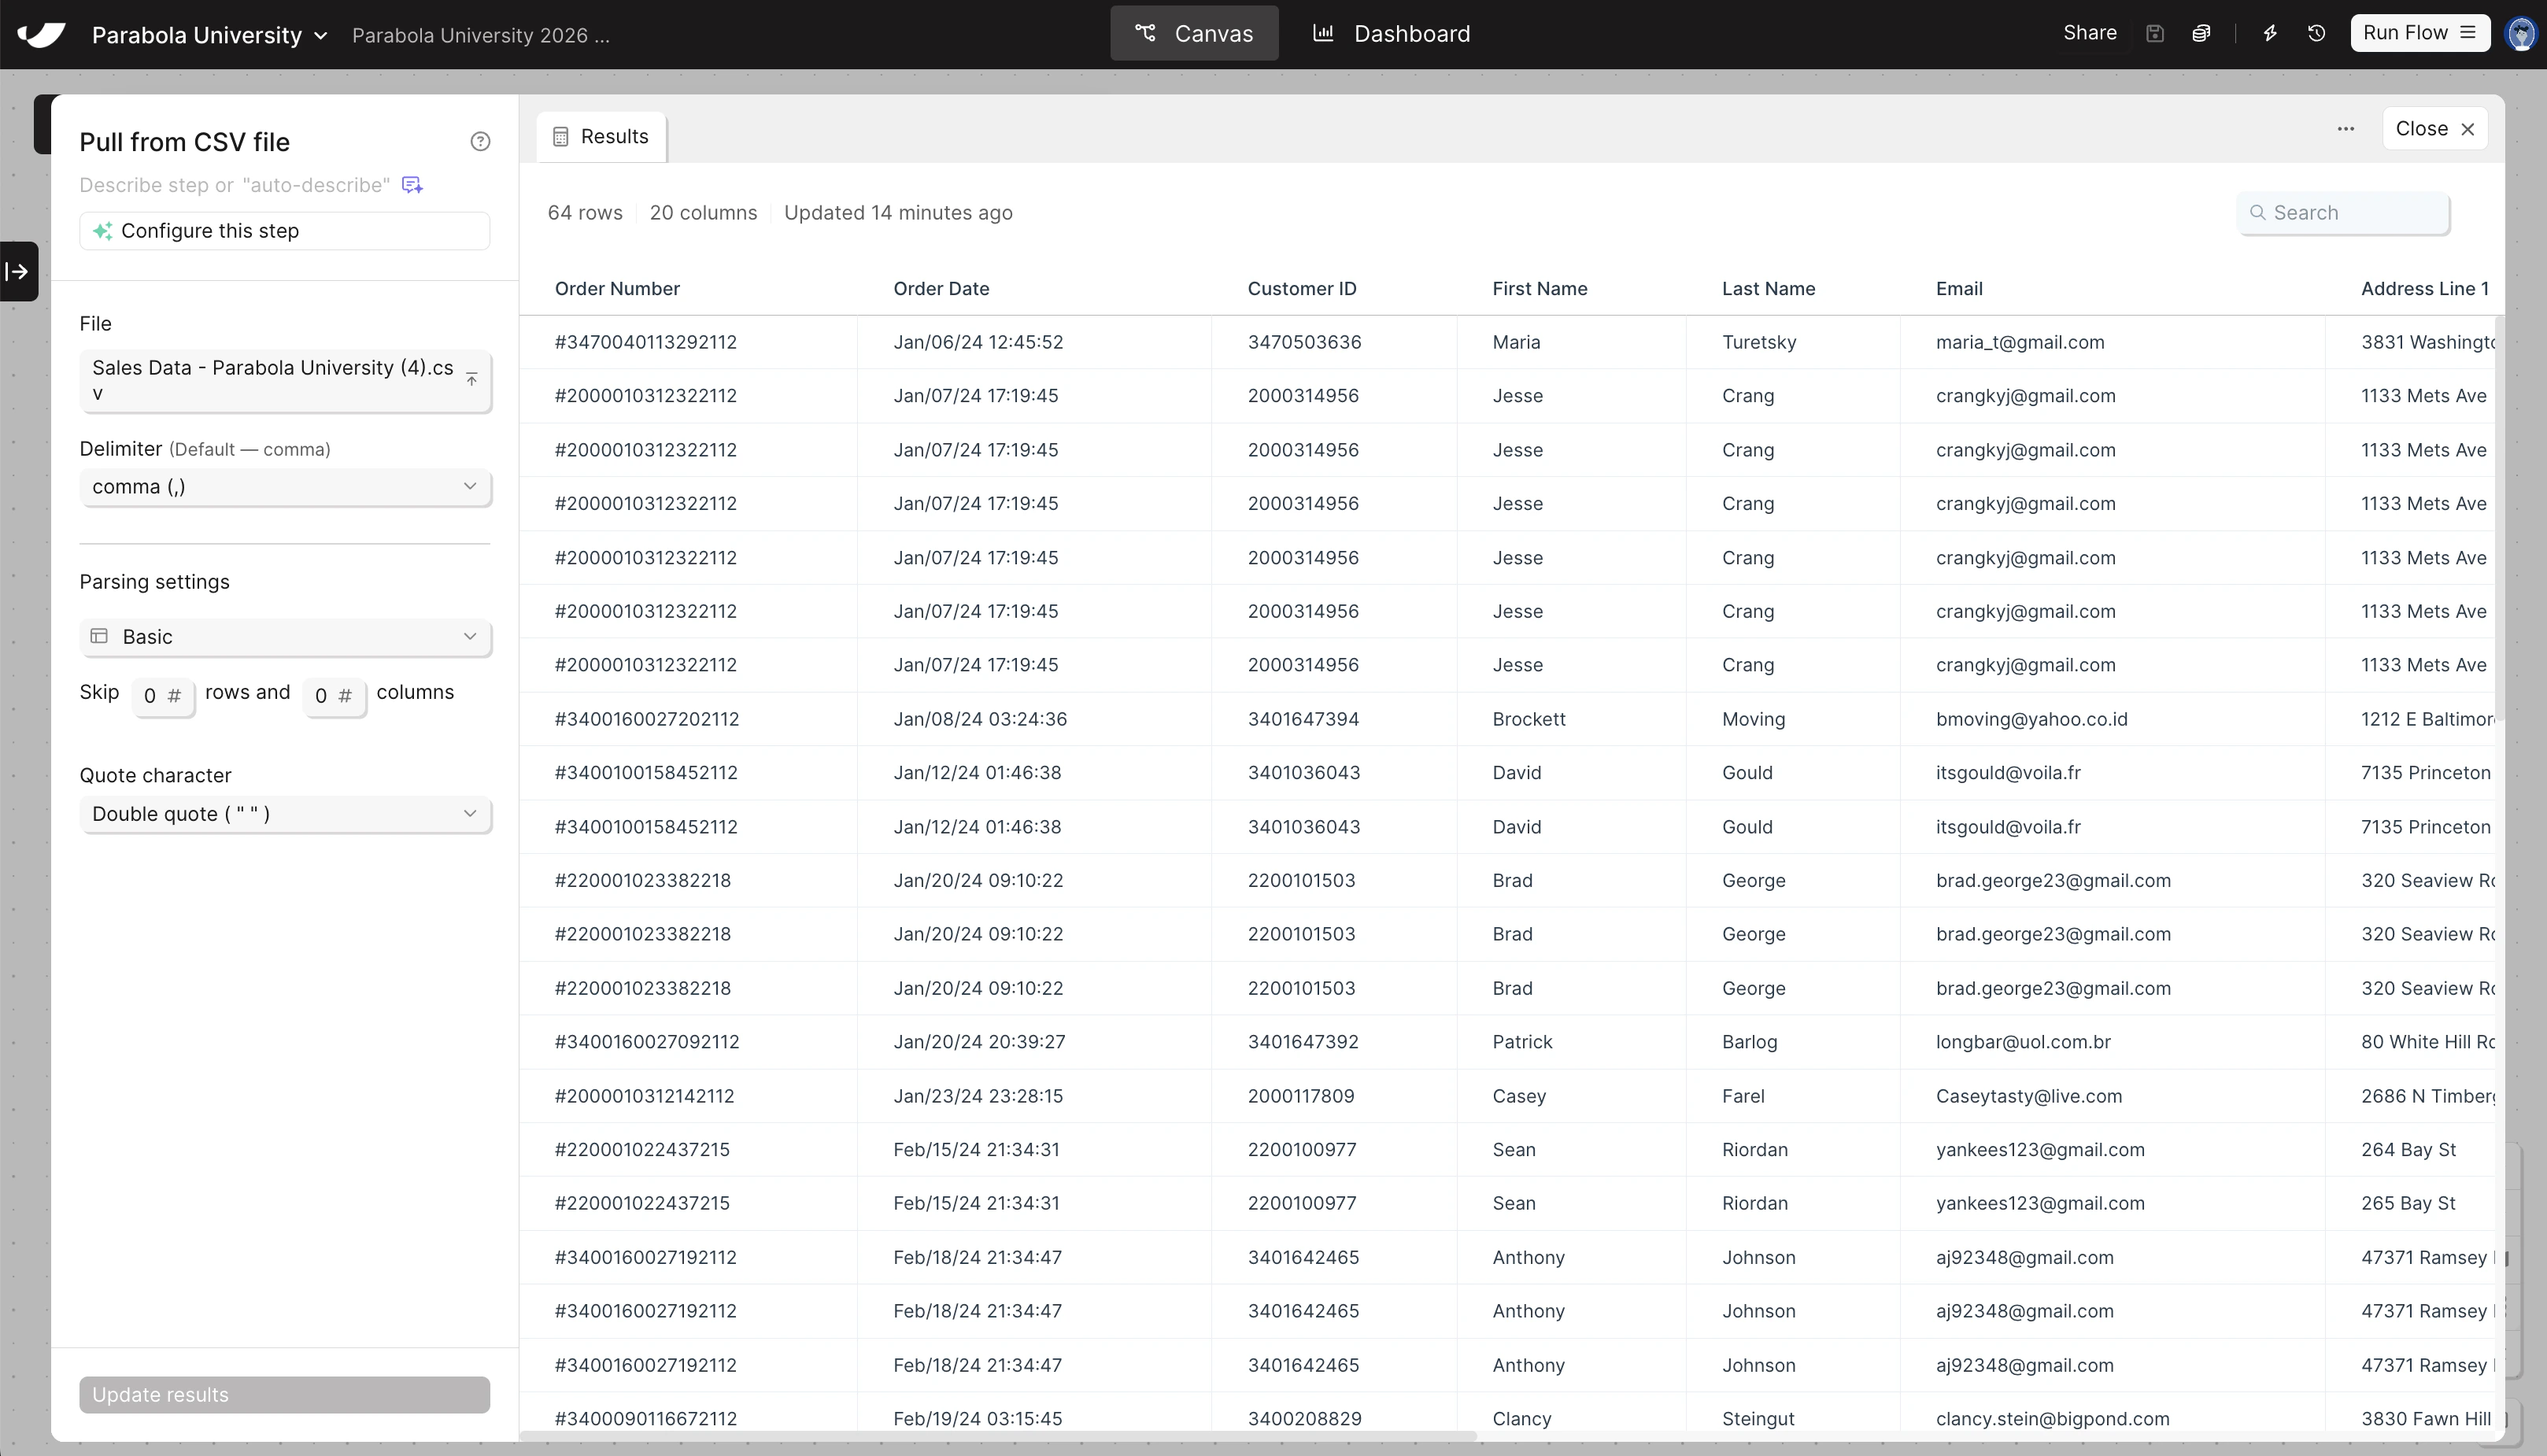
Drag and drop your sales data file directly onto the canvas
This automatically creates a Pull from CSV file step and loads your data.
2
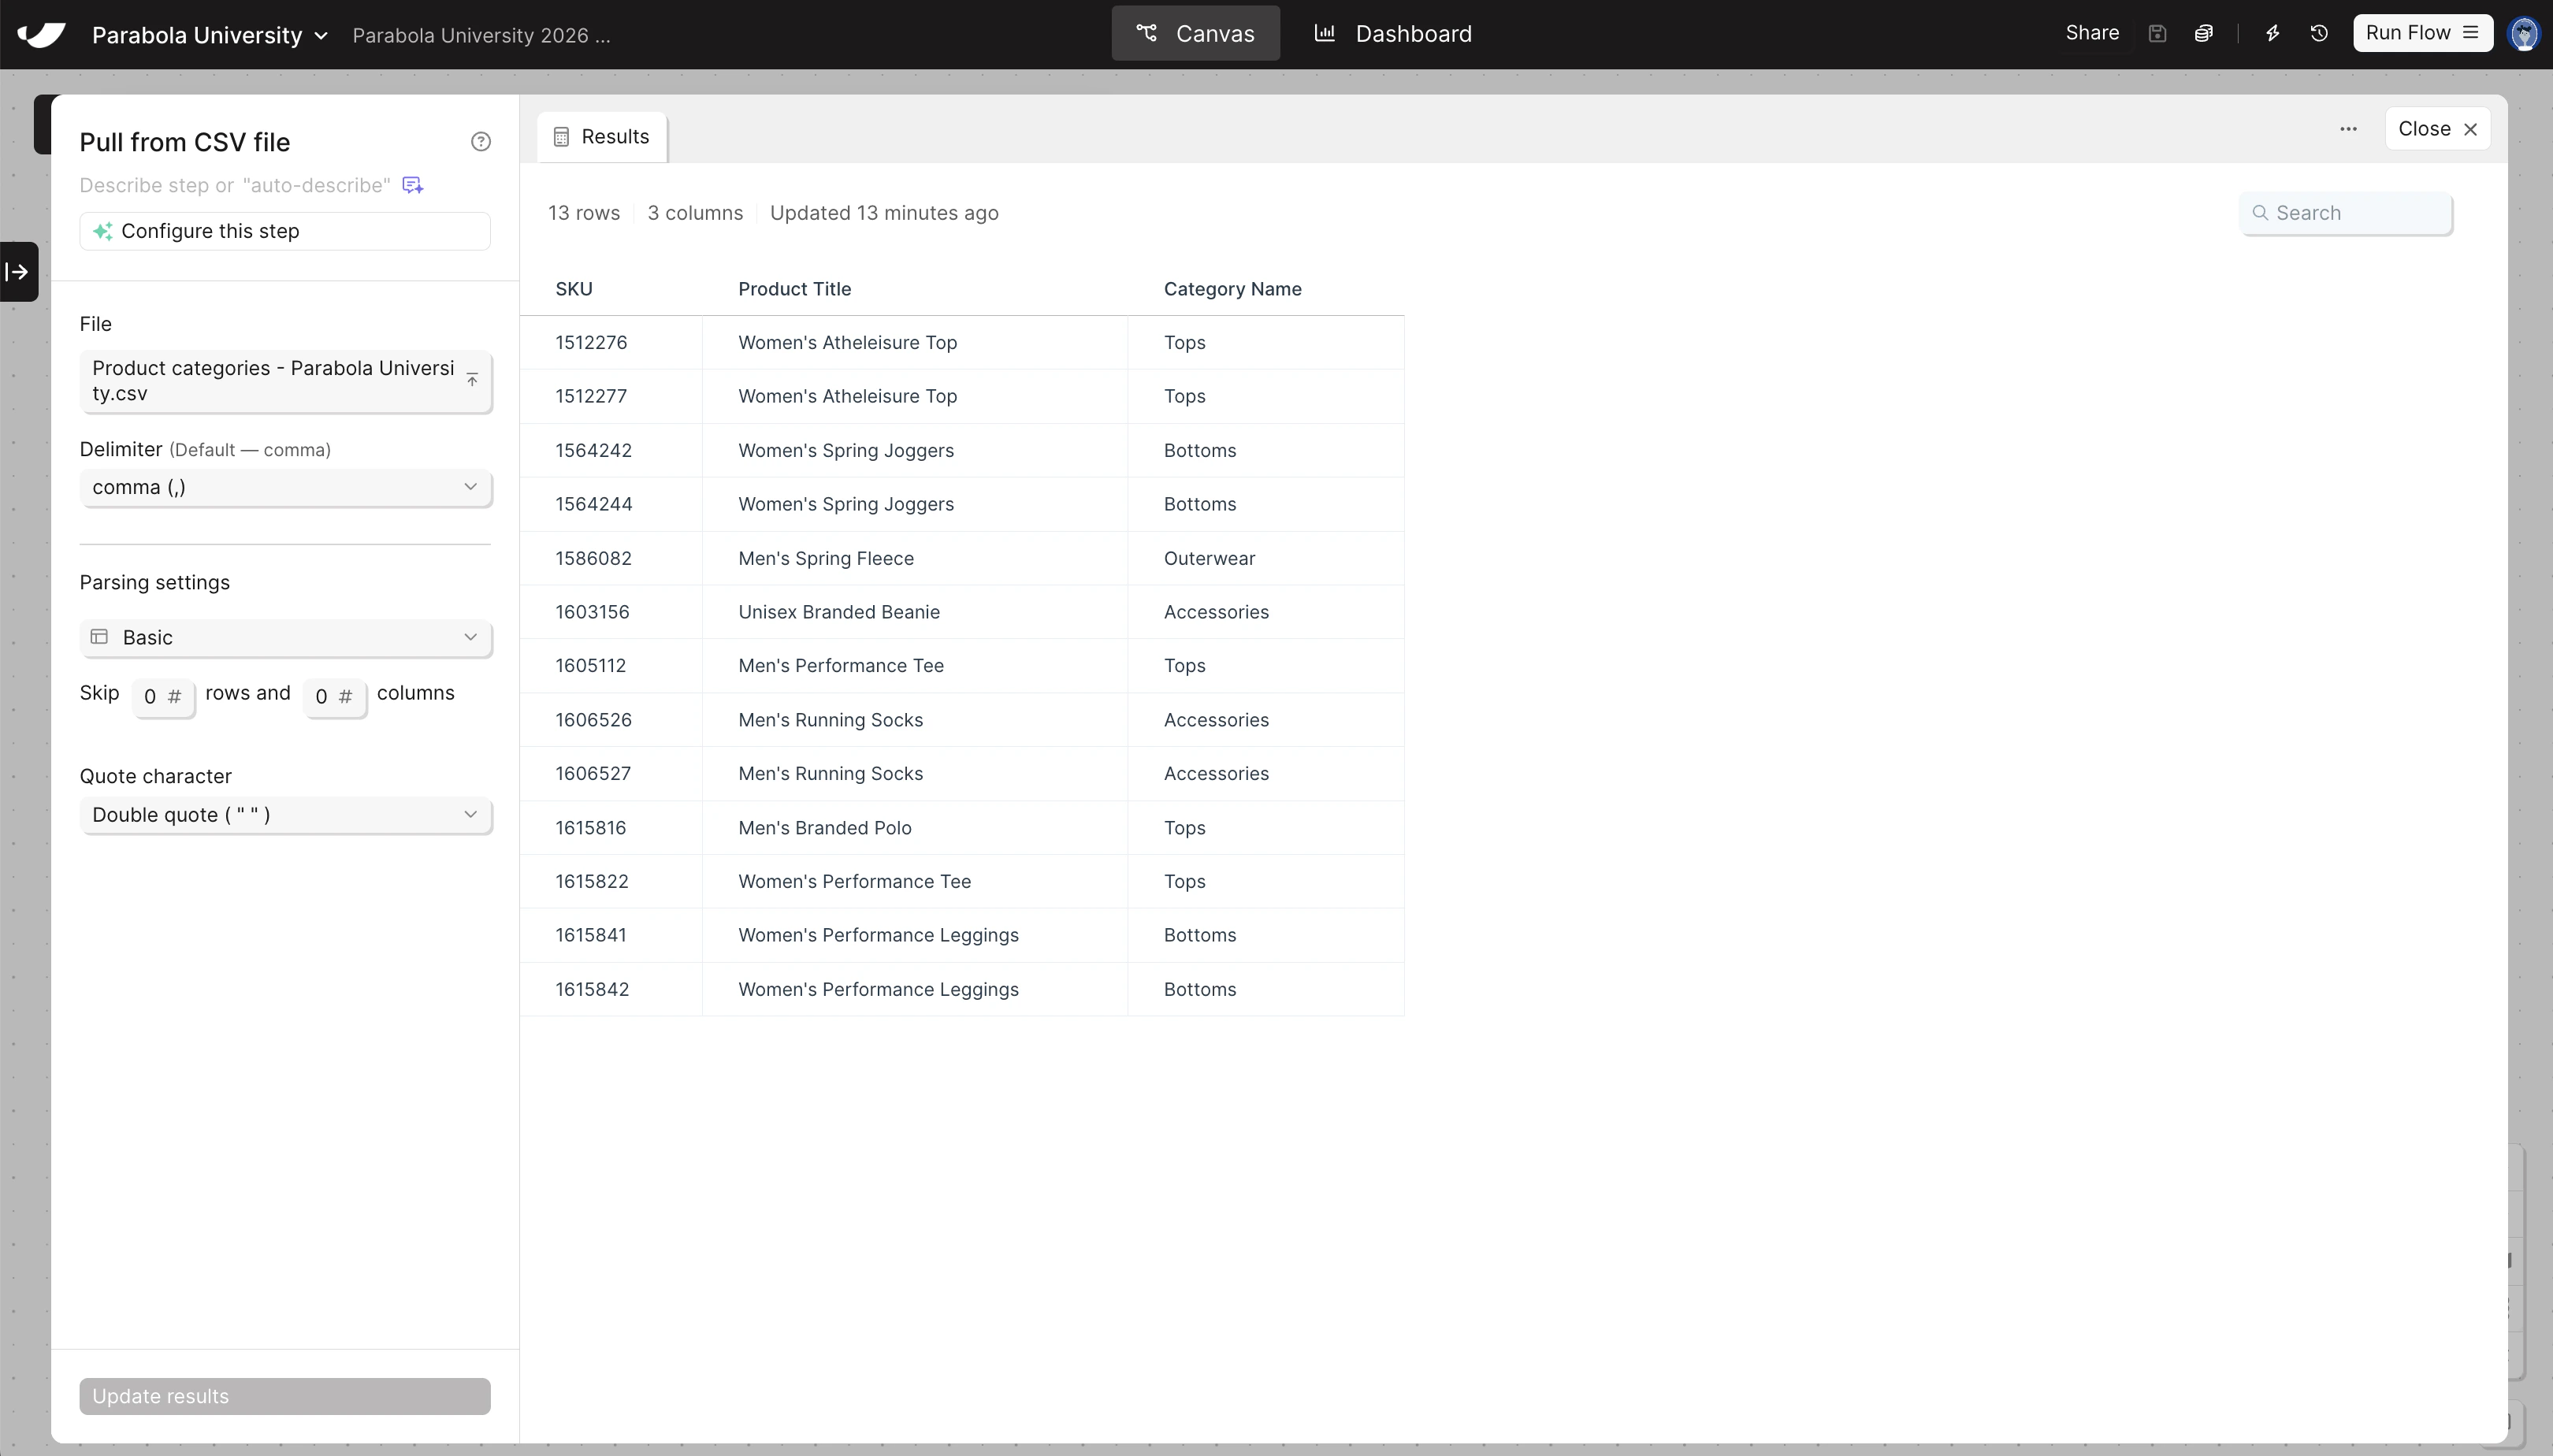
Search for Pull from CSV file and drag it onto the canvas, then upload your product categories file
Once the step is on the canvas, double-click to open the step, and then click “Upload a file” to pull in your data.
3
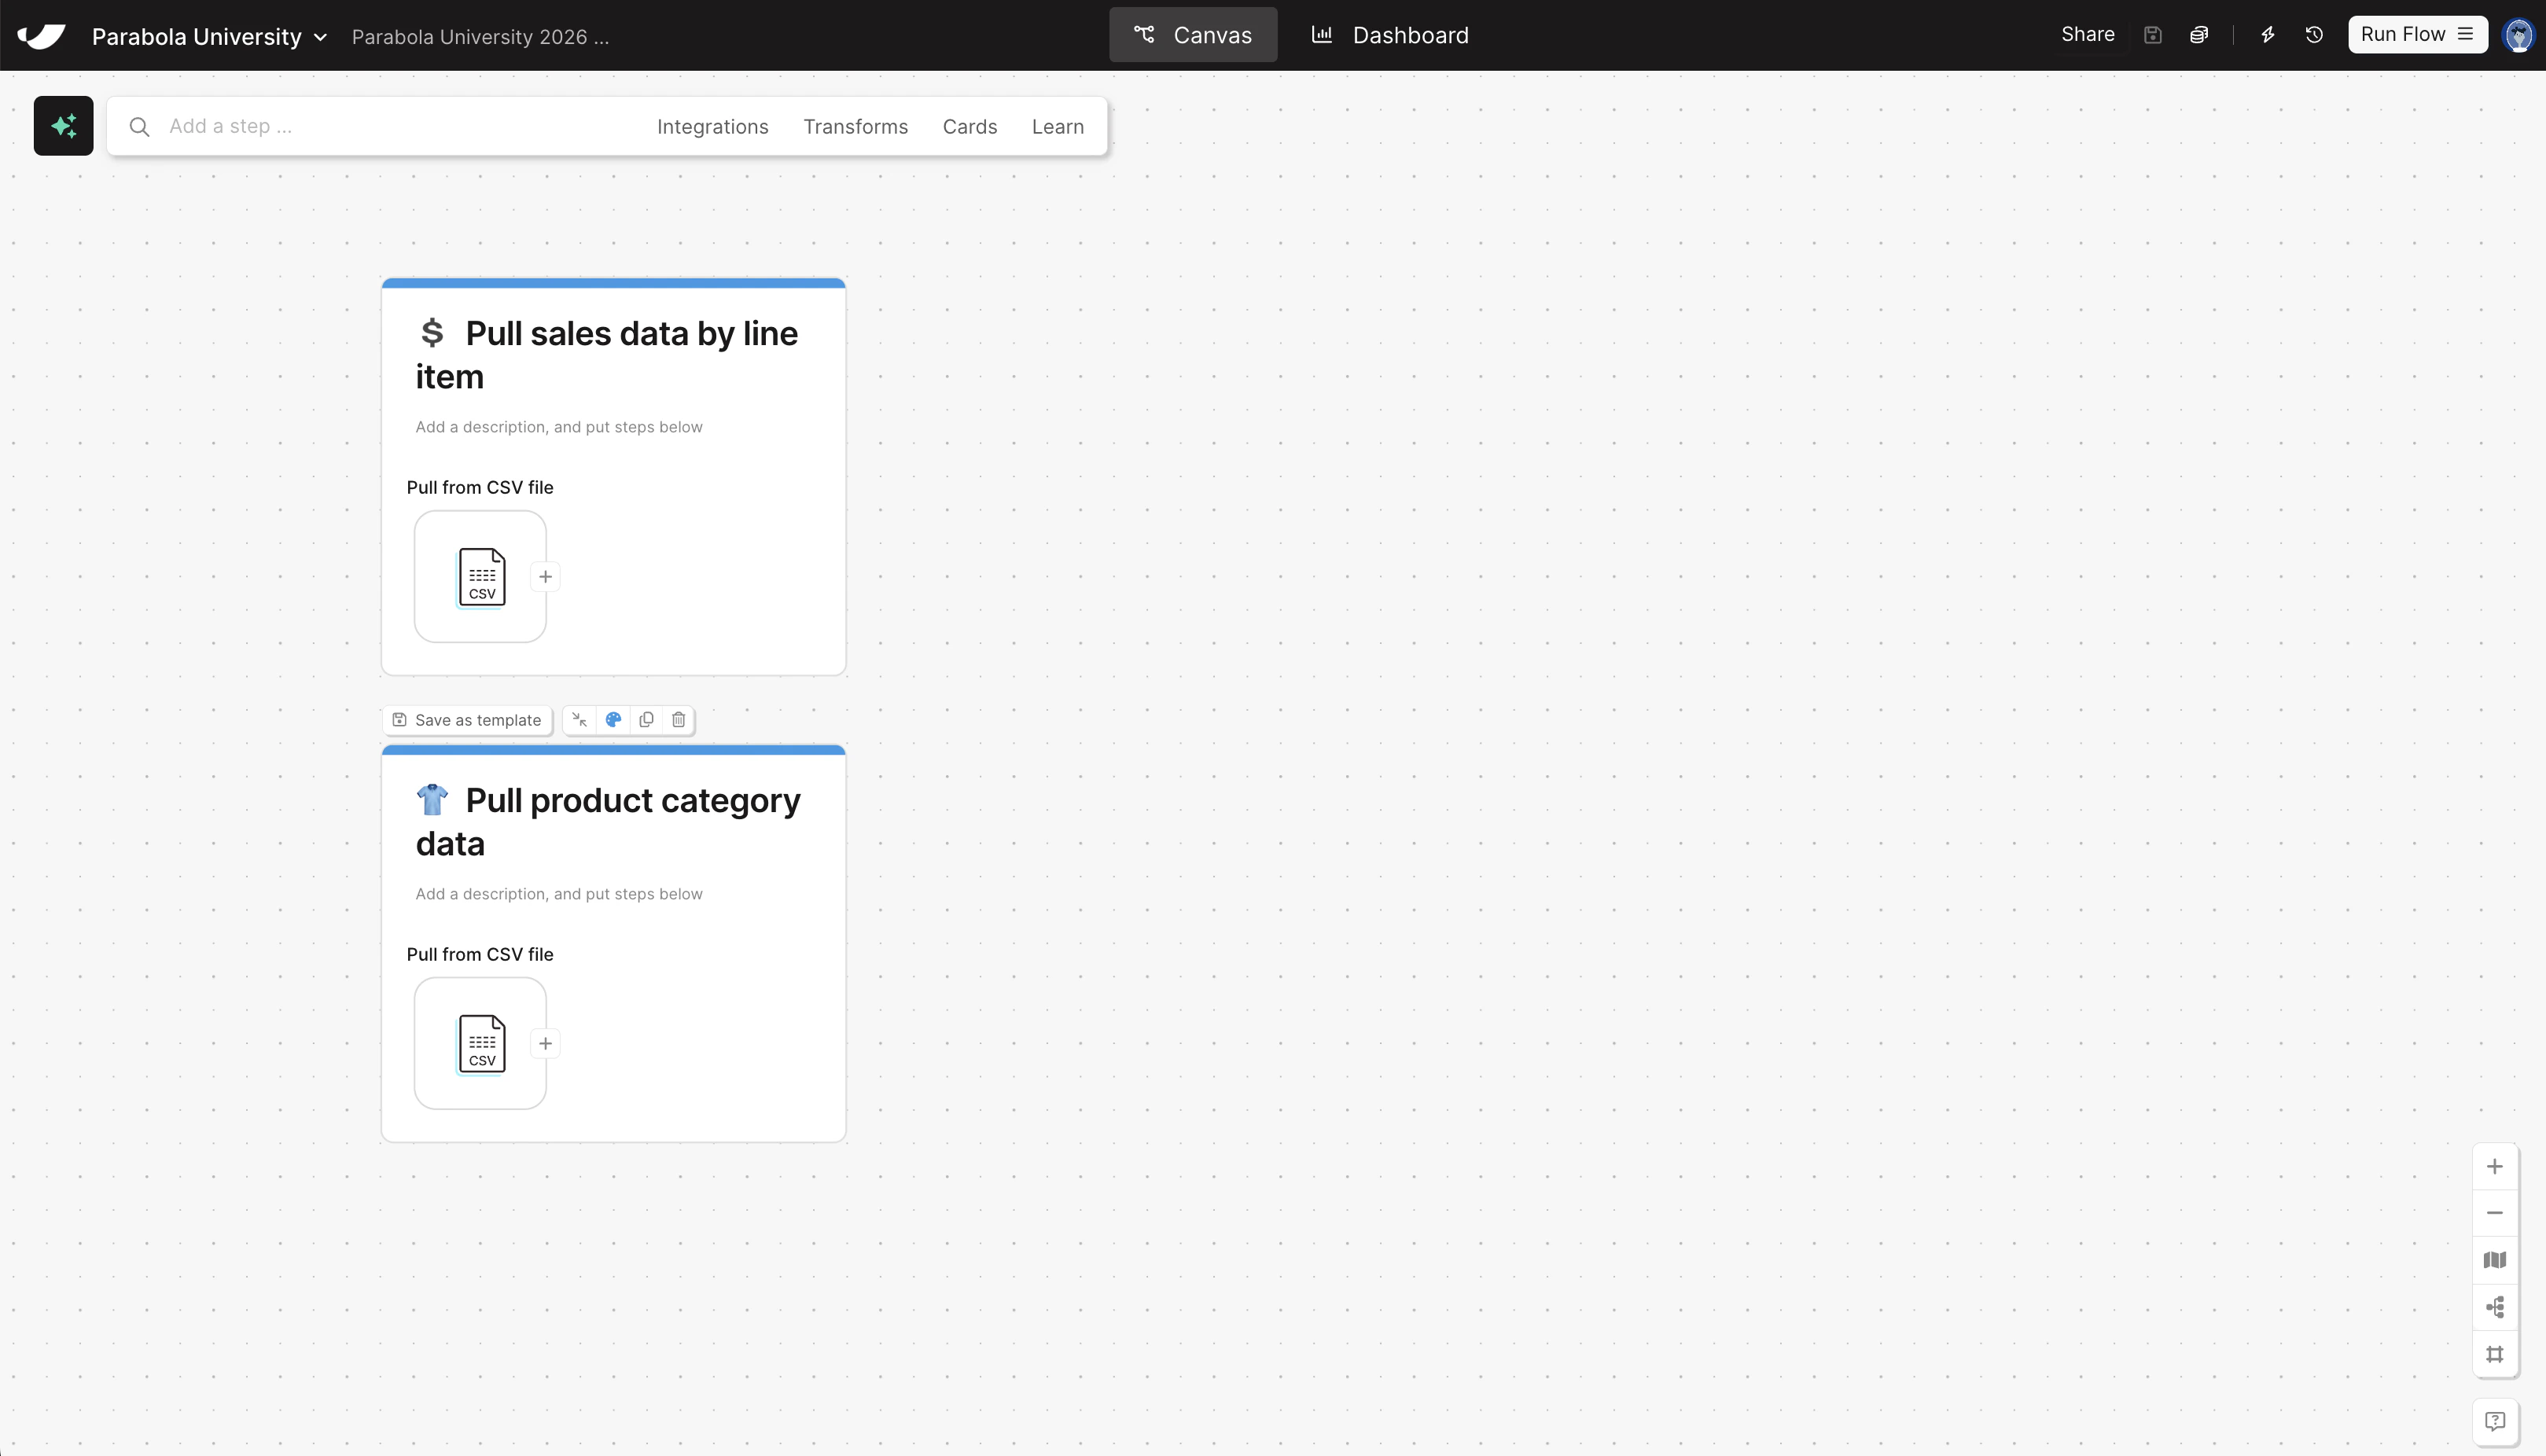
Put each step onto its own card to add documentation to your flow
You can add cards by right-clicking on the canvas, or by clicking Cards → Add new card in the search bar up top. Give your cards the following titles:
- Pull sales data by line item
- Pull product category data
Check your work
Check your work