Building challenge
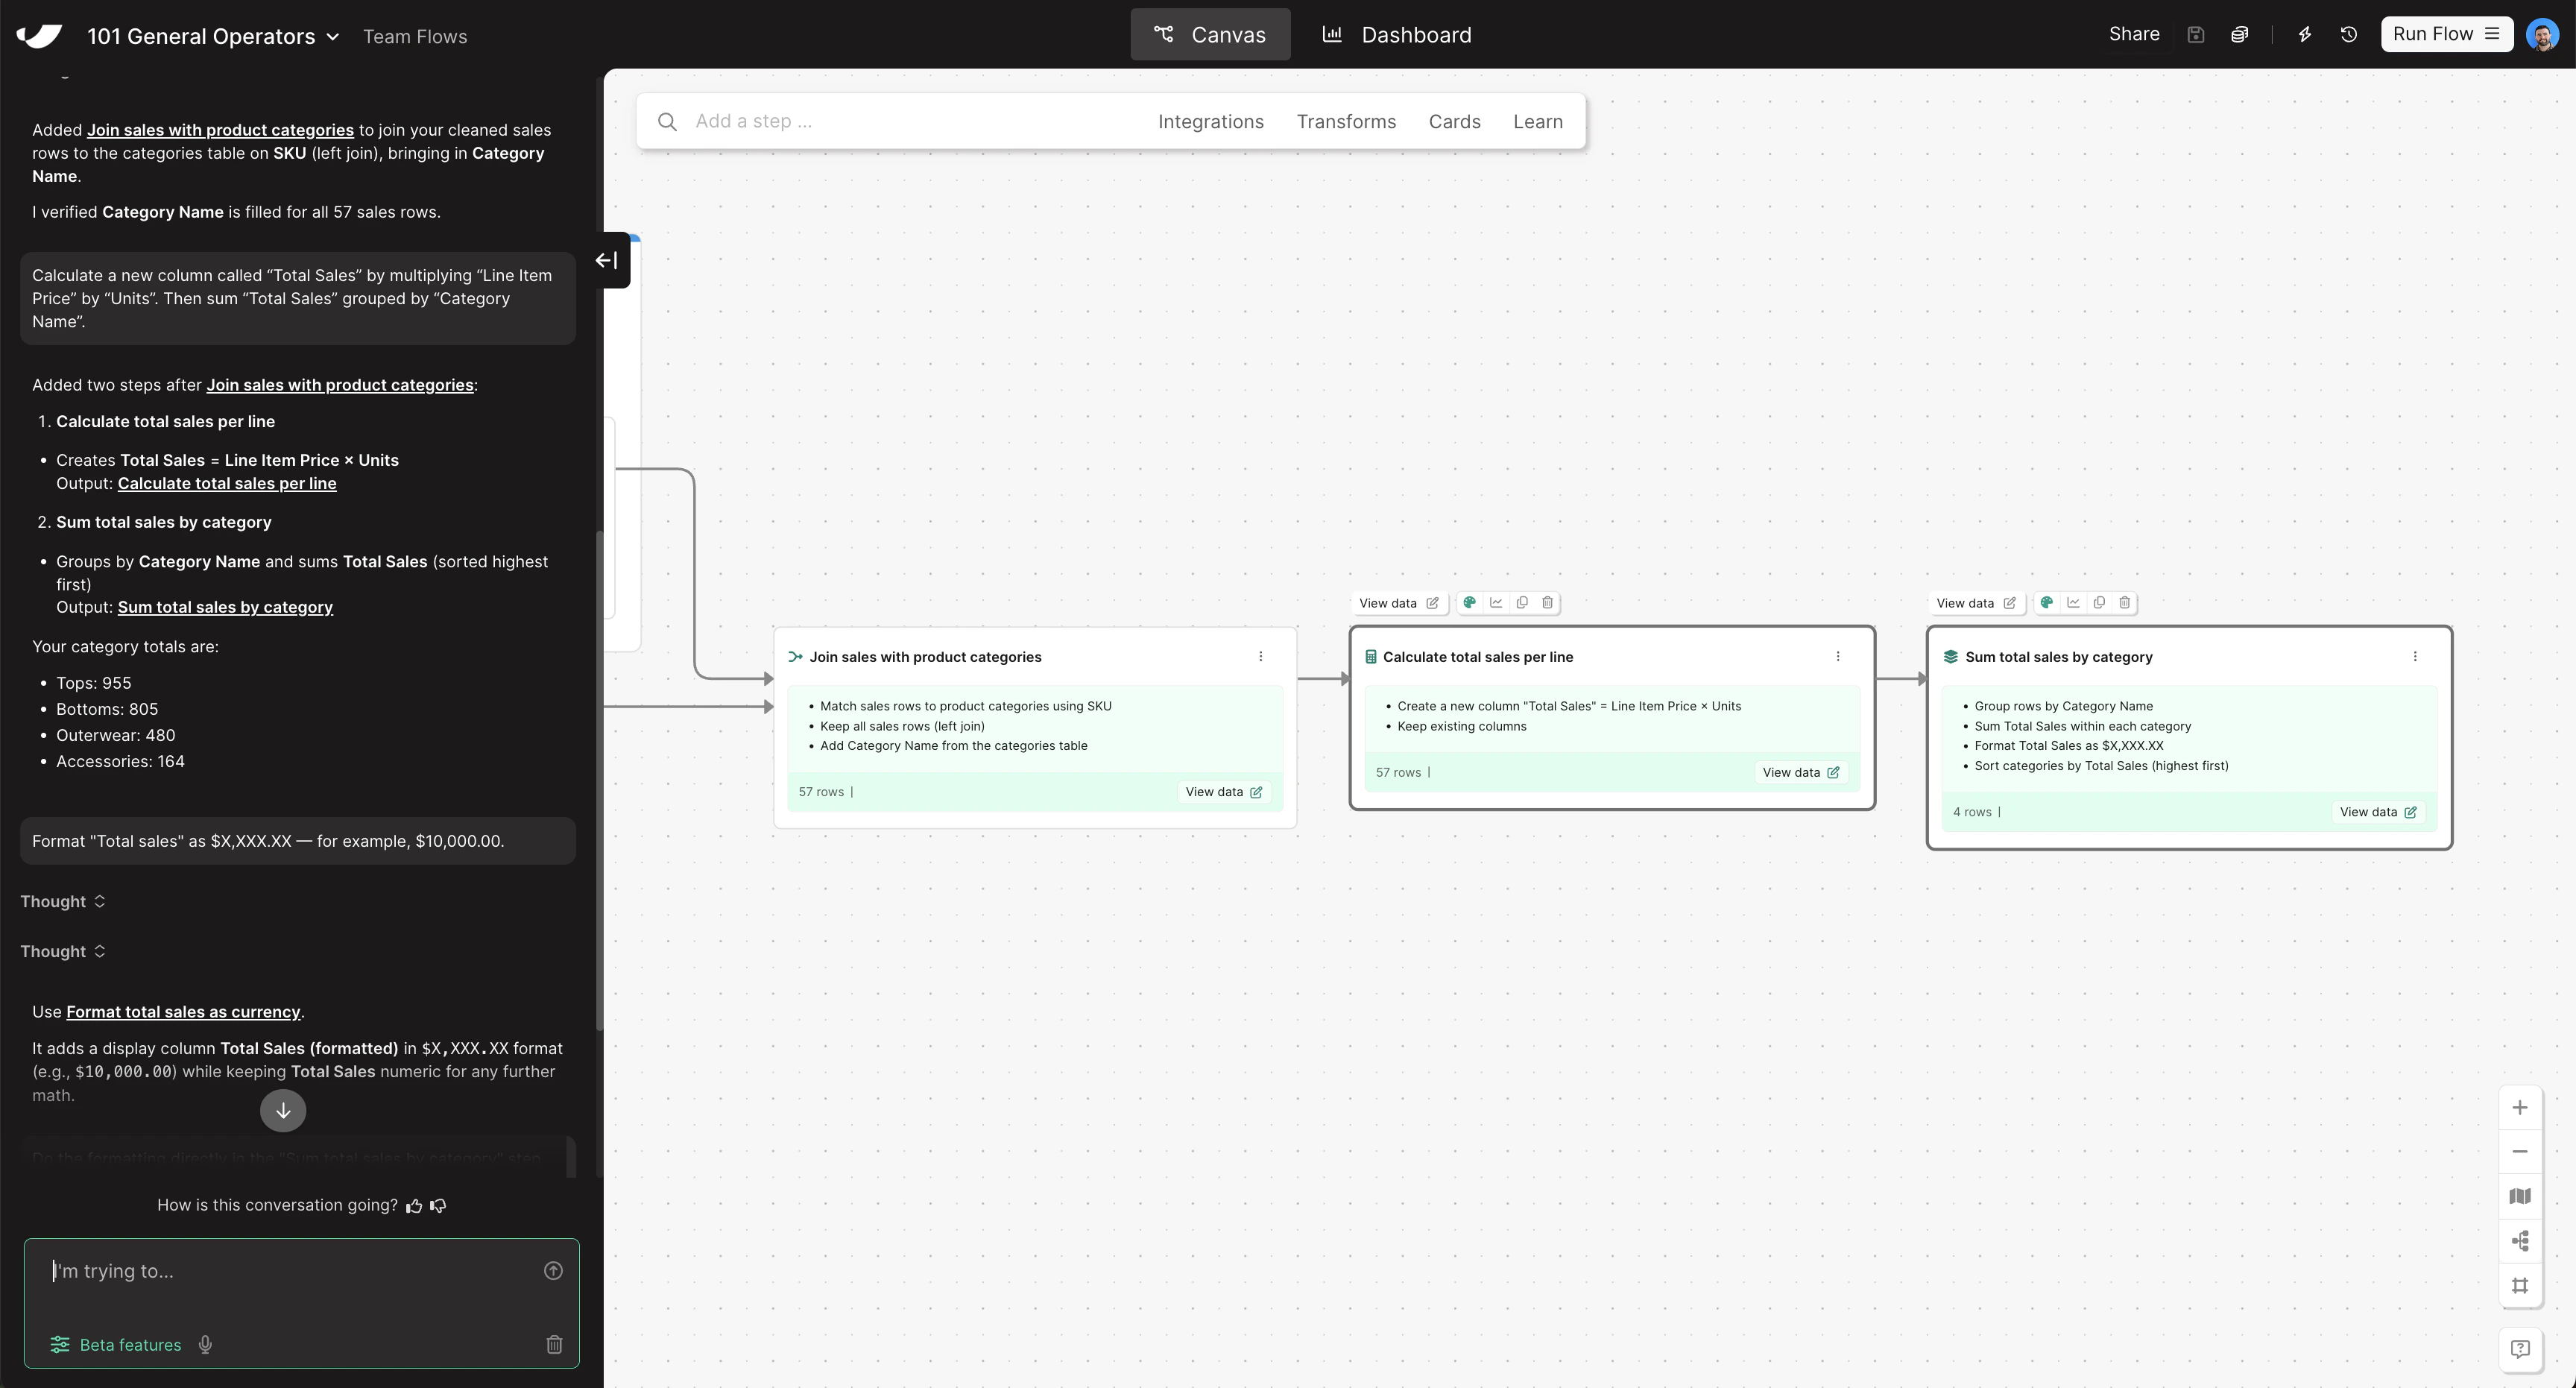
With your data combined, calculate revenue per line item and roll it up by category to produce the final Sales by Category summary. Copy and paste this prompt into Parabola:
Check your work
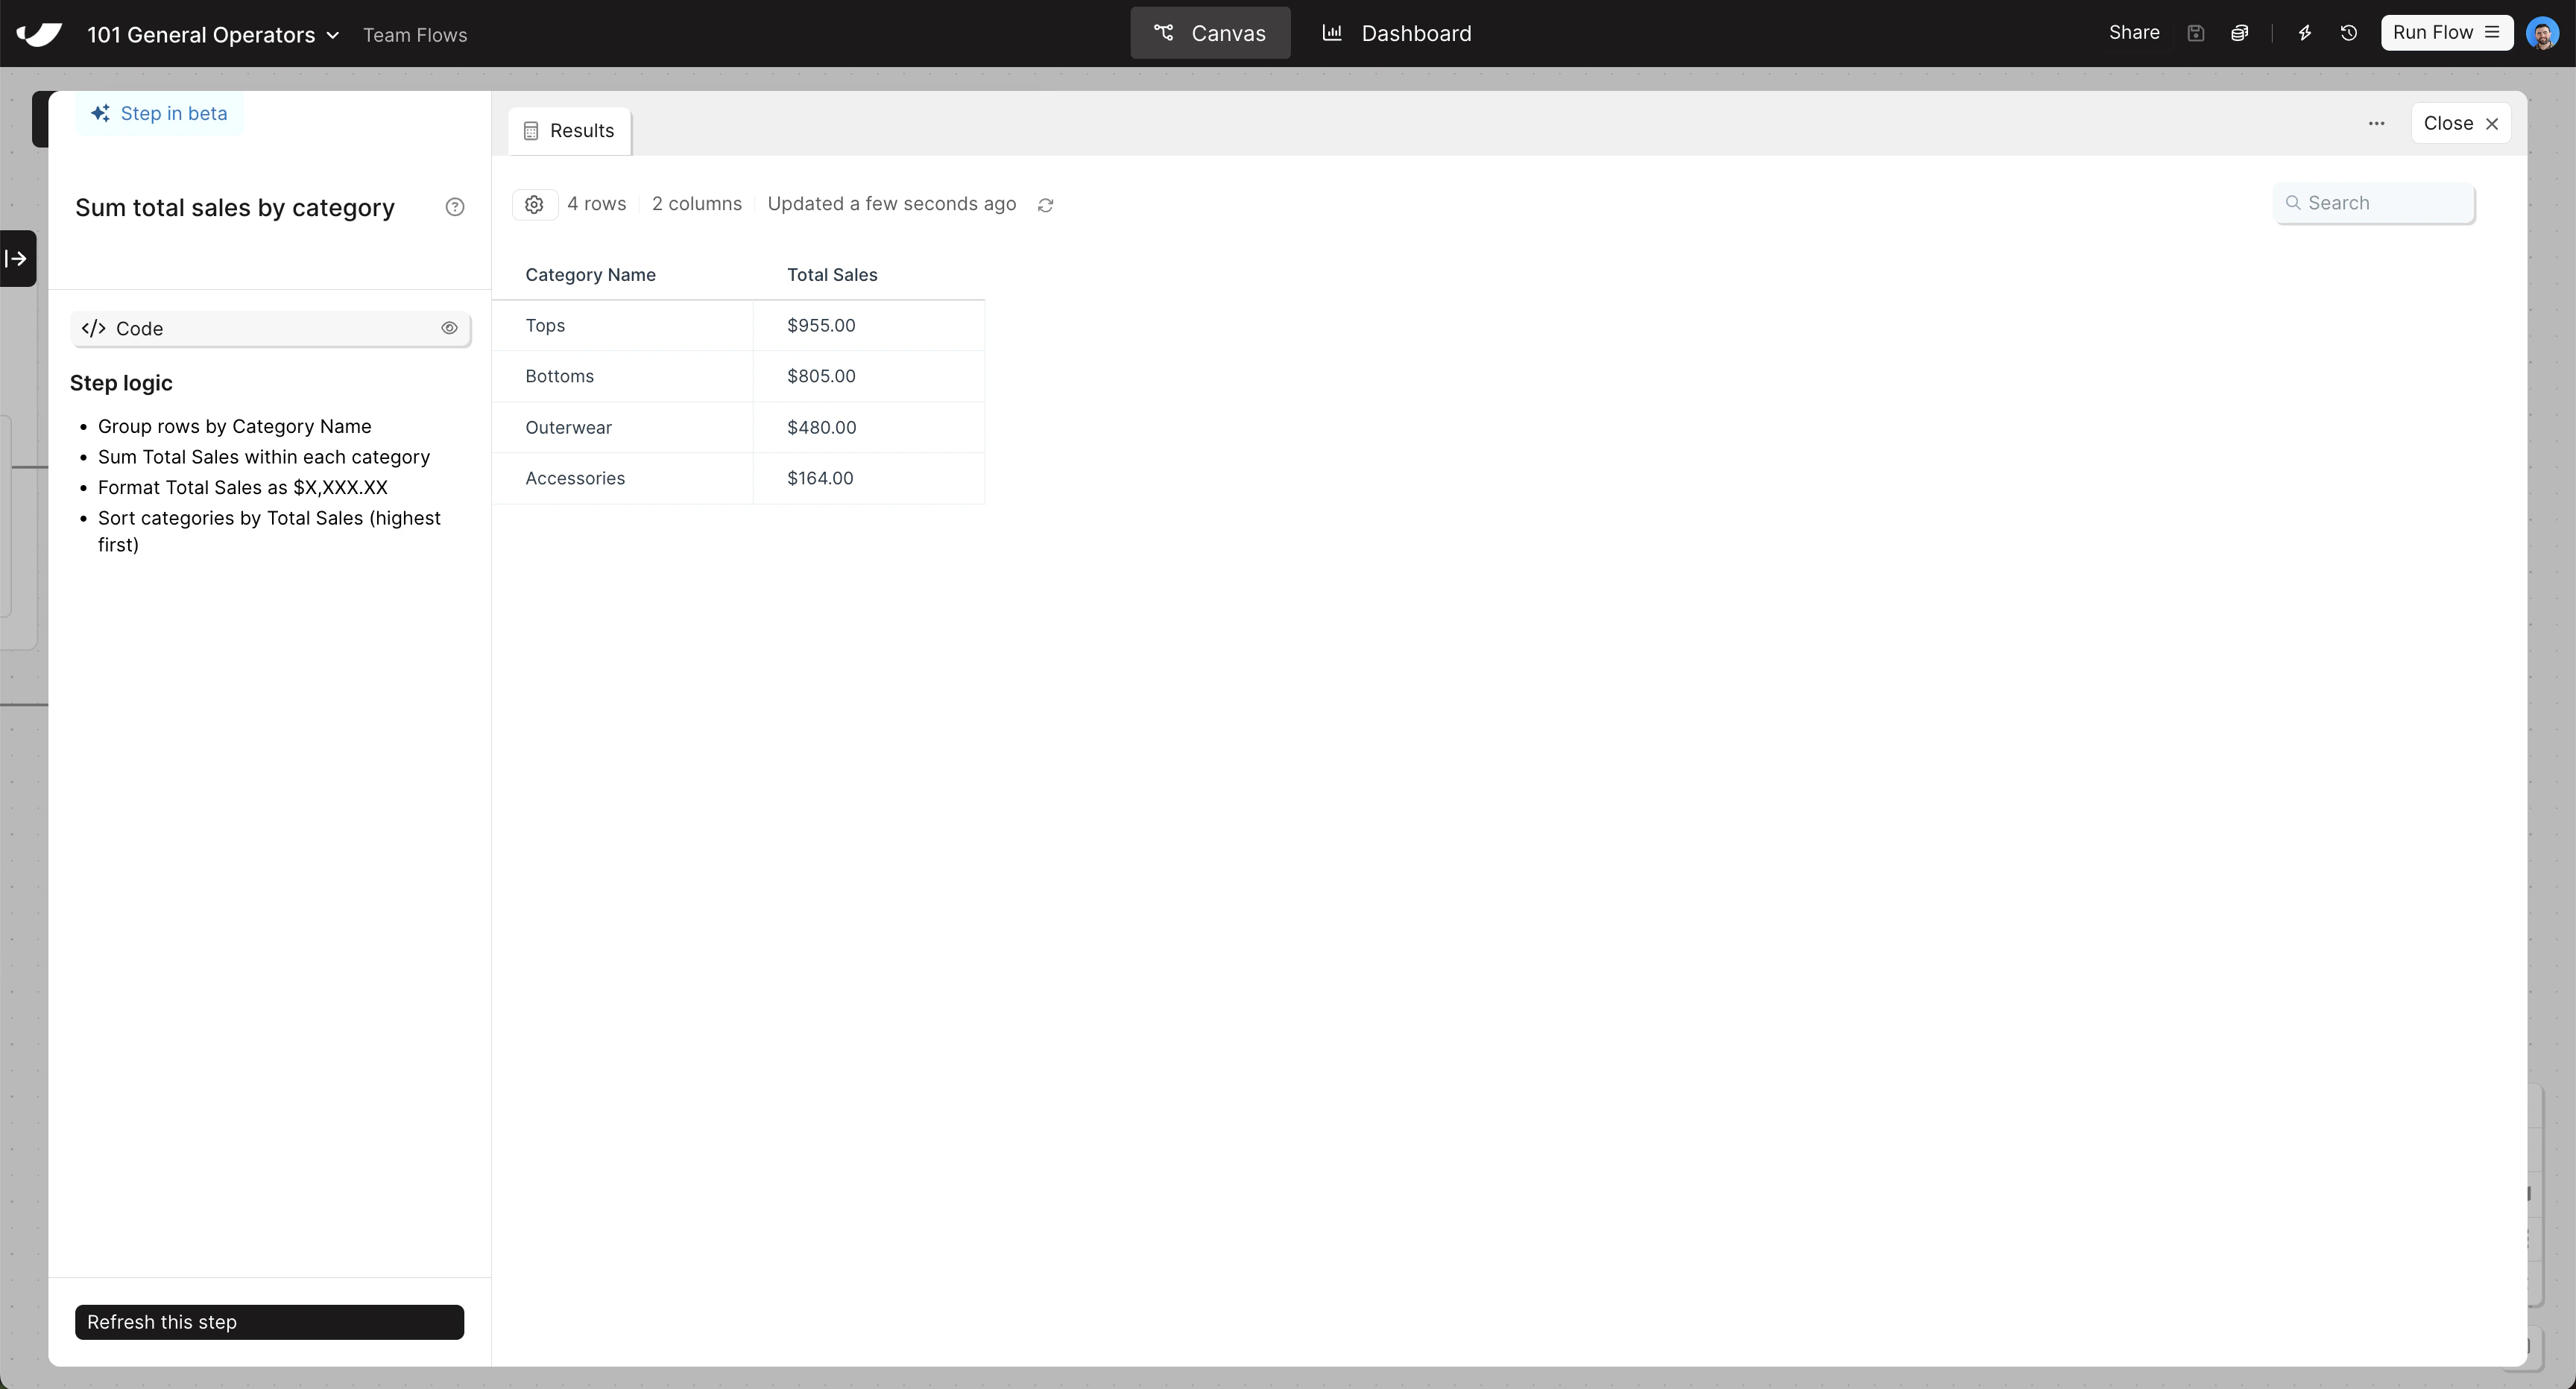
Check your work
The steps added to your canvas and their exact documentation may differ from what you see below — every AI response is unique. The important thing is that your resulting data set matches what you see here.