Building challenge
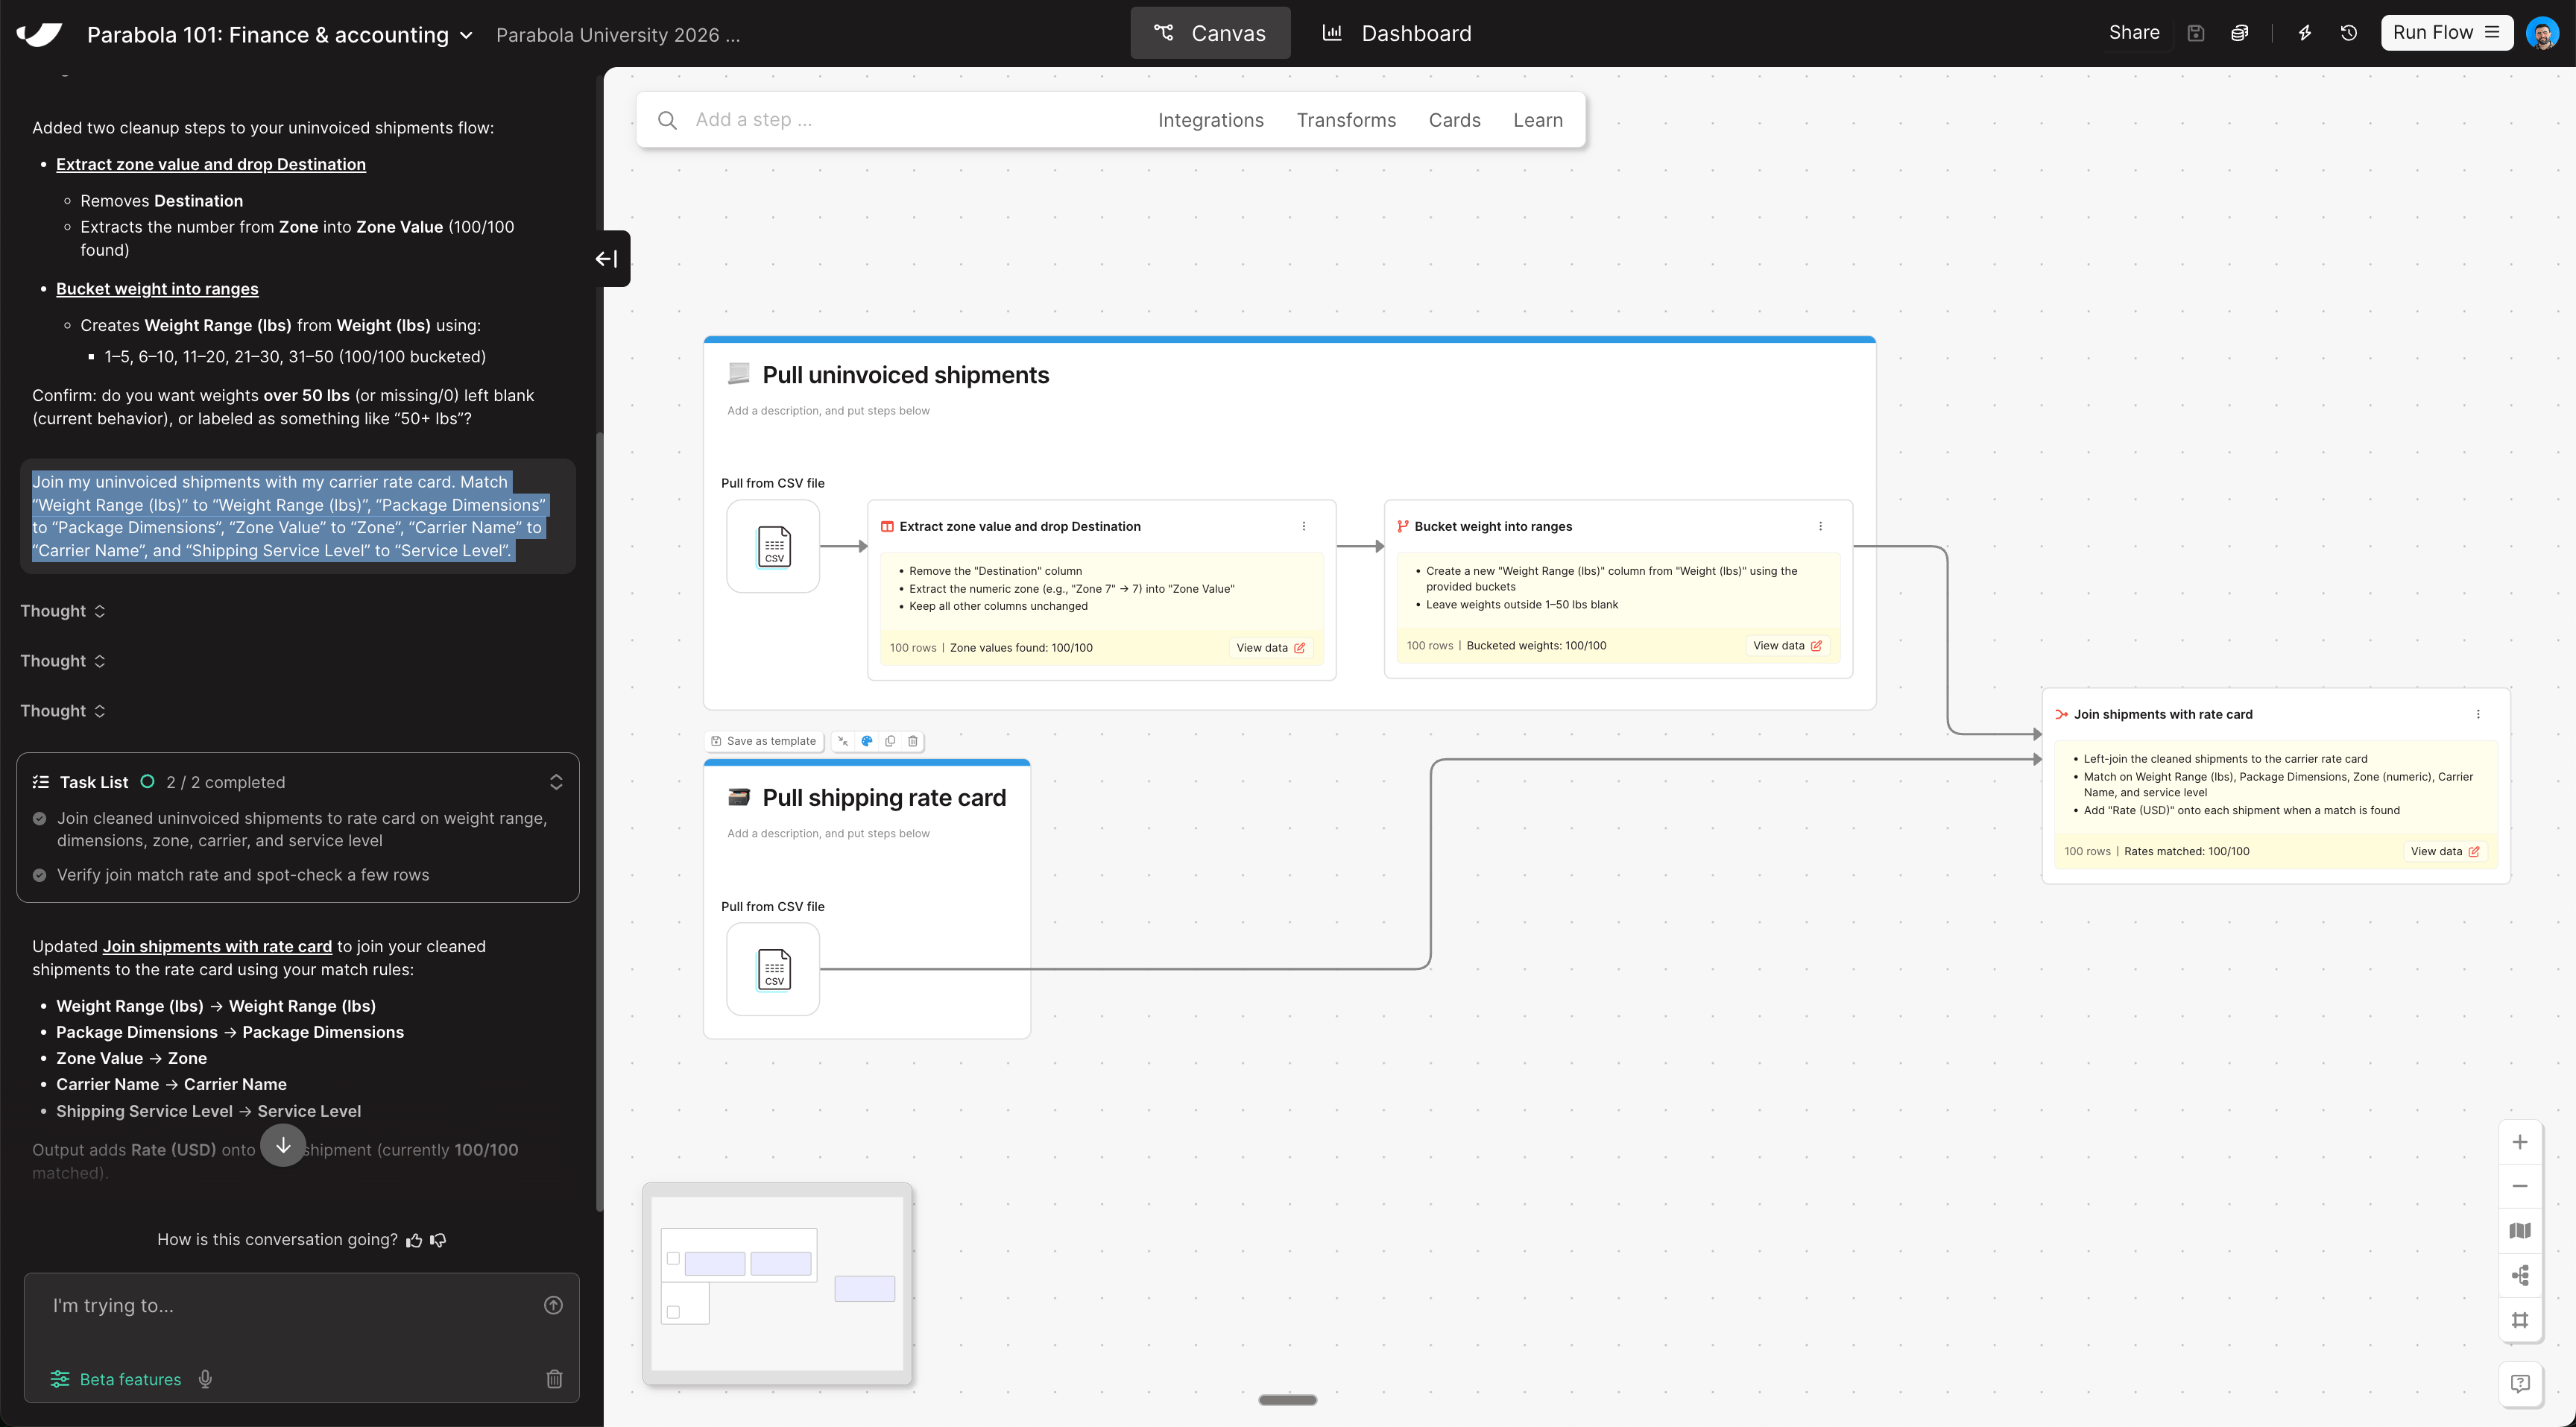
Now that your shipments data is prepared, join it to the rate card to look up the expected shipping cost for each uninvoiced shipment.
1
Copy and paste this prompt into Parabola to combine your data sets
2
Rearrange the combined step so it sits to the right of your two pull data cards
The join step should live outside of any card, connected directly to the outputs of both pull steps.
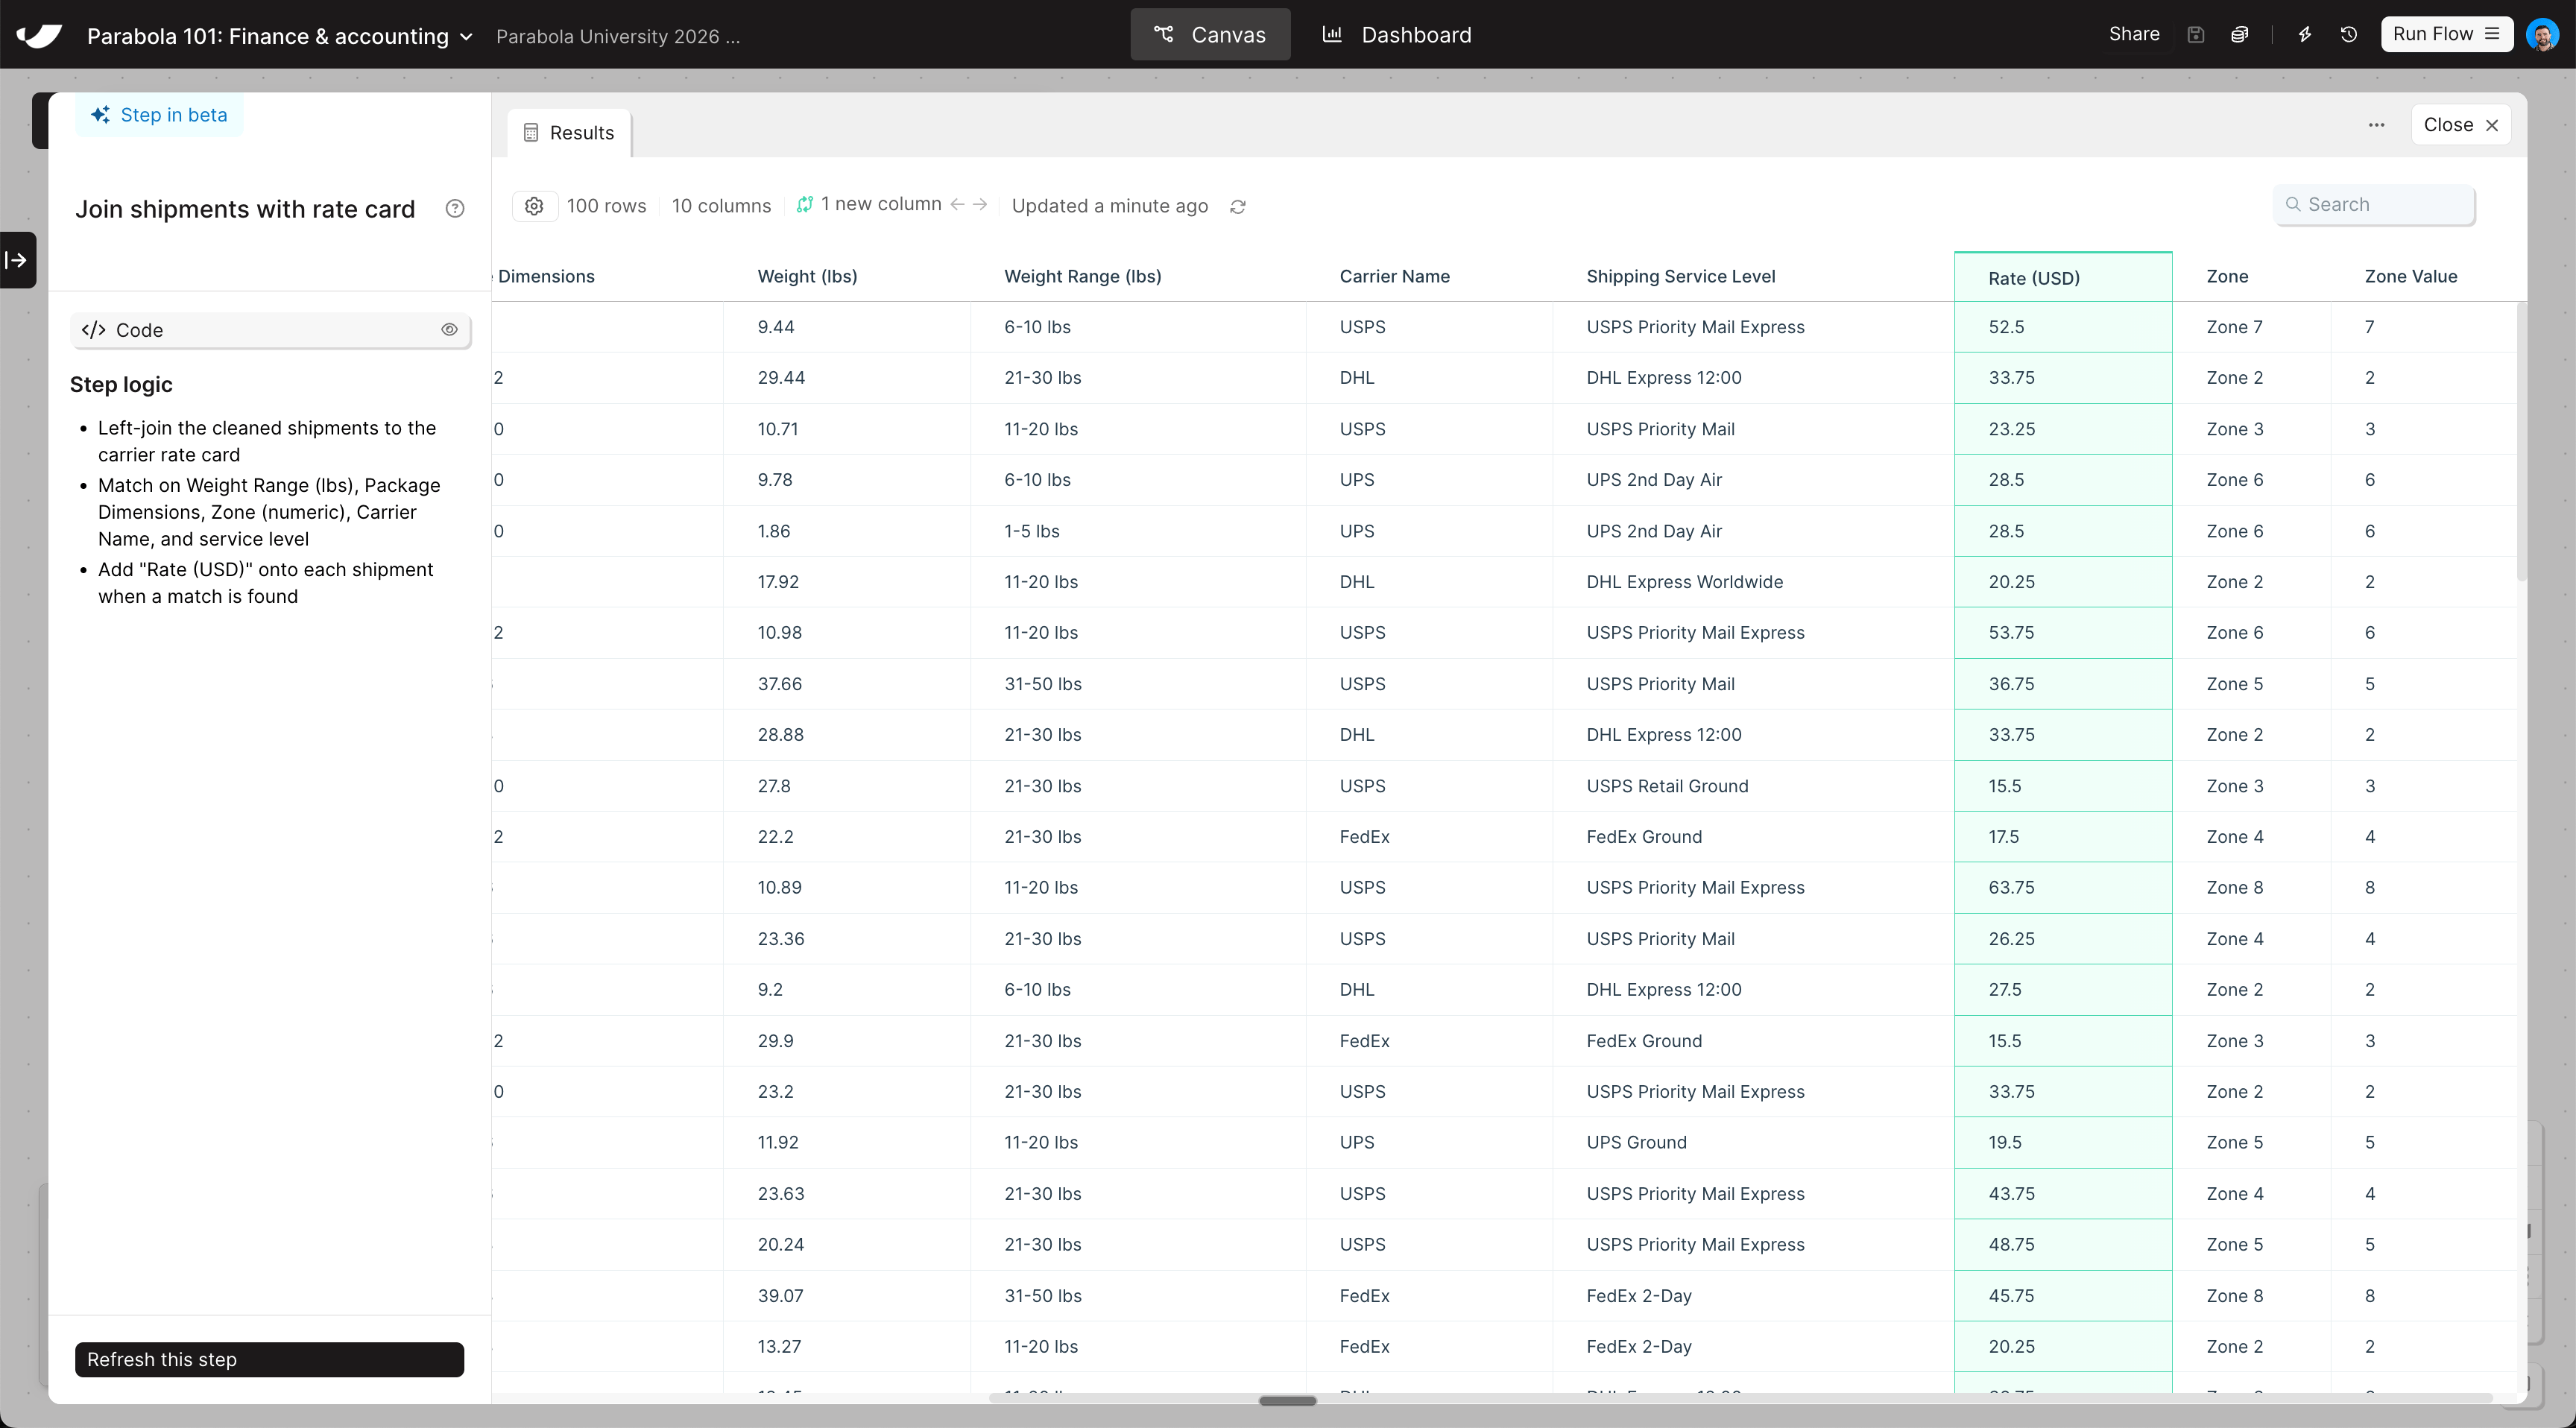
Check your work
Check your work
The steps added to your canvas and their exact documentation may differ from what you see below — every AI response is unique. The important thing is that your resulting data set matches what you see here.