List of Transforms
Transform step:
Add date & time
The Add date & time step adds a column with the current date and time, with customizable offset by days and timezones. The current date and time will be determined at the time the flow is run. This step can be useful for tasks like logging updated times.
Input/output
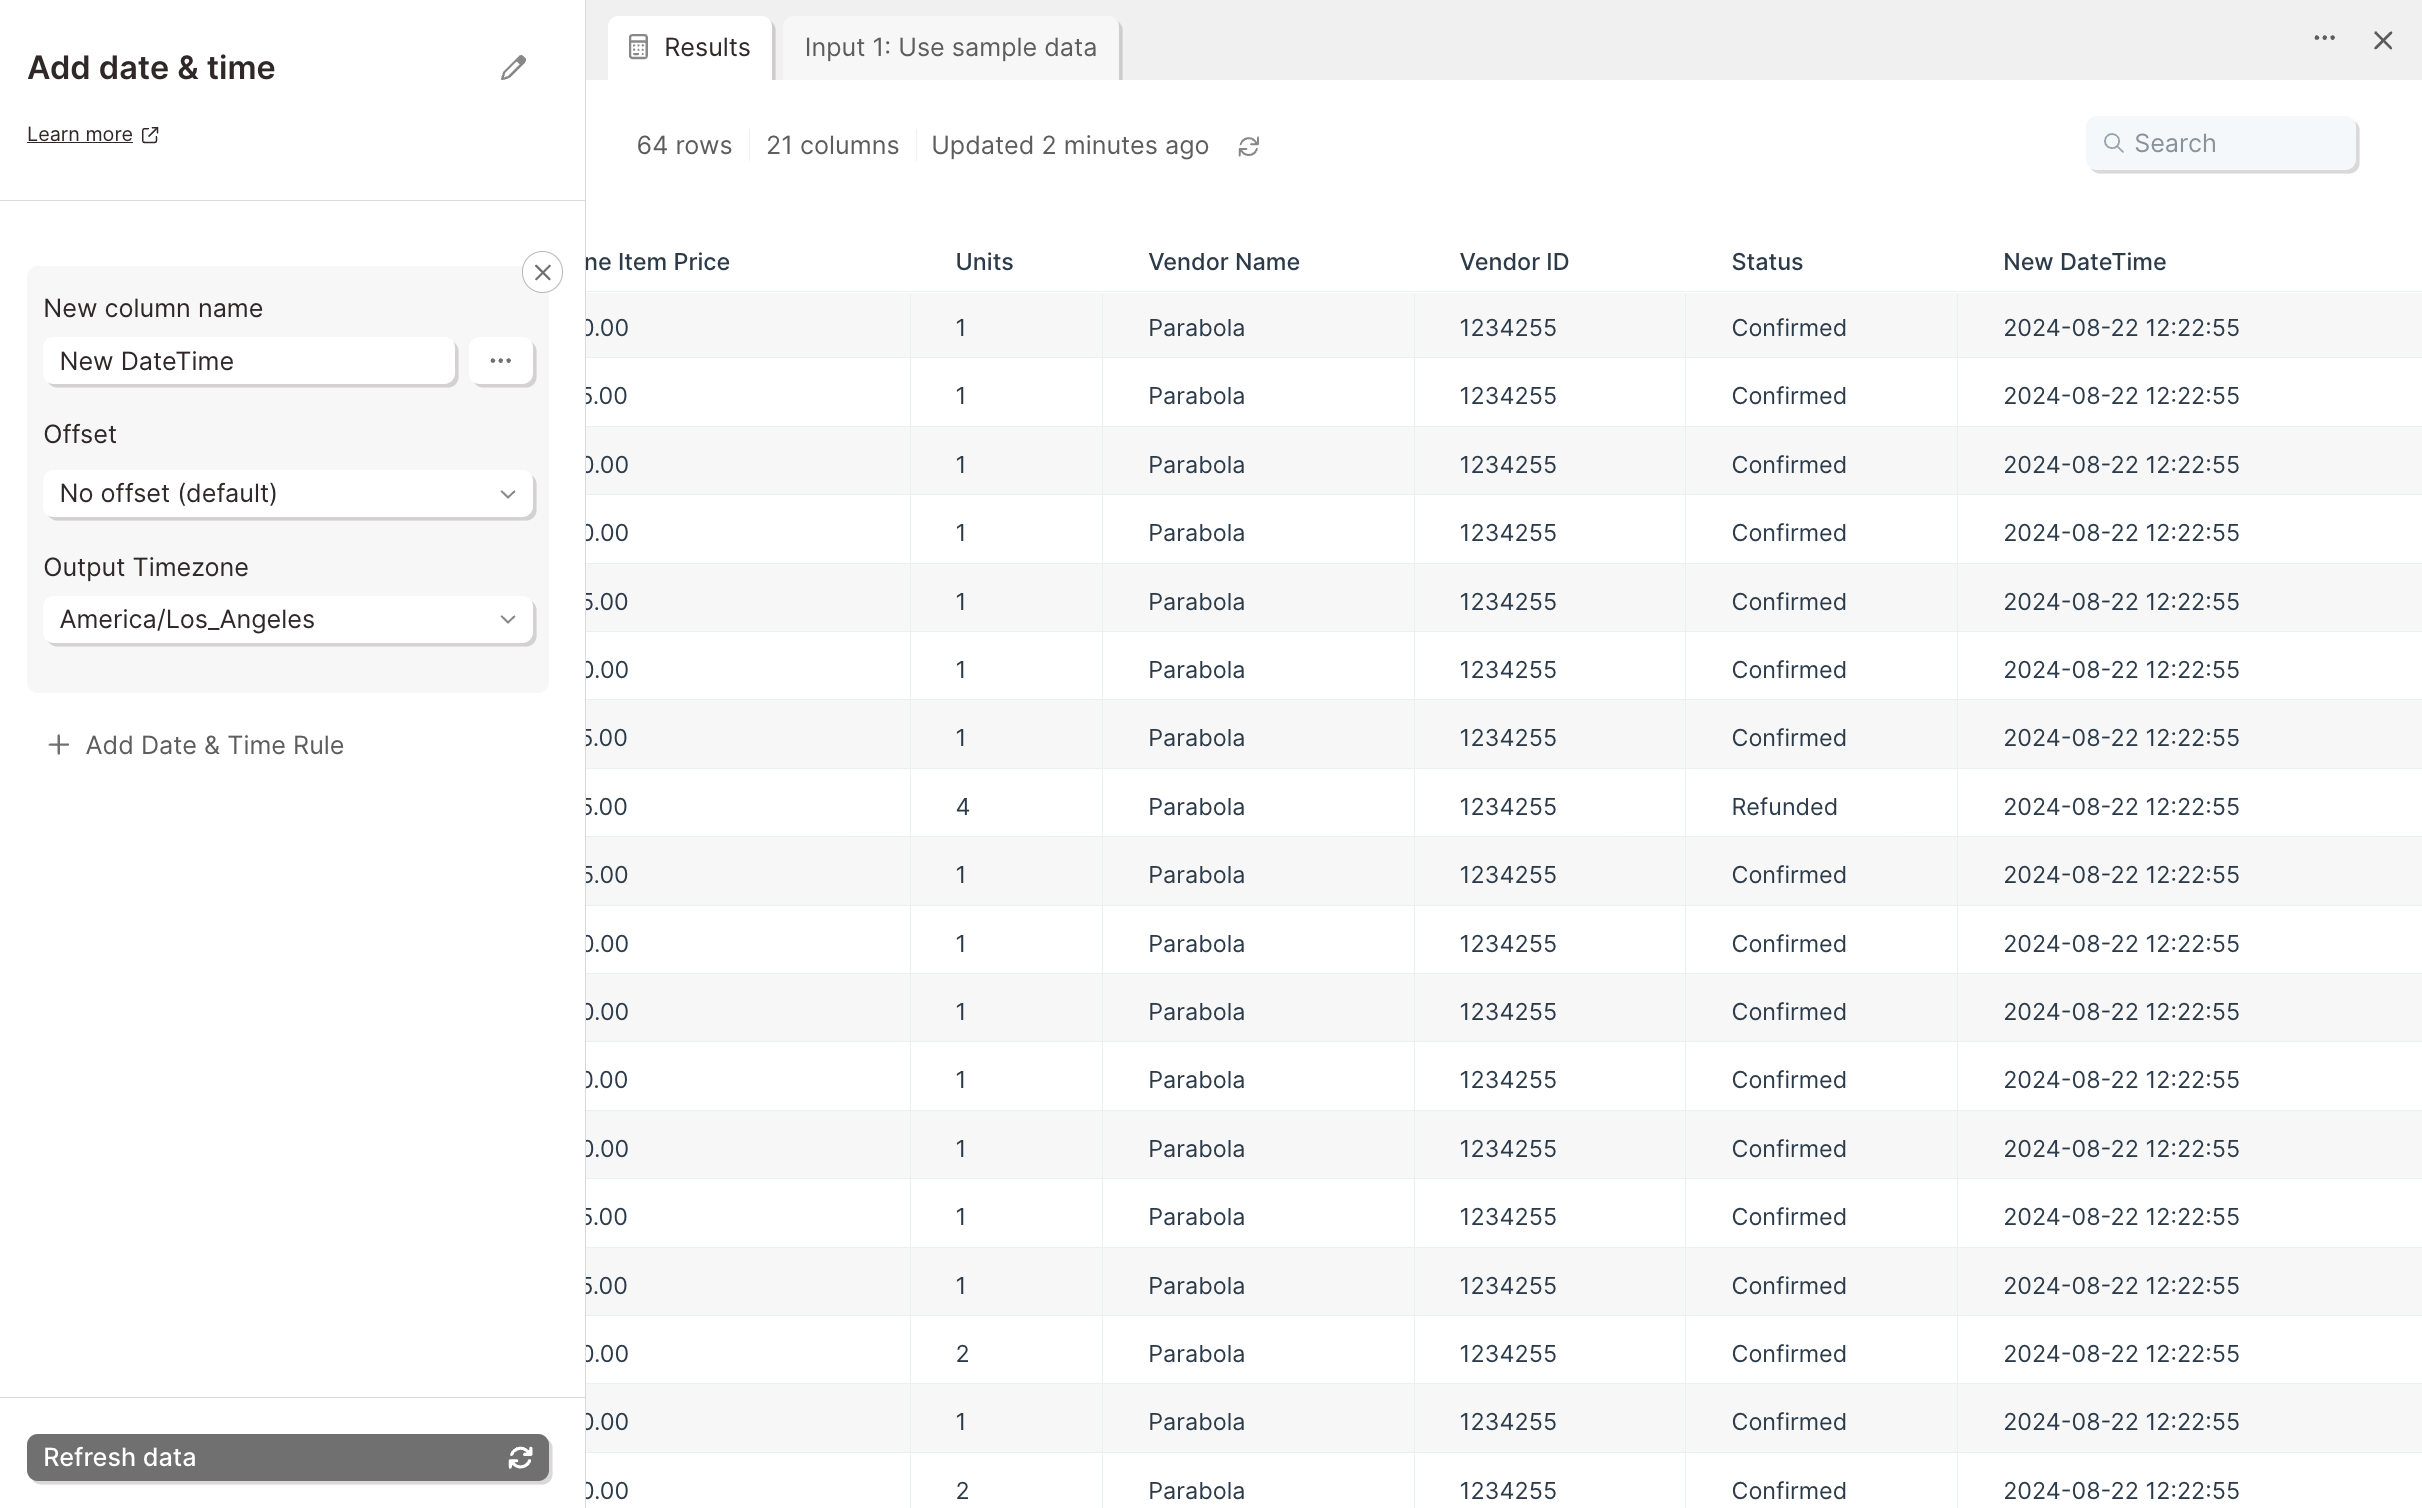
Connect any data into this step. It'll give you the output data of a 'New DateTime' column appended to your dataset where the current date and time is noted (based on when the flow is run).
Default settings
By default, this step will have 'New DateTime' in the 'Column name' field, but you can customize this name to anything you prefer.
All date and time values created look like this format: 2019-09-18 12:33:09 (which is a format of YYYY-MM-DD hh:mm:ss). If you prefer a different format, connect a Format dates step right after this one to get the date values in your preferred way.
Custom settings
A date that is 0 days offset will be the current date and time. If you choose a positive value, it will be in the future, while a negative value will be in the past. If we add 1 to the 'Offset' field, it shows us the date time stamp for this time tomorrow. If we add -1 to the 'Offset' field, it'll show us the date and time stamp for this time yesterday.
You can click 'Add Date & Time Rule' to add multiple dates using a single step. Each rule will make a new column and the values of the column will be the same for every row. You might make multiple columns if you need the current date and time across different time zones or you want to have columns of varying offsets.
Transform step:
Add growth rate
The Add growth rate step calculates the growth rate from the previous row within a column of your choosing.
Input/output
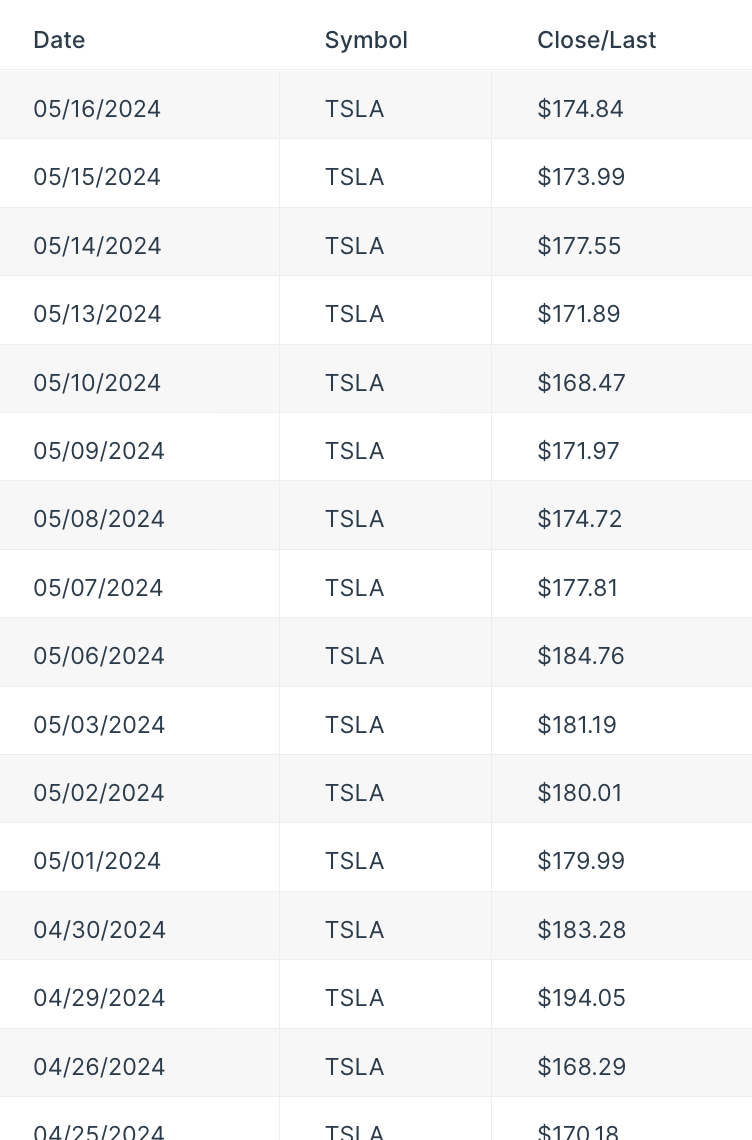
The data we'll connect into this step shows us the change in a specific stock price over time.
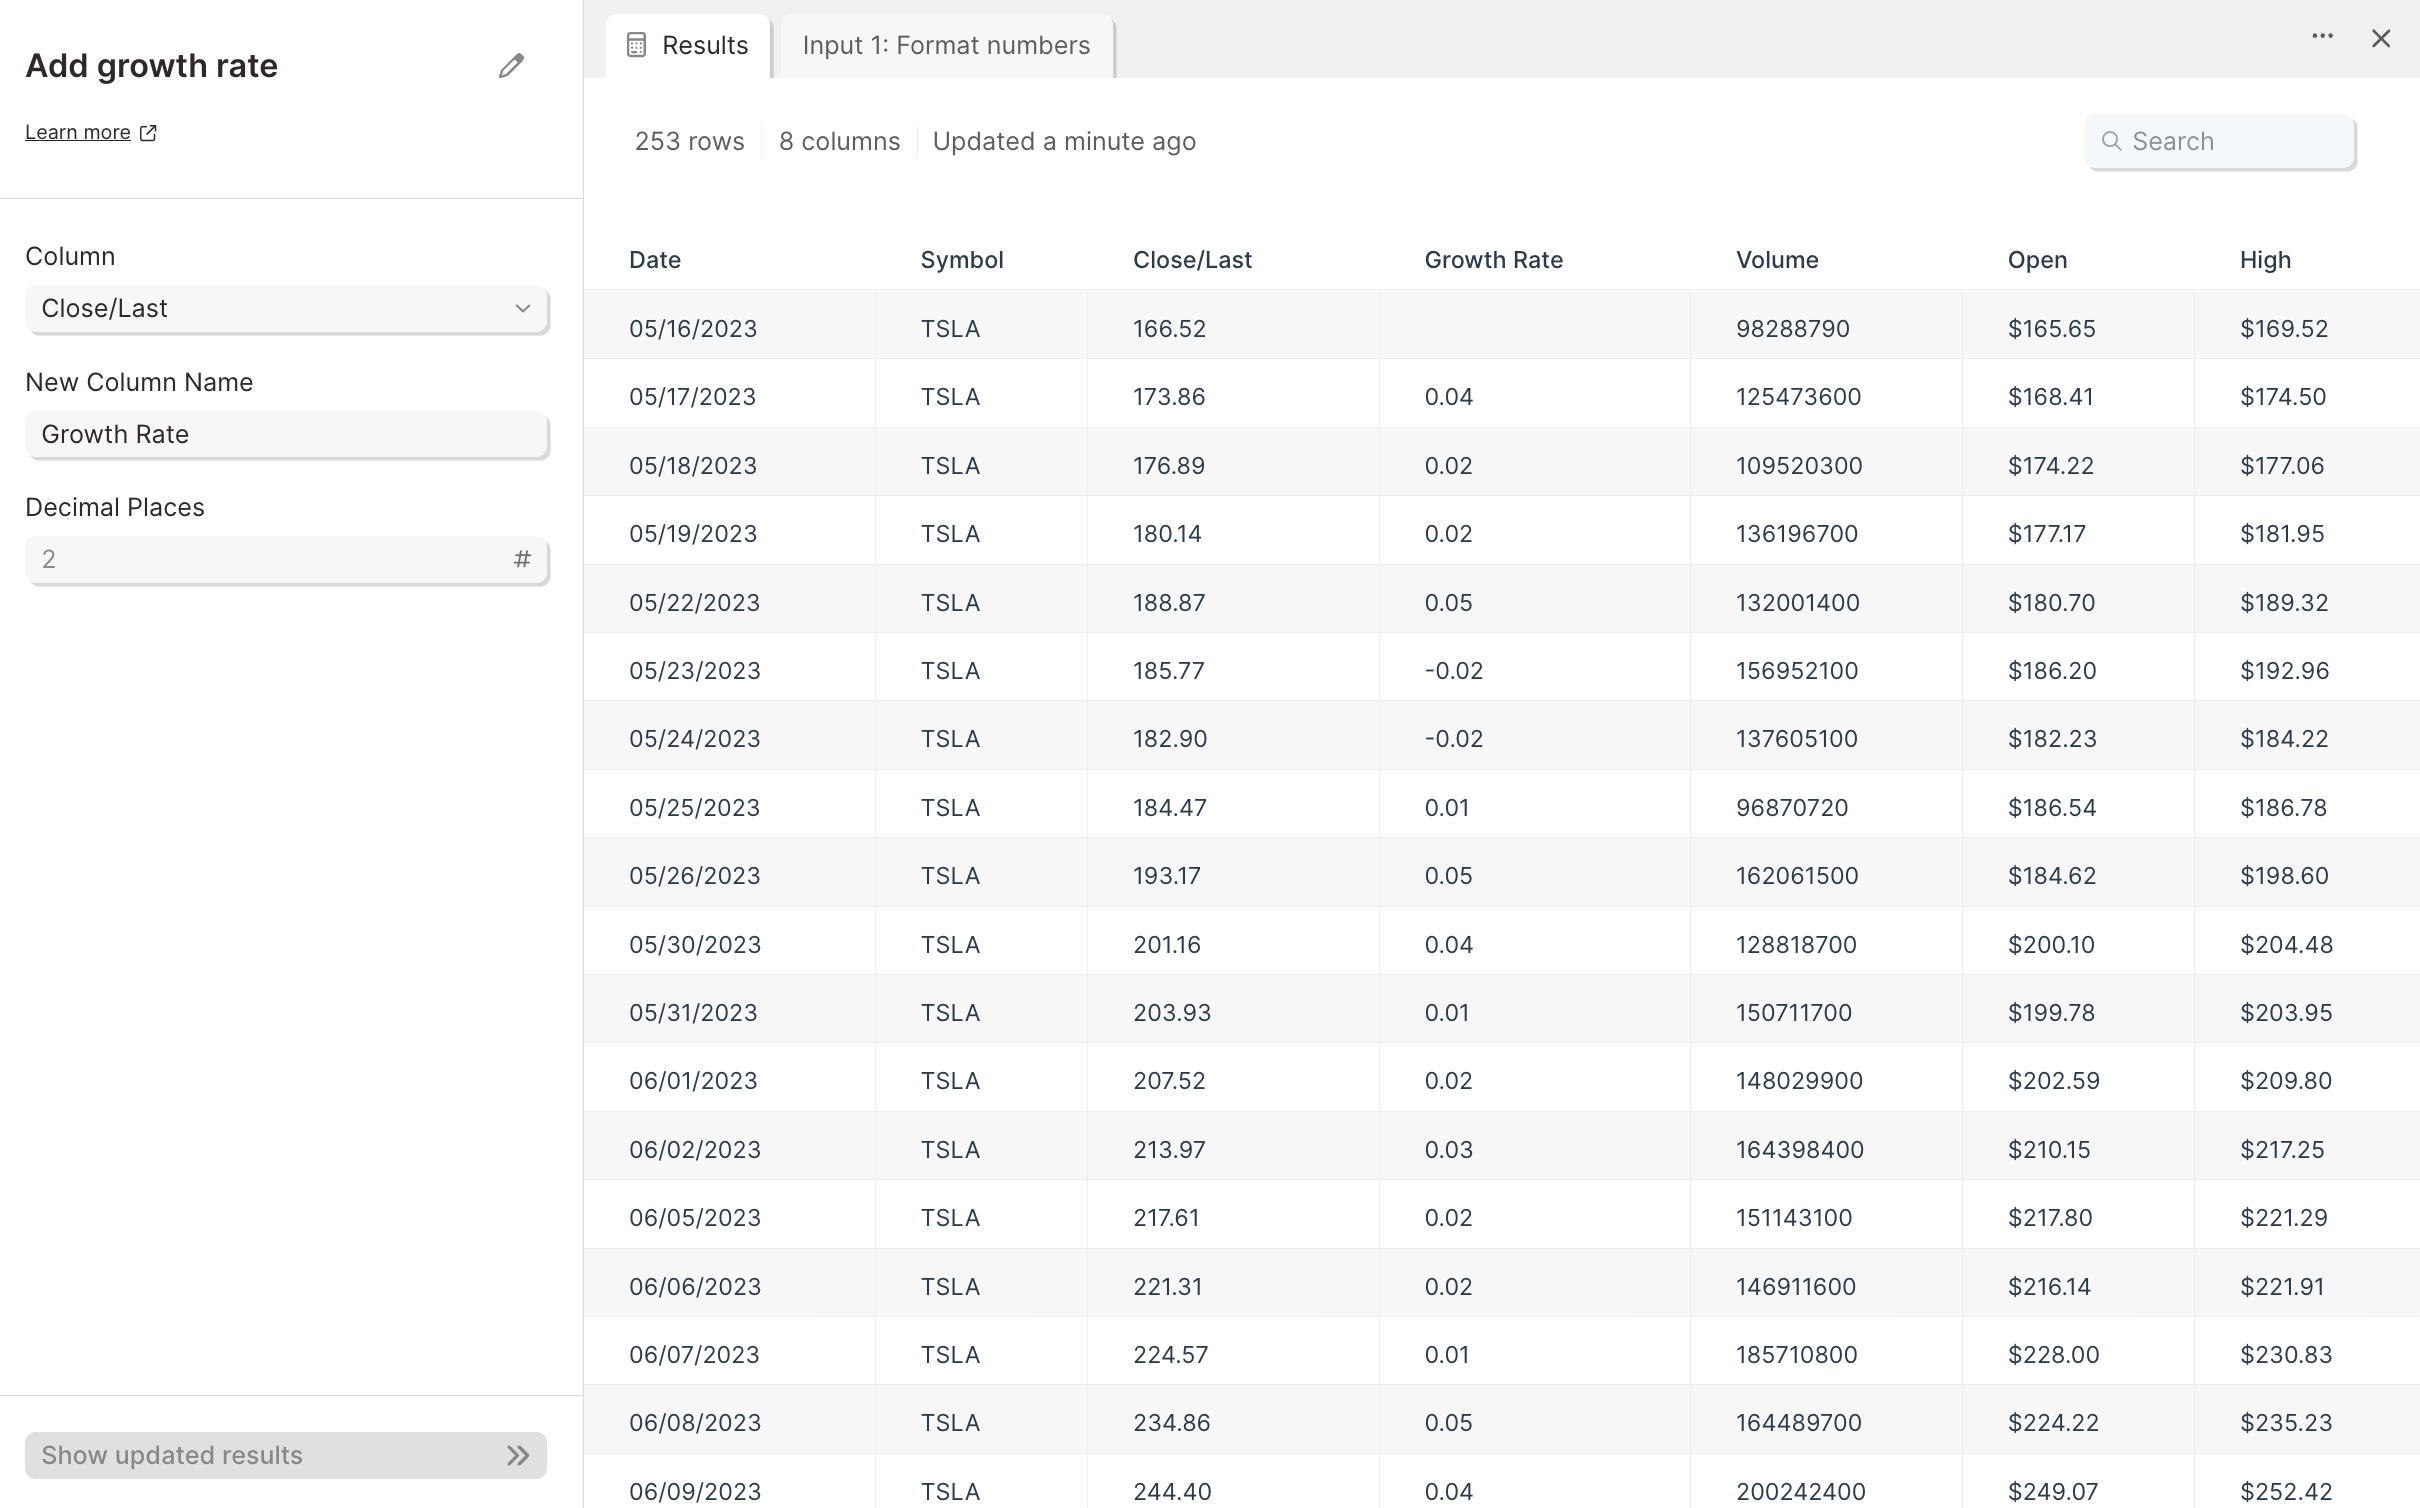
Connecting input data to this step gives us a new 'Growth Rate' column, showing the percent change in stock price compared to the prior recorded date.
Custom settings
First, select the column that you'd like to calculate the growth rate of.
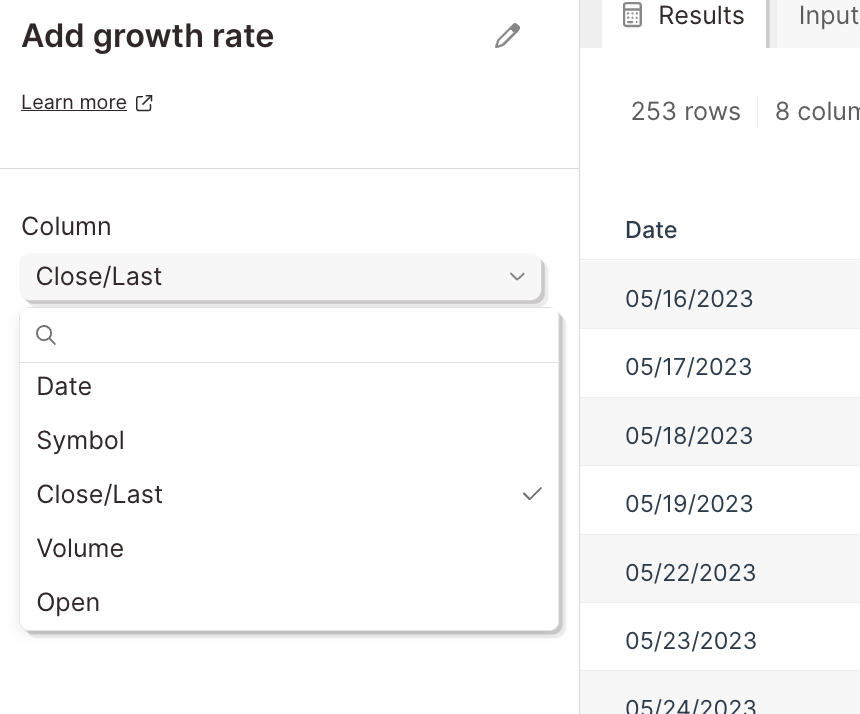
Then, under 'New Column Name', title your new column. In the 'Decimal Places' field, input the number of decimal places you want included in the calculation.
Finish by selecting the button 'Show Updated Results' to save and display your new output data. Your table now has a column inserted to the right of the column whose growth it's calculating. This new column will display the percent change from row to row, in decimal format.
Transform step:
Add if/else column
The Add if/else column step lets you create a new column or edit values in an existing column with conditional values—similar to writing IF formulas in Excel or Google Sheets, but faster and easier to configure inside your flow.
Watch this Parabola University video to see the step in action.
A conditional statement is a common logic tool in data workflows. With Add if/else column, you define rules that determine what value appears in each row. The step evaluates rules from top to bottom and assigns the first matching result.
Step configurations
- Drag Add if/else column onto your canvas.
- Choose one of the following:
- Populate a new column: enter the name under ‘New column name’.
- Edit values in this column: choose the target column from the dropdown.
- Populate a new column: enter the name under ‘New column name’.
- Set up your first condition:
- Choose a column to evaluate.
- Select an operator (e.g., equals, less than, greater than, ‘is blank’, ‘is not blank’).
- Enter a value or reference another column with curly braces (e.g., {Stock}).
- Click “+ Add a field” if you need to list several values to reference.
- Click “+ Add a condition” if you need to chain multiple conditions together for a single rule. You can change the dropdown between “if any” and “if all”
- Under ‘Then set the new column value to’, enter the value to output when the condition is true.
- If the output is a calculation (e.g., {A}/{B}), click the gear icon and check ‘Accepts math function’.
- Choose a column to evaluate.
- Add, reorder, or remove rules:
- Click ‘+ Add a rule’, or hover over a rule to duplicate it.
- Use the arrow icons to move a rule up or down.
- Click the trash icon to delete a rule.
- Rules run in order; once a rule is true, later rules do not run.
- Click ‘+ Add a rule’, or hover over a rule to duplicate it.
- Set a default value that applies if no rules match. (Enable ‘Accepts math function’ here as well if the default is a formula.)
- Click ‘Show updated results’ to apply changes and review the output.
Full list of operators
- Filter dates to
- Is blank
- Is not blank
- Is unique
- Is not unique
- Text is equal to*
- Text is not equal to*
- Text contains*
- Text does not contain*
- Text starts with*
- Text ends with*
- Text length is+
- Text length is greater than+
- Text length is less than+
- Text matches pattern (enter regex pattern)
- Text does not match pattern (enter regex pattern)
- Is equal to+
- Is not equal to+
- Is greater than+
- Is greater than or equal to+
- Is less than+
- Is less than or equal to+
- Is between+
- Is not between+
* Require case sensitivity by clicking the gear icon and enabling the case-sensitive option.
+ Accept math functions by clicking the gear icon and enabling ‘Accepts math function’.
Helpful tips
- Always include:
- A column name
- At least one rule
- A default value (so no row is left blank)
- Combine conditions inside a rule with ‘and’ / ‘or’.
- Reference columns with curly braces (e.g., {Type}) when comparing two columns.
- Use exact text values if you want to check against a fixed string (e.g., “Pending”).
- The step includes built-in date range filtering—under ‘If this is true,’ open the ‘Condition’ modal and select ‘filter dates to.’
Using math in text fields
Toggle any text field to "accept math functions" by clicking the gear icon and enabling ‘Accepts math function’.
Use basic math operations including:+, -, *, /, ^, %
This step also supports a set of functions that are applied row-by-row. Merge in column values by wrapping column names in curly braces (i.e. {revenue})
abs(x)— Returns the absolute value ofx.
Example:abs(-5)→5round(x, [n])— Roundsxto the nearest integer (whole number), or tondecimals if provided.
Example:round(3.1415, 2)→3.14floor(x, [n])— Roundsxdown to the nearest integer (whole number), or tondecimals if provided.
Example:floor(3.67)→3ceil(x, [n])— Roundsxup to the nearest integer (whole number), or tondecimals if provided.
Example:ceil(3.14)→4min(...values)— Returns the smallest of the provided values.
Example:min(3, 1, 4)→1max(...values)— Returns the largest of the provided values.
Example:max(3, 1, 4)→4mean(...values)— Returns the average of the provided values.
Example:mean(2, 4, 6)→4median(...values)— Returns the middle value of the provided values.
Example:median([1, 3, 5])→3std(...values, [normalization])— Returns the standard deviation of the provided values. Read more here
Example:std([2, 4, 6])→2sqrt(x)— Returns the square root ofx.
Example:sqrt(9)→3log(x, [base])— Returns the logarithm ofx, usingbaseif provided (defaults to natural log).
Example:log(100, 10)→2exp(x)— Returns e raised to the power ofx.
Example:exp(2)→7.389
Example use case
Let’s say you want to create an “Inventory status” column:
- If {Available} is less than or equal to 200 → set value to “Low.”
- If {Available} is greater than 200 and less than or equal to 800 → set value to “Healthy.”
- Otherwise → set value to “Overstocked.”
The step evaluates each row in order, assigns the correct status, and adds it as a new column. You could then filter rows where “Inventory status” = “Low” to trigger alerts or automate purchase orders.
Translating common Excel IF formulas
Here are some examples of popular Excel formulas and how you would build the same logic using the Add if/else column step:
1. Handle blanks or missing values
Excel formula:
=IF(A2="", "Missing", A2)
Meaning: If the cell is blank, return “Missing.” Otherwise, return the original value.
Parabola solution:
- New column name: Status
- Rule 1: If {Column A} equals (leave value blank) → then set new column value to Missing
- Default value: {Column A}
2. Prevent division by zero (similar to NULLIF)
Excel formula:
=IF(B2=0, "Error", A2/B2)
Meaning: If the denominator is zero, return “Error.” Otherwise, calculate the division.
Parabola solution:
- New column name: Safe Division
- Rule 1: If {B} equals 0 → then set new column value to Error
- Default value: {A}/{B} (entered in math mode by clicking the gear icon and selecting ‘Accepts math function’)
3. Categorize values into buckets
Excel formula:
=IF(C2<200, "Low", IF(C2<=800, "Healthy", "Overstocked"))
Meaning: Create an inventory status column based on thresholds.
Parabola solution:
- New column name: Inventory status
- Rule 1: If {Available} less than or equal to 200 → then set value to Low
- Rule 2: If {Available} greater than 200 and less than or equal to 800 → then set value to Healthy
- Default value: Overstocked
4. Text matching
Excel formula:
=IF(D2="Pending", "In Review", "Complete")
Meaning: If a status equals “Pending,” set to “In Review.” Otherwise, return “Complete.”
Parabola solution:
- New column name: Review status
- Rule 1: If {Status} equals Pending → then set value to In Review
- Default value: Complete
3. Coalesce
Excel formula:
=COALESCE(A2,B2,C2)
Meaning: Return the first non-blank value among A2, B2, and C2.
Parabola solution:
- New column name: First non-blank
- Rule 1: If {A} is not blank → set value to {A}
- Rule 2: If {B} is not blank → set value to {B}
- Default value: {C}
4. Minimum cap
Excel formula:
=MIN(1.25, E2)
Meaning: Return the smaller of 1.25 and the other value (i.e., cap the value at 1.25).
Parabola solution:
- New column name:
Capped value - Rule 1: If
{E}≤1.25→ set value to{E} - Default value:
1.25
(If the “other value” is a calculation, first create it with Add math column and then reference that new column here.)
Transform step:
Add math column
The Add math column step lets you quickly create new calculated fields in your dataset. It’s like writing formulas in Excel or Google Sheets—but designed to be faster, easier to read, and built specifically for row-by-row math in your flow.
⚠️ Note: This step supports core math operators. It does not run Excel or SQL-style functions (like DATEDIFF() or NULLIF()).
Check out this Parabola University video to see the Add math column step in action.
Step configurations
- Drag Add math column onto your canvas.
- Under 'New Column Name', type the name of your new column.
- In the 'Calculation' field, enter your math formula. Wrap column names in curly braces— for example:
{Inventory} + {In transit}→ sums two columns{Total Goods Sold} * 52→ creates a 'Yearly Forecast' column
- You can add multiple formulas by clicking 'Add Math Rule'.
- Click 'Show Updated Results' to apply your formulas. Your new columns will calculate row by row and will appear to the very right of your data set.
As you type, column names will autocomplete—helpful when working with large datasets.
If you see a 'Settings error', check for typos or incorrect notation in the 'Calculation' field.
Helpful tips
- To reuse a column you created here, connect another Add math column step after it.
- Handles positive/negative numbers, currency symbols, percentages, decimals, and commas automatically.
- If your numbers are in accounting format, first use the Format numbers step to update them.
- Supported operators are:
- Addition (+)
- Subtraction (-)
- Multiplication (*)
- Division (/)
- Modulo (%)
- Power (^)
⚠️ Reminder: This step is optimized for math operators only. Advanced Excel formulas, date/time functions, and logic functions are not supported. Use other steps—or a combination of steps—in Parabola to accomplish those workflows.
Using functions
This step supports a set of functions that are applied row-by-row. Merge in column values by wrapping column names in curly braces (i.e. {revenue})
abs(x)— Returns the absolute value ofx.
Example:abs(-5)→5round(x, [n])— Roundsxto the nearest integer (whole number), or tondecimals if provided.
Example:round(3.1415, 2)→3.14floor(x, [n])— Roundsxdown to the nearest integer (whole number), or tondecimals if provided.
Example:floor(3.67)→3ceil(x, [n])— Roundsxup to the nearest integer (whole number), or tondecimals if provided.
Example:ceil(3.14)→4min(...values)— Returns the smallest of the provided values.
Example:min(3, 1, 4)→1max(...values)— Returns the largest of the provided values.
Example:max(3, 1, 4)→4mean(...values)— Returns the average of the provided values.
Example:mean(2, 4, 6)→4median(...values)— Returns the middle value of the provided values.
Example:median([1, 3, 5])→3std(...values, [normalization])— Returns the standard deviation of the provided values. Read more here
Example:std([2, 4, 6])→2sqrt(x)— Returns the square root ofx.
Example:sqrt(9)→3log(x, [base])— Returns the logarithm ofx, usingbaseif provided (defaults to natural log).
Example:log(100, 10)→2exp(x)— Returns e raised to the power ofx.
Example:exp(2)→7.389
Doing math conditionally
In Excel or Google Sheets, you might write a formula that uses if/else logic to decide which math to run.
In Parabola, use the Add if/else column step to apply conditions and perform math in the same place. For example, you could:
- Multiply
{Price}by{Quantity}only if{Quantity}is greater than 1. - Apply a discount rate if
{Customer Type}equals “Wholesale.” - Set a value to 0 if the field is blank.
This step combines conditional logic and math, so you don’t need to chain multiple steps together.
⚠️ If you’re performing math operations, click the gear icon in the value field and check the box labeled ‘Accepts math function’.
Transform step:
Add row numbers
The Add row number step creates a new column adding sequential numbers to each row.
You can sort the numbers in ascending or descending order. You can add row numbers down the whole table, add numbers that repeat after a certain number of rows, repeat each number a set amount of times before advancing to the next number, and number based on another column. Numbering based on another column is a powerful way to add numbers to things like line items that share an order ID, or to rank your data.
Input/output
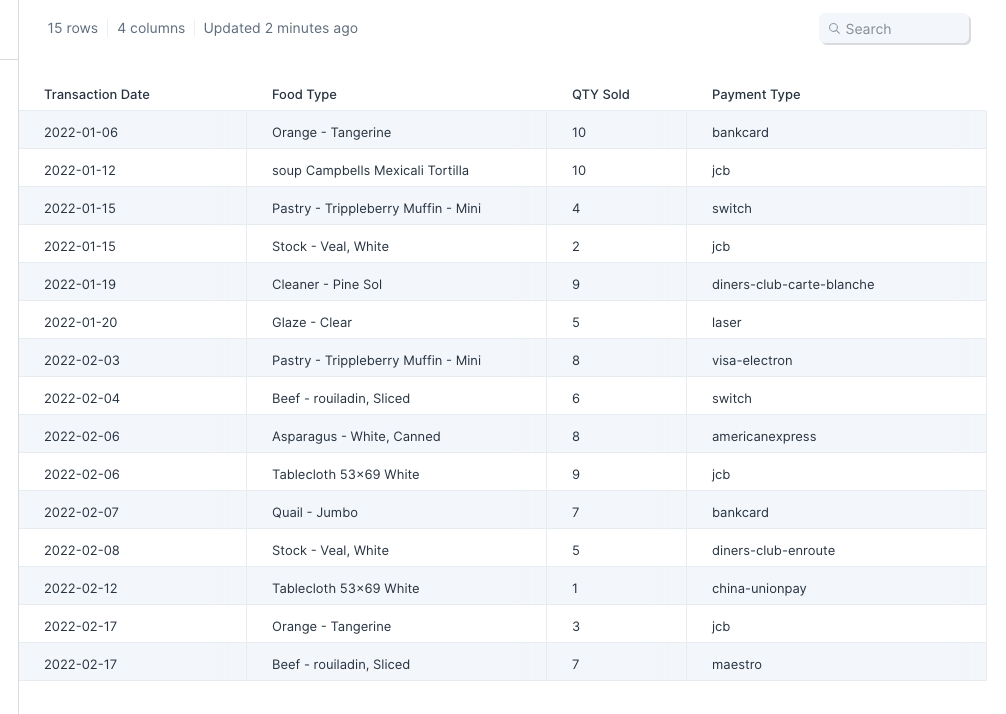
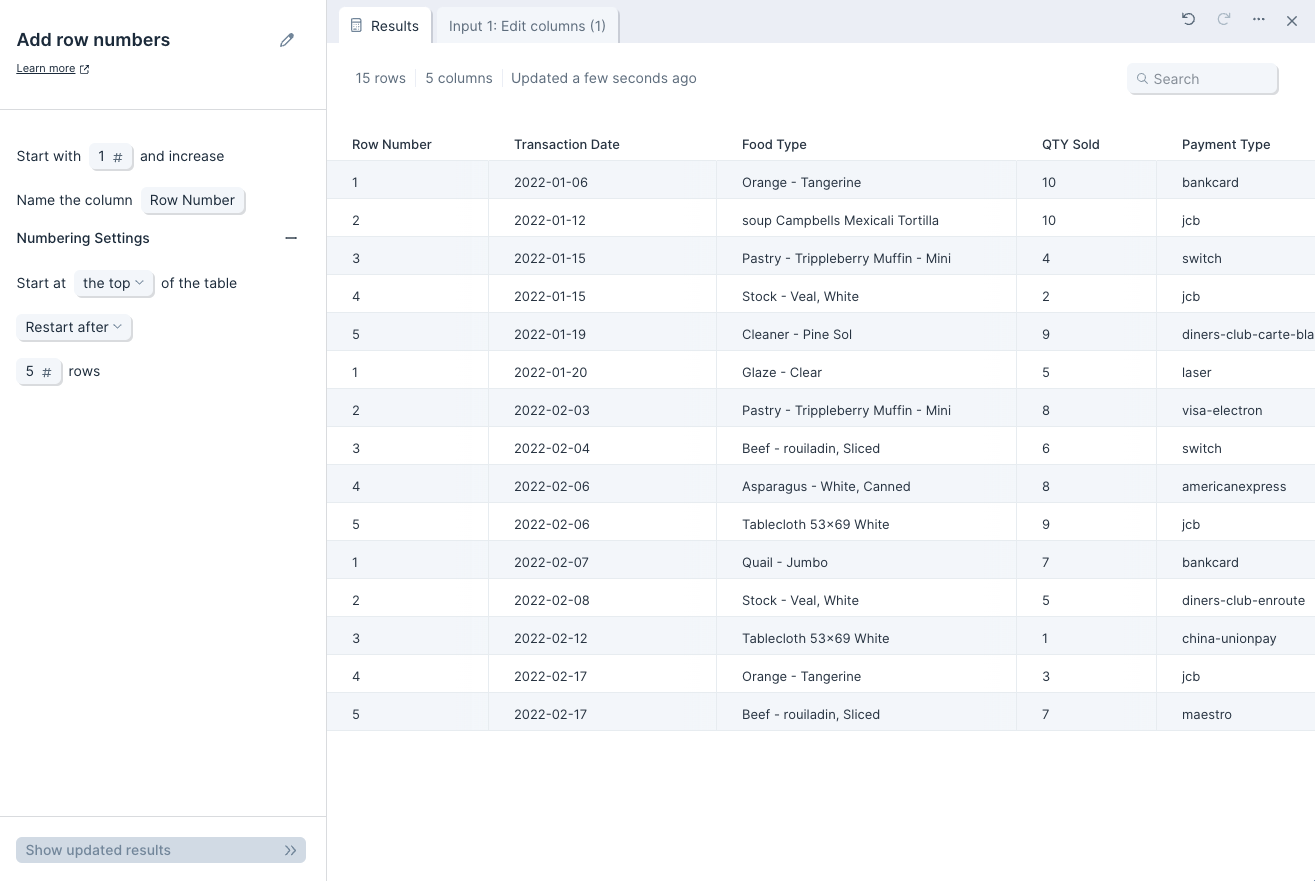
The input data we'll use with this step is a table of 15 rows with the 4 columns from a sales report.
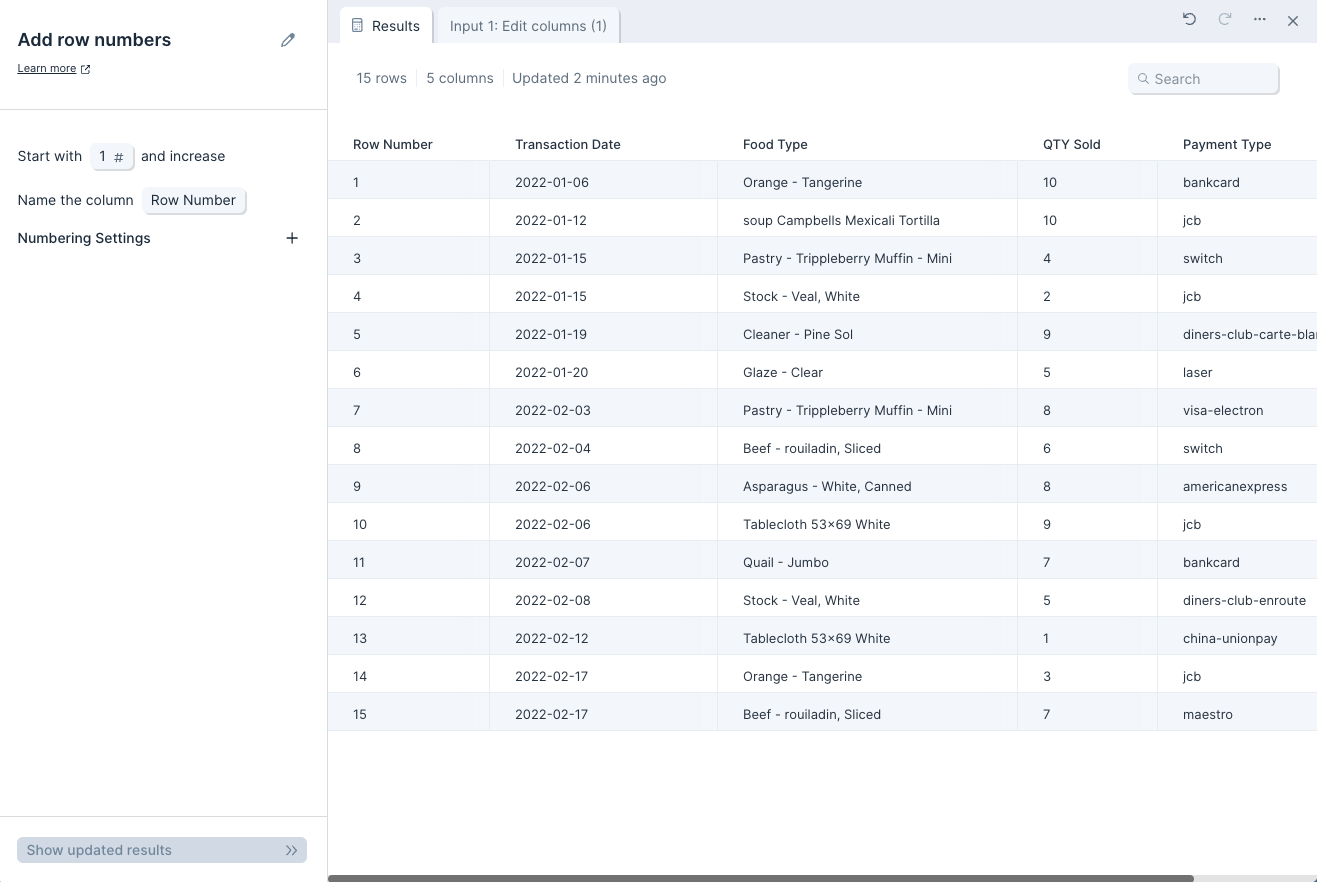
The new output table has an additional column named 'Row Number'. The column starts with '1' in the first row, and increases by 1 with each row. The step will add a new column with sequential row numbers to any connected dataset.
Default settings
By default, the 'Column Name' will be set to 'Row Number', 'Start with' will be set to '1', and the rows will be numbered in ascending order.
Custom settings
To sort the numbers in descending order, click '+' to expand the 'Numbering Settings' section and change the default setting from 'the top' to 'the bottom'. The numbers will now be sorted from highest to lowest.
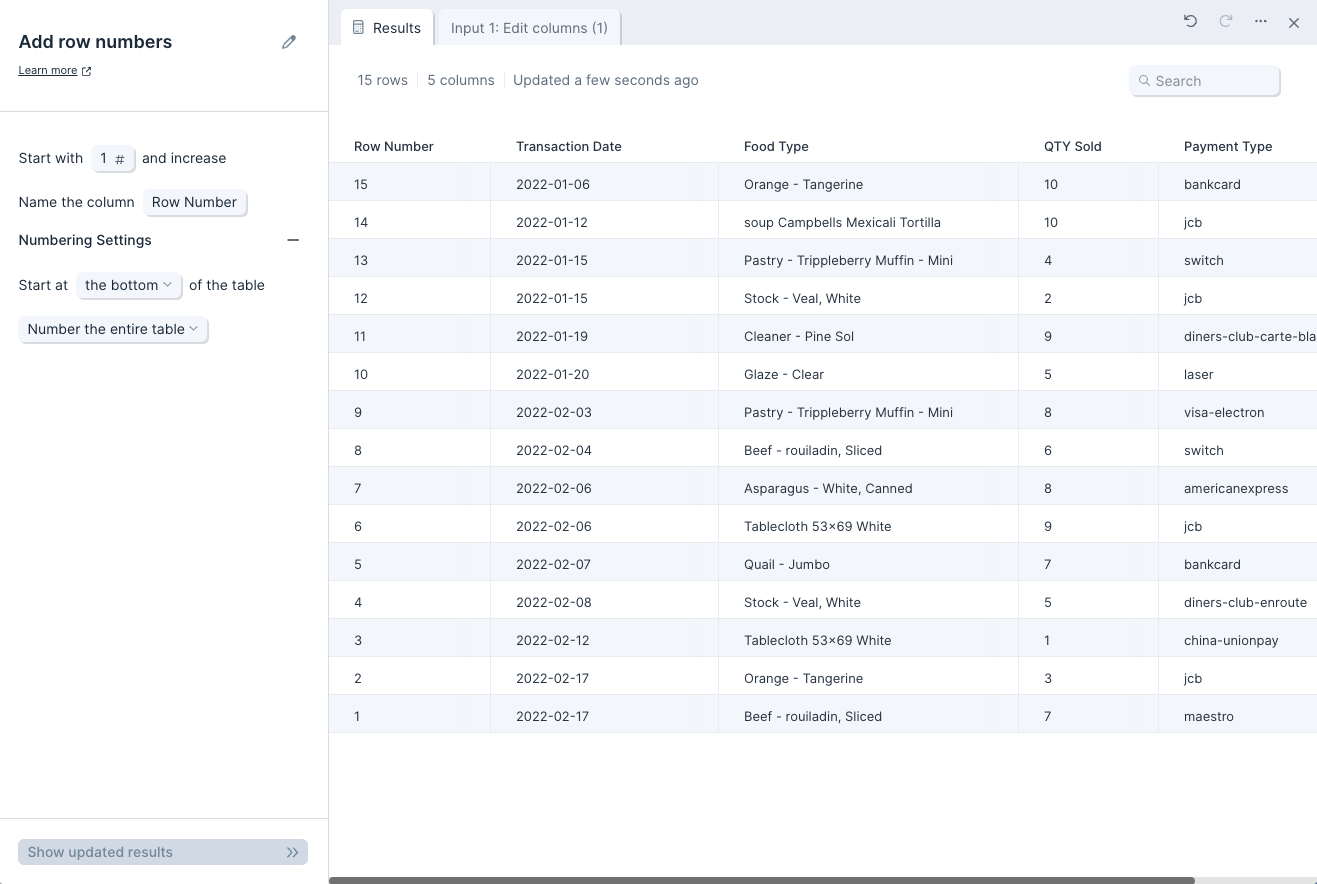
To see how many times a certain data type (like payment type) appears in your data set, you can change 'Number the entire table' to 'Number based on' value in a selected column. This will help you count repetitions of a value in your selected column.
There are also options to have this 'Row number' column repeat each successive value a certain number of times ('Repeat numbers') or restart from your initial value after a certain number of rows ('Restart after').
Helpful tips
- If two tables have the same number of rows but do not share a matching column, use this step and then the Combine tables step to create a new column that you can use to combine the tables.
Transform step:
Add rows
The Add rows step adds any number of rows to a table. You can include default values for each column to make it easier to build a large table with duplicated values.
Input/output
This table has 8 rows and 5 columns.
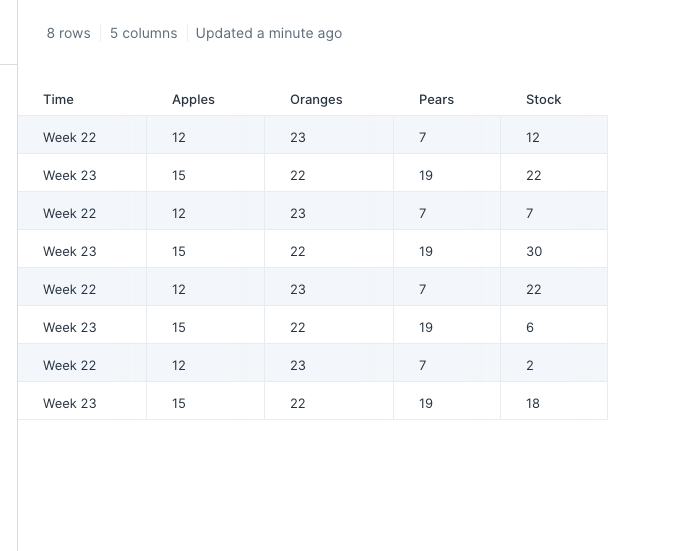
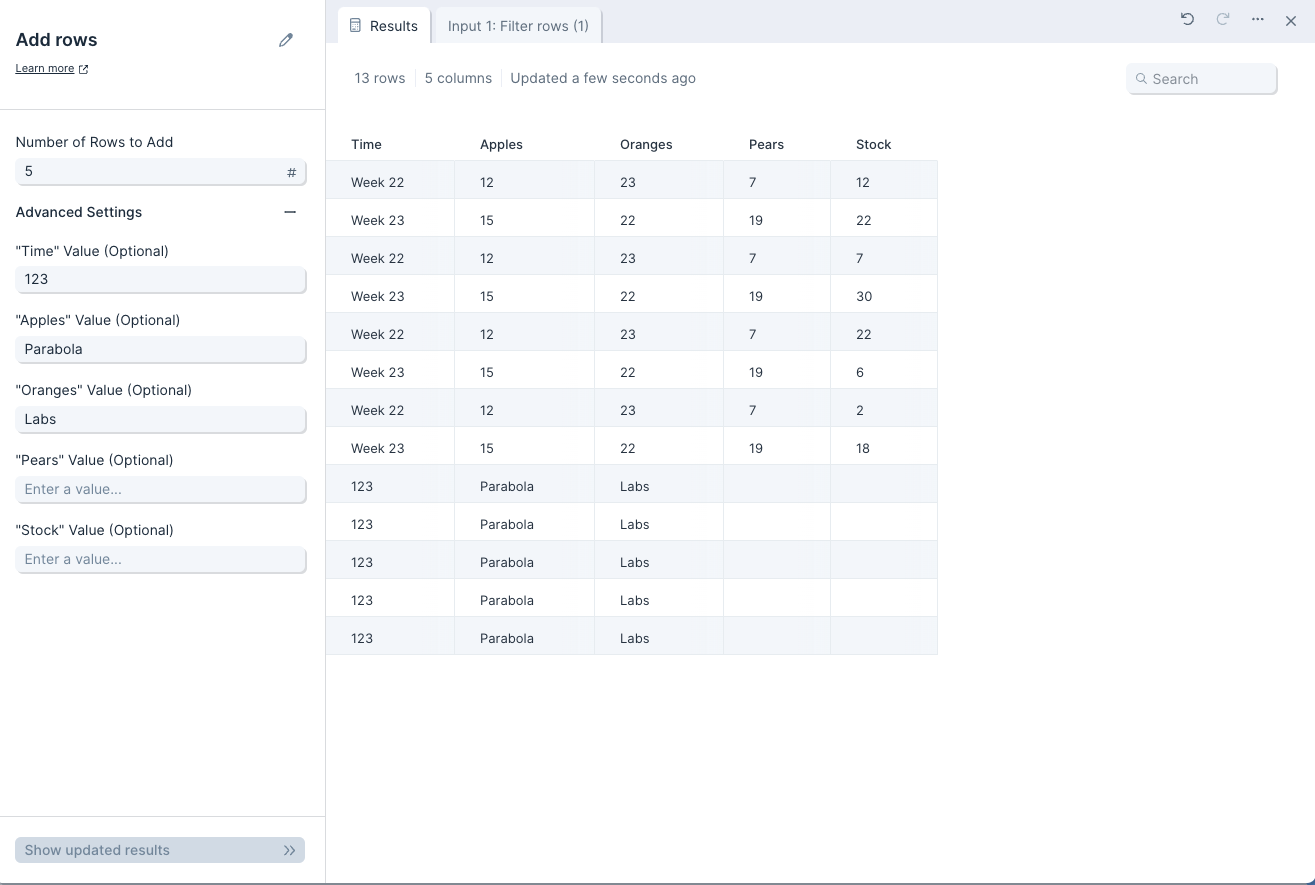
To add more rows with default values, use the Add rows step. The output table has 5 additional rows. The 'Time' column has a default value of '123', the 'Apples' column has a default value of 'Parabola', the 'Oranges' column has a default value of 'Labs', and the remaining columns are left blank
Custom settings
In the 'Number of Rows to Add' field, enter the total number of new rows to add to a table.
In the '"{Column}" Value (Optional)' fields, set the default value to be added to each cell in a column. The value can be a string or a number.
Transform step:
Add running total
The Add running total step calculates the running total sum of any column you choose.
Running total for the entire table
This setting creates a running total column, each cell of which contains the sum of all cells in a specified column, up to the current row.
.png)
Running total for each value in a column
Switch the first setting from 'for the entire table' to 'for each value in this column' to create individual running totals for each unique value in another reference column.
For example, if you needed to create the running total for the number of steps each person took in a day, you would sum the values in the 'Steps' column and create a a running total for each value in the 'Name' column.
.png)
The column being referenced for grouping does not need to be sorted, but the results will be easier to read if that column is sorted.
Helpful tips
- Any value that is not a number will be treated as a 0, including words and blanks
- This step can sum: positive and negative numbers (-10), decimals (10.55), currencies ($50), percentages (10%), and scientific notation (10e2)
- Percentages will be summed as their numeric format. So 10% will be summed as 0.1
Transform step:
Add text column
The Add text column step populates a column with repeated values, or values that contain repeated strings. The rows can be filled with any integer/number, letter, special character, or value of your choosing. You can also reference other column values and combine them into this new column.
Check out this Parabola University video for a quick intro to the Add text column step.
(Please note: the Add text column step was previously called Insert text column and Text Merge.)
Input/output
Our sample input data has two columns: 'Webinar ID' and 'Registrant name'.
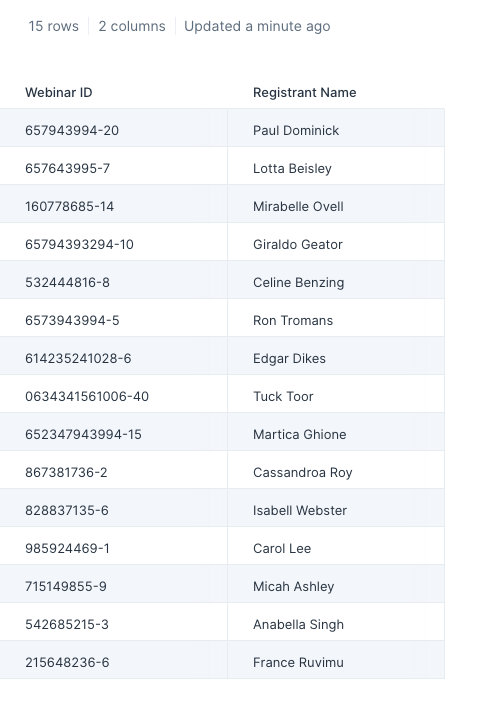
After using this step, our output data now has a third column called 'Example Column' with the value '1' applied to all rows.

Custom settings
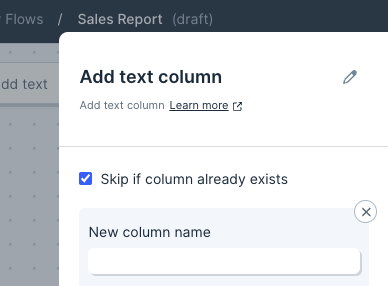
Title your new text column in the 'New column name' field. In the 'Column value' field, fill in the repeating value you'd like for the rows. Click on 'Show Updated Results' to save and display your changes.
Using the 'Skip if column already exists' checkbox, you can choose to have this column added only if it doesn't already exist in your dataset. This is useful when working with API steps where the column structure may change based on the available data. Similarly, if you have flows running on a schedule that pull in data at varying periods, this step can be used to create a static column of values so your flow doesn't stop running due to data temporarily not brought in.
Helpful tips
- If the column this step is adding already exists, then by default it won't be added to your dataset. This can be turned on and off. This is useful for preventing flow errors you set on a schedule, where the data pulled in varies at times.
- You can create multiple columns with this step by going to the left-side toolbar and clicking 'add a column' under the settings for your new text column.
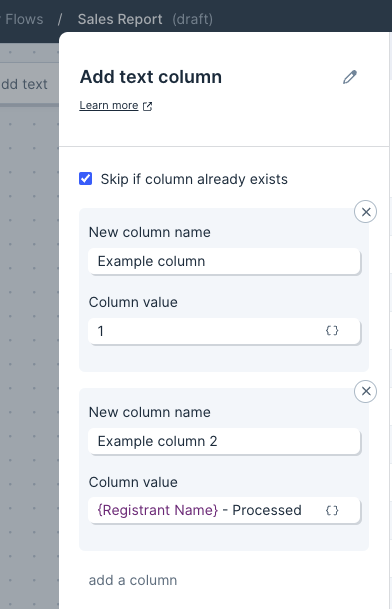
- The 'Column value' field supports Parabola's standard merge tags syntax, which is curly braces surrounding a column name (e.g.: '{Registrant Name}'). Columns you add are processed starting at the top ('Example column') in the above image, so a column added in this step can be referenced by another column added later in the same step.
- You can add bits of missing data into columns such as spaces, dashes, and other formatting characters.
Transform step:
Average by group
The Average by group step calculates the average of all values in one or more columns. This step is similar to the AVERAGEIF function in Excel.
Input/output
Our input data has 11 rows of order information showing how much of a particular food item was sold to a given customer.

After we run our dataset through the Average by group step, we find the average number of each food item sold per order.

Default settings
When a data source is first connected, this step will auto-select a numeric column (like 'Quantity Sold') and a data-type column to take a first pass at averaging by group.

Custom settings
You may choose any column to average, and group the average according to any one column, or multiple columns, in your data set.

You can optionally apply this to only the selected columns or apply to 'all columns except'. We'd recommend using the option that requires fewer column selections to save yourself time.

Transform step:
Calculate score
The Calculate score step scores each row based on specified criteria and puts the score into a new column.
Input/output
In this example, the data we'll input into this step has a list of multiple leads across a few companies.

We want to ensure we're contacting the best possible lead at each company, so we'll use this Calculate score step to score these leads in order to prioritize the best ones to contact.
This step's output is a new "Score" column of calculated scores per lead row.

Custom settings
With data connected, title your new scoring column in the 'Score Column Name' field.

To set up the step's rule(s), select the column that should have the rule applied to it, select a rule from the options provided, and type in a value this step should search for.
The rule options are: Blank, Not Blank, Equals, Not Equals, Contains, Not Contains, >, > or =, <, < or =.
Lastly, finish this rule setting by placing a number in the 'Increment Score' field and selecting 'Show Updated Results' to save it. In the above screenshot example, VP-titled people have a score of 3, Director-titled people have a score of 2, and Manager-titled people have a score of 1.
Helpful tips:
- Add as many rules as you'd like by clicking on the 'Add Scoring Rule' button.
Transform step:
Categorize with AI
The Categorize with AI transform step evaluates data sent to it and categorizes the rows based on categories that you predefine.
Examples of categorizing data with AI
- Take a list of product names and categorize them by department: clothing, home goods, grocery, other
- Take a list of email addresses and sort them by type into these categories: work, personal, school, nonprofit, government, other
- Take a list of news headlines and categorize them by section: politics, business, world news, science, etc.
After running the step, it’s normal to modify your categories and re-run as you see how the AI responds to your requests.
How to use this step

Selecting what to evaluate
You start by selecting which columns you want the AI to evaluate to produce a result.
- All columns: the AI looks at every data column to find and extract the item it’s looking for
- These columns: choose which column(s) the AI should try to extract data from
- All columns except: the AI looks at all columns except the ones you define
Note that even when the AI is looking at multiple (or all) columns, it’s still only evaluating and generating a result per row.
Setting the categories
This step is designed to assign categories to rows, so it needs to know what the desired categories are. The step provides spaces to write in as many categories as you need (it starts with three empty boxes only as an example). Add one category per box.
Fine tuning
Open the 'Fine tuning' drawer to see extra configuration options. Using this field, you can provide additional context or explanation to help the AI deliver the result you want.
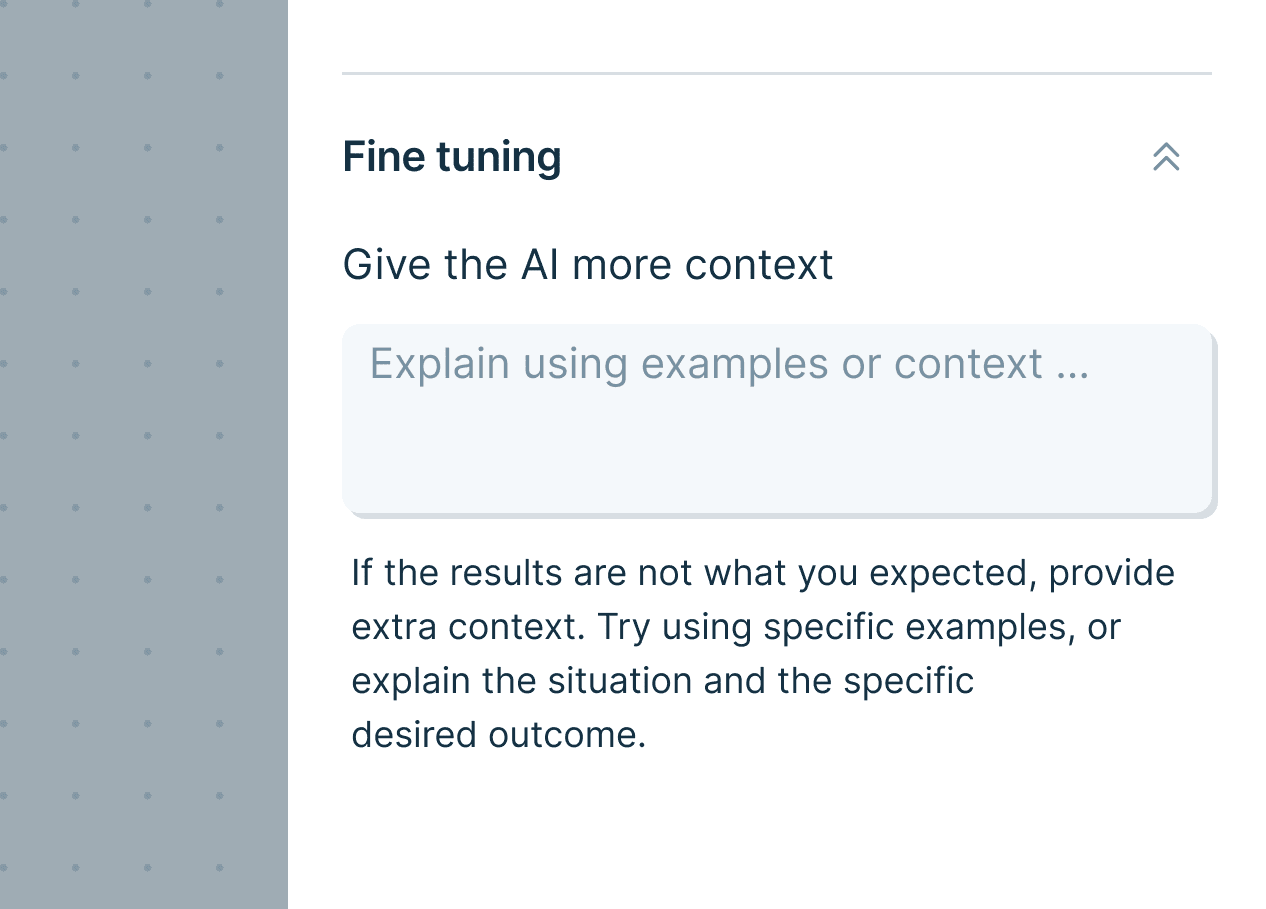
For example, if you gave this step a list of animals and asked it to categorize them as 'Animal I like' vs. 'Animal I don’t like,' it might not give you an accurate result! But you could then use this field to say:
'I tend to like furry animals that are friendly to humans, like dogs and horses and dolphins, and not others.'
This step would then better understand the categorization you’re looking for.
Helpful tips
- Row limits for AI steps: AI steps can only reliably run a few thousand rows at once. Categorize with AI has an upper limit of 100k rows, though runs above ~70k rows often fail. If you need to process more than 100k rows, use Filter rows to split your dataset and run smaller batches in parallel.
- Sometimes you’ll see a response or error back instead of a result. Those responses are often generated by the AI, and can help you modify the prompt to get what you need.
- Still having trouble getting the response you expect? Often, adding more context in the 'Fine tuning' section solves the problem.
Transform step:
Change text casing
The Change text casing step converts the text in any column to a selected case type.
Input/output
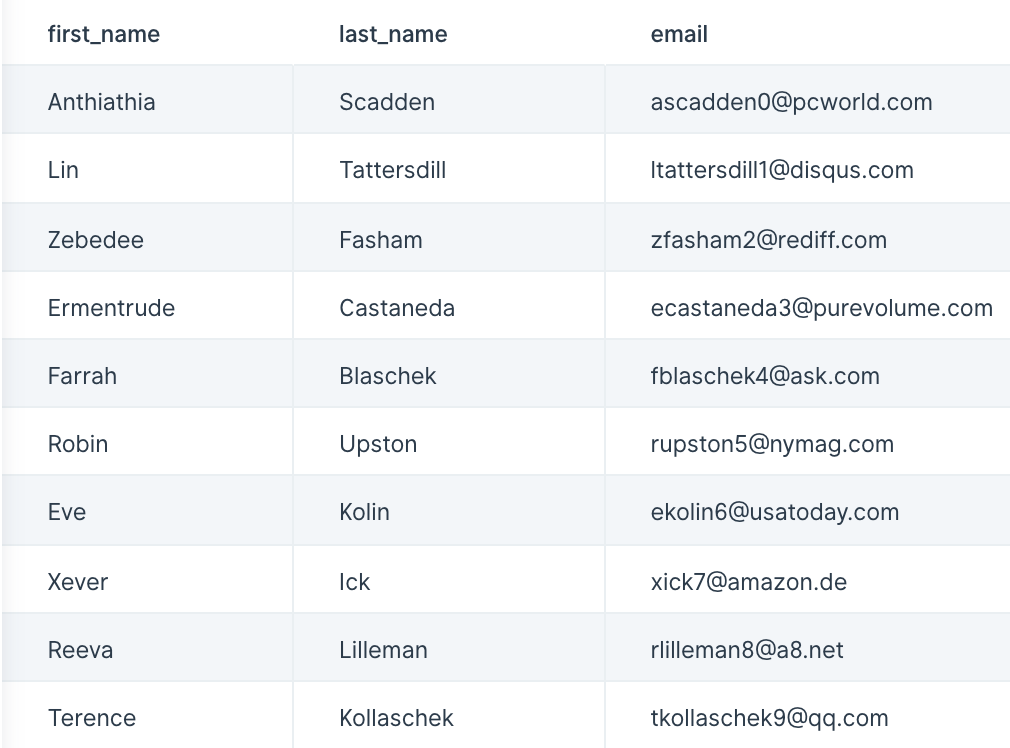
Our input data is customer information that displays first and last names in all uppercase. We can use the Change text casing step to turn our first and last names into title case.
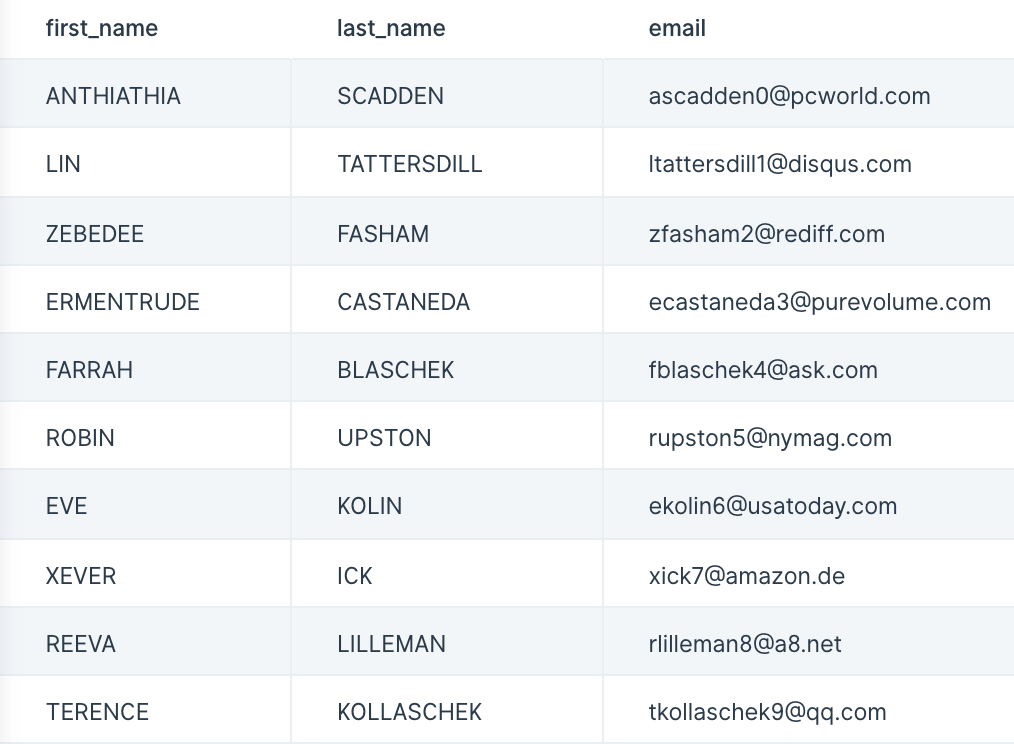
As seen in our output data below, this step made our "first_name" and "last_name" columns change into title case.
Custom settings
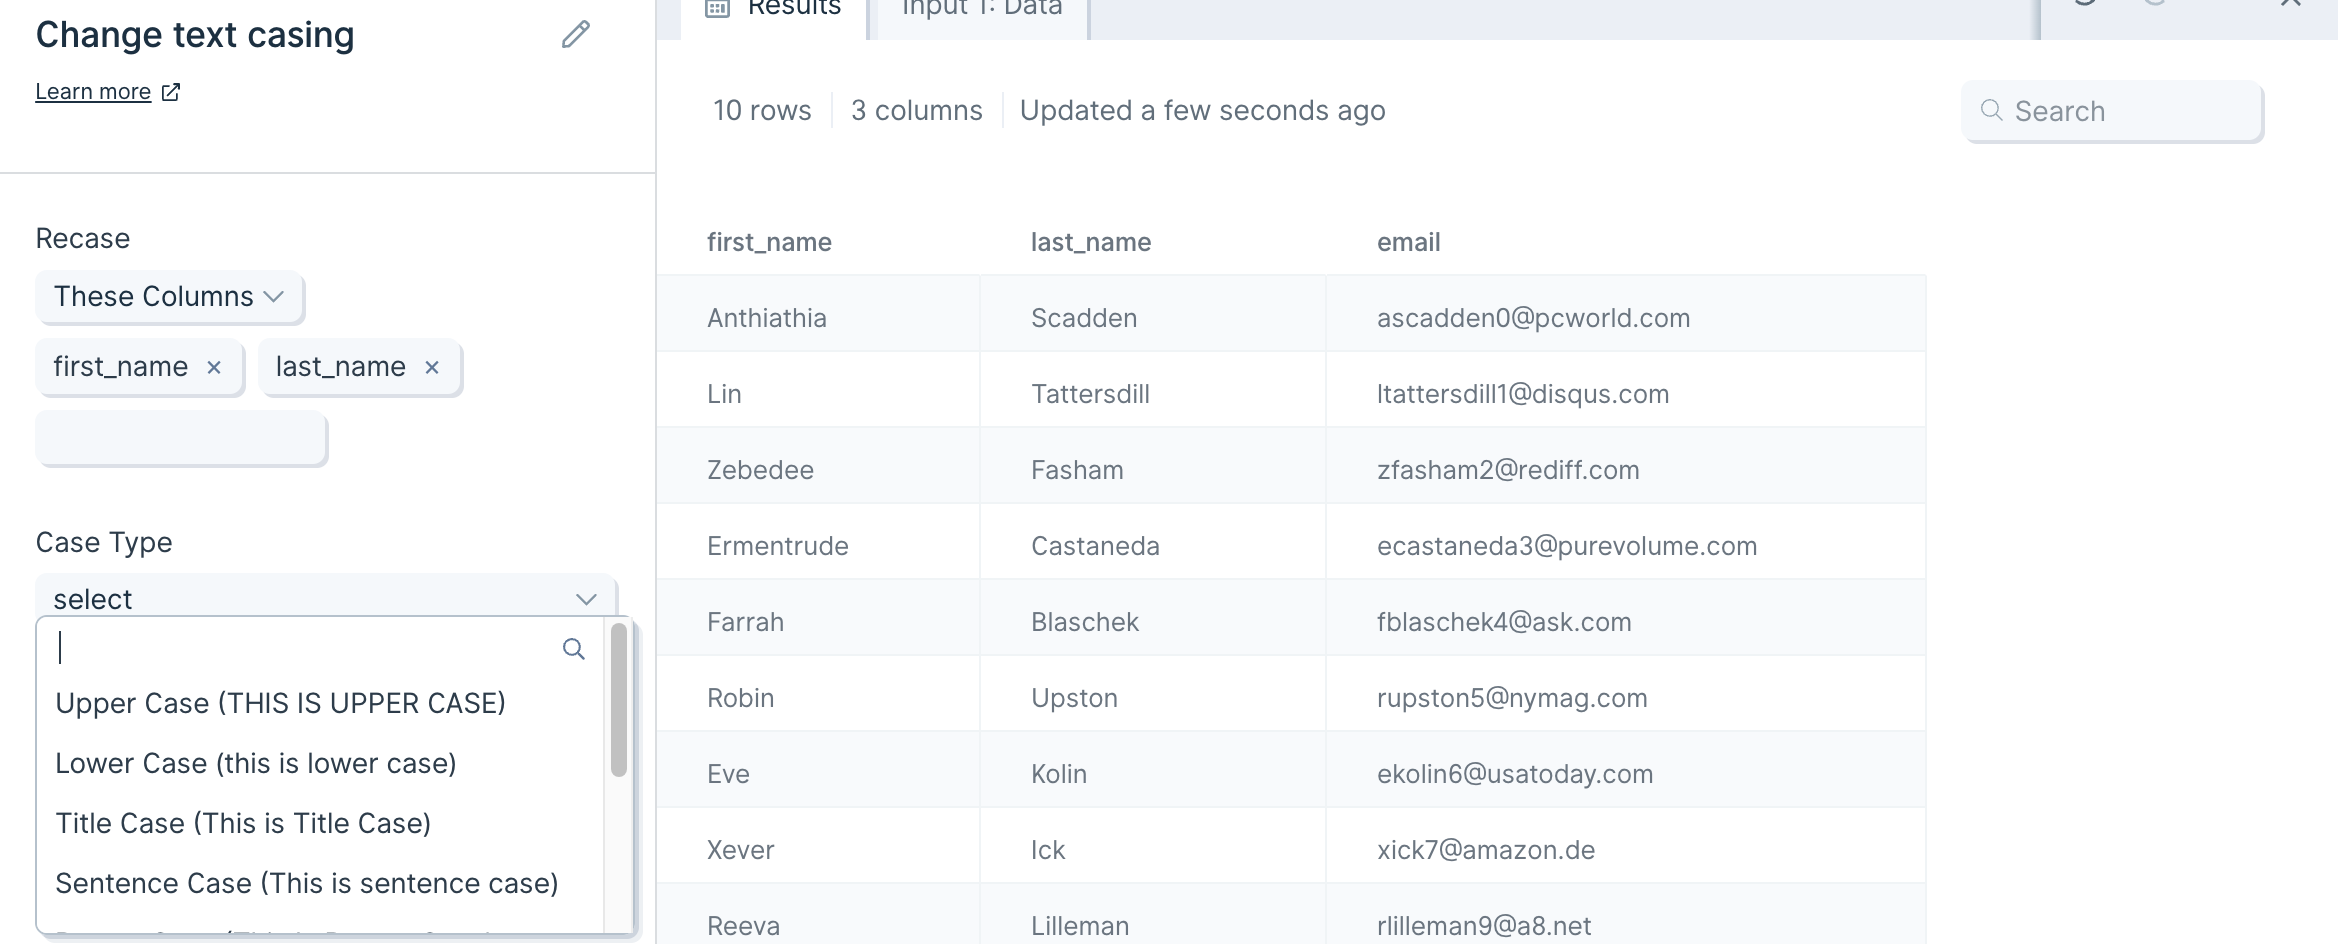
The first thing to do when you connect data to the Change text casing step is to select the column(s) you'd like to 'Recase'. You can select as many columns as you need.
Then, you will select the desired 'Case Type;. The available case types are:
- Upper Case (THIS IS UPPER CASE)
- Lower Case (this is lower case)
- Title Case (This is Title Case)
- Sentence Case (This is sentence case)
- Proper Case (This Is Proper Case)
- Snake Case (this_is_snake_case)
- Camel Case (thisIsCamelCase)
- Train Case (This-Is-Train-Case)
- Kebab Case (this-is-kebab-case)
Helpful tips
- This step can only change one case type at a time. If you'd like to change different columns to different case types, you can do this by chaining multiple Change text casing steps together.
Transform step:
Clean data
The Clean data step removes leading or trailing spaces and other unwanted characters (letters, numbers, or punctuation) from cells in specified column(s).
Input/output
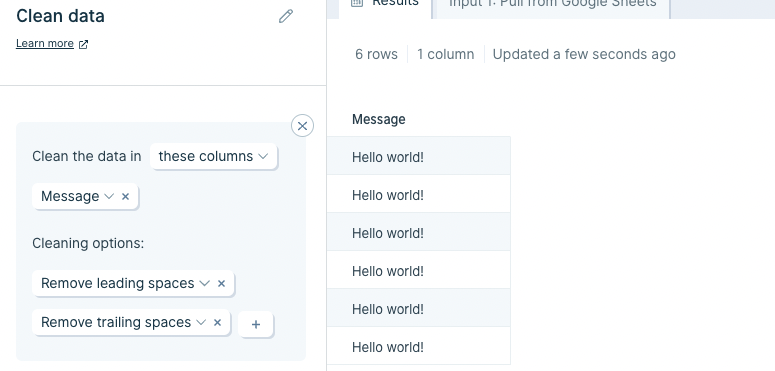
Our input data has a column of messages with numbers of various leading and trailing spaces.

By using the Clean data step, we can easily remove spaces to clean up the 'Message' column.

Default settings
When you first connect data into this step, by default your table's first column will be auto-selected to clean and the option to Remove all spaces will be applied.
Custom settings
To customize these settings, first choose the column(s) from the dropdown that the cleaning rules should apply to. You can either select to Clean the data in these columns or Clean the data in all columns except.
Next, choose the cleaning options that should be applied to the specified column(s). The available options are:
- Remove all spaces
- Remove leading spaces
- Remove trailing spaces
- Remove all punctuations
- Remove all characters
- Remove all numbers
- Remove all non-numbers
- Clean to use as JSON
You can combine the cleaning options if needed.
You can also add multiple clean data rules to this step by clicking on the 'Add Rule' button.
In our above screenshots, we selected the 'Message' column to apply our cleaning rules to and selected two cleaning options: 'Remove leading spaces' and 'Remove trailing spaces'. As seen below, this cleaned up varying leading and trailing spaces in the 'Message' column.
Helpful tips
- This step is useful to use when you're preparing data to send to an API using the Send to API step. If you encounter a JSON error when sending data to an API, try using the Clean data step first to see if it can quickly remove the special character(s) causing the issue.
- Looking for hidden characters? The "Clean to use as JSON" option is useful for identifying those that might not be visible
Transform step:
Combine tables
The Combine Tables step joins multiple tables into one by matching rows between those tables. It is similar to a VLOOKUP in Excel or Google Sheets. In SQL, it's like a join clause.
The principle is simple: if we have two tables of data that are related to each other, we can use the Combine Tables step to join them into one table by matching rows between those tables.
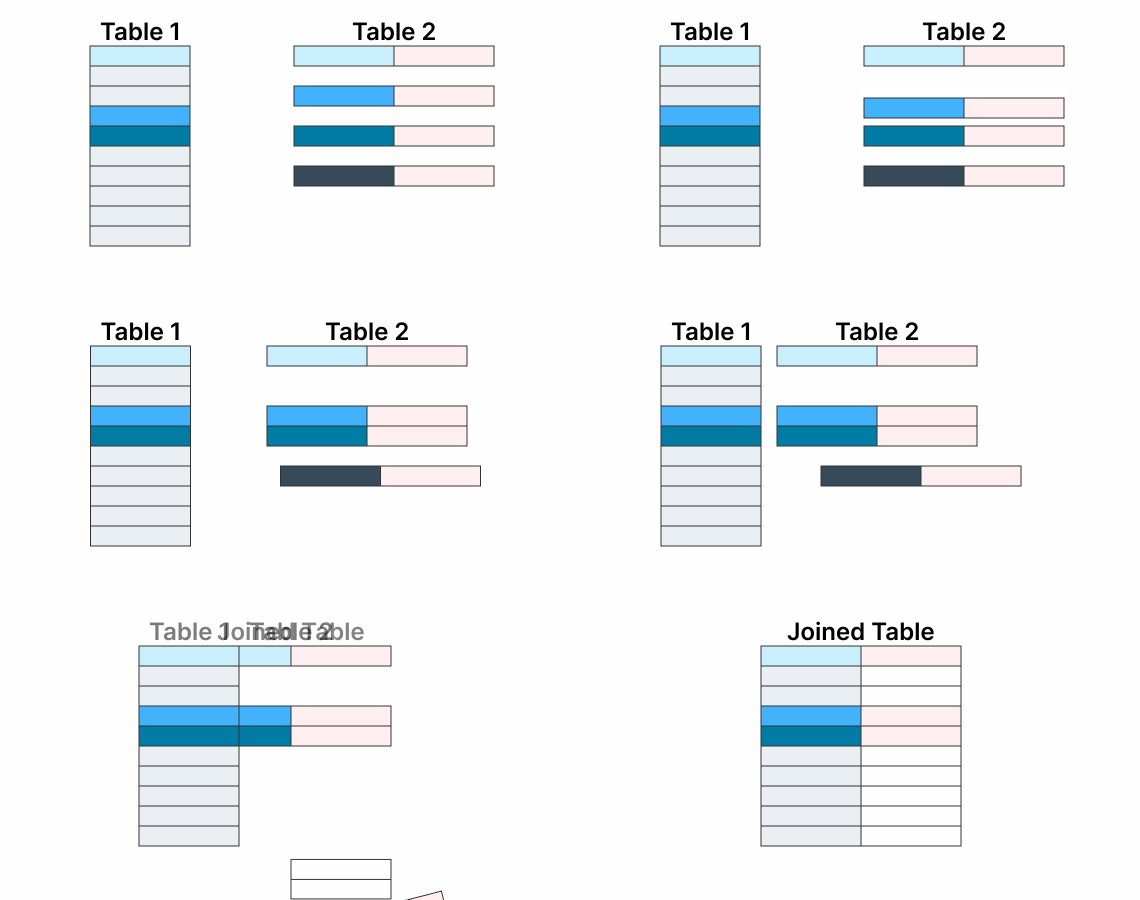
This step can handle combining two tables at a time. Once we set it up, we can use it repeatedly. Even if the quantity of rows changes, our step will continue working.
Check out the Parabola University video below to learn more about the Combine Tables step.
Input/output
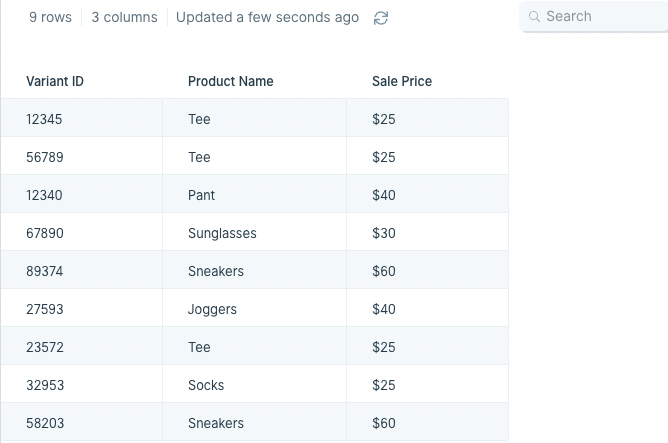
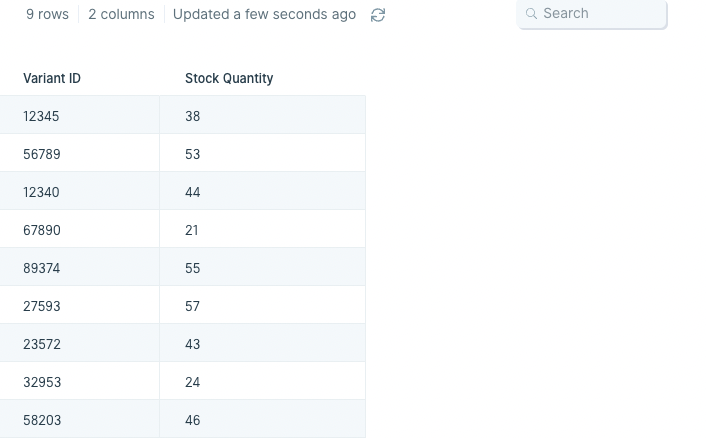
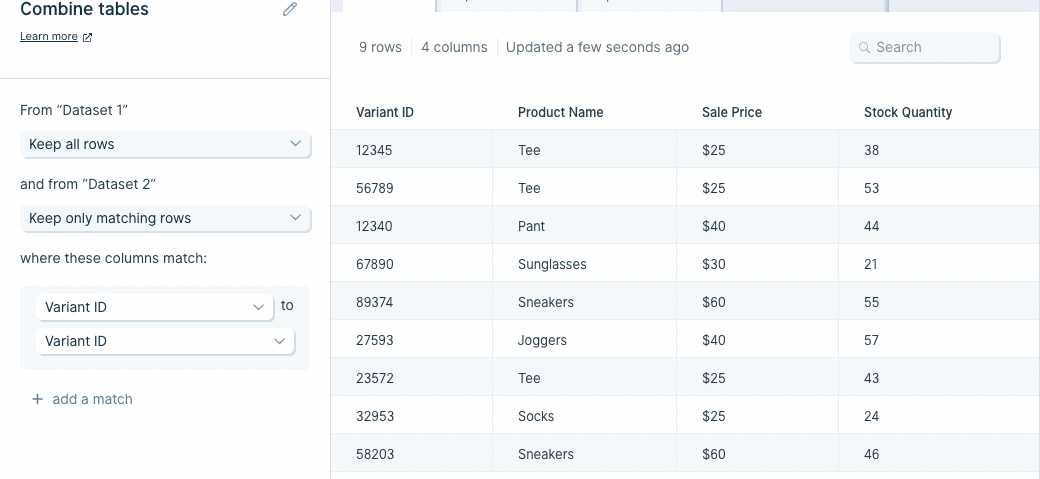
The Combine Tables step requires two data inputs to combine. In our example below, we have two tables feeding into it. The first one is a table with columns labeled 'Variant ID', 'Product Name', 'Variant Name', and 'Sale Price'. The second one is a table with headers 'Variant ID' and 'Stock Quantity'.
After using the Combine Tables step, our output data (shown below) has combined the 'Stock Quantity' column from the second table to the first table using 'Variant ID' as the matching identifier.

Custom settings
After connecting two datasets into this step, in the left-side toolbar choose whether you will 'Keep all rows' or 'Keep only matching rows' for your data sources using the drop down menus.
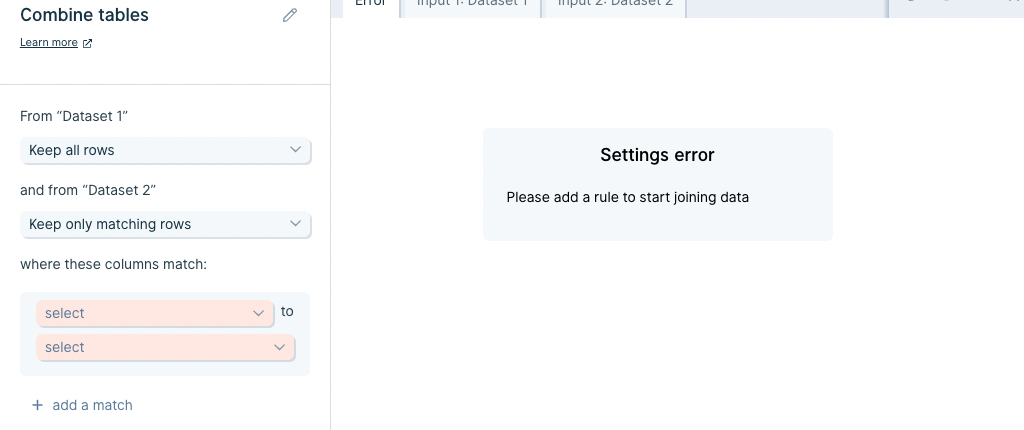
Then in the next set of options, click 'select' to access the dropdown menu of columns and select which ones to join the tables by. The column you choose should be present in both datasets, have identical values, and be used as the unique identifier between them.
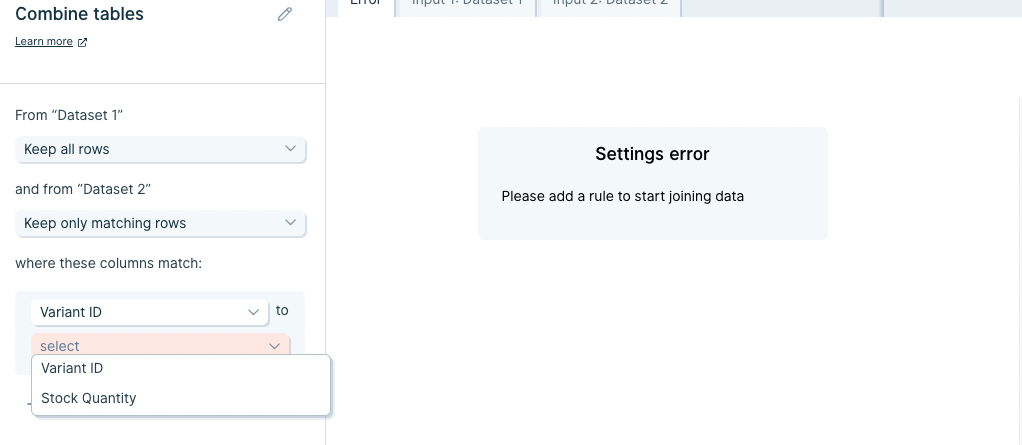
Once you're done, click 'Show Updated Results' to save and display the newly-combined tables.
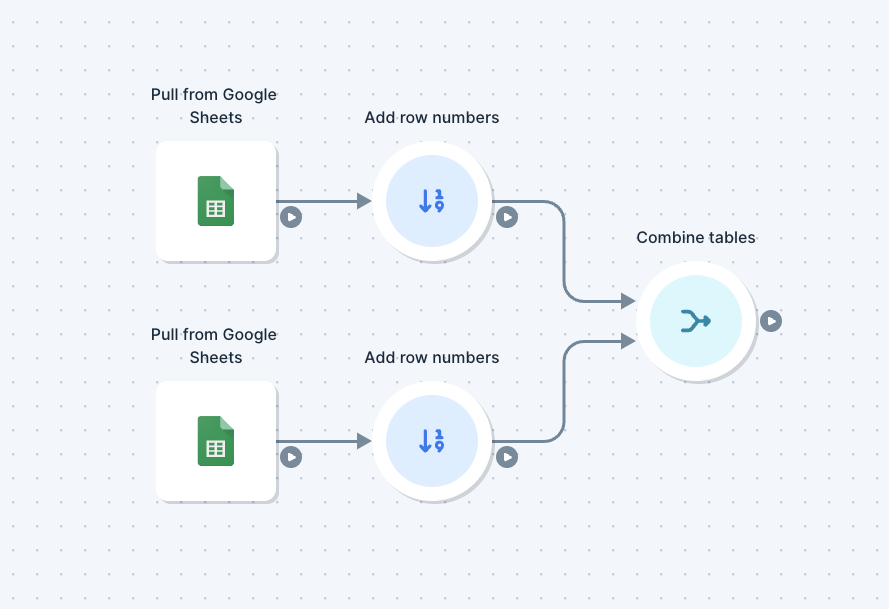
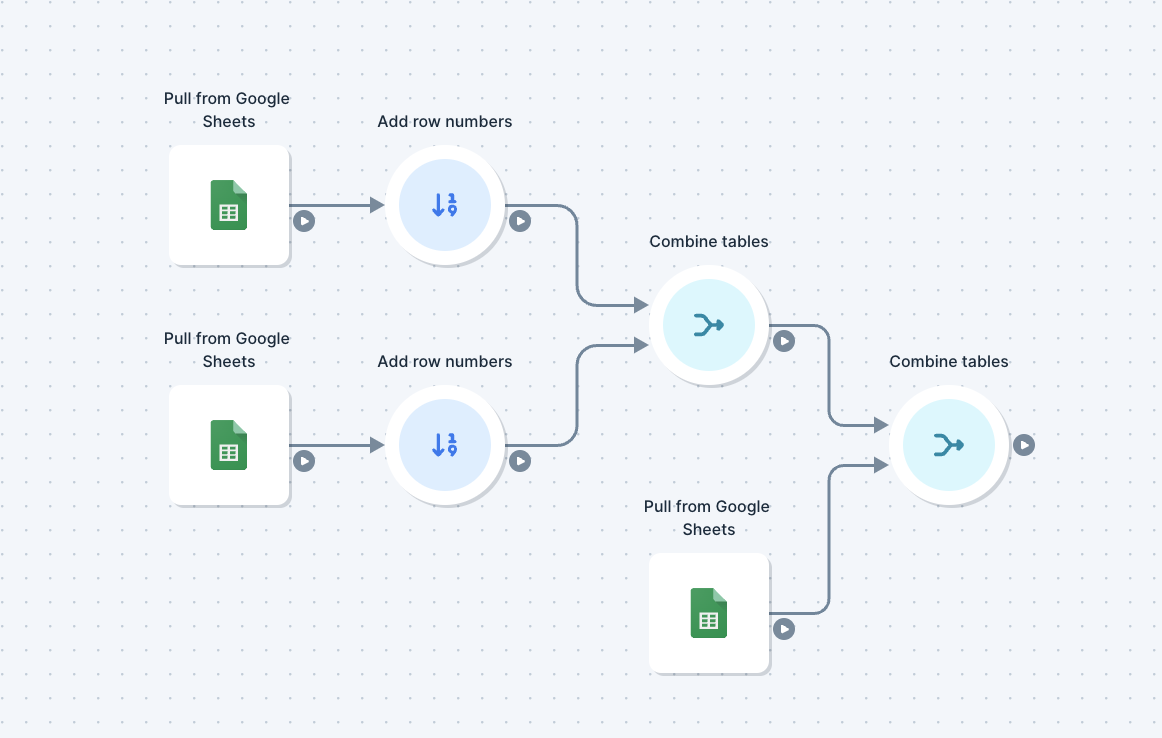
If the datasets you want to combine don't have a shared column of identical values, then you can use Add row numbers to make one in each table. You'd do this by connecting your import datasets to an Add row numbers step to generate matching columns with incrementally-increasing numbers.
Other ways to combine tables:
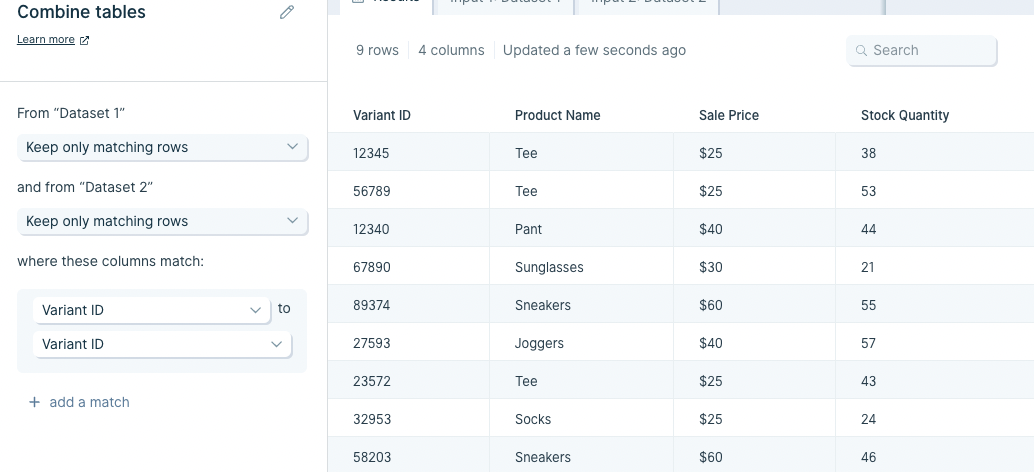
Now we've learned one example using our default settings. Let's explore the other ways that we can combine tables in Parabola. We can switch our Combine tables step to keep all rows that have matches in all tables. The resulting table will only contain rows that exist in every table we are combining.
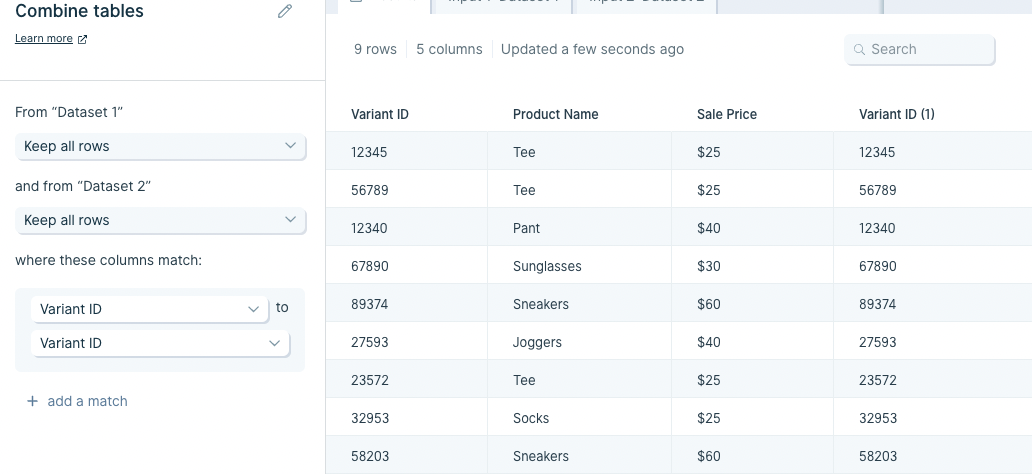
The last option is to keep all rows in all tables. This will create a resulting table that has every row from every table present. If no match was found for a specific row, it will still exist. This option has a tendency to create a lot of blank cells, and can be tricky to use properly.
Helpful tips
- The default setting for the Combine Tables step is the most common way to combine tables. It keeps the entire primary table and finds matches in the other tables, fitting them in to their matched rows as we go. If a row doesn't have a match in the primary table, it won't show up in the results.
- Fuzzy match is not supported. Find Overlap is a better option, which supports fuzzy comparison
- To combine three or more tables together, chain together multiple Combine Tables steps to merge your data.
- If we need multiple rules to determine a match, the default setting will find a match where any rules apply. We can change this so that rows match only when all of the rules apply.

Troubleshooting tips
Here are a few common questions that come up around the Combine tables steps and ways to troubleshoot them:
Issue: I’m seeing my rows multiplied in the results section of the Combine tables step.
Solution: It’s possible that you are matching on data that shows up multiple times in one or both of your sources. Check your inputs to make sure the selected matching columns have unique data in both inputs. If you don’t have a column with unique data, you may need to choose multiple columns to match on to make sure you’re not duplicating your rows.
Issue: I’m seeing a 'Missing columns' error in the Combine tables step.
Solution: This can happen when you remove or rename columns in your inputs, after you’ve already keyed to those columns in your Combine tables step. You’ll need to either reselect your matching columns in the step or pull in a new Combine tables step.
Transform step:
Compare dates
The Compare dates step compares dates between existing columns, or compares dates in a column against the date & time of your Parabola Flow run. This step is similar to the DATEDIF function in Excel.
Input/output
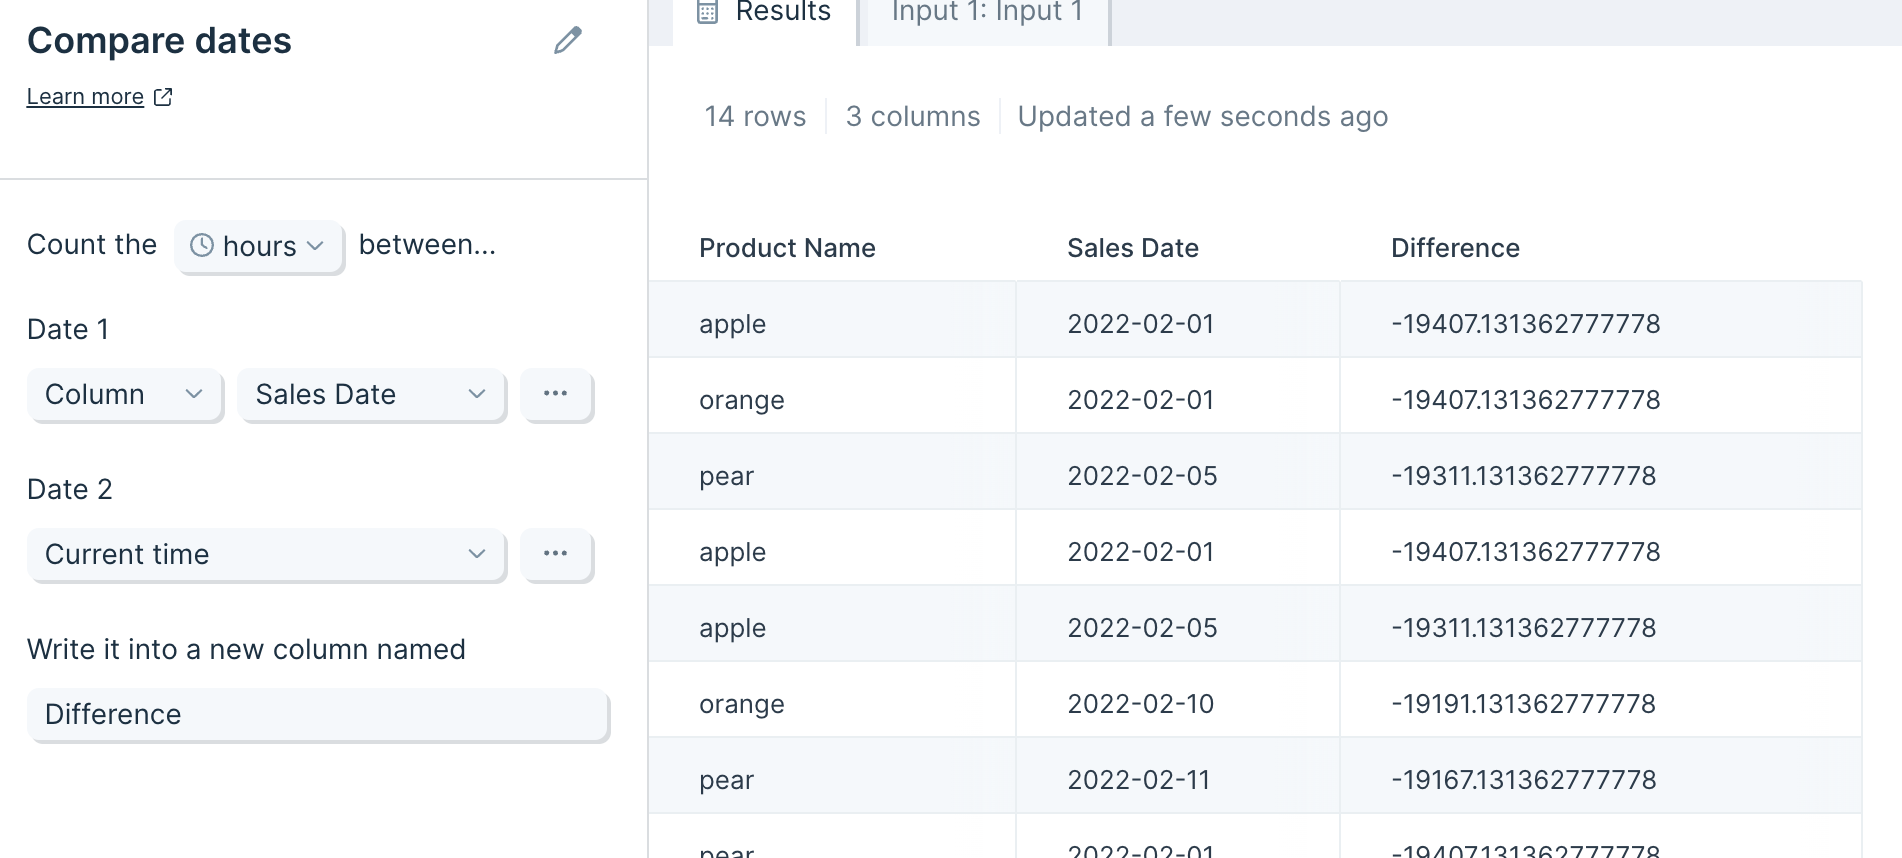
The data you connect to this step needs at least one column with date information. In this example, we pass a column called 'Sales Date' and compare that date against 'Current time'. The step produces a column (auto-named 'Difference') showing us the number of days between 'Sales Date' and 'Current time'.
Default settings
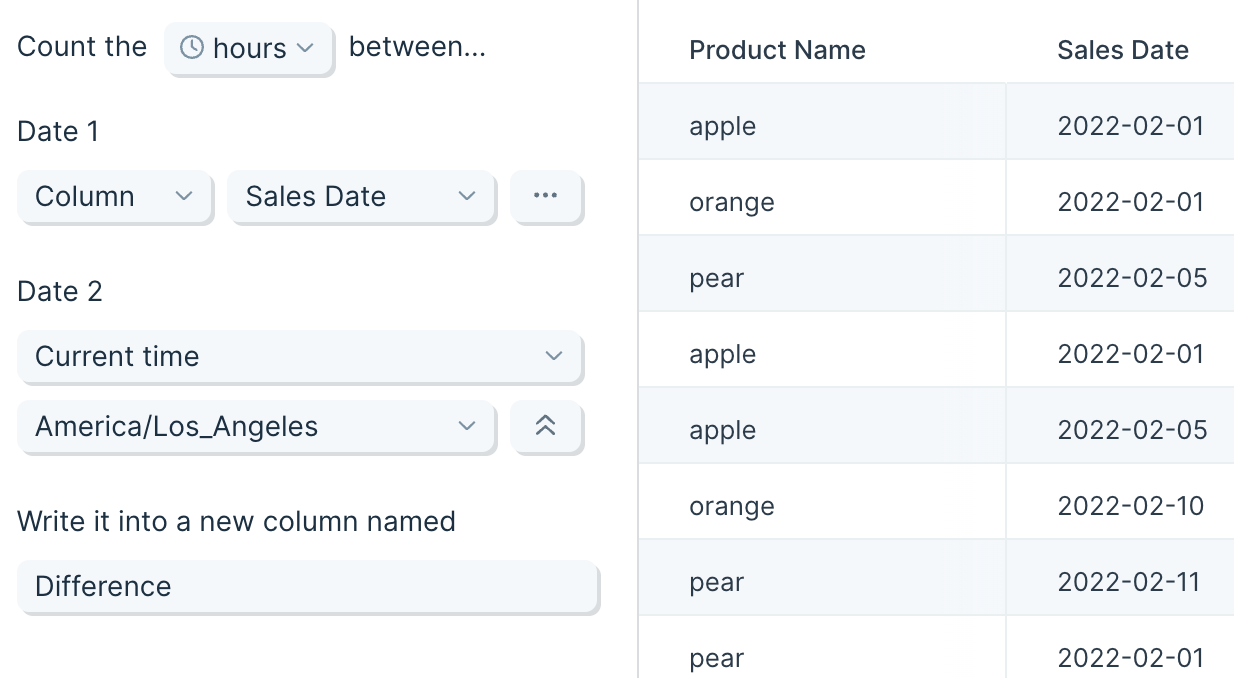
By default, this step will detect a column with the word "date" in its header, and find the number of hours between values in this column and the time at which the flow is run, writing the results into a new column. In this example, the step auto-selected the column 'Sales Date'.
Custom settings
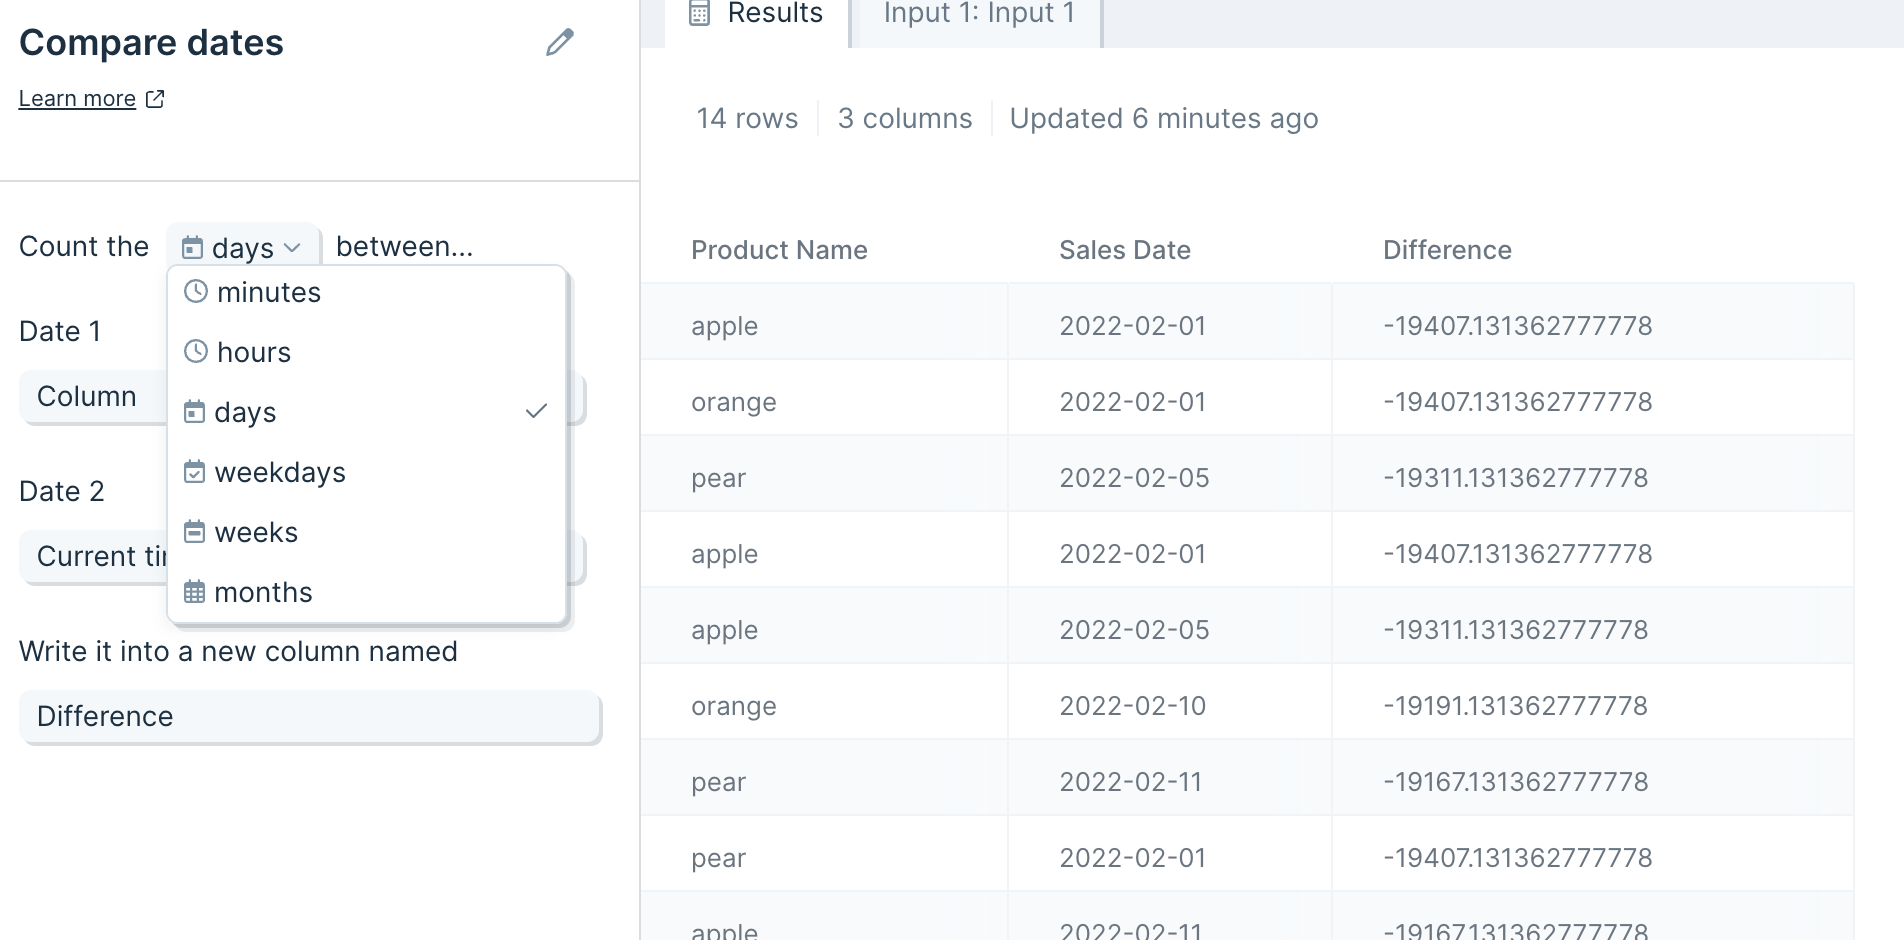
Select the unit of time you'd like to count by. The 'weekdays' option will calculate the number of days, excluding weekends, between the two dates, akin to the NETWORKDAYS function in Excel.
If your data has a time zone different from your current location's, you can indicate that in the step. You can find the time zone selection by clicking the three-dot button under 'Date 1' or 'Date 2'.
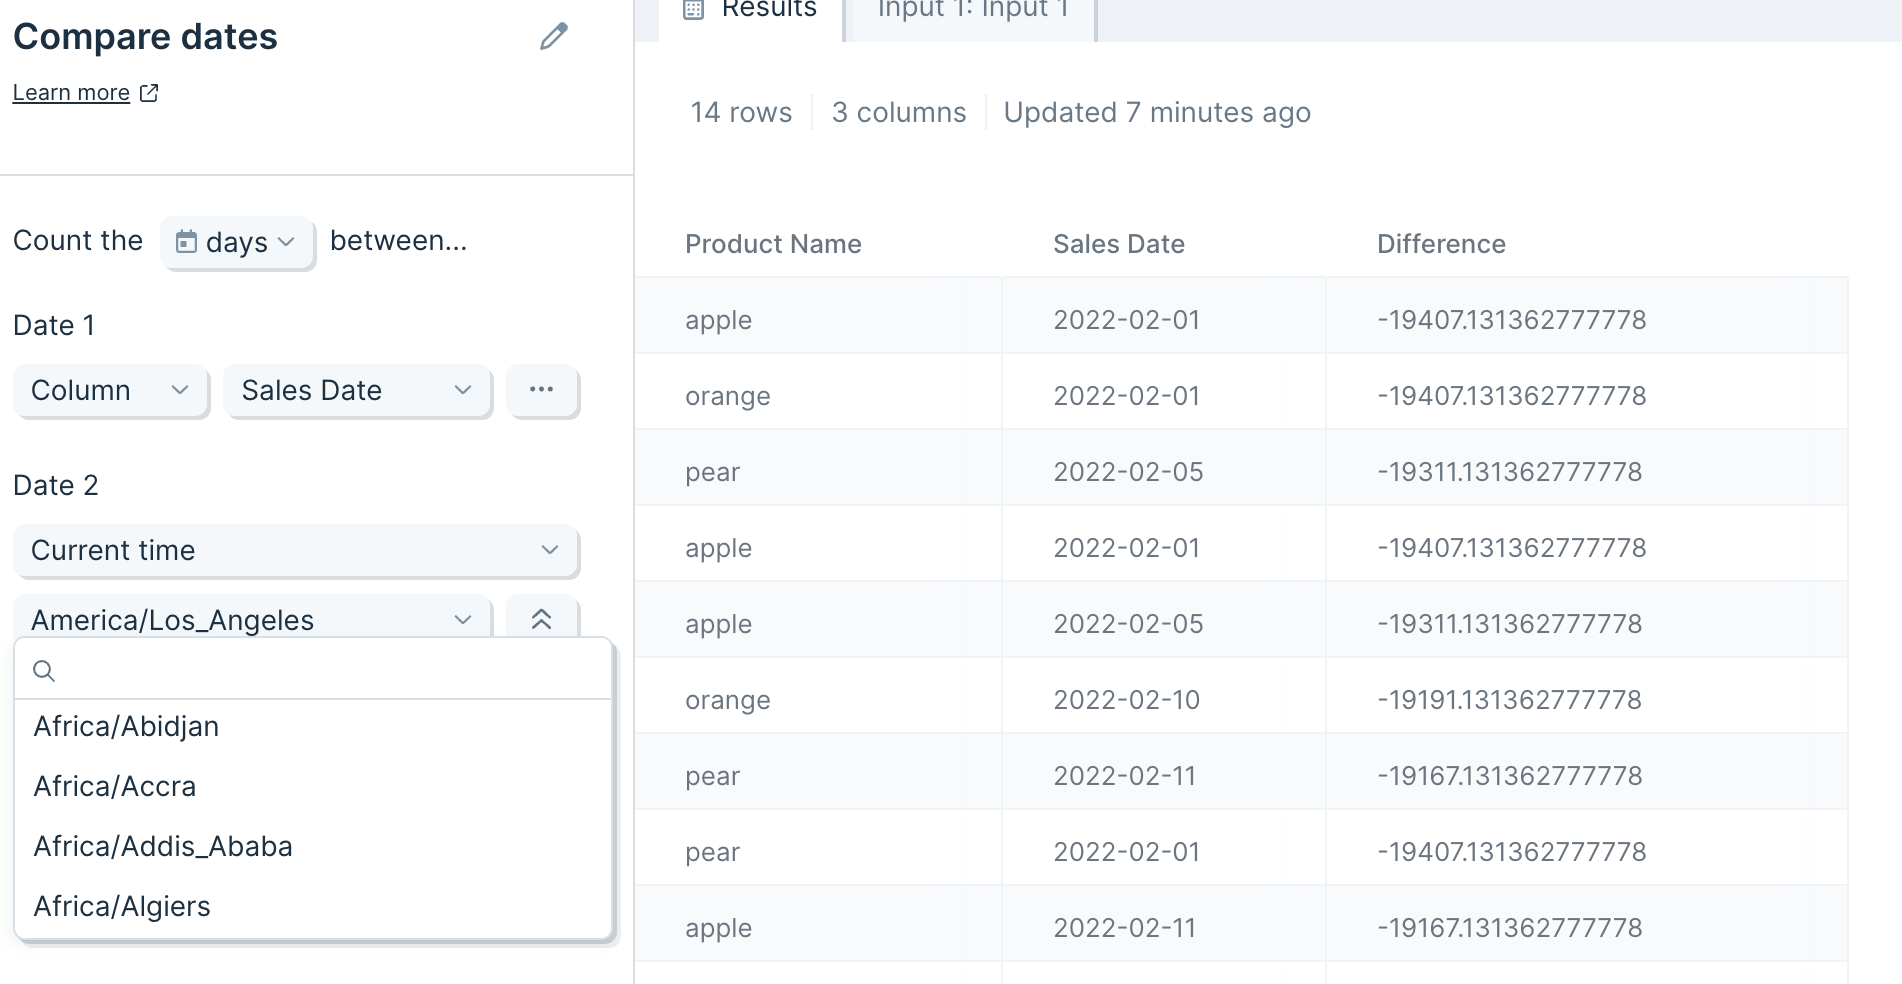
If you would like to compare between existing columns of date data, you may select another column in the table instead of the default 'Current time' option.

Helpful tips
- We suggest formatting your dates either as YYYY-MM-DD HH:mm:ss or X (Unix) for this step. You can use the Format dates step to get your date values in one of these formats.
- This step works well for calculations like "Time In Transit" -- calculate the difference between Delivered Date and Shipped Date
- By default, we determine the century by using a cutoff year of 2029. That means that two-digit years between “00-29” will be interpreted as the years between 2000-2029, and two-digit years between “30-99" will be interpreted as the years between 1930-1999.
- If any of the values being compared can't be recognized as a date or date-time, then the result will be blank for that row. Otherwise the output is always a number.
Transform step:
Count by group
The Count by group step counts the number of rows that exist for each unique value or combination of values in one or more columns. This step is similar to the COUNTIF function in Excel.
Watch this Parabola University video for a quick walkthrough of the Count by group step.
Input/output
Our input data is a list of ecommerce orders, including detailed data about items ordered.
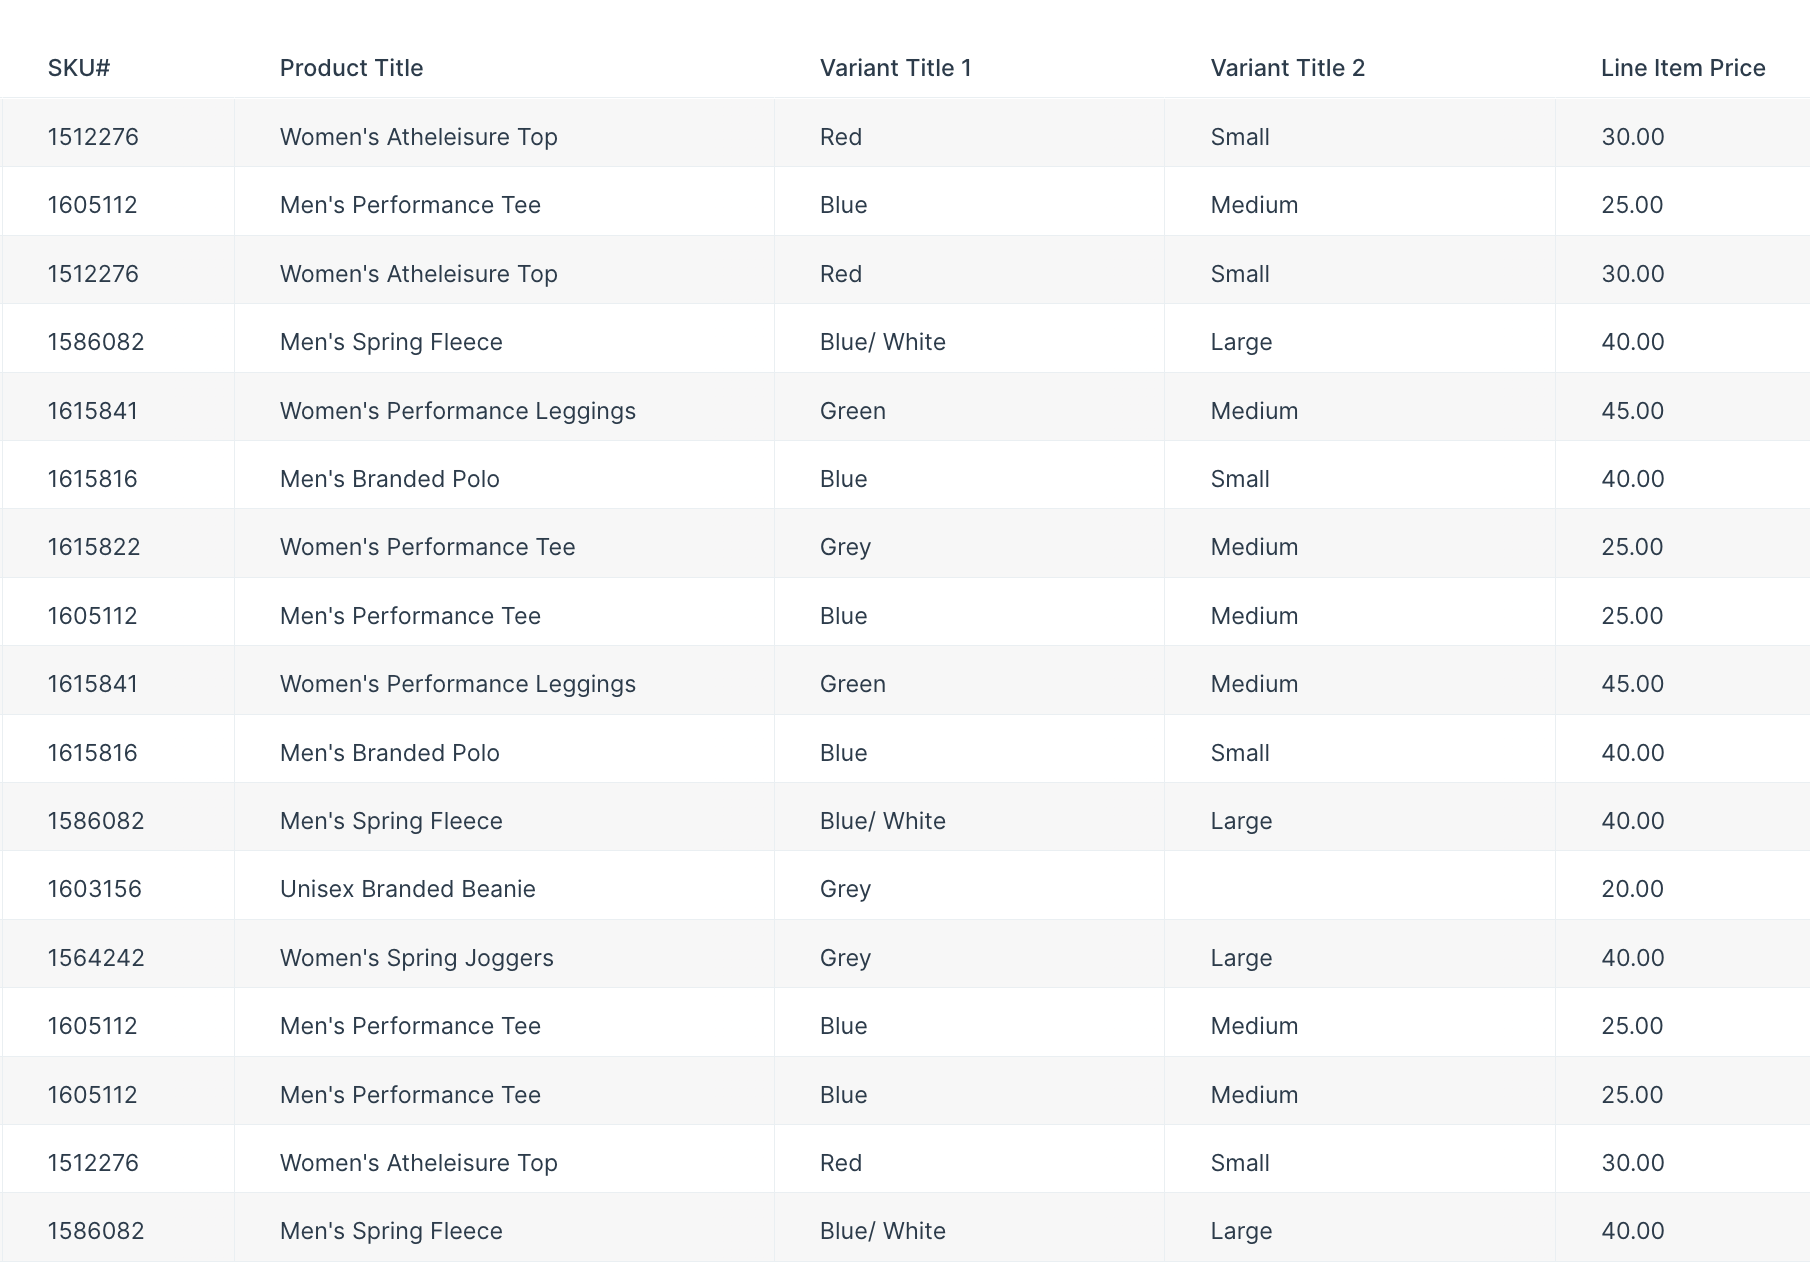
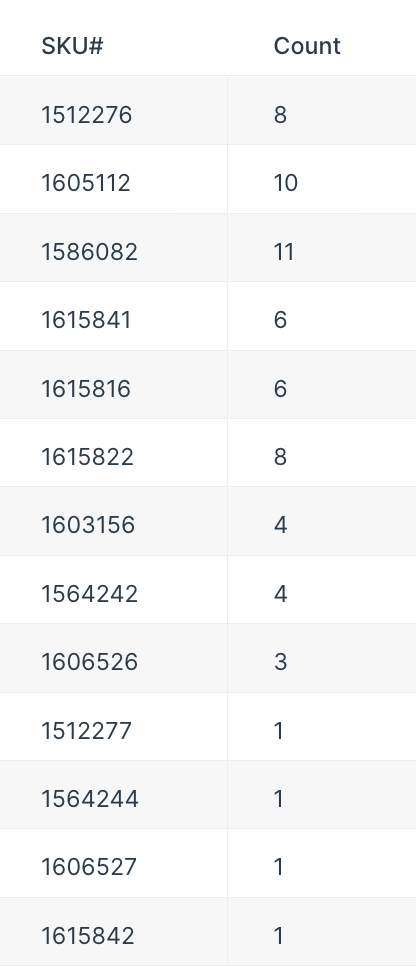
We want to know how many of each SKU was sold. With the step set up and data flowing through it, we can see that we our most popular item was SKU #1586082 with 11 items sold.
Default settings
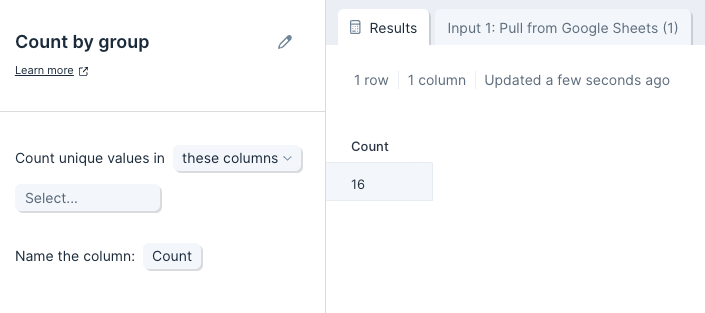
By default, this step will count every row as unique and display a 'Count' column with the same value as the number of rows in your input table.
Custom settings
To customize these default settings, you'll first select a column or multiple columns you'd like to count unique values in. Then, you'll title your new counting column.
Above, we wanted to count groups in a single column, so we selected 'SKU' from the dropdown and named the new column 'Count'. You can also add multiple columns if you want to count unique values for the combinations of those column values.
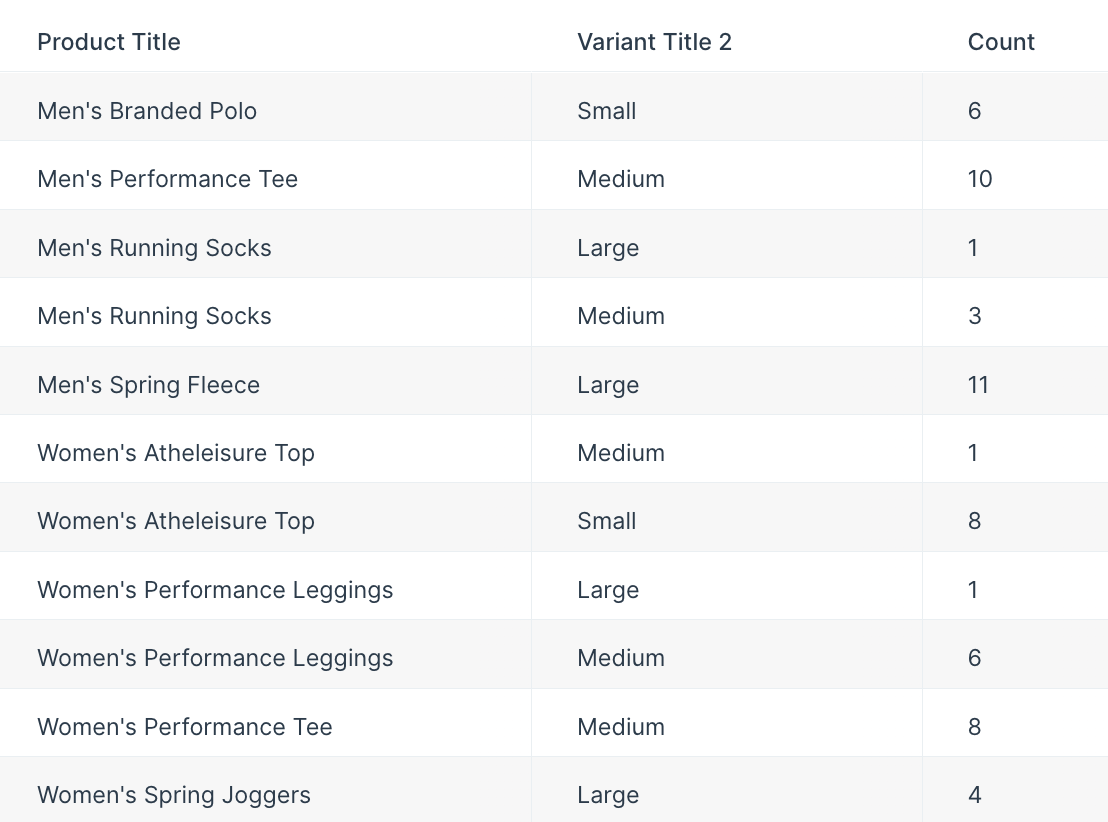
For example, if we want to count sizes sold of each item type, we can select 'Product Title' and 'Variant Title 2' (item sizes) from the dropdown to see these updated results. The results below show us that we sold significantly more small than medium women's athleisure tops.
Transform step:
Custom transform
Generate custom steps for your exact needs
The Custom transform step lets you describe the logic you want to run on your data, and automatically generates a custom step using AI. This improvement will eliminate complex building patterns, enable faster Flow building, and unlock totally new data transformation and analysis capabilities.

How to use the step
The Custom transform step works best for logic-based tasks—calculations, formatting, and structured transformations—similar to what you’d normally do with Excel formulas or Parabola’s other Transform steps.
Your input
- A table of data
- Data transformation instructions—exactly how you'd explain it to a teammate
- Example prompt: "Calculate total revenue for men's products by SKU per month. Return the following columns: Month, SKU, Product Title, and Revenue. Format revenue as currency ($100.00)."
Parabola's output
- An updated dataset, transformed based on your instructions
- Documentation outlining the logic in your AI-generated code
Locking your instructions
- Once you’re happy with the results of the step, you can select "Reuse logic (default)" to ensure consistent results. More in the FAQs below.
Try it now with sample data
Video overview
Example use cases
The list of ways that you can use this step are truly endless. Here are some examples for inspiration—and you can find fleshed-out example prompts below:
- Perform calculations across rows of data, like percent of total and weighted average calculations
- Perform date math, like adding a number of days or weeks to a date value to calculate SLA performance, or extracting the week-of-the-year as a number
- Perform complex statistical calculations, like finding the first and third quartile
- Create pivot tables or add subtotal and total rows, like a dynamic sales report where you can see both sales totals and averages by metric
- Dynamically convert column names based on patterns, like assigning week numbers to columns for upcoming periods in your demand planning table
- Duplicate rows based on conditional logic, like duplicating order line items with where the quantity is greater than one for your 3PL
- Add rows to fill in the values between two numbers or dates, like filling in all values between two zip codes
- Extract text using custom logic, like extracting values from the middle of a consistently-formatted list
- Generate unique IDs, like SKUs for all new parts received from a vendor
- [Beta] Create JSON schemas and HTML tables, like API request bodies and nicely-designed tables to insert in email bodies
In short: If you can describe it in code or Excel, you can probably build it with this step.
Build your own use case using a custom transform
Templates
Want to see the step in action? Explore these Templates from our use case library that leverage this step:
- Carrier scorecard: In this Template, we use the Custom transform step to calculate scorecard metrics such as damage-free rate, total shipments by carrier, and on-time performance. We also use the step to generate an HTML-formatted table, which we then include in a Send email by rows step.
- Inventory reconciliation: To identify discrepancies in this Flow, we use a Custom transform step to remove retired products, calculate discrepancies across our ERP, WMS, and Shopify, and then output a "SKU Status" column indicating where discrepancies exist.
- Freight & parcel invoice audit: To identify billing overages, in this Template we use a Custom transform step to calculate discrepancies between our quoted rate and amount invoiced—calculating both the actual amount and a percentage. From there, we format our results accordingly.
Best practices
As with any tool that leverages LLMs, the more specific your instructions are, the better your results will be. Here are some prompting tips:
- Be as specific as possible regarding your target output. Specify whether columns or rows should be added, removed, or modified. If you’re adding new columns, specify how you want the column(s) to be named.
- In your instructions, reference exact column names from your input table.
- Use examples to clarify complex logic.
Beyond prompting, here are some additional best practices:
- Break large processes into multiple Custom transform steps to maintain Flow readability and improve results. The more you ask the LLM to do in a single prompt, the less accurate the results will be.
- Enable “Keep this logic” once your results are accurate.
- If you need help fine-tuning your prompt, run it through ChatGPT and ask, “How should I improve these instructions for use in Parabola’s Custom transform step?”
- If your Flow results on values being very standardized after this step, consider using a Standardize with AI step for post-processing.
Put these into practice in-app
Example prompts
These prompts are meant to show off some common categories of use cases for the Custom transform step. They should also provide guidance for what "good prompting" looks like in practice:
Conditional if/else logic
- SLA monitoring: Create a new column called “SLA Status.” Compare the “Order date” against the “Shipment date” columns. If the difference between the two dates is 2 business days or less, set the column value to, “Within SLA.” If the difference is 3 business days or more, return the value, “SLA Breach.”
- Refund reporting: If the "Order Status" column equals "Cancelled" and "Payment Received" equals "No," create a new column called "Refund Action Needed" with the value "Initiate Refund"; otherwise set it to "No Action." Capitalize all values.
- Shipping categorization: Create a column named "Shipping Category" where if "Shipping Time (Days)" is less than or equal to 2, set it to "Express"; if between 3 and 7, set it to "Standard"; if greater than 7, set it to "Delayed." Output should be in all uppercase letters.
Simple math calculations
- Price calculation: Create a column "Discounted Price (USD)" by taking "Original Price" * (1 - ("Discount %" / 100)). Format results as currency with two decimal places, e.g., $123.45.
- Days to ship: Create a new column called "Days to Ship" by subtracting "Order Date" from "Ship Date." Ensure the result is a whole number and append the word "days" (e.g., "5 days").
Complex math calculations & statistics
- Percentiles: Using the "Total Spend (USD)" column, calculate the percentile rank for each customer based on their total spend compared to all customers. The percentile rank should represent the percentage of customers who spent less than the current customer. Store the result in a new column named "Spend Percentile (%)". Format the value as a percentage with two decimal places (e.g., "92.45%"). Example: If a customer’s spend is higher than 92% of other customers, their "Spend Percentile (%)" should show "92.00%". Only consider customers with "Account Status" equal to "Active" when calculating percentile rankings.
- CAGR: Calculate the "CAGR (%)" using "Initial Investment," "Final Value," and "Investment Years" columns, using the formula: ((Final Value / Initial Investment)^(1/Investment Years) - 1) * 100. Round to two decimal places and format results with a "%" symbol at the end.
- Weighted average: Compute a "Performance Score" by multiplying "Test Score" * 0.5 + "Project Score" * 0.3 + "Attendance Score" * 0.2. Output this score rounded to the nearest whole number and store it in a new column called "Total Performance (Pts)."
Discrepancy detection & validation
- Rate audit: Create a new column called "Pricing Discrepancy Flag." If "Expected Price" and "Billed Price" differ by more than 5%, mark it as "Review Needed"; otherwise, "OK." Format results in title case.
- Data validation: Create a column "Date Validation Result" where if "Contract End Date" is earlier than "Contract Start Date" or if "Contract Length (Months)" is negative, set value to "Invalid Dates"; otherwise "Valid." Results should be in all caps.
Text parsing and extraction
- Domain extraction: From the "User Email" column, extract the domain (everything after "@") and store it in a new column called "Email Provider," converting all domains to lowercase.
- Zip code parsing: From the "Address" column, extract just the ZIP code assuming it is always the last 5 digits, and store it in a new column called "ZIP Code" as a pure numeric field (no quotes or special characters).
Data clean-up & formatting
- Name clean-up: Clean the "Full Name" column by trimming leading/trailing spaces, replacing multiple spaces with a single space, and converting names to title case (e.g., "mARy aNN SMITH" becomes "Mary Ann Smith").
- Phone number reformatting: In the "Phone Number" column, remove any non-numeric characters and reformat numbers in the (XXX) XXX-XXXX format. Output clean phone numbers in a new column called "Formatted Phone Number."
JSON & HTML generation
- Building HTML block: Create an HTML <div> block for each product, formatted as: <div><h2>Product Name</h2><p>Price: $Price USD</p></div>. Use the columns "Product Name" and "Price." Store it in a column called "Product HTML Snippet."
- Slack message request body generation: Create a new column called, “Slack message JSON.” Use the data in the row to generate a JSON-formatted Request Body for me to put into a Slack API call. Ensure the JSON is valid. In the message, include information about the product sold and total revenue. For instance, "New sale! 4 Women's Atheleisure Tops were sold for $120." Format currency with zero decimals. Follow the JSON scheme outlined below:
Pivot-table-style reformatting
- Sales reporting by country: Group by "Country" and sum "Total Sales (USD)," "Units Sold," and "Profit Margin." Output one summarized row per country, rounding all monetary fields to two decimal places. Include a currency sign (ex. $120.70).
- Adding total rows: Analyze the product sales data and return the following columns, formatted as outlined in parenthesis: Product Title, Total Sales (Currency: $100.00), Quantity Sold (Integer: 1 or 40), Avg Units Sold per Day (Rounded to 1 decimal place: 20.7). Do not include the information in parenthesis in the header names. Sort the data by Men’s, then Women’s, then Unisex. Under each category of products, include a sub-total row (for instance, showing total sales across all men’s products). Put the sub-total row directly under the corresponding category rows in the middle of the table, and print "{GENDER} SUB-TOTAL" in all caps. At the bottom of the dataset, include a total row that aggregates/averages metrics across every row.
Table reformatting
- Pivoting values to headers: Pivot the dataset so that each unique value in the "Order Month" column becomes a new column, and the corresponding "Revenue" values are placed into each month’s column. For example: If "Order Month" has "January" and "February," create two new columns "Revenue - January" and "Revenue - February" populated with the "Revenue" amount. Fill in "0" where a month is missing for a customer. Store the pivoted result and maintain the original "Customer ID" and "Customer Name" columns at the beginning.
- Creating category headers: Pivot the dataset where each unique "Payment Method" (e.g., Credit Card, PayPal, Gift Card) becomes a new column. Populate the new columns with the total "Amount Paid" for each customer. Example: Create columns "Credit Card," "PayPal," etc. Missing payment types for customers should be set to "$0.00". Format all amounts as currency with two decimal places.
Try it now with sample data
FAQs
- Q: How broad should my prompts be within a single step?
- A: Custom transform step results will be most accurate with focused prompts. Think about one Custom transform step as doing a similar amount of work as any other Parabola Transform step for best results. For more complex tasks, consider using multiple Custom transform steps
- Q: When should I use out-of-the-box Transform steps (like Filter rows) vs. Custom transform?
- A: If a step already exists for the transformation you’re trying to accomplish, we will always recommend using the pre-built step. Steps like Edit columns and Add math column have been extensively tested by Parabola’s engineering team to ensure they are performative and results are accurate. We recommend you use a Custom transform step when you need a step that doesn’t yet exist.
- Q: Can this step accept multiple inputs or combine tables?
- A: The Custom transform step can only accept a single input table; it cannot take two or more input tables. Continue using steps like Combine tables and Stack tables for multi-input transformations.
- Q: What’s the difference between “Regenerate logic” and “Reuse logic”?
- A: Regenerate logic: When this setting is enabled, the step will re-evaluate your instructions and data every time the step runs before generating the custom code that powers your step. This is like getting a fresh set of eyes on the data and instructions every time, and can be useful if context from your data may change from run-to-run and should be taken into consideration when step logic is being generated.
- A: Reuse logic: We recommend using this option. When this setting is enabled, we’ll use the same logic that was generated every time the Flow runs without re-looking at your instructions or data. This ensures that your step logic stays consistent from run to run.
- Q: When should I use steps like Experiment with AI or Categorize with AI instead of a Custom transform step?
- A: The Custom transform step is best for logic-based transformations—especially those involving math or data analysis.For interpreting or generating content, steps like Extract with AI and Categorize with AI will be the most useful.
- Q: Can this step pull information from the web or external services?
- A: No; this step cannot search the web today. You can use Parabola’s API steps to pull in external data.
- Q: How is this step priced?
- A: The Custom transform step is included on all plans at launch at no additional cost. Parabola reserves the right charge for usage of AI-powered steps.
- Q: Are there any step limitations or ‘gotchas?’
- A: Keep these in mind when working with this step:
- This step works best when tabular data is coming in and out, just like our normal Transform steps. While the step does have some HTML- and JSON-generating capabilities, these additional output formats are in beta today.
- This step can only take a single table in.
- This step cannot search the web.
- This step cannot accept multiple inputs.
- Keep in mind that LLM-generated steps can be less predictable than pre-built Parabola steps.
- A: Keep these in mind when working with this step:
Transform step:
Edit columns
The Edit columns step allows you to keep or remove columns, rename them, and then reorder those columns – all in one step!
This step replaces the following steps: Select columns, Rename columns, and Reorder columns.
Check out this Parabola University video to see the Edit columns step in action.
Keep or remove columns
When you first connect your data into the Edit columns step, the 'Keep / remove' section will auto-select to Keep all columns. From the dropdown you will have 3 options:
If you choose 'Keep all columns', you will see all of the columns in your data present.
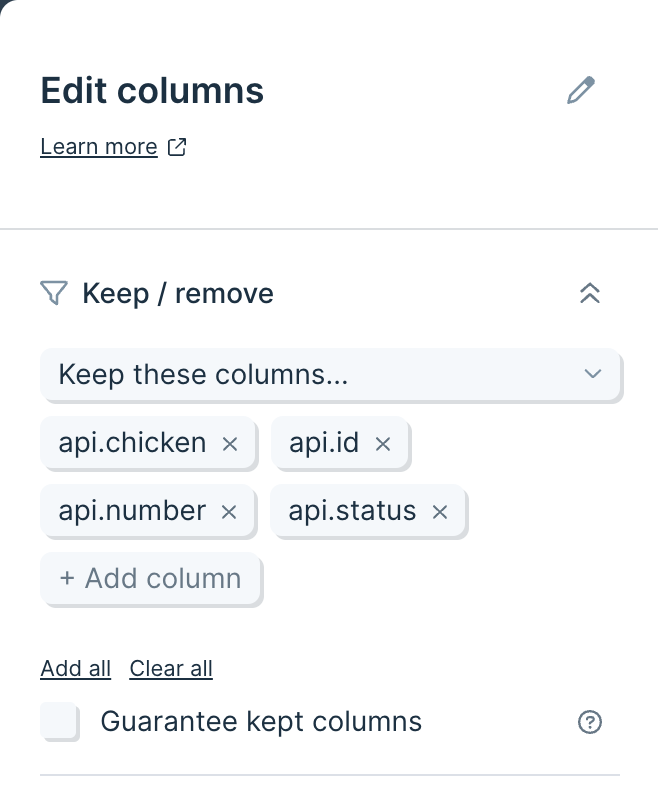
Choosing 'Keep these columns...', will allow you to select the columns that you would like to keep. You can use the 'Add all' or 'Clear all' button if you need to bulk update or clear your selection.
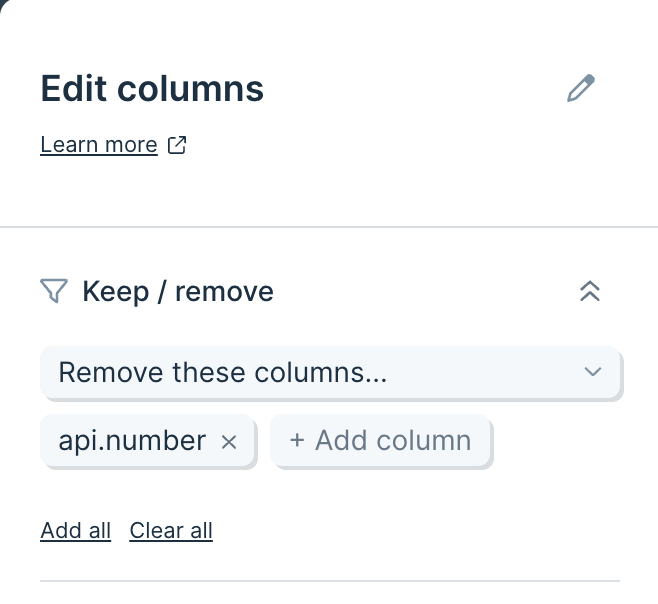
The 'Remove these columns...' option will remove selected columns from your table. There are 'Add all' and 'Clear all' options that you can use to list all columns, or clear your selection.
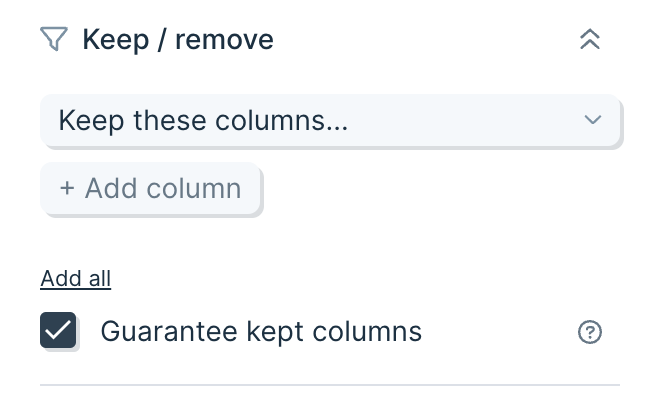
There is an option to 'Guarantee kept columns'. Guaranteed columns are kept even if they are absent in subsequent runs (e.g., due to an API that doesn’t include a column of data if it’s blank). Check the box to keep your columns even if they are later missing from the data you are pulling in.
Rename and reorder columns
From the 'Rename / reorder' section of the step, you can update the names of your columns. To do this, click the name of the column, and type to update. If you need to revert the names of your columns, you can do so individually by clicking the counterclockwise arrow next to the column name, or in bulk by clicking the 'Reset names' button.
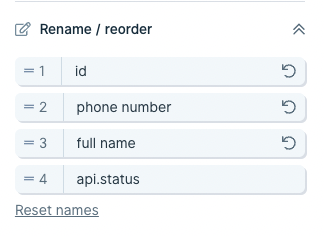
To update the order of your columns, click and drag the handles ('=') to the left of the column positions and drag into place. Alternatively, you can click the position number and type in a new number. You can revert the column order by clicking 'Reset order'.
By default, any new columns will be placed at the end of your table of data. If you disable this checkbox, only columns that you have explicitly moved to new positions will be reordered, and all other columns will attempt to position themselves as close to their input position as possible.
.png)
When this checkbox is disabled, any column that has been moved into a specific position will show a bold drag handle icon and position number.
.png)
Disabling this setting is best used when you know you need specific columns in specific numerical positions, and do not want to reorder the other columns.
If you have an Edit Columns step that existed prior to this change, disabling the checkbox will show all columns with bold positions, indicating that they are all in set locations. To fully take advantage of this feature with an existing Edit Columns step, disable the checkbox and click “reset order”. Resetting this step will allow you to place columns in exact positions.
Transform step:
Enrich with API
Use the Enrich with API step to make API requests using a list of data, enriching each row with data from an external API endpoint.
Input/output
Our input data has two columns: "data.id" and "data.employee_name".
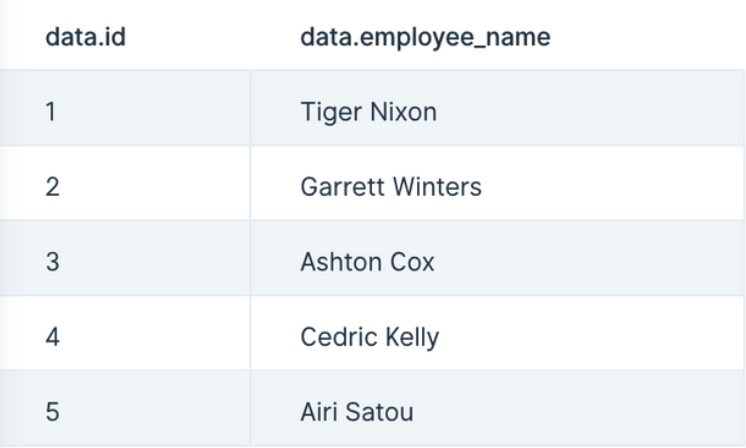
Our output data, after using this step, has three new columns appended to it: "api.status", "api.data.id", and "api.data.employee_name". This data was appended to each row that made the call to the API.

Custom settings
First, decide if your data needs a GET or POST operation, or the less common PUT or PATCH, and select it in the Type dropdown. A GET operation is the most common way to request data from an API. A POST is another way to request data, though it is more commonly used to make changes, like adding a new user to a table. PUT and PATCH make updates to data, and sometimes return a new value that can be useful.
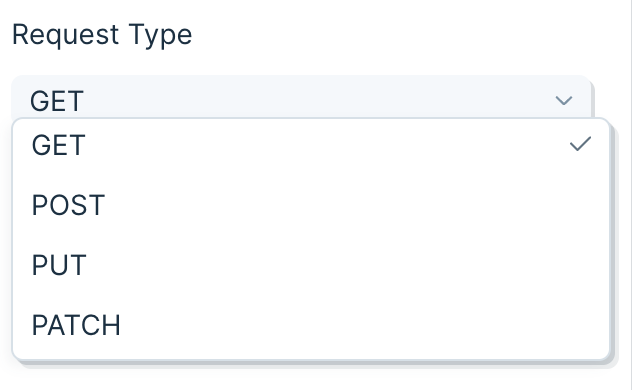
Insert your API endpoint URL in the text field.
Sending a body in your API request
- A GET cannot send a body in its request. A POST can send a Body in its request. In Parabola, the Body of the request will always be sent in JSON.
- Simple JSON looks like this:
{ "key1":"value1", "key2":"value2", "key3":"value3" }
Using merge tags
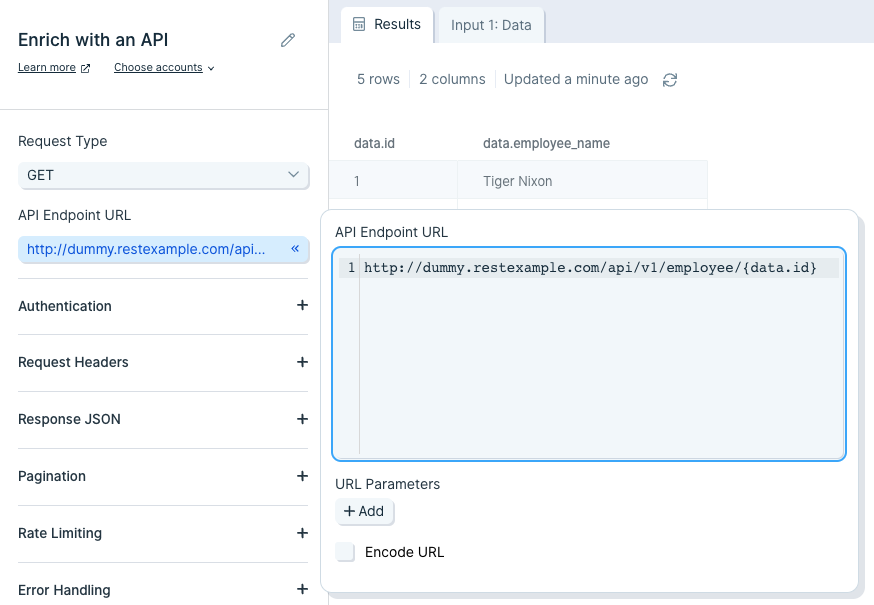
- Merge tags can be added to the API Endpoint URL or the Body of a request. For example, if you have a column named "data.id", you could use it in the API Endpoint URL by including {data.id} in it. Your URL would look like this:
http://third-party-api-goes-here.com/users/{data.id}
- Similarly, you can add merge tags to the body.
{
"key1": "{data.id}",
"key2": "{data.employee_name}",
"key3": "{Type}"
}
- For this GET example, your API endpoint URL will require an ID or some sort of unique identifier required by the API to match your data request with the data available. Append that ID column to your API endpoint URL. In this case, we use {data.id}.
- Important Note: If the column referenced in the API endpoint URL is named "api", the enrichment step will remove the column after the calculation. Use the Edit Columns step to change the column name to anything besides "api", such as "api.id".
Authentication
Most APIs require authentication to access their data. This is likely the first part of their documentation. Try searching for the word "authentication" in their documentation.
Here are the authentication types available in Parabola:
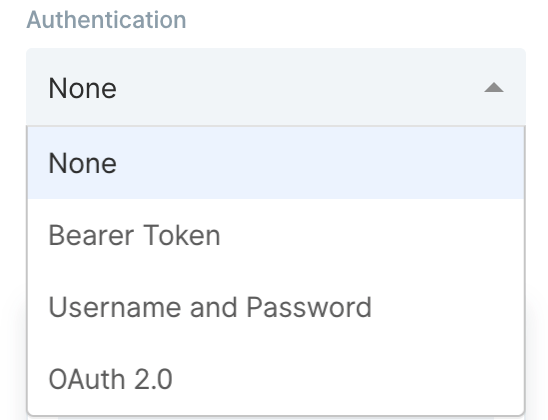
The most common types of authentication are 'Bearer Token', 'Username/Password' (also referred to as Basic), and 'OAuth2.0'. Parabola has integrated these authentication types directly into this step.
Bearer Token
This method requires you to send your API key or API token as a bearer token. Take a look at this example below:

The part that indicates it is a bearer token is this:
-H "Authorization: Bearer sk_test_WiyegCaE6iGr8eSucOHitqFF"
To add this specific token in Parabola, select 'Bearer Token' from the 'Authorization' menu and add "sk_test_WiyegCaE6iGr8eSucOHitqFF" as the value.
Username and Password (Basic)
This method is also referred to as "basic authorization" or simply "basic". Most often, the username and password used to sign into the service can be entered here.
However, some APIs require an API key to be used as a username, password, or both. If that's the case, insert the API key into the respective field noted in the documentation.
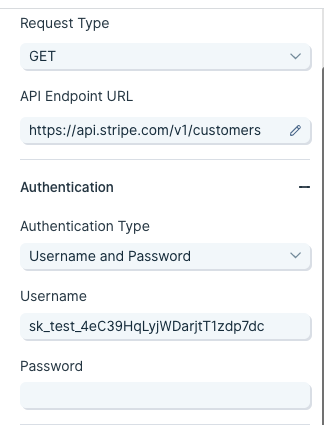
The example below demonstrates how to connect to Stripe's API using the basic authorization method.

The endpoint URL shows a request being made to a resource called customers. The authorization type can be identified as basic for two reasons:
- The -u indicates a username.
- Most APIs reference the username and password formatted as username:password. Here, there is a colon with no string following, indicating that only a username is required for authentication.
To authorize this API in Parabola, fill in the fields below:
OAuth2.0
This method is an authorization protocol that allows users to sign into a platform using a third-party account. OAuth2.0 allows a user to selectively grant access for various applications they may want to use.
Authenticating via OAuth2.0 does require more time to configure. For more details on how to authorize using this method, read our guide Using OAuth2.0 in Parabola.
Expiring Access Token
Some APIs will require users to generate access tokens that have short expirations. Generally, any token that expires in less than 1 day is considered to be "short-lived" and may be using this type of authentication. This type of authentication in Parabola serves a grouping of related authentication styles that generally follow the same pattern.
One very specific type of authentication that is served by this option in Parabola is called "OAuth2.0 Client Credentials". This differs from our standard OAuth2.0 support, which is built specifically for "OAuth2.0 Authorization Code". Both methods are part of the OAuth2.0 spec, but represent different grant types.
Authenticating with an expiring access token is more complex than using a bearer token, but less complex than OAuth2.0. For more details on how to use this option, read our guide Using Expiring Access Tokens in Parabola.
Transform step:
Expand JSON
The Expand JSON step converts JSON into a spreadsheet table format.
JSON stands for "JavaScript Object Notation" and is a widely-used data format. If you're using APIs, you've likely come across JSON and may want to expand it to access the data nested inside it.
If you're trying to troubleshoot a JSON expansion issue, reference this community post.
Input/output
Our table below shows the result of a GET call made to a free API: https://api.punkapi.com/v2/beers. This data has multiple JSON columns within a table of 25 rows and 21 columns.
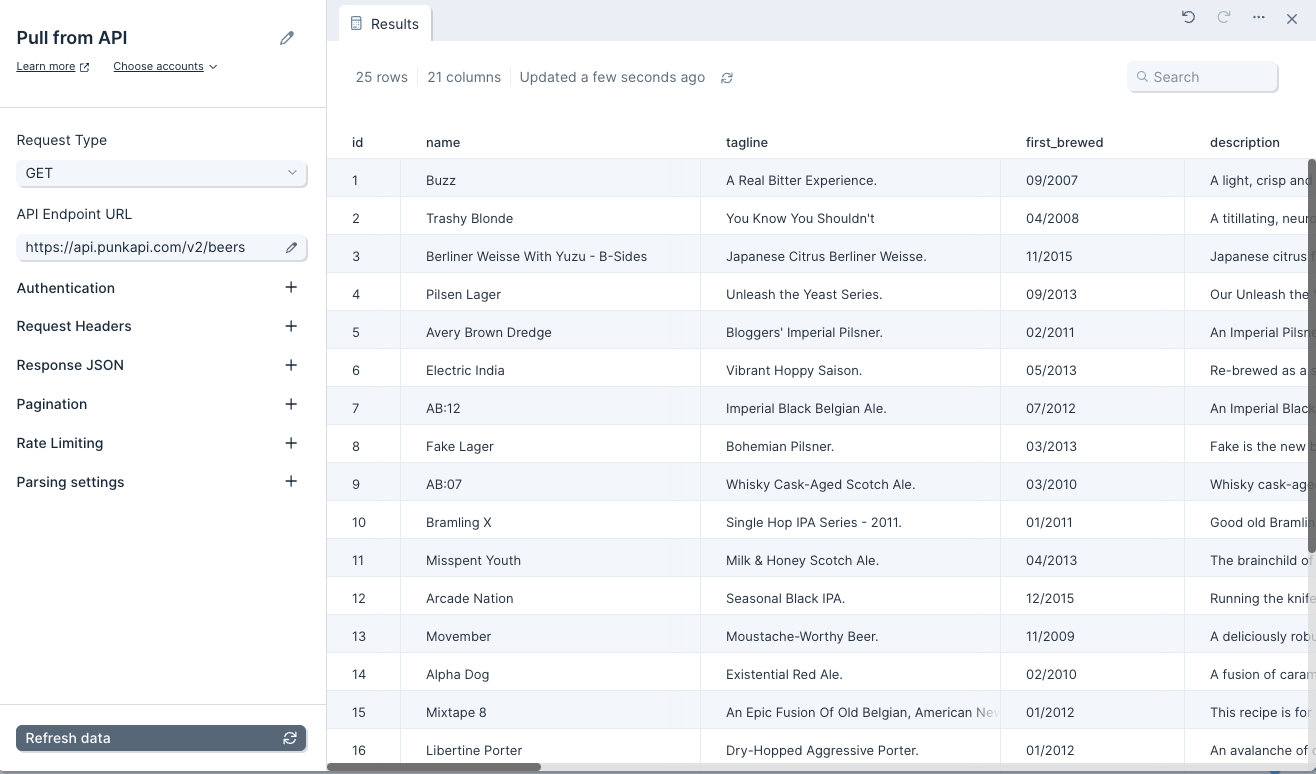
Below is the JSON object from one cell in the 'method' column, formatted for easier reading. This cell is in the row where the value in column 'name' is equal to 'Berliner Weisse With Yuzu - B-Sides'.

Once we use the Expand JSON step, our output data becomes 28 rows and 30 columns. We've gained 3 rows and 9 columns after expanding the "method mash_temp" dataset with all non-datasets also expanded.
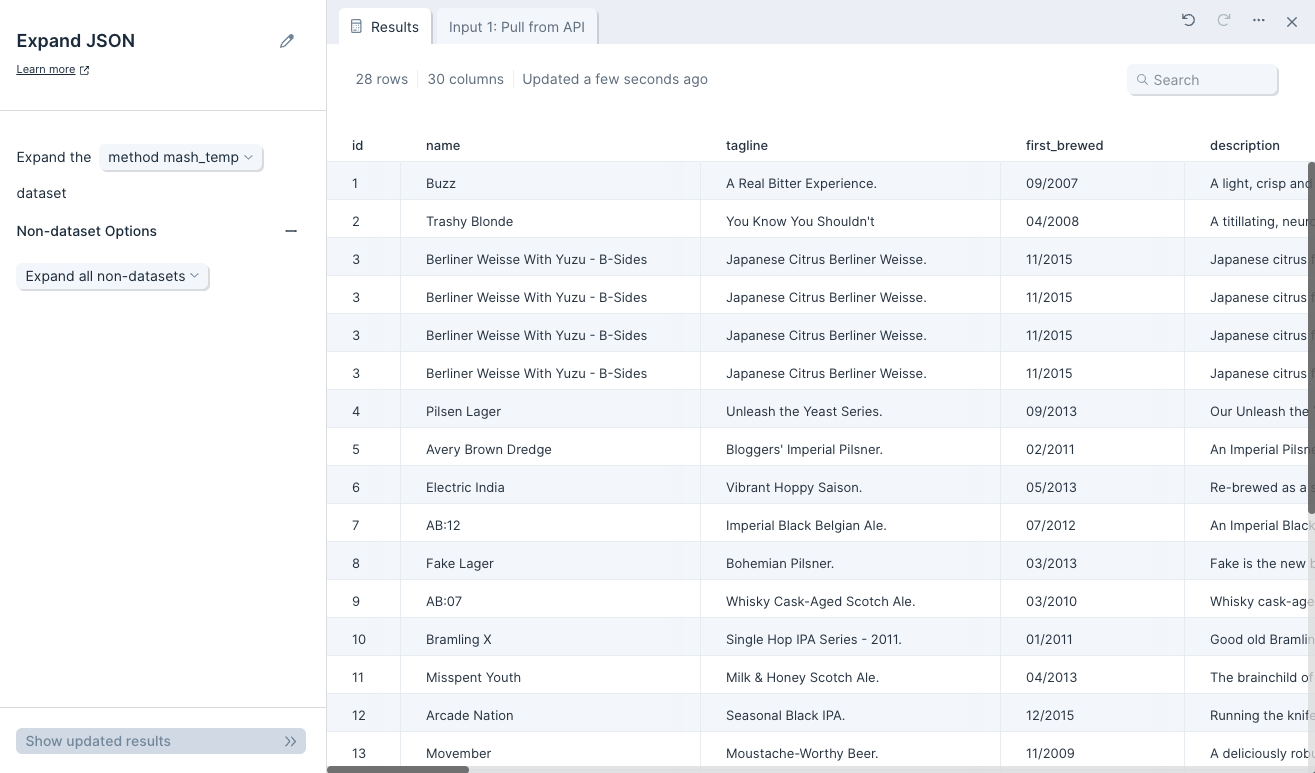
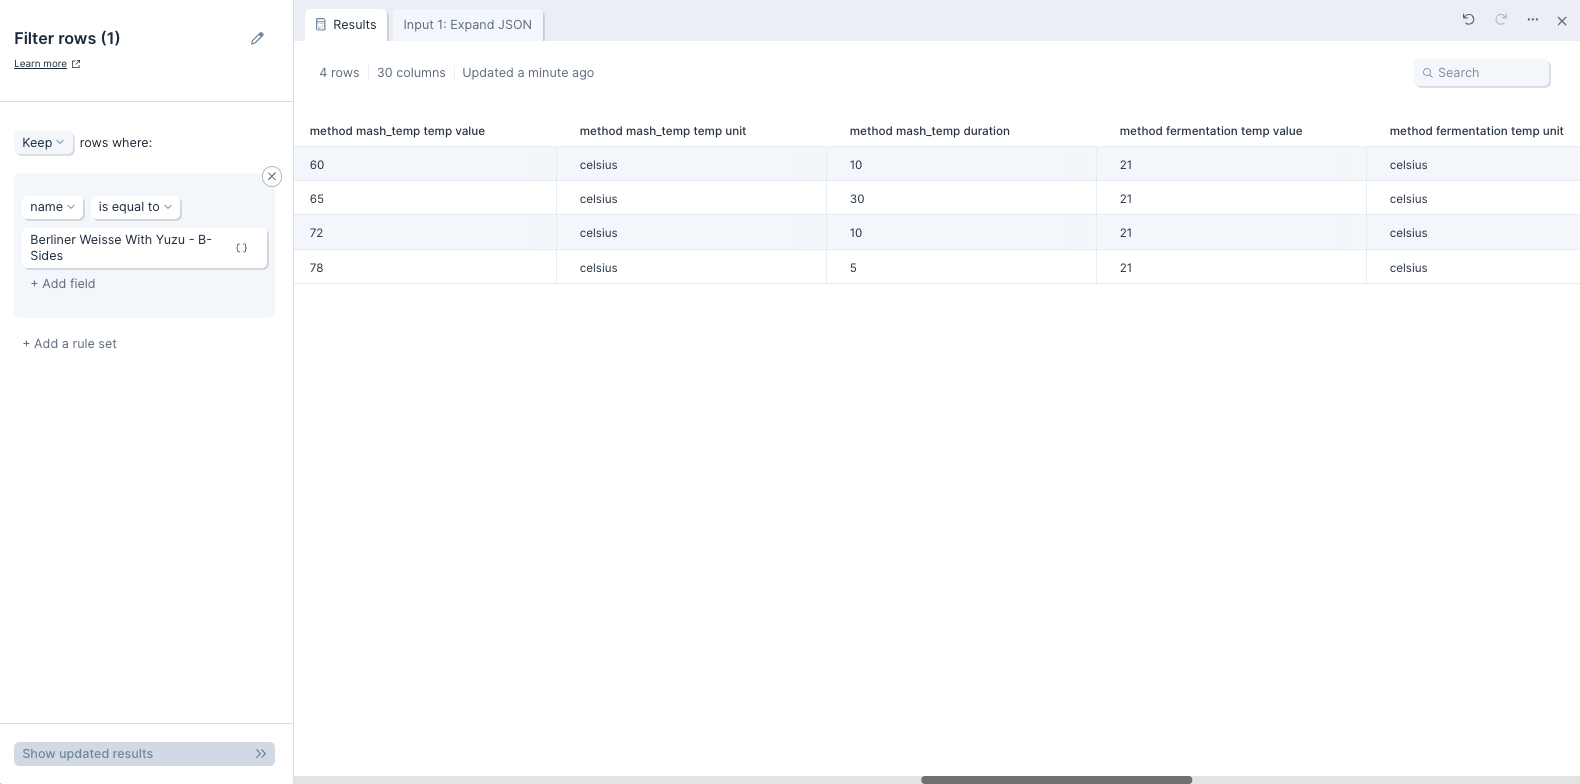
If we filter for beers with the name 'Berliner Weisse With Yuzu - B-Sides' and focus on the newly-expanded columns, we see that there's one row per element in the array 'method mash_temp temp value' for a total of 4 rows with 'Berliner Weisse With Yuzu - B-Sides'. If we look closely at the 6 additional columns that contain the newly-expanded data, we'll see the data nested within the JSON object above neatly arranged in a table format.
Default settings
By default, this step will try and convert as much JSON as it can, and in most cases we won't need to change settings. This step defaults to expanding the first JSON dataset it comes across.
By default, this step also sets to 'Expand all non-datasets'. That setting is nested under the 'Non-dataset Options' menu. This means that all the object keys will be expanded out to as many columns as it requires.
If you're familiar with JSON, you can think of this step's functionality like the following: datasets are JSON arrays that are expanded into new rows. Non-datasets are JSON objects that are expanded into new columns.
Custom settings
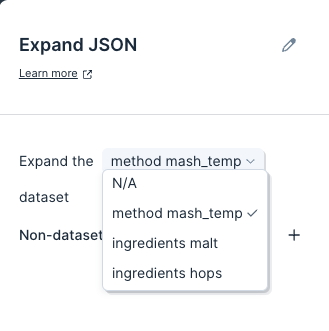
To customize the default settings, we'll first want to make sure the right dataset is selected to be expanded. We can only choose one dataset to expand or can select to expand no datasets. Datasets are expanded so that each entry is put into a new row. If our data has no dataset, then we'll see 'N/A' preselected in the first option for 'Expand the' menu.
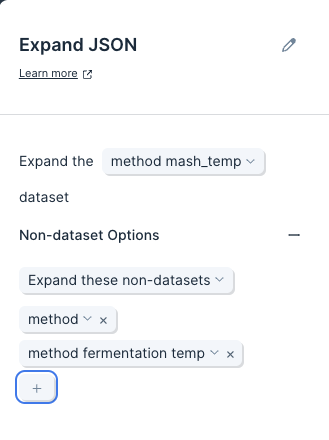
Next, if we don't need all non-datasets expanded into columns, we can open the 'Non-dataset Options' drawer and switch it from 'Expand all non-datasets' to 'Expand these non-datasets'.
If we select 'Expand these non-datasets', we'll see an option to specify exactly which non-datasets we should expand into new columns. We can select as many as we require. Whichever non-datasets we choose will be expanded into new columns, and if there are more non-datasets contained within, those will be expanded as well.
Helpful Tips
- If you have multiple rows of JSON and the data is not fully expanding as expecting, review the JSON body in the top row of your data. Parabola will look at the JSON in the first row and use that as a template for expanding JSON in subsequent rows. If there is an invalid or missing key in the top row, our expand step JSON step will omit that field in subsequent expanded rows. For additional information on troubleshooting this issue, please reference this community post.
Transform step:
Experiment with AI
This step is simply a text box that lets you ask the AI to revise, remove, or add to the input data however you like. It’s the most flexible of the AI steps … but that means it has the most variable results, too.
Examples of experimenting with AI using this step
- Take a list of product categories, and ask the step to assign emojis to each one
- Change the values in a column to title case… but only if the word looks like a name or a proper noun
- Analyze the sentiment — positive, negative, neutral — of a column with text
- Remove values from a column that meet a certain condition
How to use this step

This step is simply a text box, where you can make a request of the AI (also known as a “prompt”). Your results will depend in part on the specificity of your prompt. Here are some tips for making the most of this step.
- You can refer to existing columns by name. If it helps, you can even try putting them into quotes to isolate them.
- Prompts can be several sentences long. If you start out simply and don’t get the result you want, try explaining your ask in more detail!
- Sometimes using an example helps. If you’re trying to get the AI to rate the cuteness of animals, you can say: “The cutest animals are fuzzy, like squirrels, rabbits, and pandas. Young animals are also cute, like puppies, kittens, and bunnies”
- Check out OpenAI’s tips for writing a good prompt (aka “prompt engineering”)
Helpful tips
- Row limits for AI steps: AI steps can only reliably run a few thousand rows at once. Experiment with AI has an upper limit of 100k rows, though runs above ~70k rows often fail. If you need to process more than 100k rows, use Filter rows to split your dataset and run smaller batches in parallel.
- Sometimes you’ll see a response or error back instead of a result. Those responses are often generated by the AI, and can help you modify the prompt to get what you need.
Transform step:
Extract text
The Extract text step extracts a portion of text based on a matching character or offset. You may use this to pull out company names from emails, remove part of an ID, or extract the timezone from any date/time stamp.
Input/output
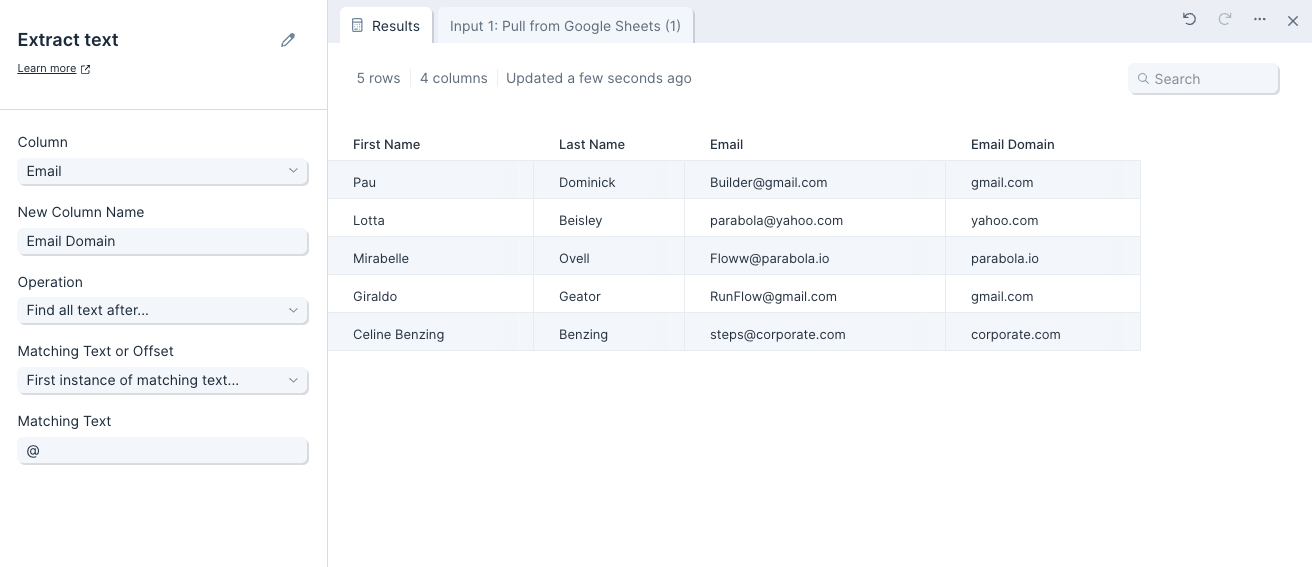
In this case, we're looking to extract email domains from our customer email addresses. Our input data has three columns: 'first_name', 'last_name', and 'email'.

After using the Extract text step, it gives us a new column named 'email domain' where extracted email domains are listed (taken from the 'email' column's values). This new column is filled with company names we may want to prioritize.
Custom settings
First, select the column that you'd like to extract text from.
Then, give your new column a name. This step will always create a new column with your extracted data.
Next, select an 'Operation'. The options are:
- Find all text after
- Find all text after the chosen matching text or offset
- Find all text before
- Find all text before the chosen matching text or offset
- Find some text after
- Find a set length of text after the chosen matching text or offset
- Find some text before
- Find a set length of text before the chosen matching text or offset
Finally, you'll select the 'Matching Text' or 'Offset'. The options are:
- First instance of matching text: You'll set the 'Matching' to look for and we'll delimit on the first instance.
- Last instance of matching text: You'll set the 'Matching Text' to look for and we'll delimit on the last instance.
- Offset from beginning of text: You'll set the 'Offset Length' and we'll count out that number of characters from the beginning of your text to determine the delimiter.
- Offset from end of text: You'll set the 'Offset Length' and we'll count out that number of characters from the end of your text to determine the delimiter.
With any chosen matching text or offset option, you'll also be able to set a 'Max Length of Text to Keep'.
Transform step:
Extract with AI
The Extract with AI step evaluates data sent to it, then uses the GPT AI to extract whatever pieces of information you need. By naming the new columns that you’d like to populate, you can tell this step which pieces of information you’d like to extract.

Examples of extracting data with AI
- Processing a list of invoices and extracting the invoice amount, due date, sender, and more
- Taking a list of email addresses and extracting the domain (e.g., gmail.com)
- Taking inbound emails and extracting the sender, company, and request type
As you can tell from some of these examples, the AI can do some lightweight interpretation (e.g., naming a company from an email domain URL) as well as simple data extraction.
How to use this step
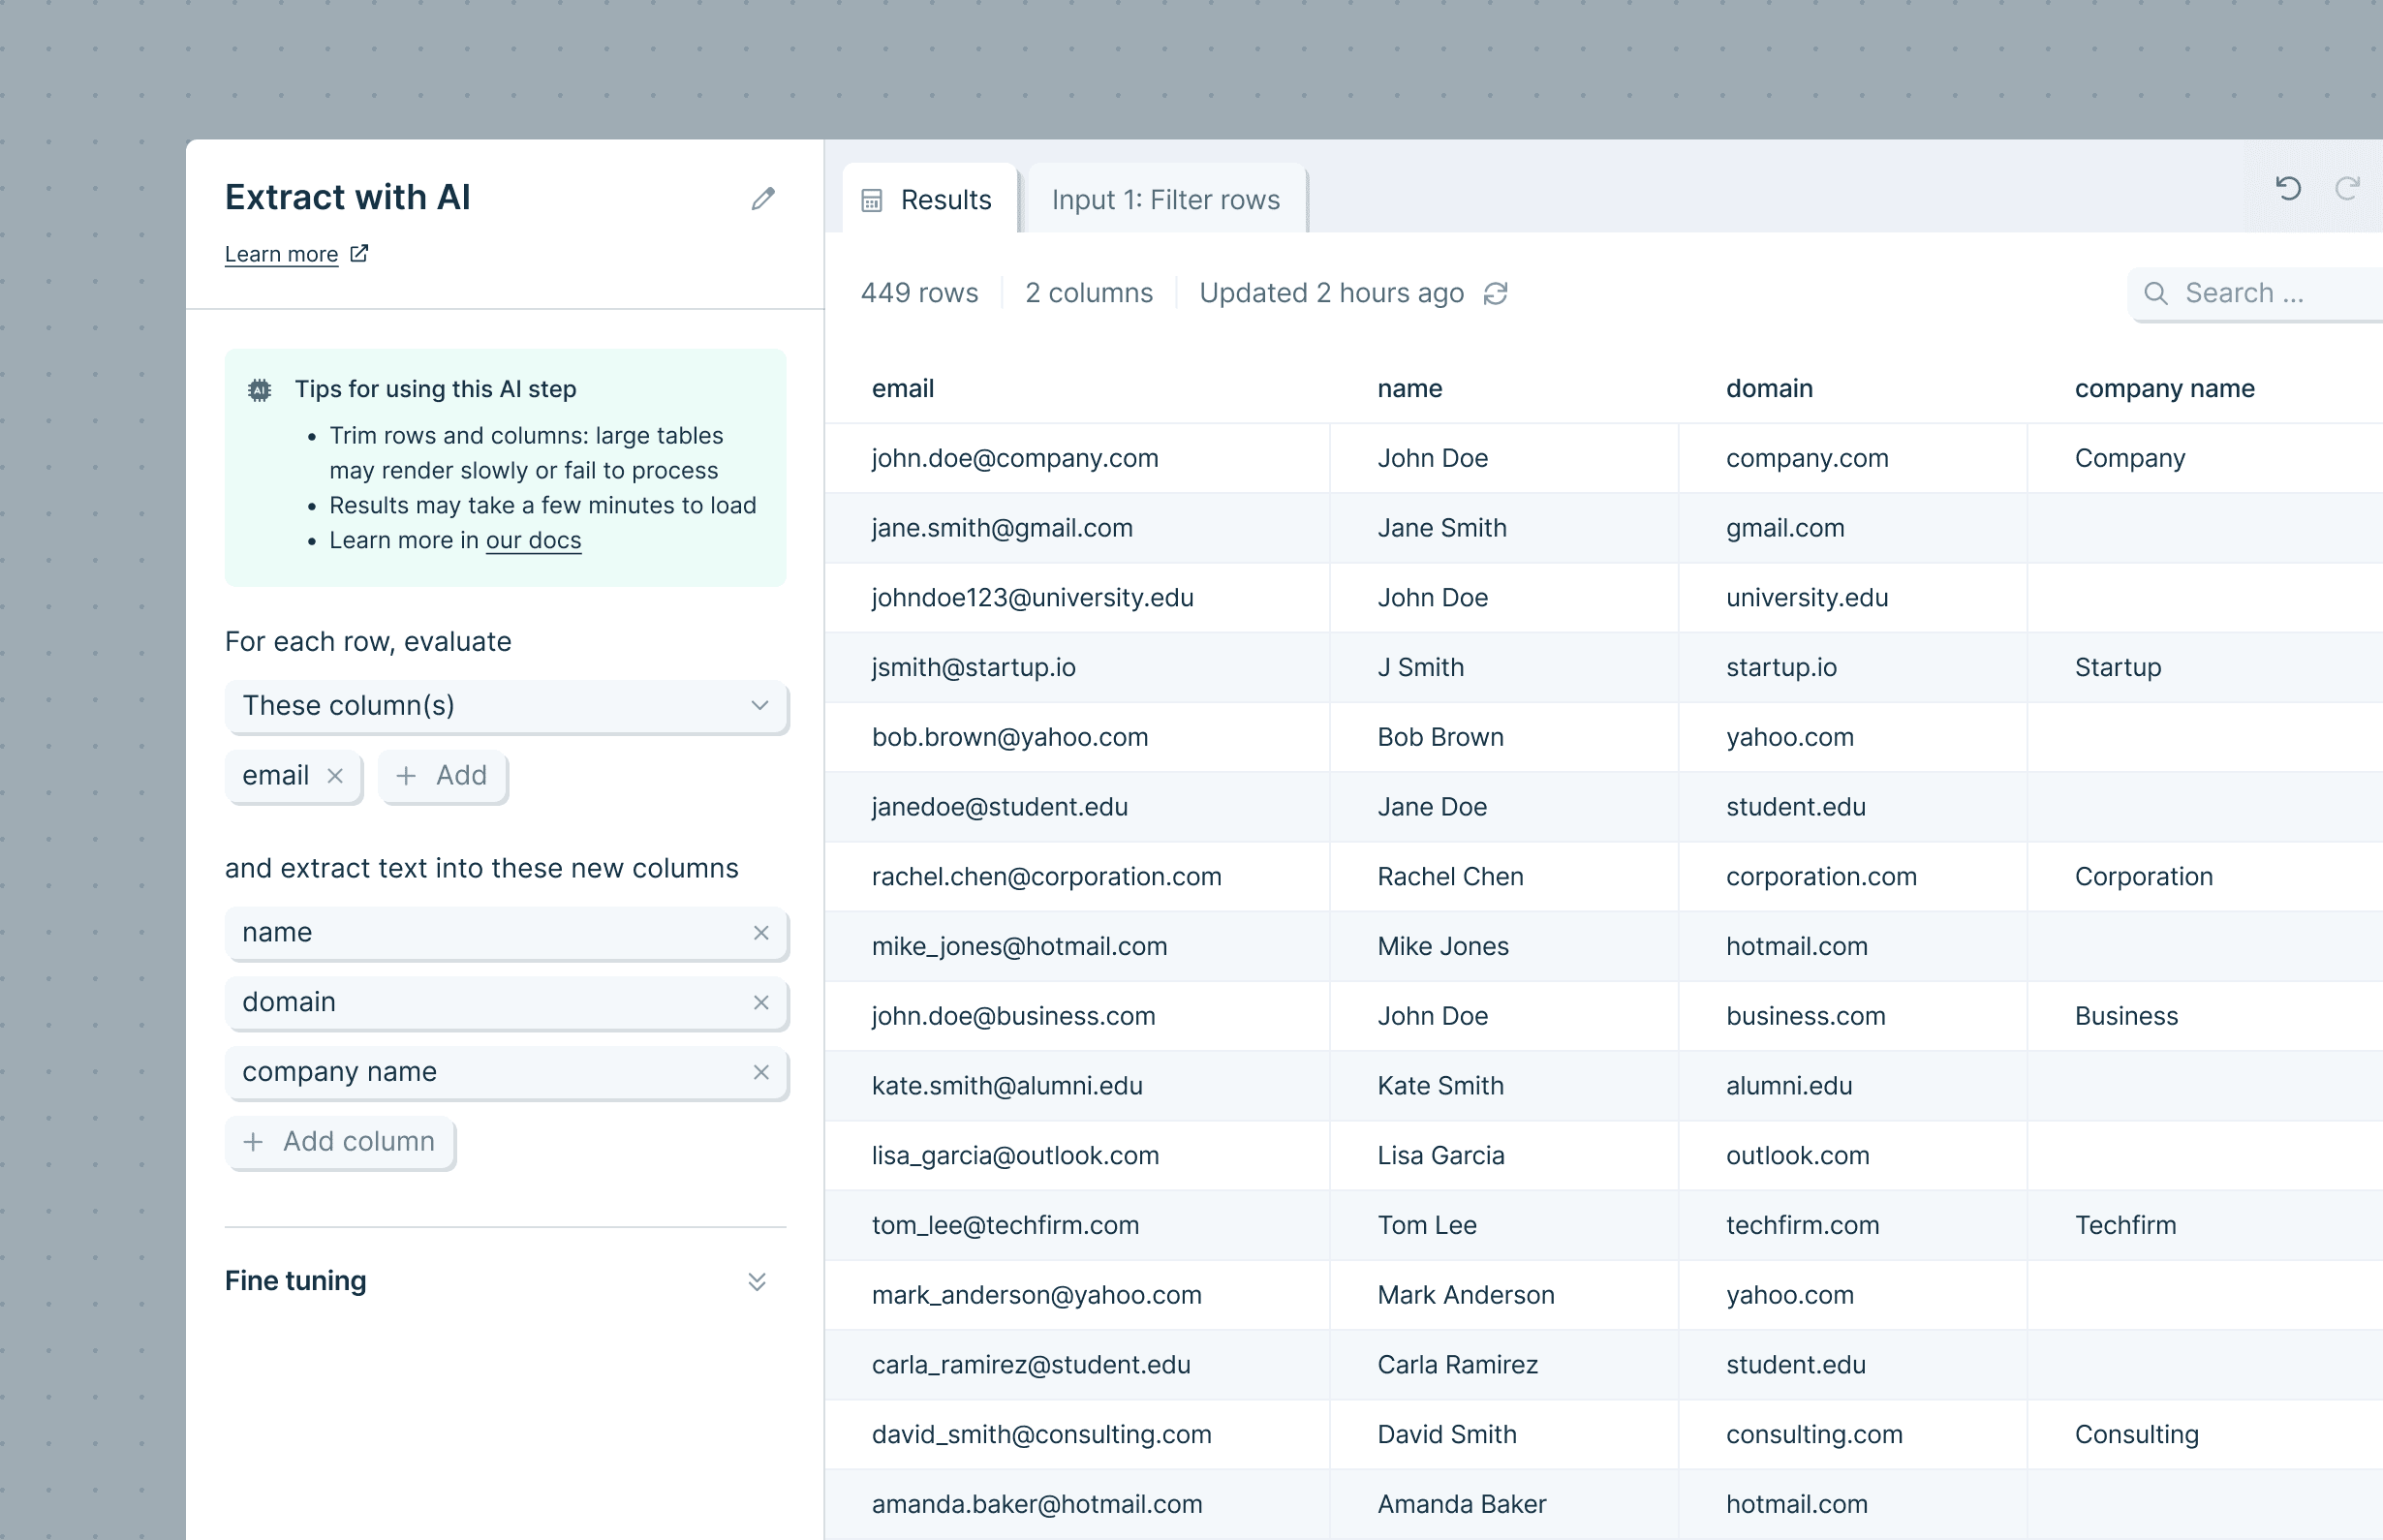
Selecting what to evaluate
You start by selecting which columns you want the AI to evaluate to produce a result.
- All columns: the AI looks at every data column to find and extract the item it’s looking for
- These columns: choose which column(s) the AI should try to extract data from
- All columns except: the AI looks at all columns except the ones you define
Note that even when the AI is looking at multiple (or all) columns, it’s still only evaluating and generating a result per row.
Identifying what to extract
The next part of this step serves two purposes simultaneously:
- Telling the AI what items you’d like to extract from the input data (e.g., 'full name')
- Naming the new column(s) that the extracted data will go into (e.g., a column named 'full name')
The step starts out with three blank fields; you can fill those and even add additional columns to extract data to. Don’t need three? The step will automatically remove any blank ones, or you can remove them yourself.
(You can always rename or trim these columns later using other Parabola steps.)
Fine tuning
Open the 'Fine tuning' drawer to see extra configuration options. Using this field, you can provide additional context or explanation to help the AI deliver the result you want.

For example, if the AI was having trouble pulling 'Invoice number' from imported invoice data, you might explain to it:
“Our invoice numbers tend to begin in 96 and are 12-15 digits long.”
The AI would then better understand what you want to extract.
Helpful tips
- Row limits for AI steps: AI steps can only reliably run a few thousand rows at once. Extract with AI has an upper limit of 100k rows, though runs above ~70k rows often fail. If you need to process more than 100k rows, use Filter rows to split your dataset and run smaller batches in parallel.
- Sometimes you’ll see a response or error back instead of a result. Those responses are often generated by the AI, and can help you modify the prompt to get what you need.
- Still having trouble getting the response you expect? Often, adding more context in the 'Fine tuning' section fixes the problem.
Transform step:
Fill addresses with Google Maps
The Fill addresses step creates a column with Google Maps address information and standardizes the format of your addresses, completes partial addresses, finds zip codes, or finds addresses for landmarks to businesses.
Input/output
Data connected to this step works best when it is in the shape of a column filled with place names. Think of your data as Google Maps search strings. In our example below, we have a table with a single column called 'Landmarks,' containing names of a few global destinations.

The resulting output, after using this Fill addresses step, is a new column autofilled with location information from Google Maps.
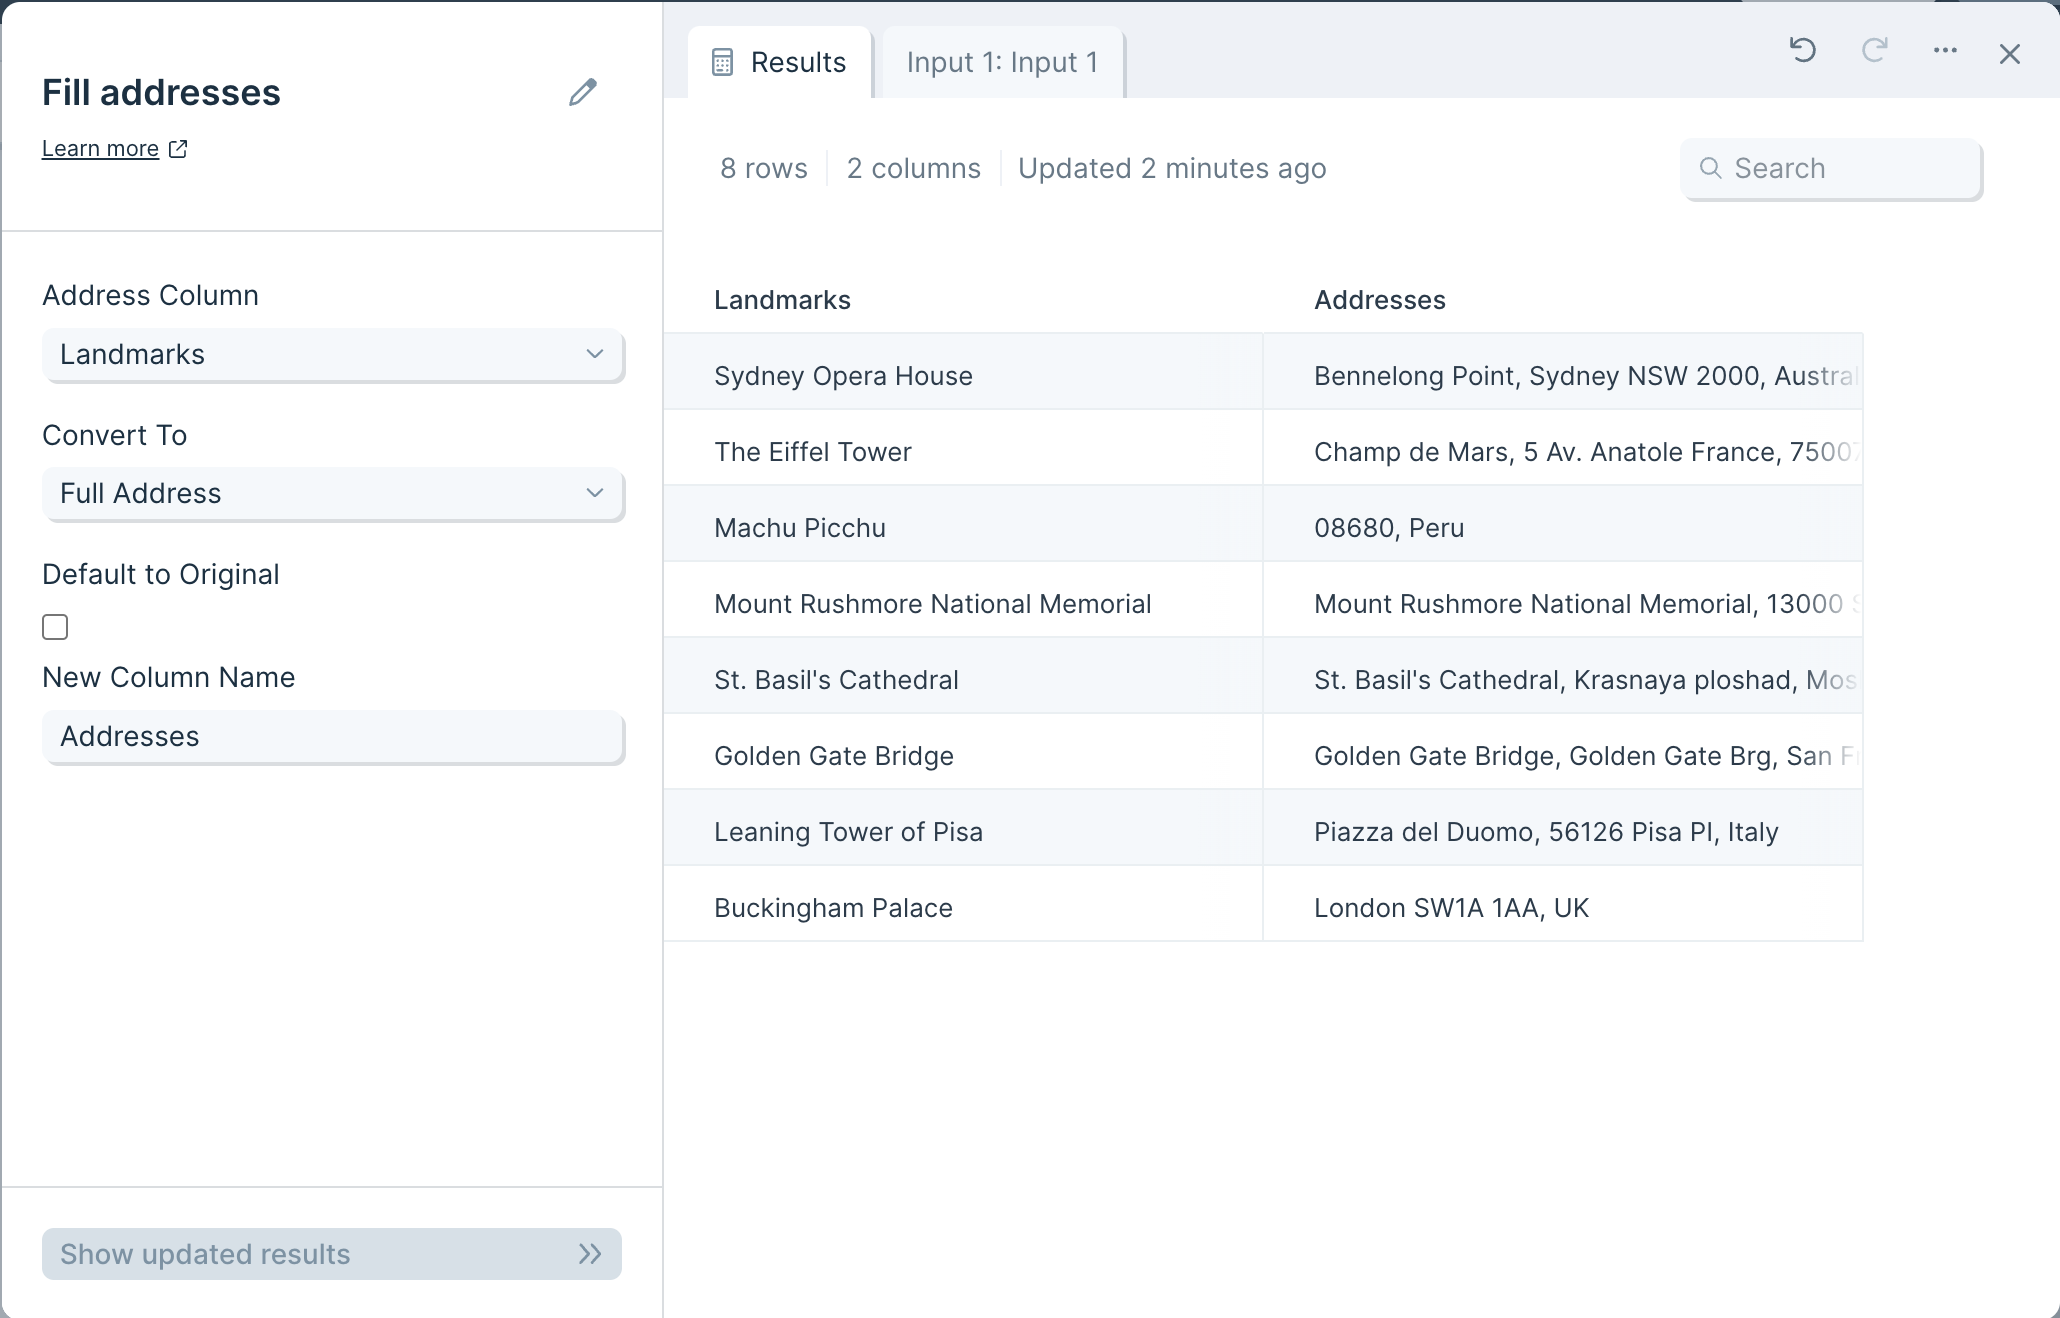
Custom settings
In the 'Address Column' dropdown, select the column that has the location data you'd like Google Maps to search.
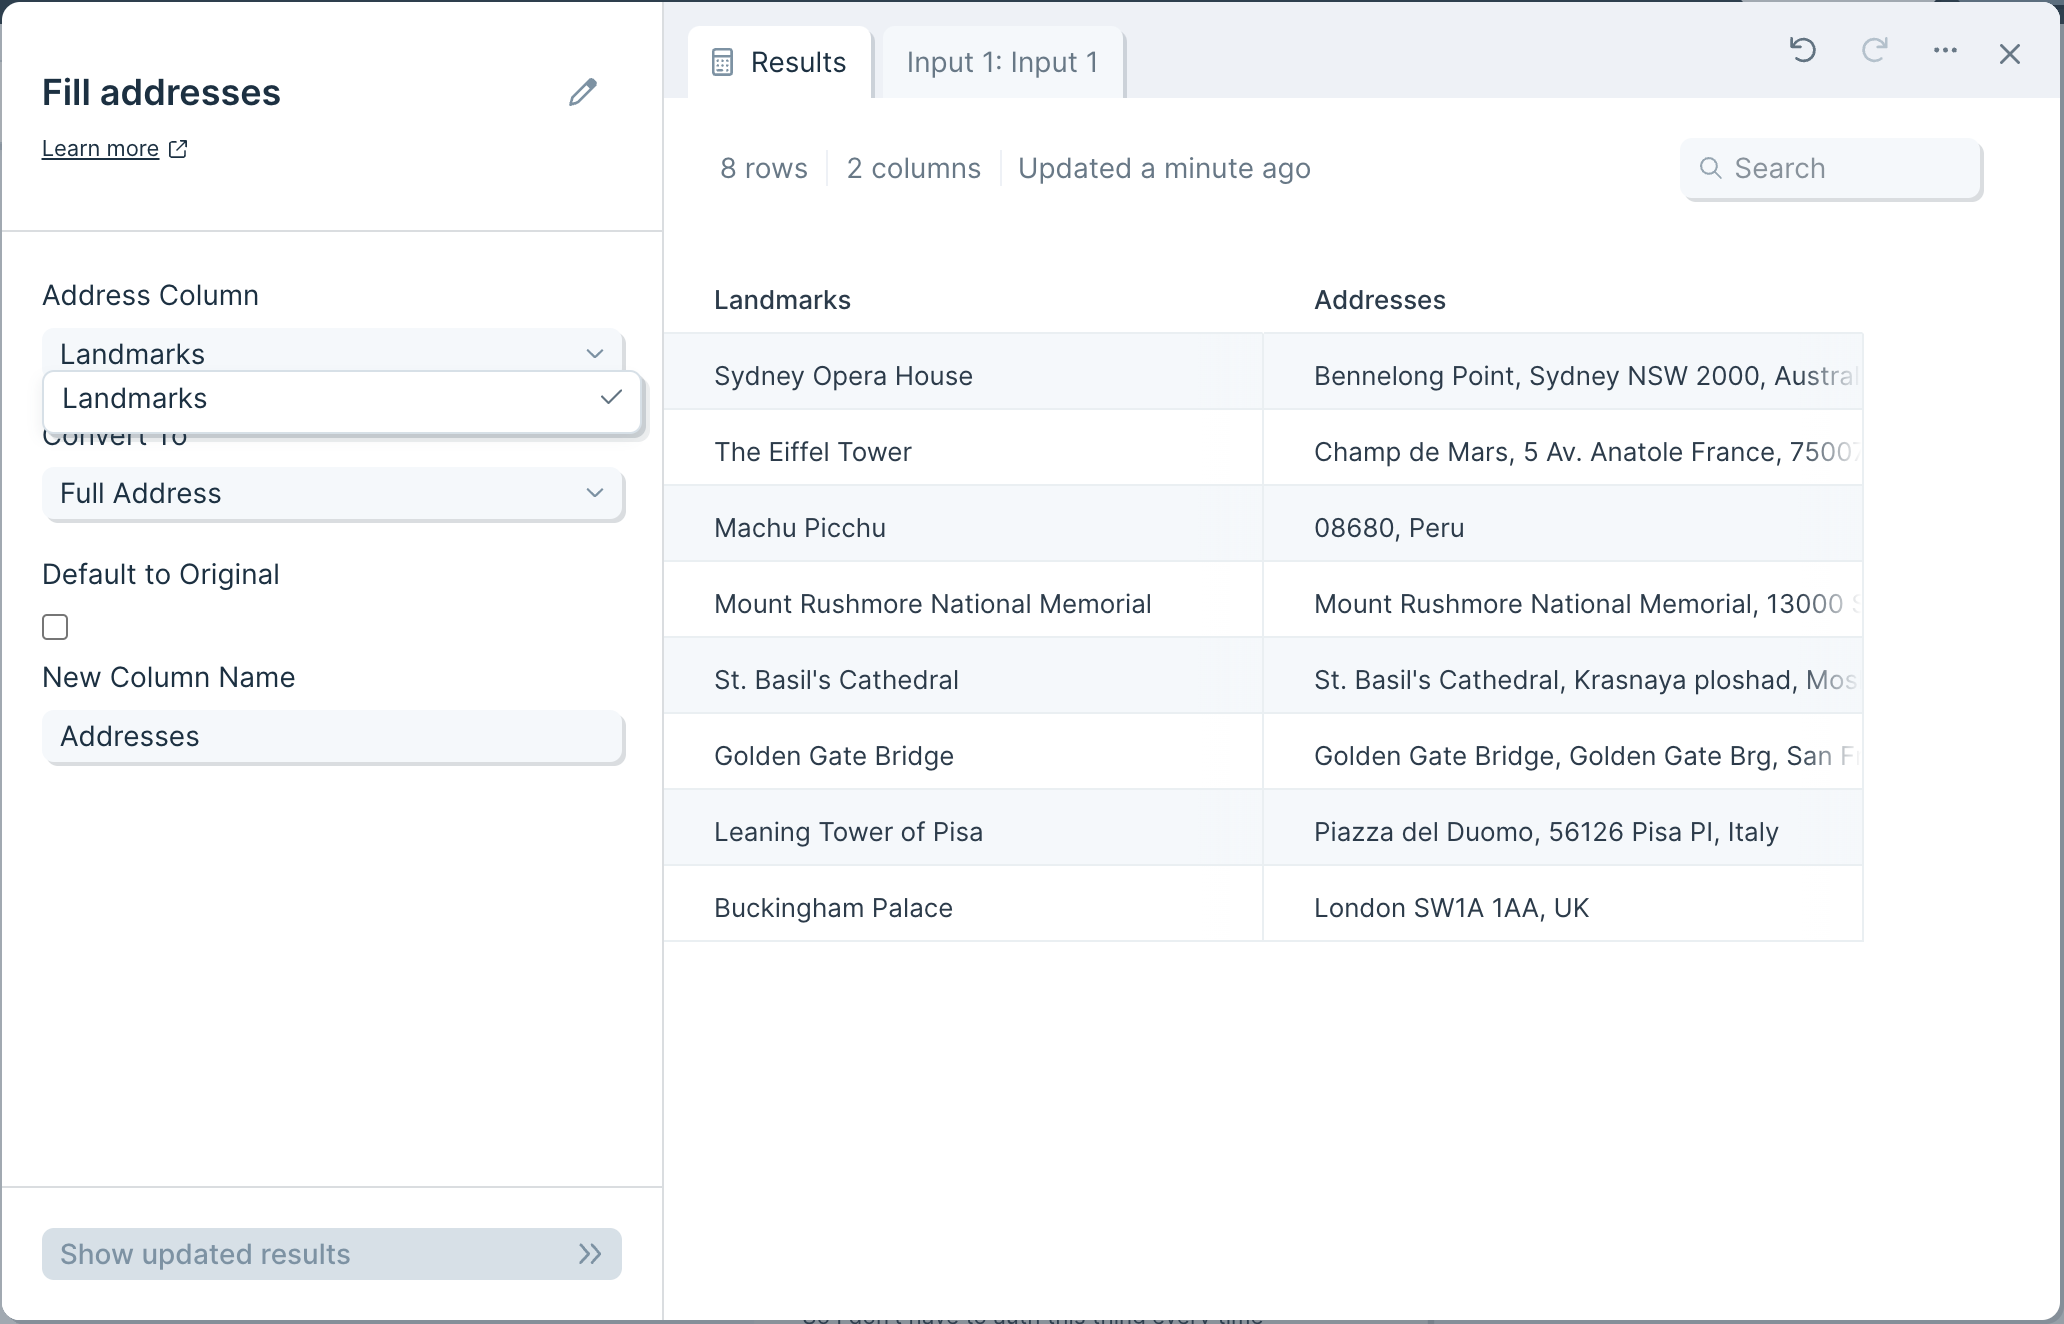
Next, in the 'Convert To' dropdown, select how you'd like Google Maps to return the data. You can choose between the full address (if applicable) or simply the zip code.
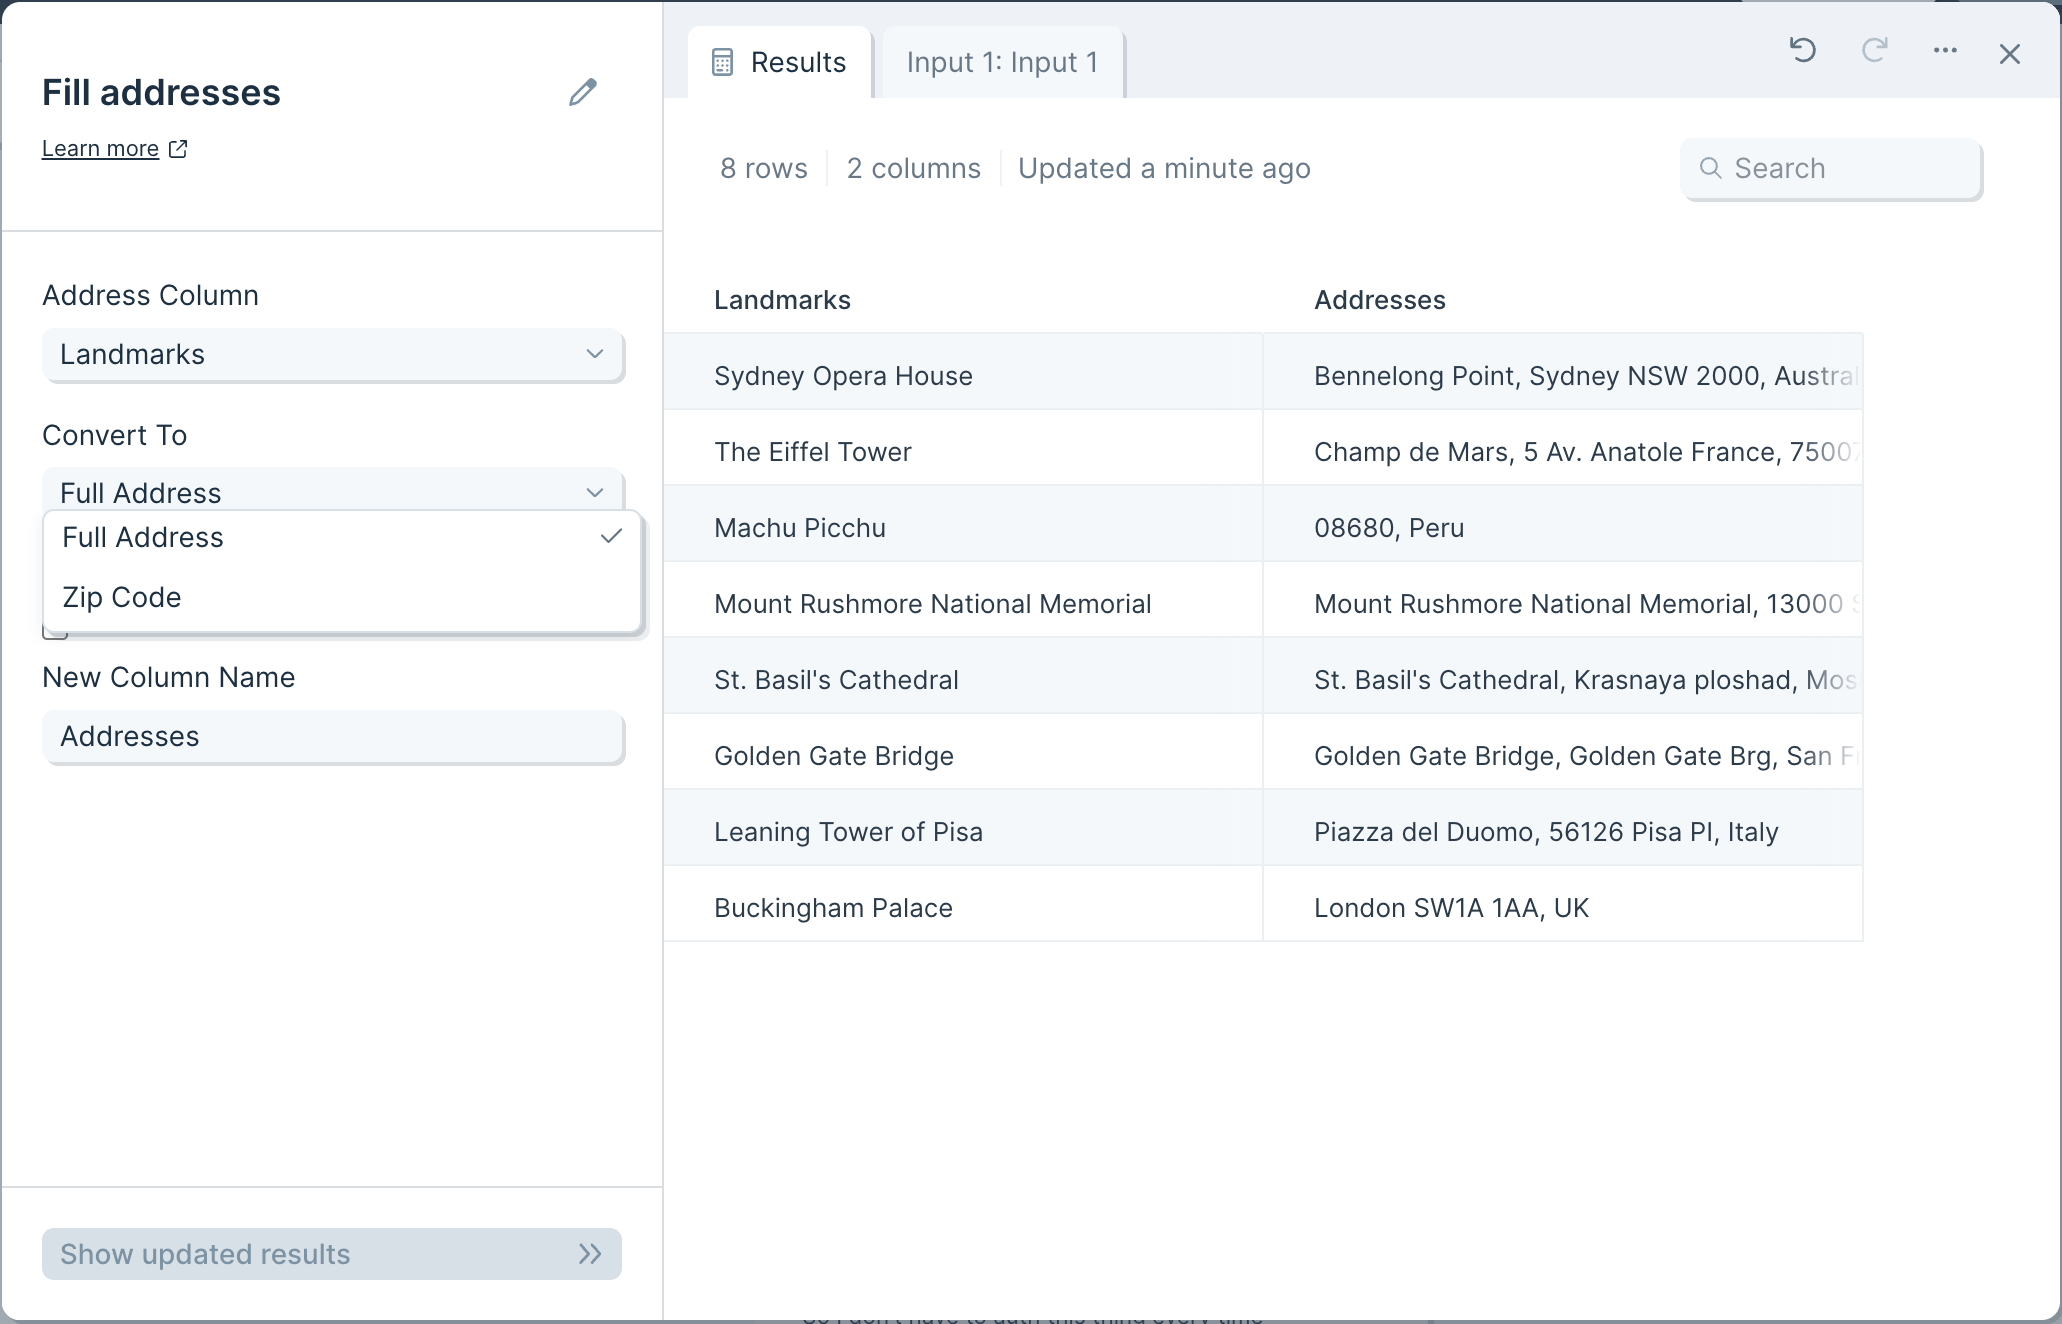
If you check the 'Default to Original' box and there are no address details found in Google Maps, your new column will return the data from your selected 'Address Column'. If you'd rather leave the result blank where no address is found, then you may keep the box unchecked.
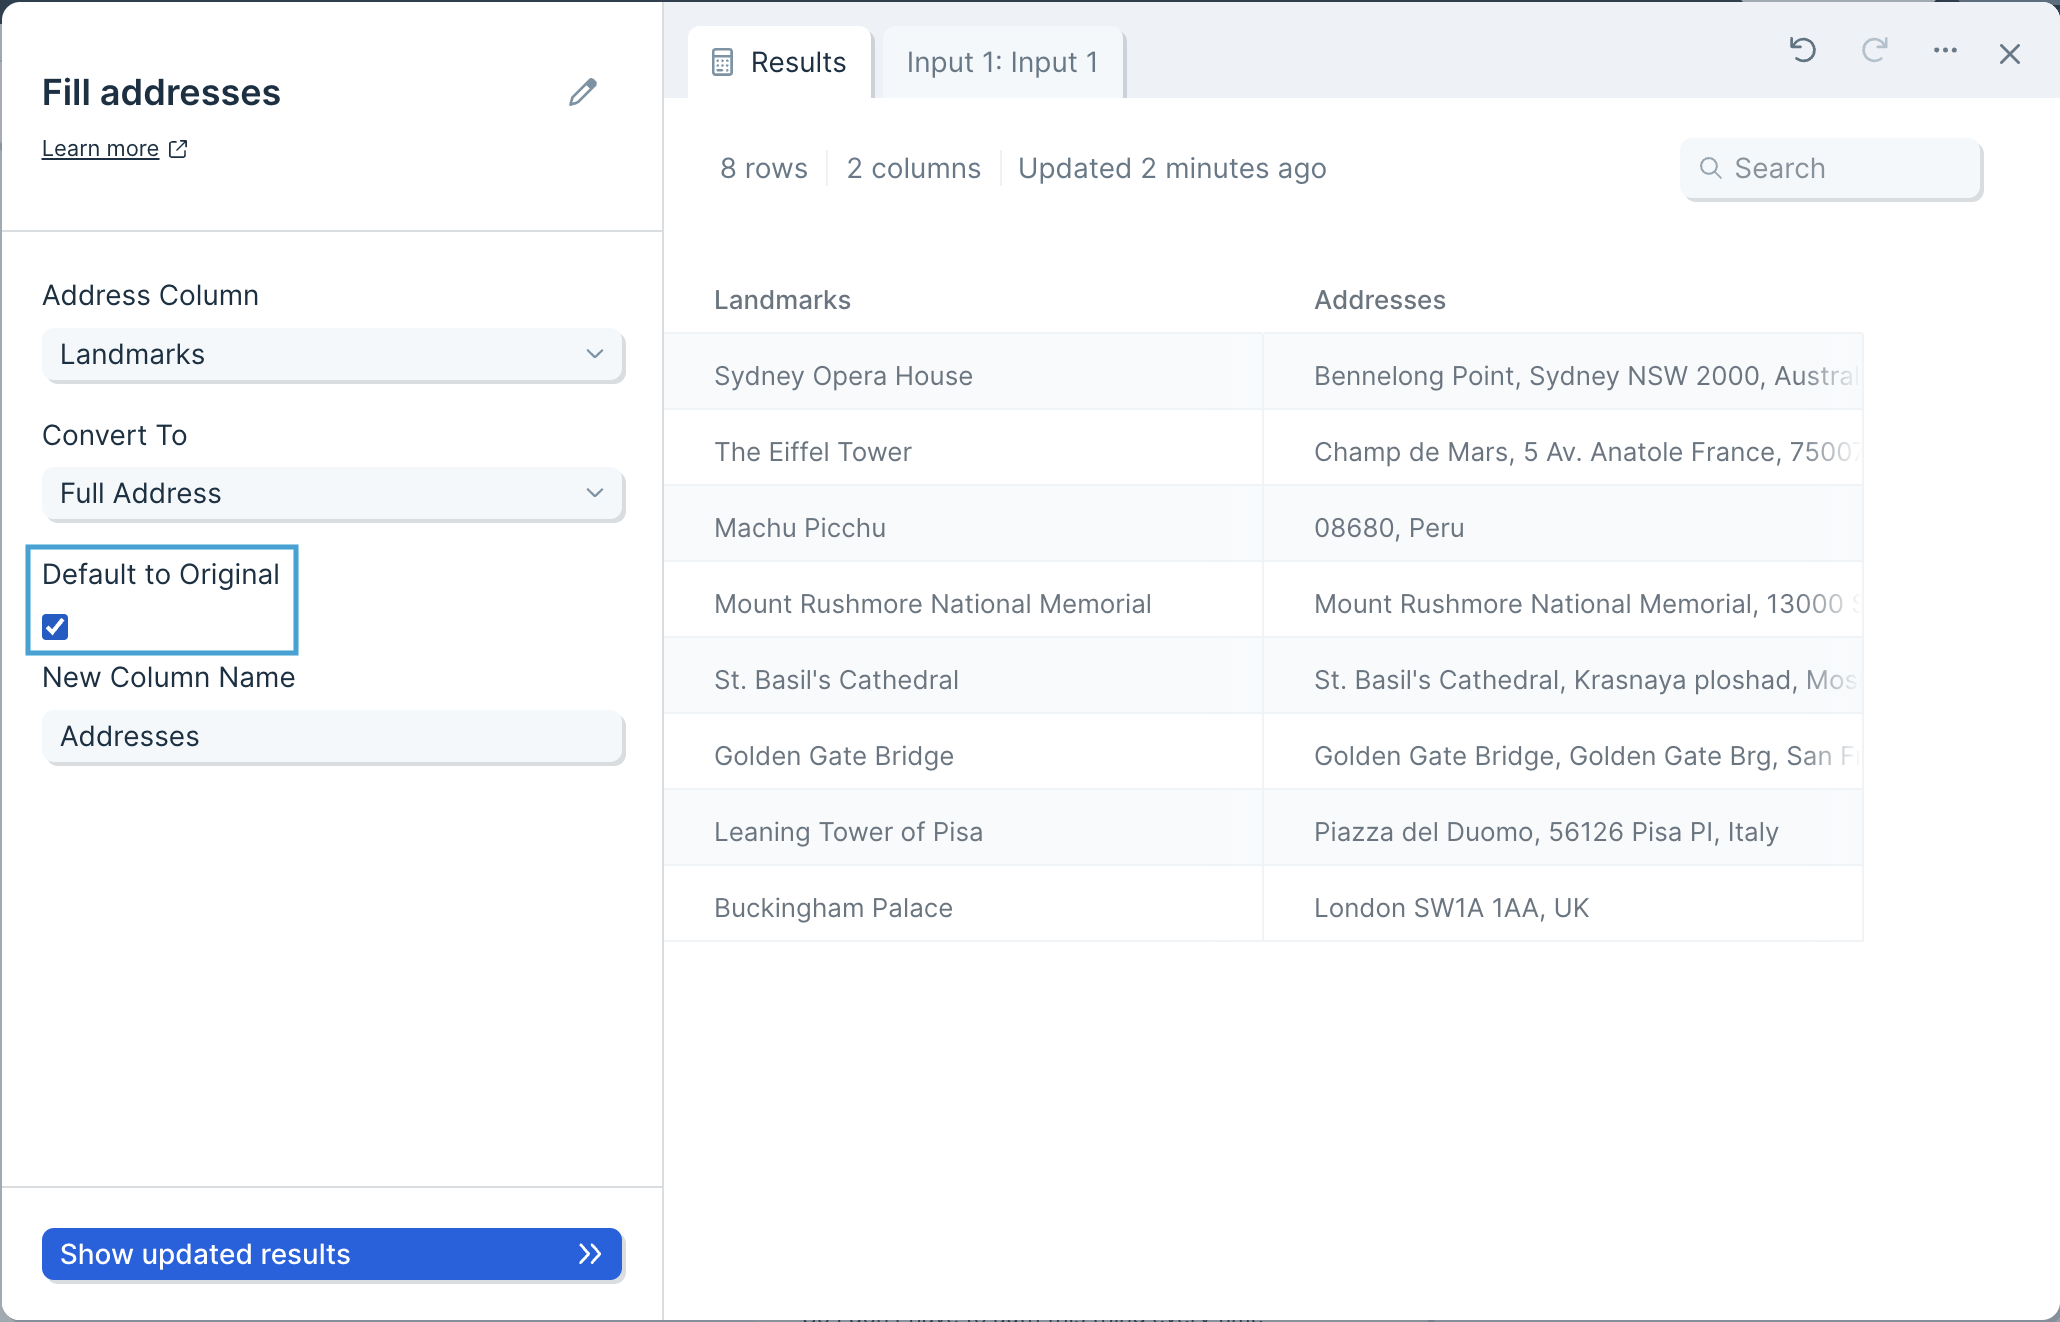
Lastly, give your new column a name in the 'New Column Name' field.
Helpful tips
- This step is only available on our Advanced plan.
- This step will only run a maximum of 1,000 rows per step.
Transform step:
Fill in blanks
The Fill in blanks step fills empty cells based on the values of other cells or columns in the dataset, or a specified text string.
Input/output
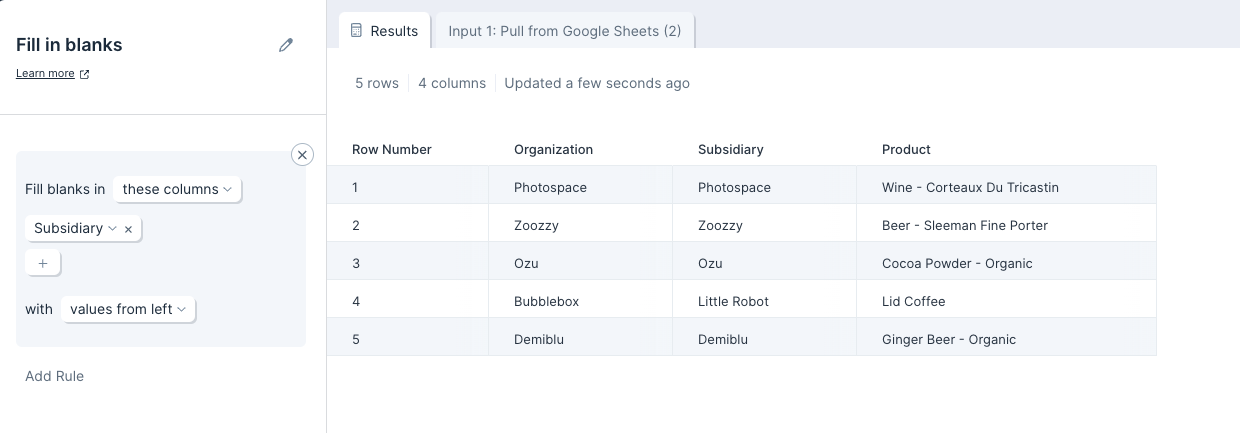
We'll use the below input table for this step to process. It contains four columns including one labeled 'Subsidiary' that contains several blank cells.

After using the Fill in blanks step, our output table now has values in the previously-empty 'Subsidiary' column. The Fill in Blanks step has populated each blank cell in the column with the value to its left.
Custom settings
Once you connect data to the Fill in blanks step, you will first need to select which column we should fill in blanks for.
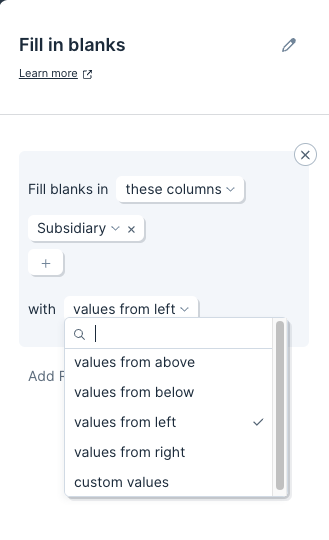
By default, this step will fill in blanks with values from above. To change this, click on 'values from above' and select another option from the available dropdown:
- values from above
- values from below
- values from left
- values from right
- custom values
You can create multiple rules that will be applied from the top down. To do so, simply click on the gray 'Add Rule' link.
Transform step:
Filter rows
The Filter rows step keeps rows that satisfy a set of rules. You can use this step to create simple filters with one rule, or complex filters with many rules.
Check out this Parabola University video to see the Filter rows step at work.
Input/output
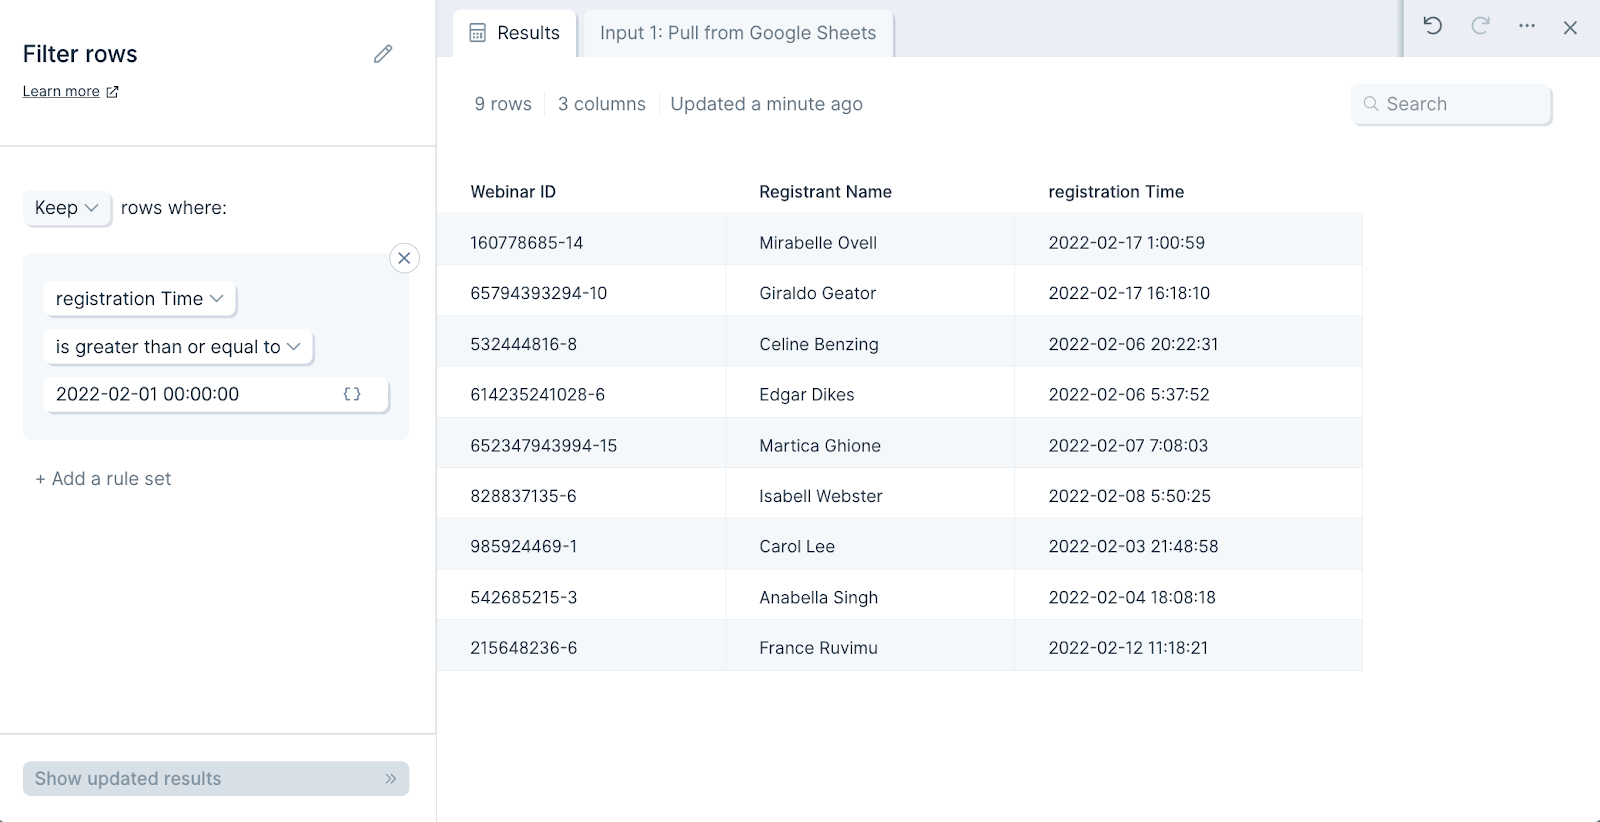
The input data we'll connect to this step has 15 rows of webinar registrants.
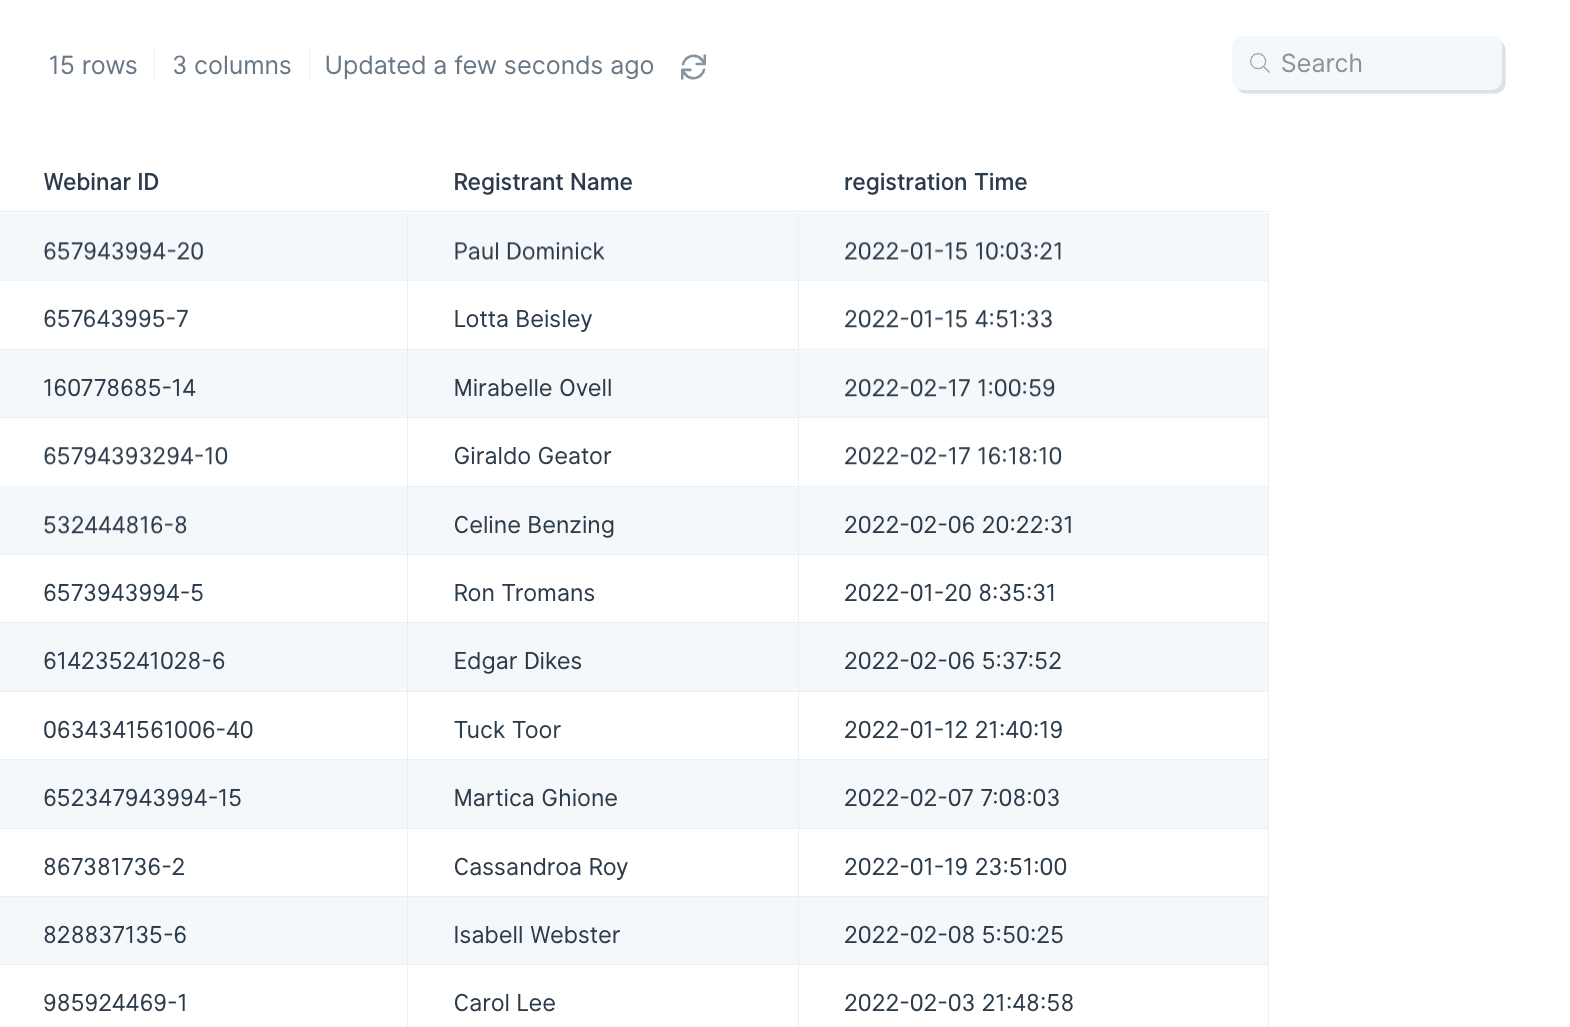
Let's say we want to filter this for people who registered after February 1, 2022. By setting a rule to include rows where the value in 'Registration Time' column is greater than or equal to '2022-02-01 00:00:00', we immediately get nine rows of data showing who registered after February 1, 2022.
Custom settings
By default, this step will keep rows only if they follow any of the rules. This means that if a row satisfies one of the rules, that row will be kept. You can change this to keep rows only if they match all of the rules by clicking '+ Add a rule set' and changing 'OR' to 'AND' between them.
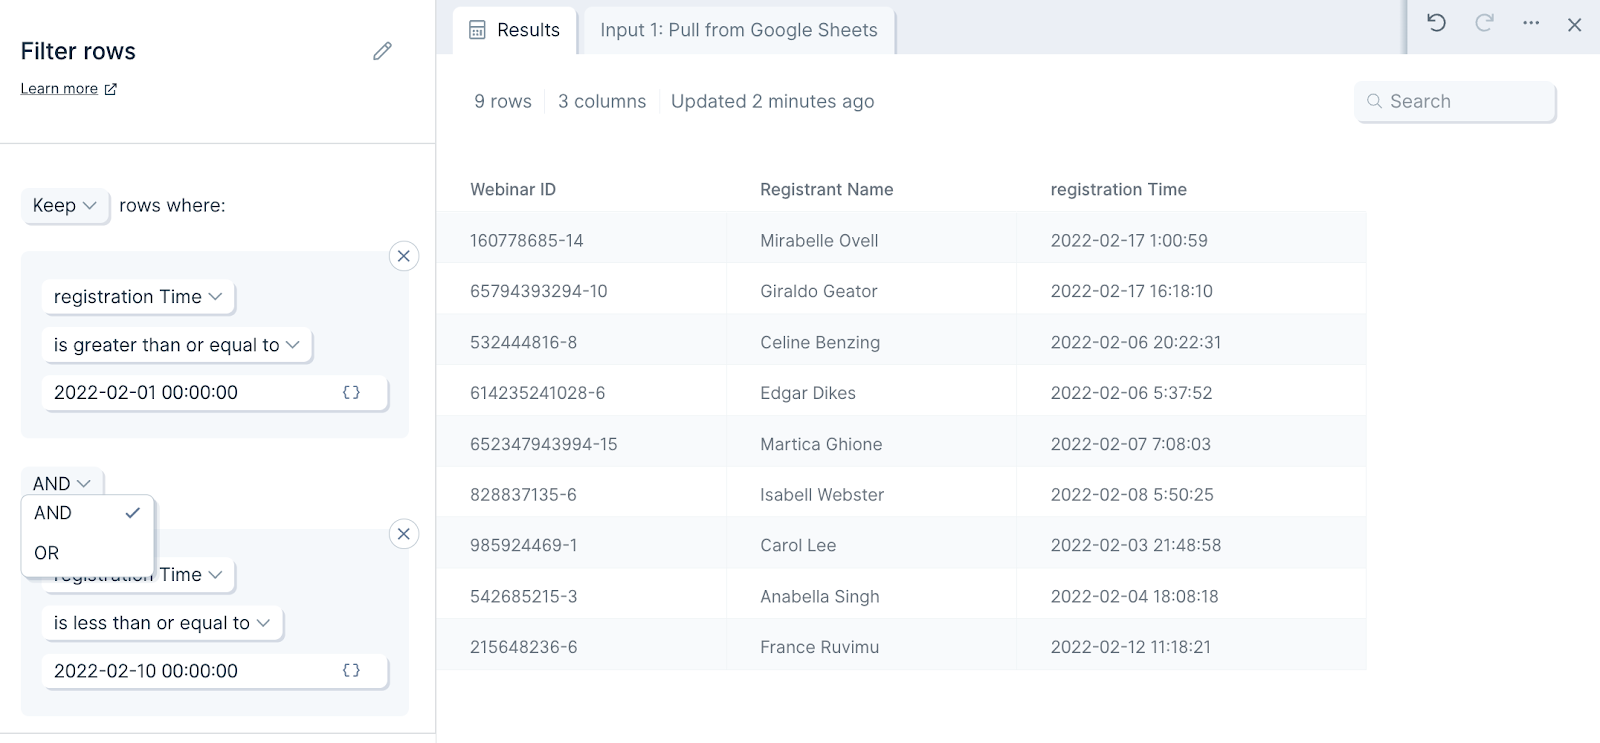
Now it's time to set up filters for rows. For each rule, you'll select a column, a filtering condition, and a matching value.
Available filtering settings for different data types
Dates
- Filter dates to (filter dates relative to now or a set date)
- Dropdown options for “filter dates to” include:
- In the last 7 days
- Yesterday
- In this month to date
- In the previous…
- In the current…
- After…
- Between…
- Tip: While our “filter dates to” condition within the Filter Rows step can handle many use cases, you may find yourself wanting to do something more similar to the DATEDIF function in Excel (ie if you want to calculate "Time In Transit" or filter for PO’s with an ETA in your current week). In this case, you may want to use our Compare Dates step instead.
- Dropdown options for “filter dates to” include:
Text Data
- is blank
- is not blank
- is unique (is the value in each row unique within that column)
- is not unique (is the value in each row not unique within that column)
- is equal to
- Text is equal to (equals but assumes text - faster than “is equal to”)
- Text is not equal to (equals but assumes text - faster than “is not equal to”)
- Text contains
- Text does not contain
- Text starts with (matches the first part of a cell)
- Text ends with (matches the last part of a cell)
- Text length is (length of cell = #)
- Text length is greater than (length of cell > #)
- Text length is less than (length of cell < #)
- Text matches pattern (regex match)
- Text does not match pattern (inverted regex match)
Numerical Data
- is equal to
- is not equal to
- is greater than
- is greater than or equal to
- is less than
- is less than or equal to
- is between (between two numbers)
- is not between (not between two numbers)
To add another rule, click on the gray '+ Add a rule set' button to configure another rule.
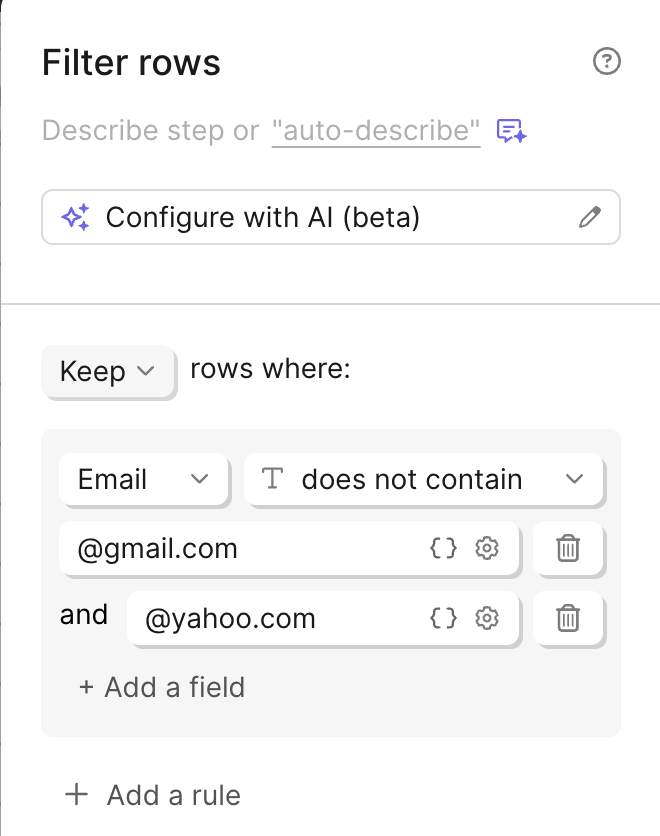
The 'Text contains', 'Text does not contain', 'Text is equal to', and 'Text is not equal to' filter operations allows multiple criteria fields
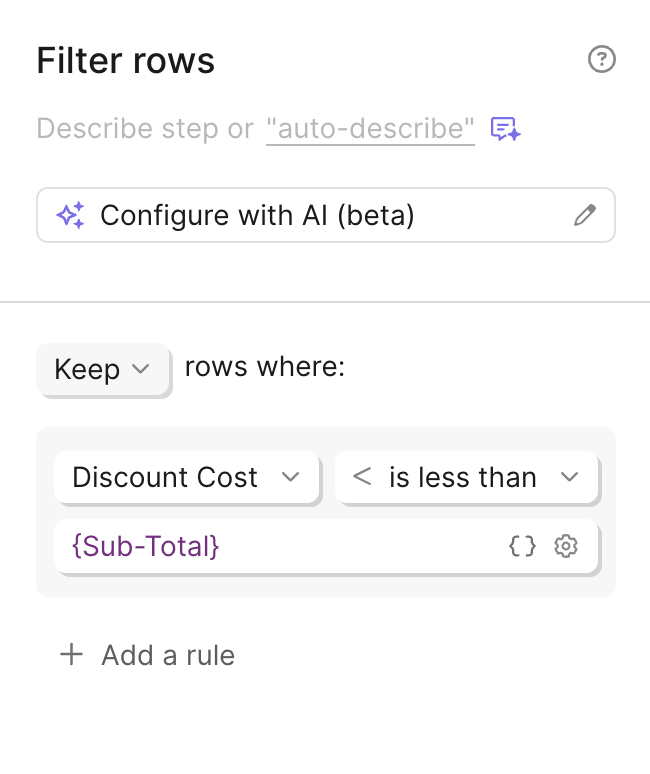
You can compare columns inside of your Filter rows steps by entering the column name wrapped in curly braces (e.g.: '{Sub-Total}').
Helpful tips
- Keeping rows between two values: If you need to only keep rows in a column whose values are between two values, then you'd use two separate rules. Let's say I want to keep values in a column that are between 5 and 10 inclusive. I would set one rule to keep all rows that are greater than or equal to 5. I would then set a second rule to keep all rows less than or equal to 10, and select the 'AND' option.
- Filtering dates: The Filter rows step can generally handle filtering for dates that match a certain criteria without any additional date formatting required. However, if you're experiencing any issues with filtering dates, we recommend trying to convert your dates into a Unix format or Lexicographical format. To update your date formats, use a Format dates step before sending your data to the Filter rows step. For Unix format, use capital X for precision to the second and lowercase x for precision to the millisecond. For lexicographical format, use YYYY-MM-DD HH:mm:ss.
- Accounting for text casing: Please note that rules are not case sensitive.
- Reversing the filtering logic: If you set up a filter with multiple rules and wish to instead see the rows that are being removed by the filter, you can reverse your filtering by changing 'Keep rows' to 'Remove rows'.
- Filtering symmetrically: If you need to split your table to create separate branches that will eventually be merged back together to recreate the complete data set, you will use a few Filter rows steps while making sure you're not duplicating or losing any rows in that process. For example, let's say you have data that spans three months (October, November, and December) and you need to process each month differently. You want one Filter rows step per month. A good way to make sure you successfully filtered symmetrically is to use a Stack tables step at the end of your separate branches to merge the data back together. The resulting row count should match the row count of your starting data before the Filter rows steps.
- Text field level options are accessible via the settings cog icon on the right side of any text field: each text field can be toggled to evaluate what has typed in as a math expression, instead of just text. You can type numbers or reference them from columns using {merge tags} so each text field can be toggled to match based on the casing provided, or ignore the casing of the text.
Transform step:
Find and replace
The Find and replace step works like you might imagine the name means: you can type in a value, specify the columns to look for it in, and type in a new value to replace it with if it is found.
Input/output
Our input data below has orders information telling us how many units were sold today per product variant type.
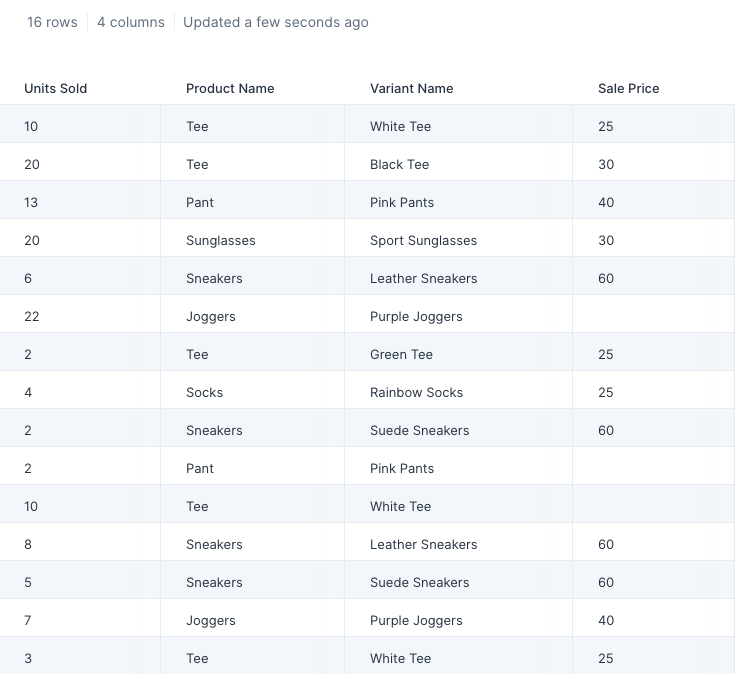
Let's say we need to replace the blank values in the "Units sold" column with a "0". As seen below, once we connect this input data into the step, it produces that output where any blank cells in the column "Units sold" now has a "0".

Custom settings
To set up your Find and Replace rule, you'll need to:
- Type in a value to look for. This input can be left blank if you'd like this step to look for blank or empty row cells.
- Select the column(s) where we should look. By default, this step will search for the value in "all columns".
- Type in a value to replace the value with if it's located. This input can be left blank if you'd like this step to replace the located values with blanks (i.e. replacing it with empty row cells).
You can create as many rules as you need by clicking on the 'Add Rule' button on the left-side step settings bar. The rules are applied in the order they appear from top to bottom. The first rule will be applied to every row and the necessary replacements will be made. Once that's completed, the next rule will be applied.
Helpful tips
- The Find and replace step ignores text casing. It will find matching values even if the text casing, such as capitalized letters, aren't an identical match.
Transform step:
Find maximum by group
The Find max by group step calculates the maximum value in a column or a group of columns. This step is similar to the MAX function in Excel.
Input/Output
Our input data has 11 rows of order information showing us how many items were sold, the food type, the customer name, and their payment type.
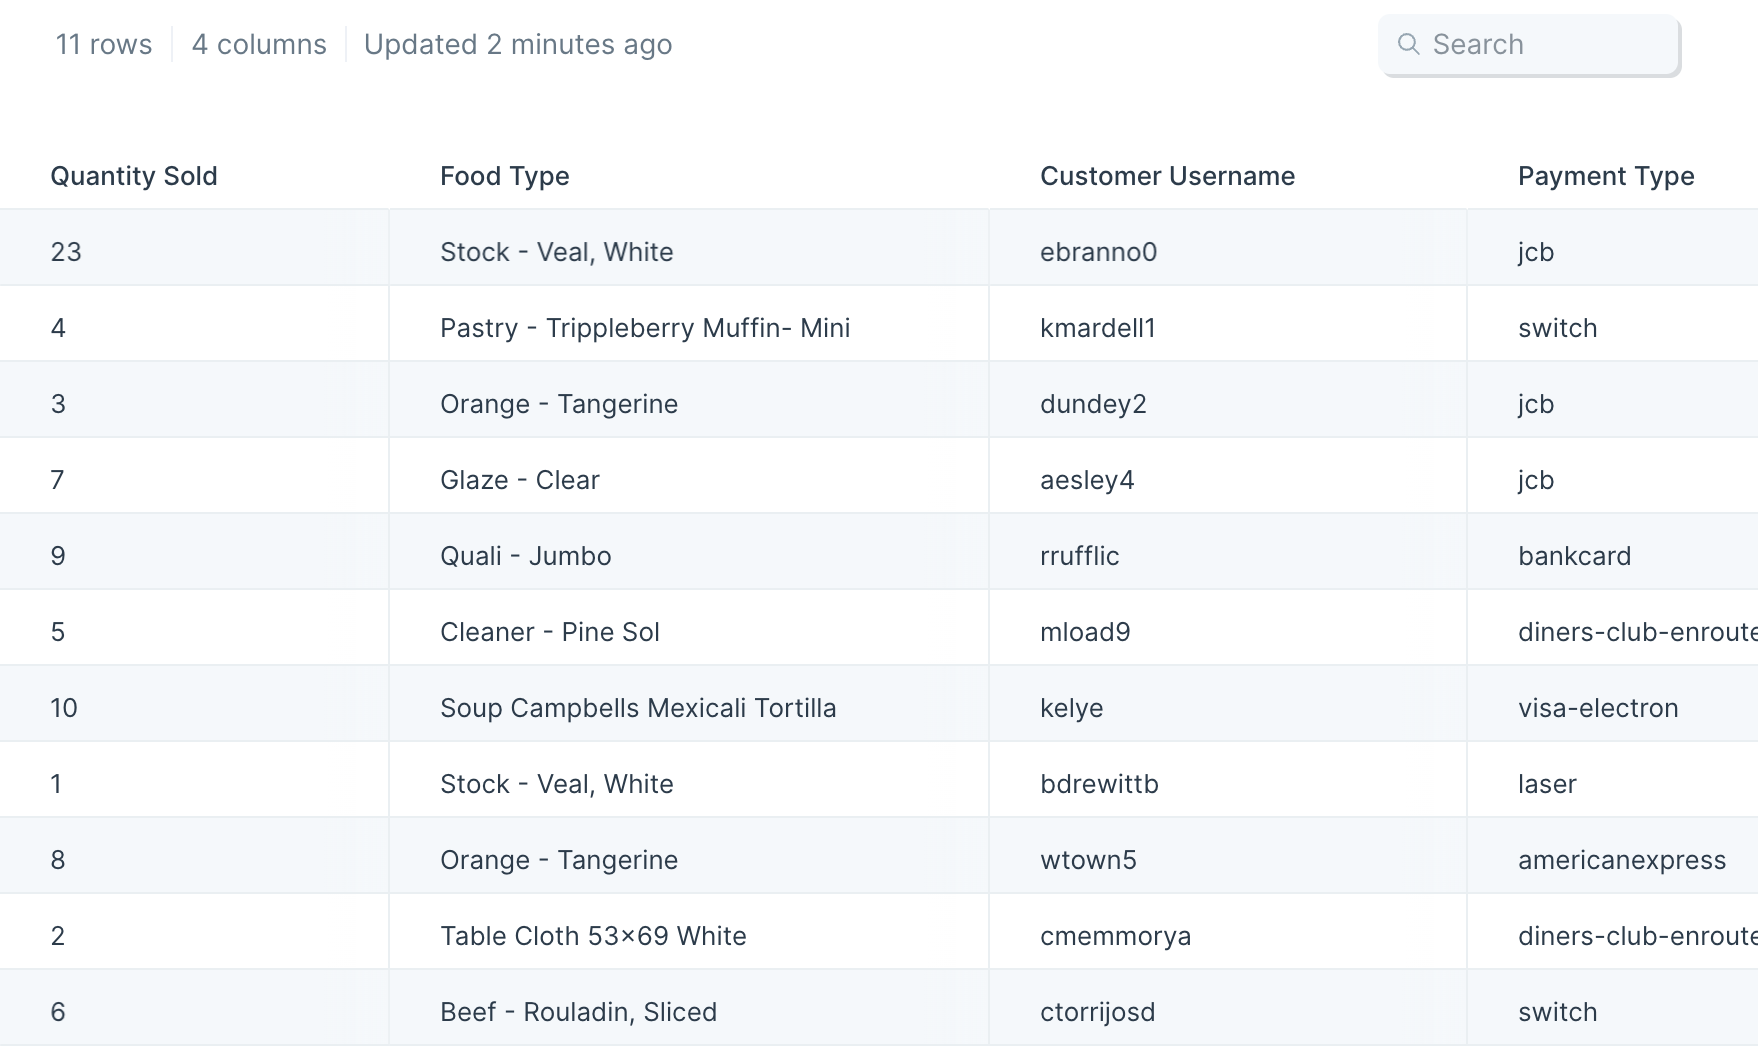
If we instruct the step to find the maximum value in the 'Quantity Sold' column, and create one new row per value in the 'Food Type' column, we can easily find the largest sale of each item.
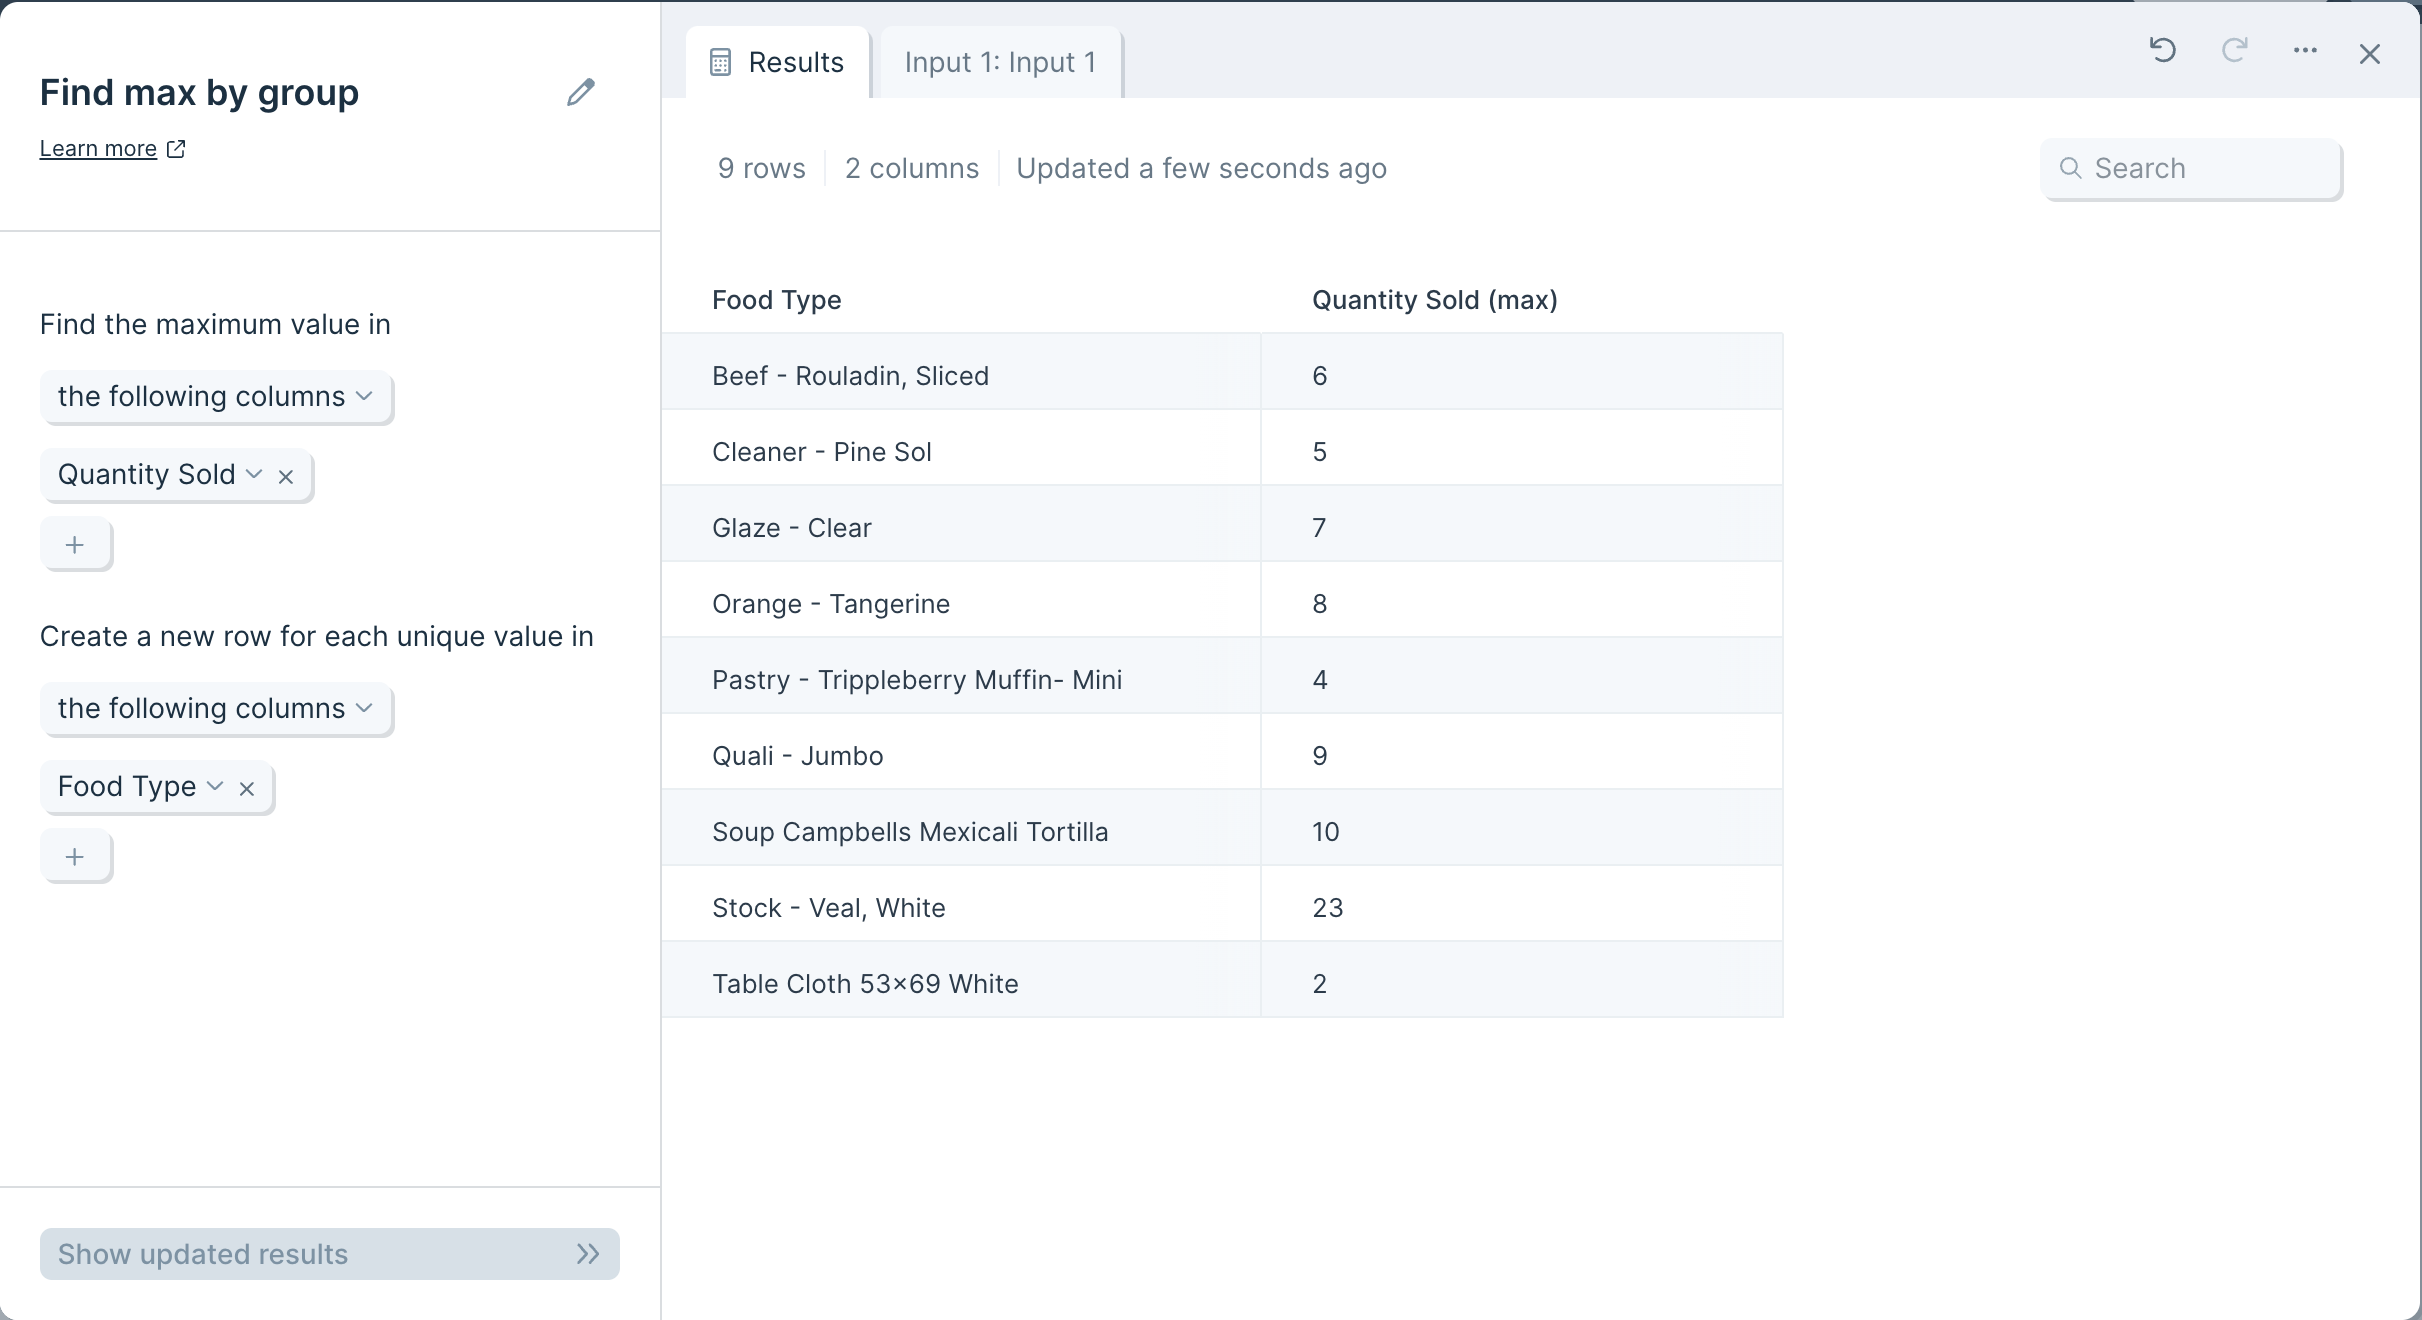
Custom settings
This step has no default behavior, and must be customized to return a useful output.
First, decide whether you would like to include or exclude given columns by selecting 'the following columns' or 'all columns except for'.
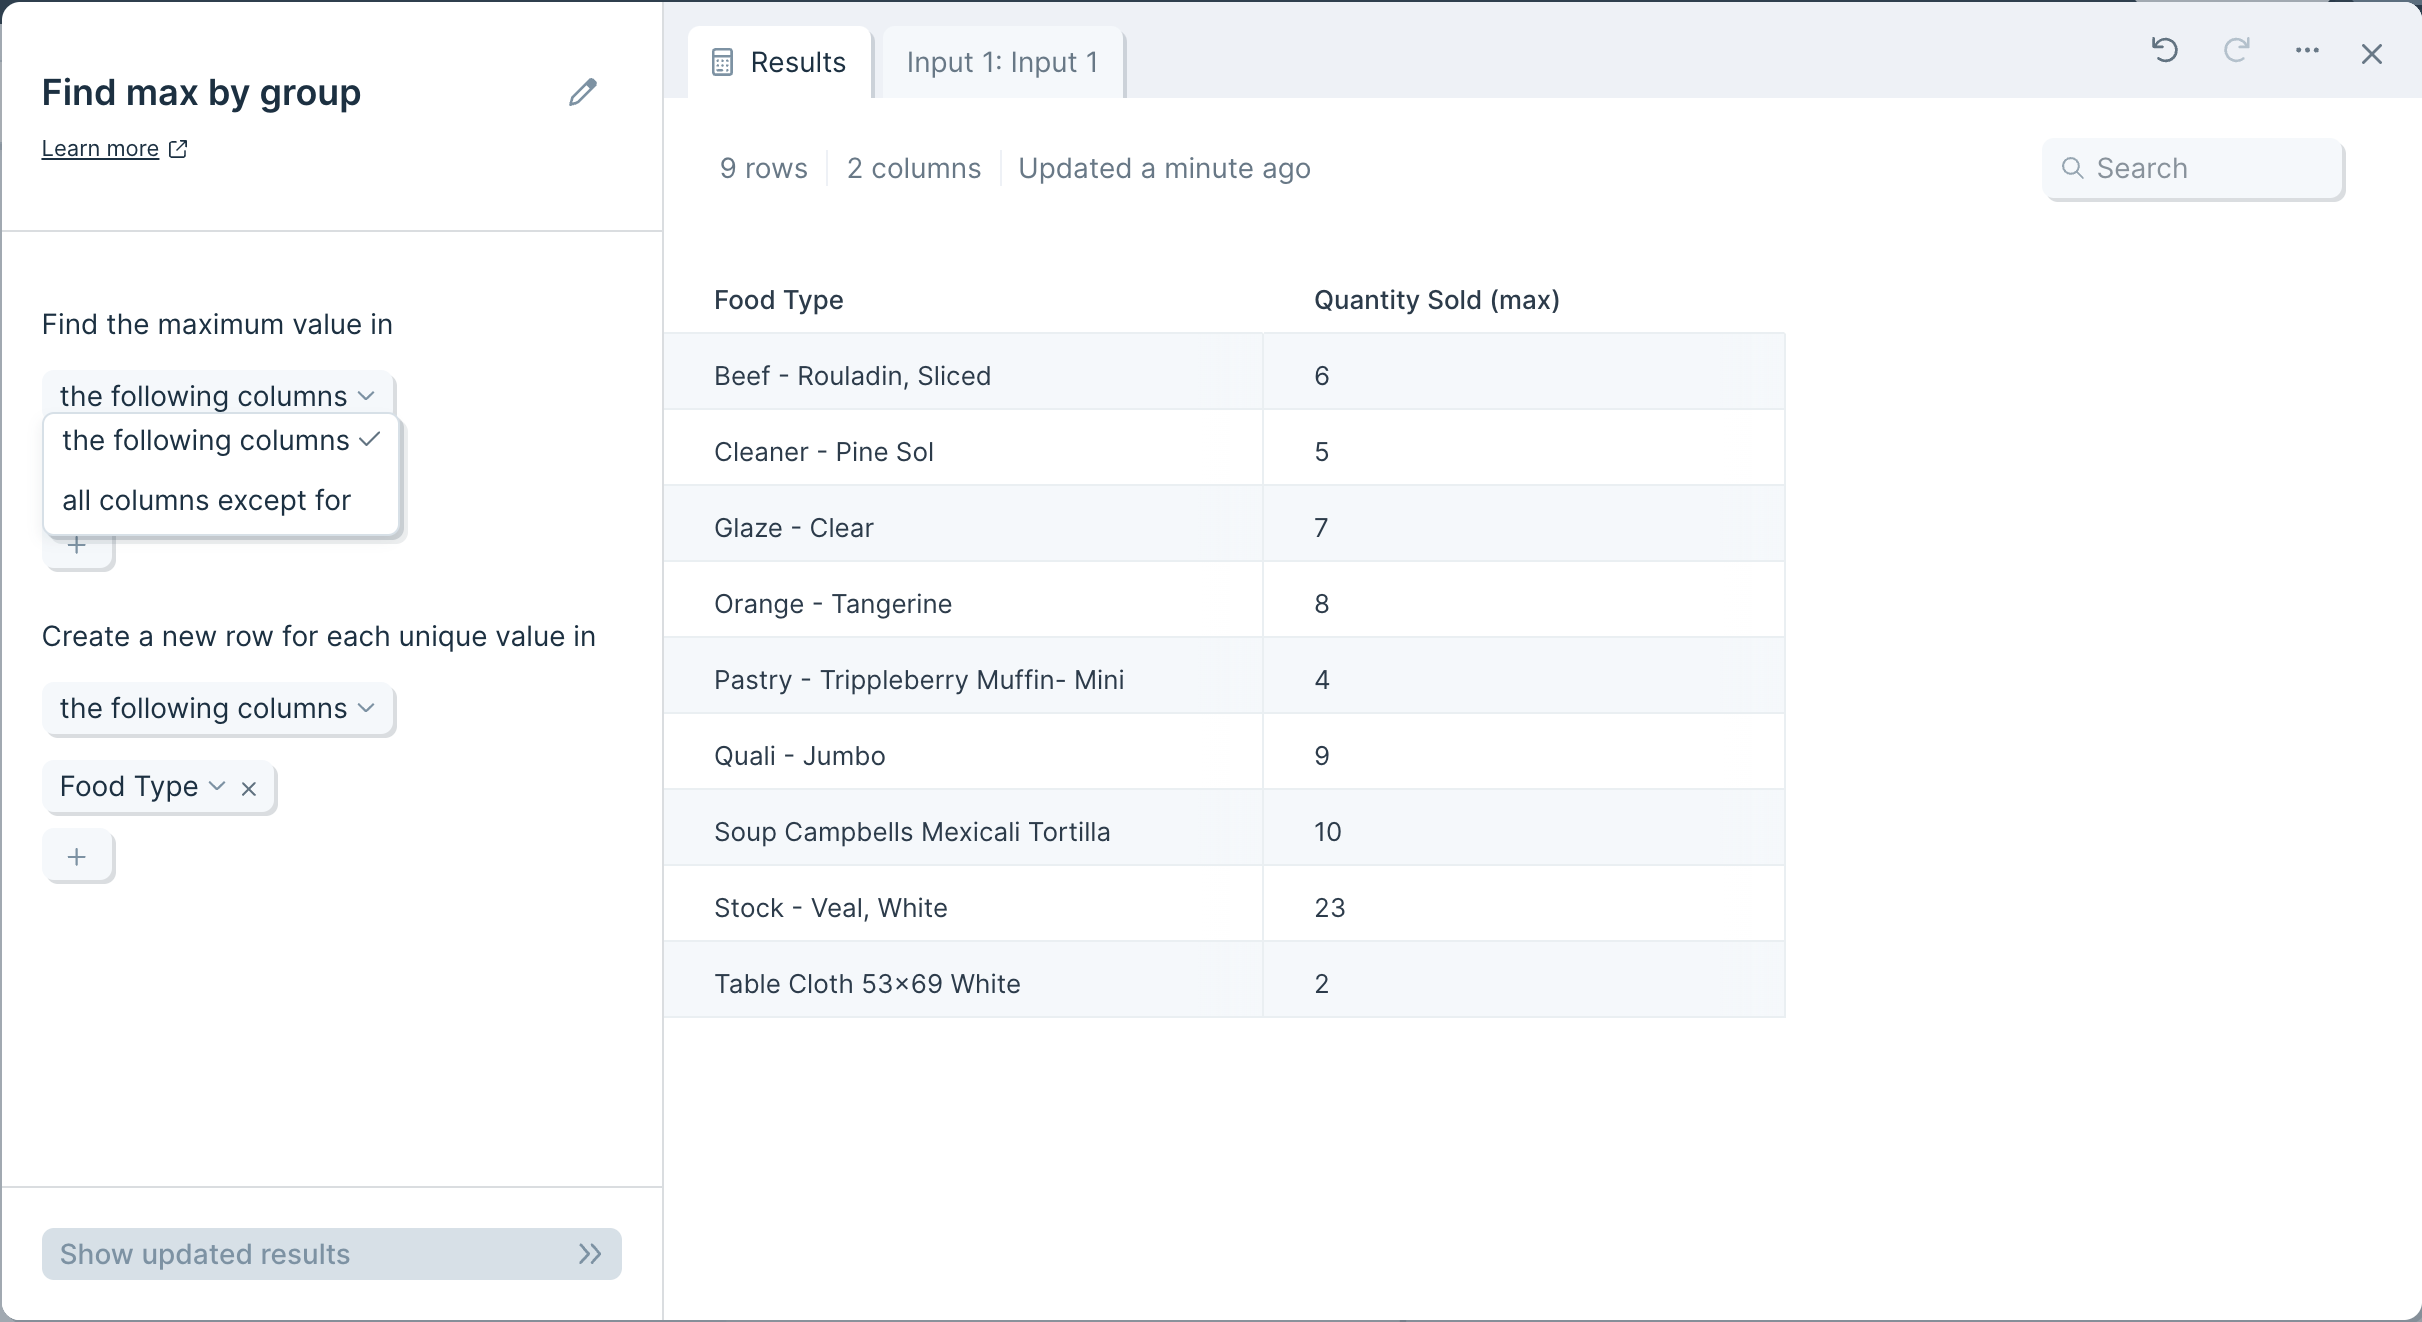
Next, click the plus sign to choose the columns you wish to include or exclude.
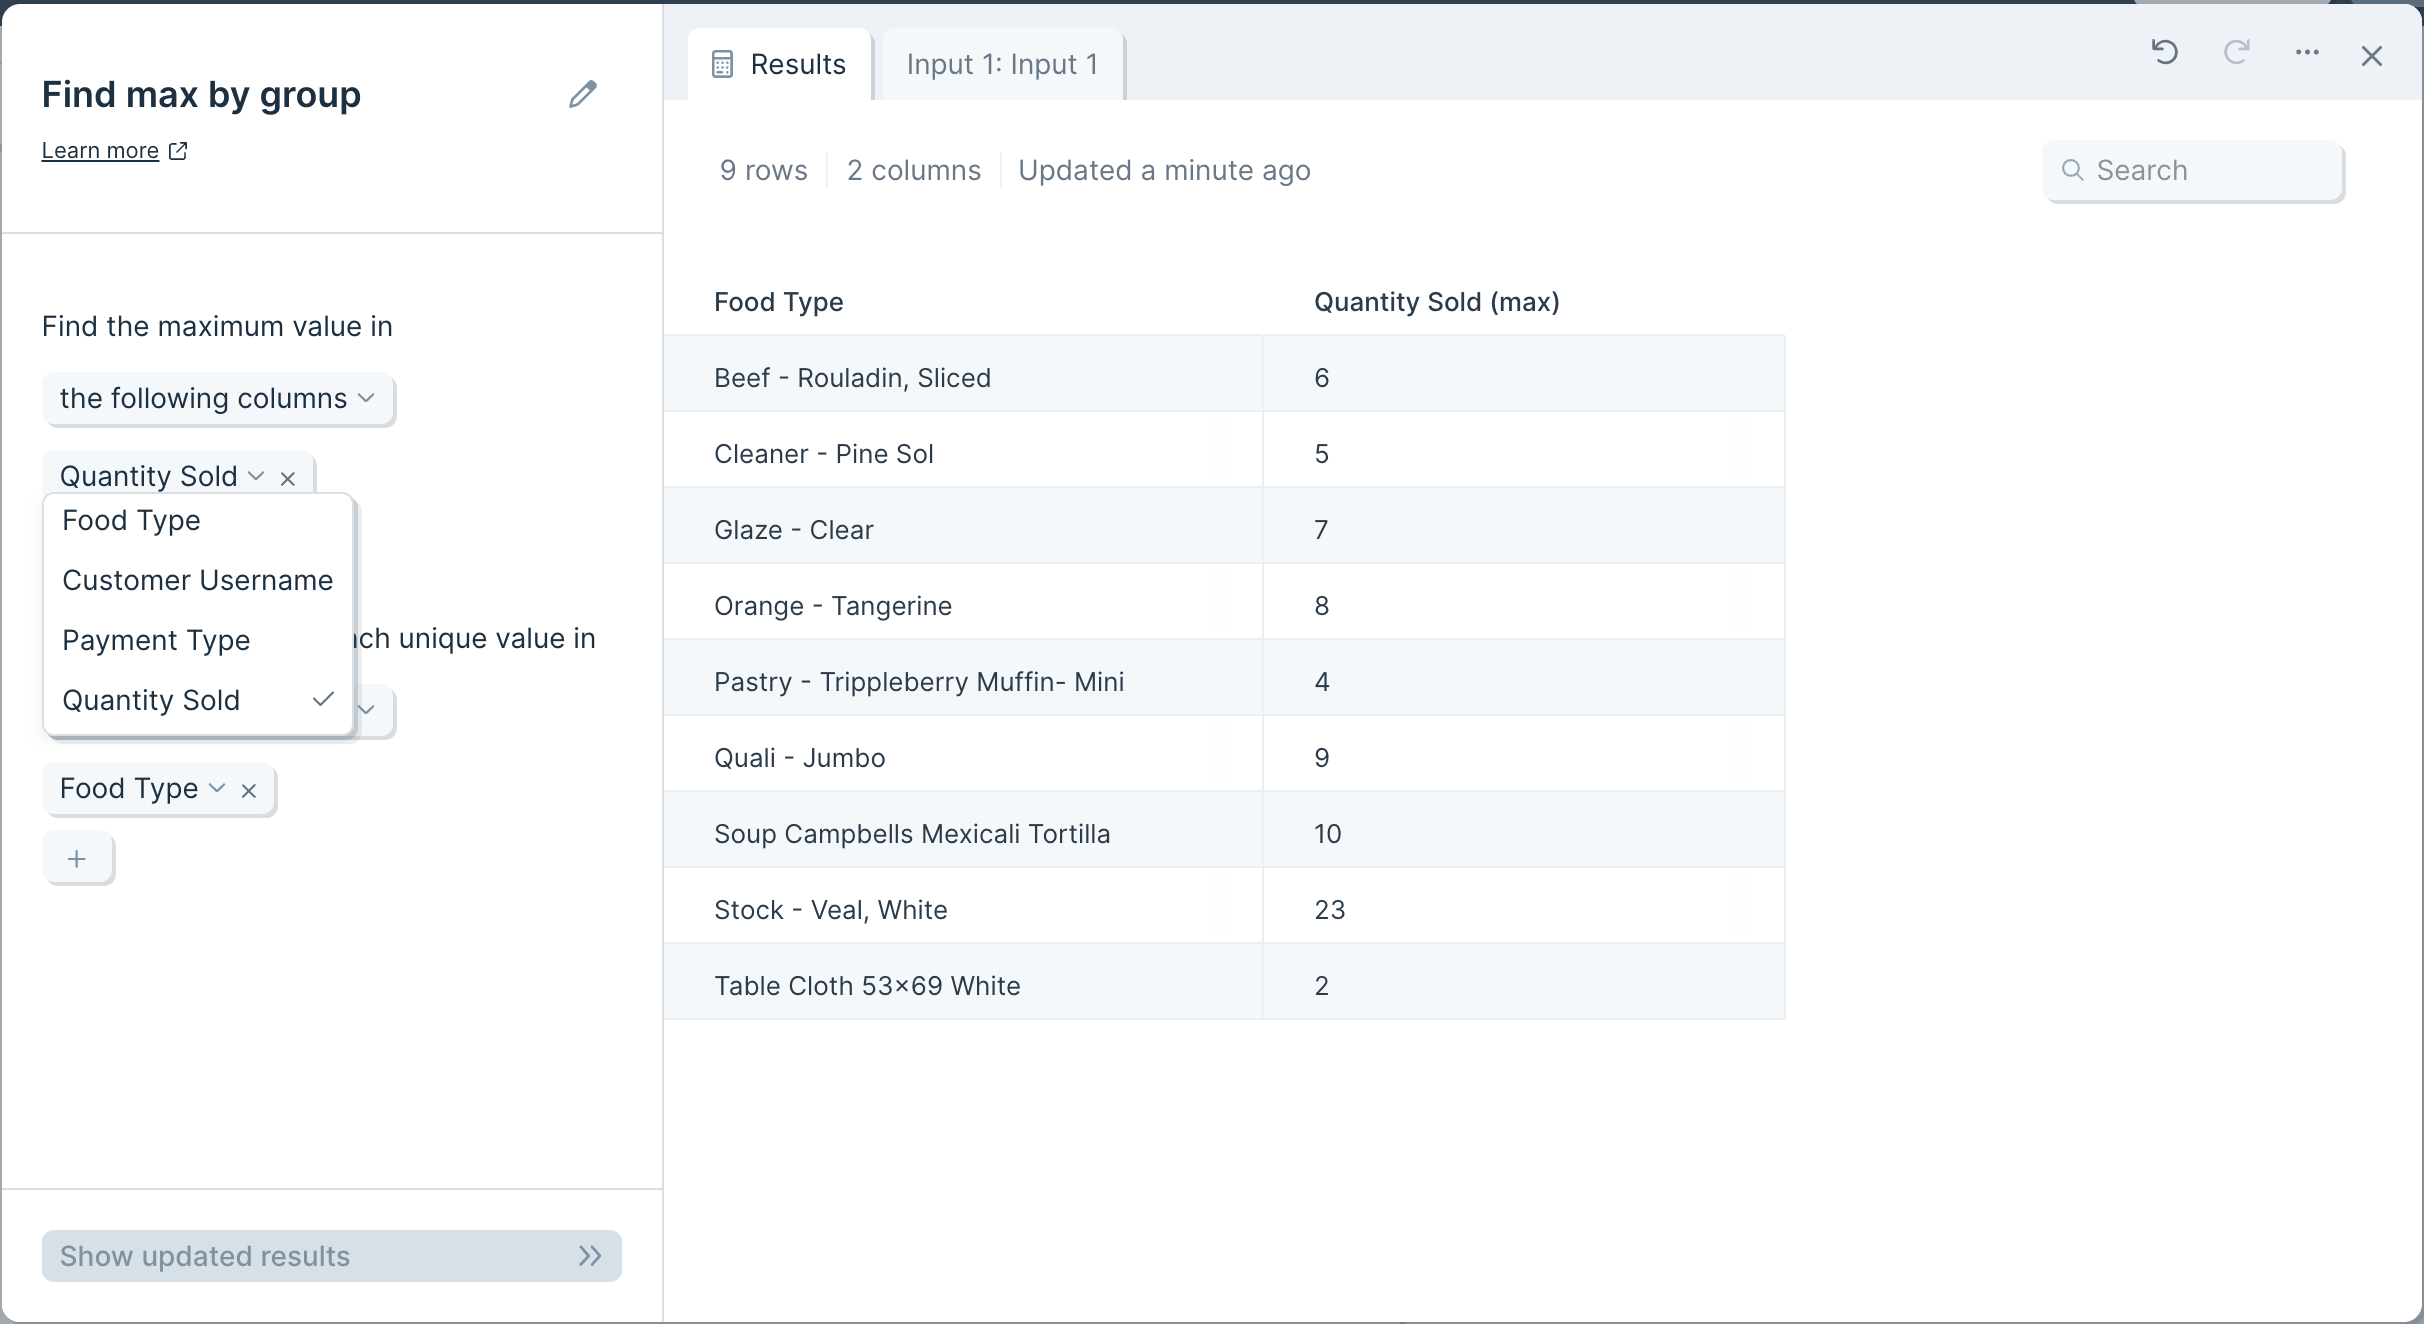
If the 'Create a new row...' option is left blank, the step will return one value per column, according to your specifications in 'Find the maximum value in'
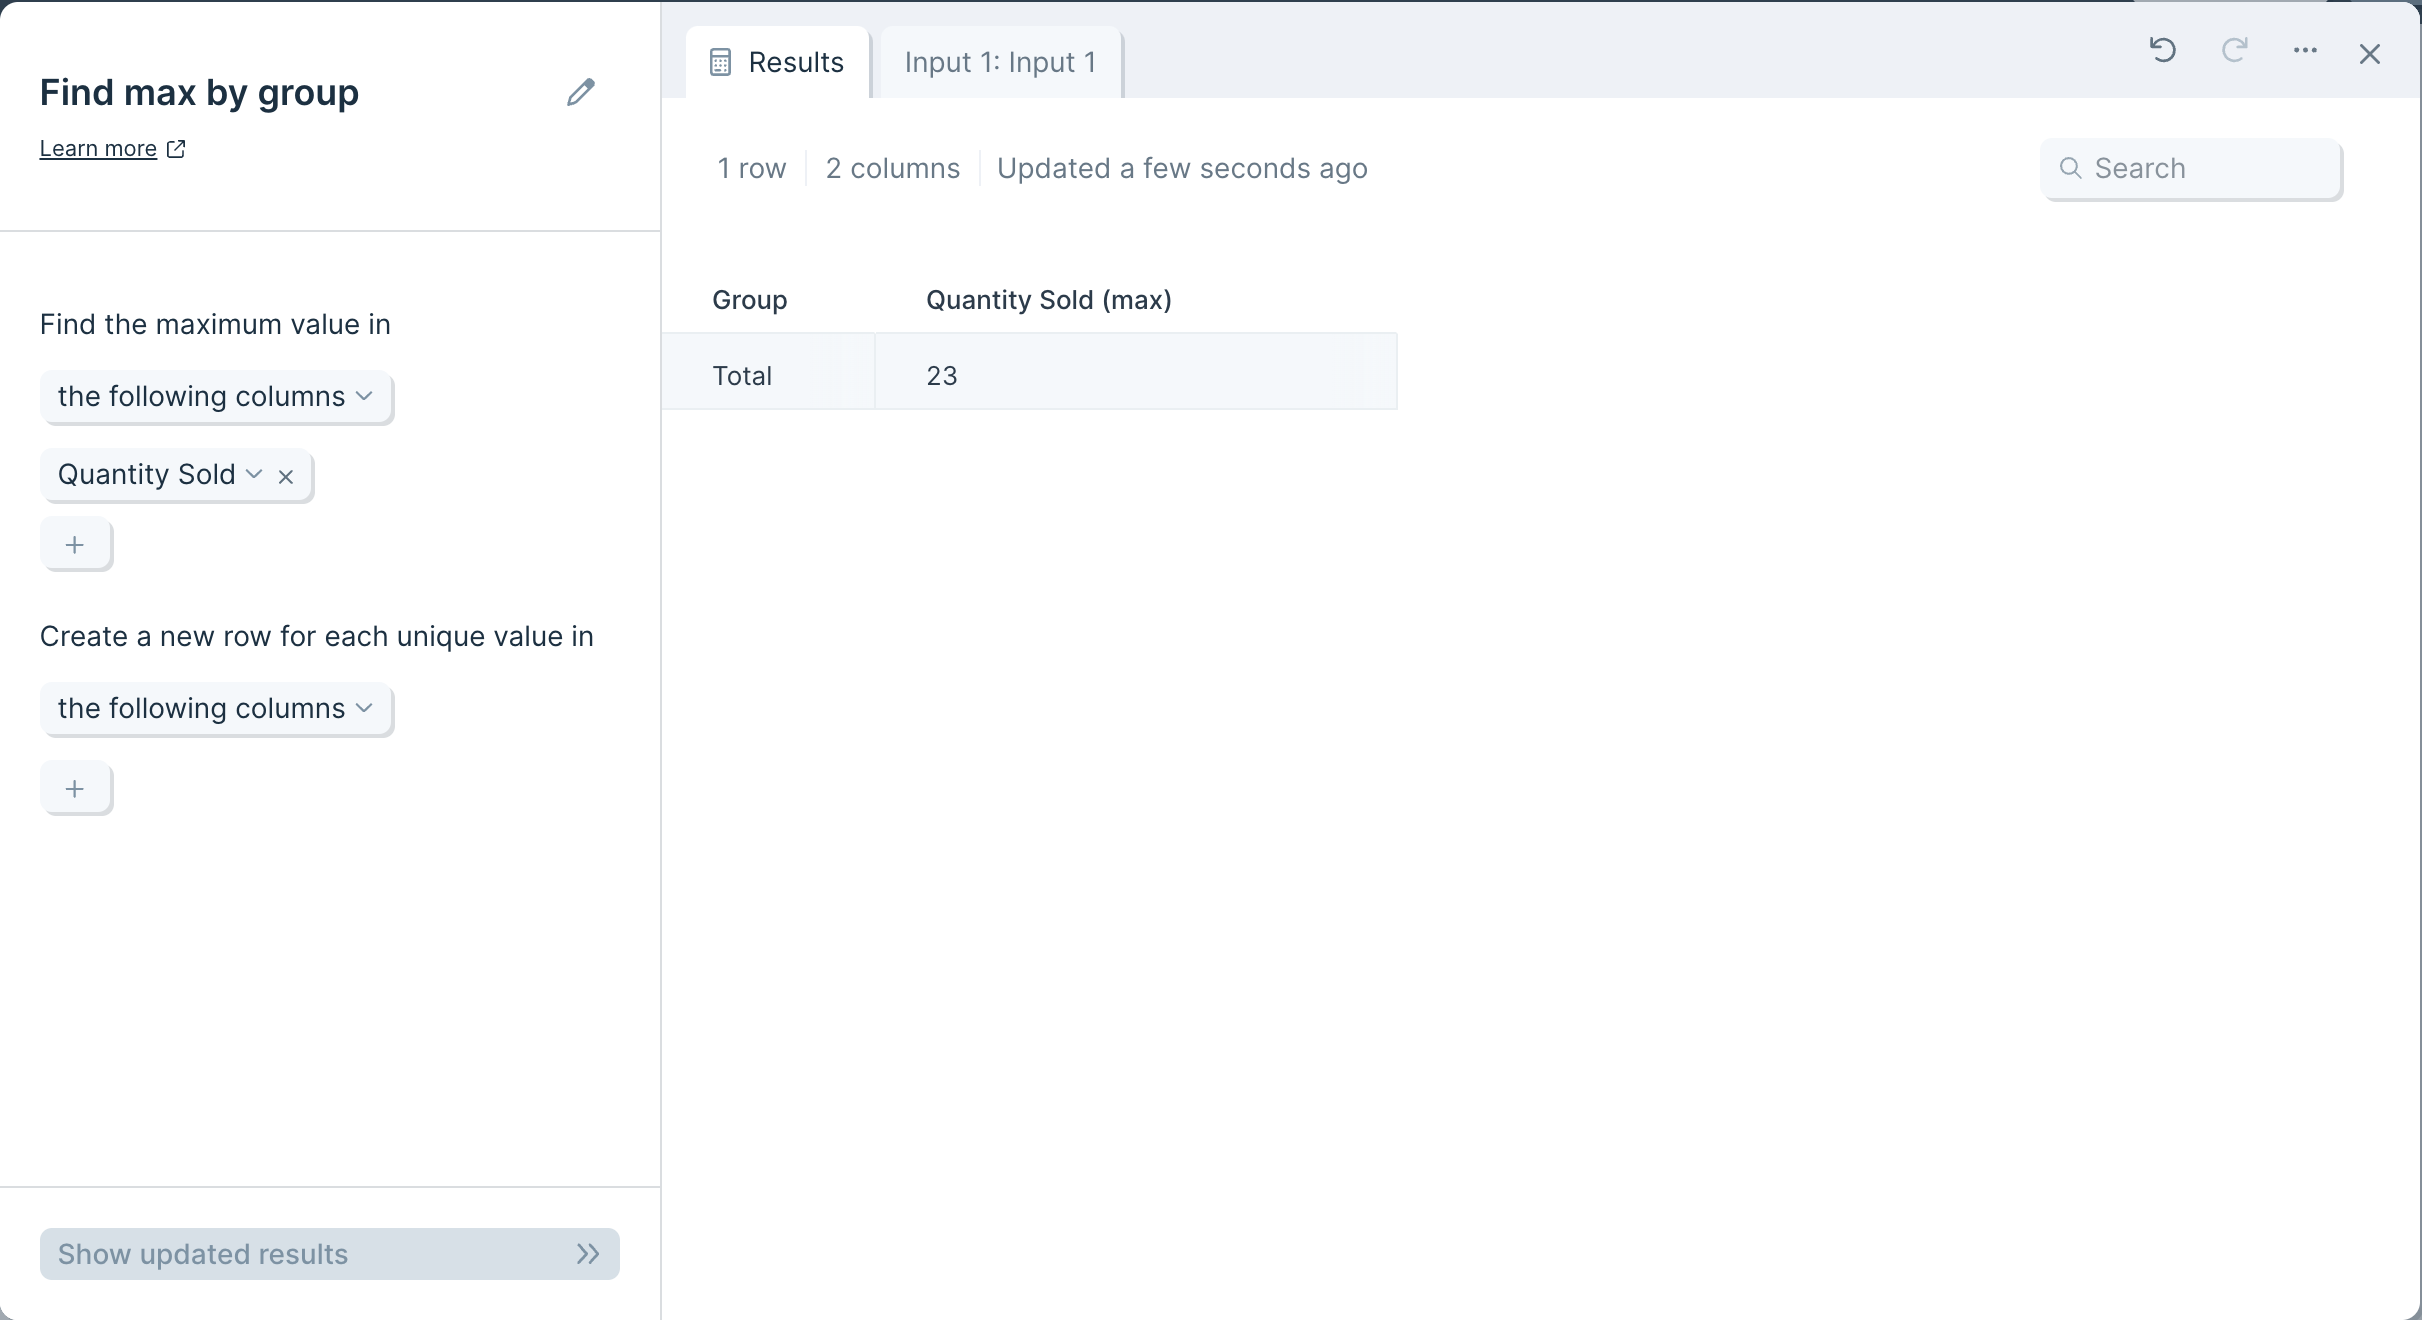
To find maximum values for multiple attributes, you can create a new row for each unique value in your table. As before, you can include or exclude given columns, and you can click the plus sign to specify.
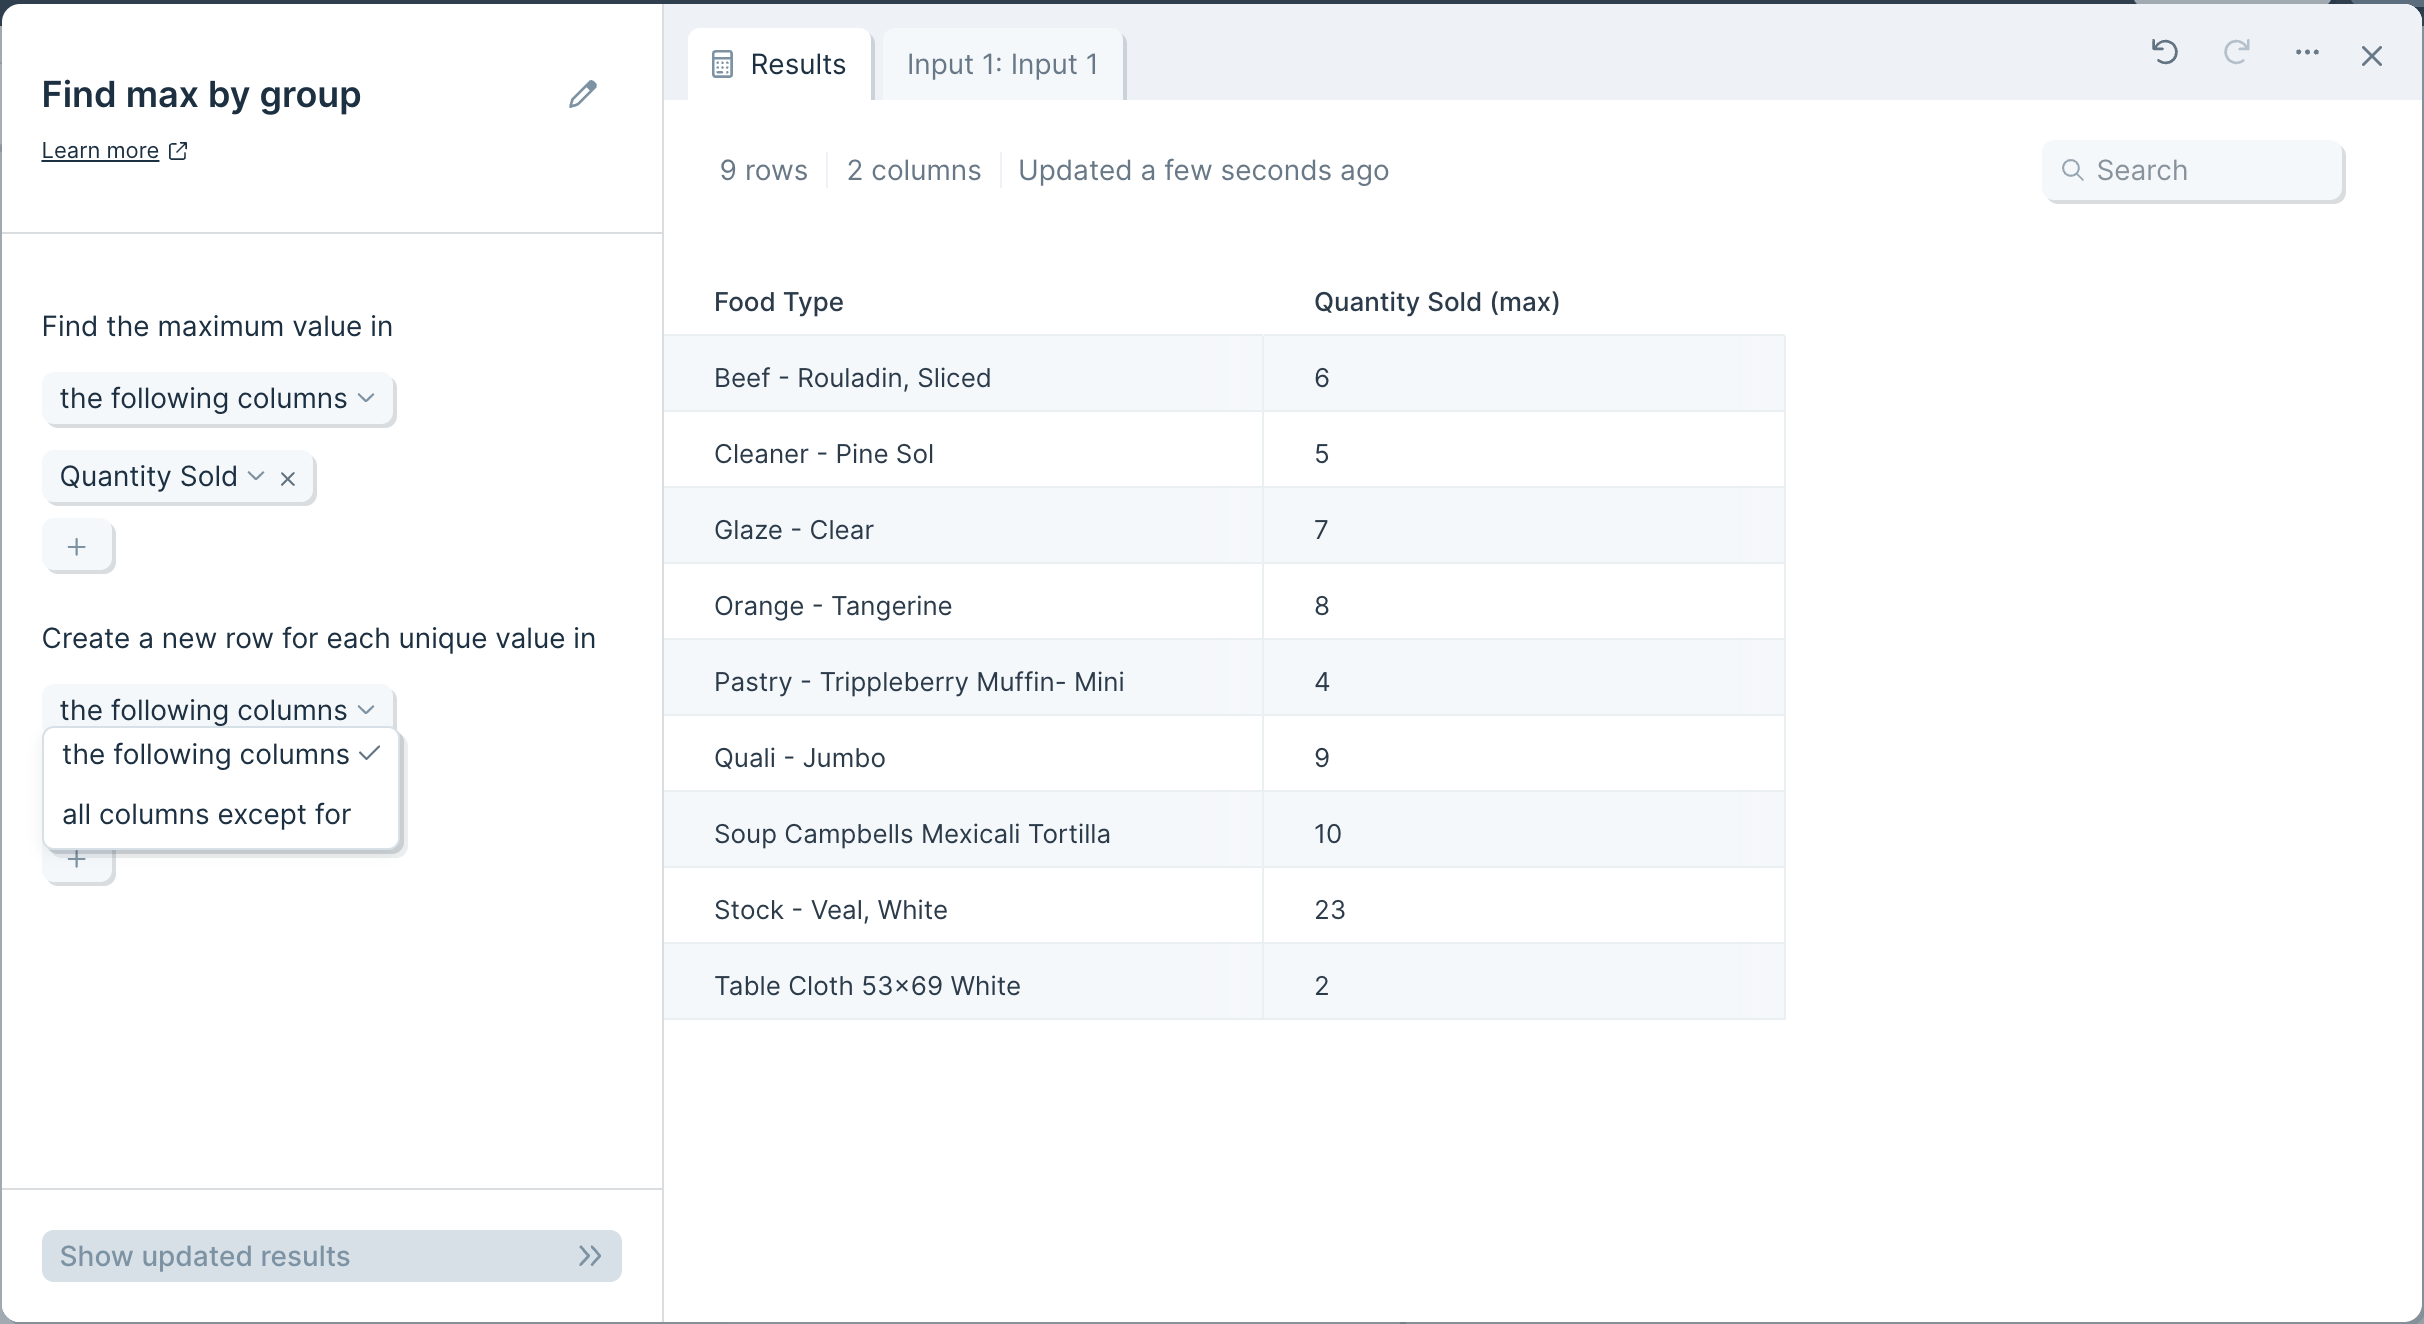
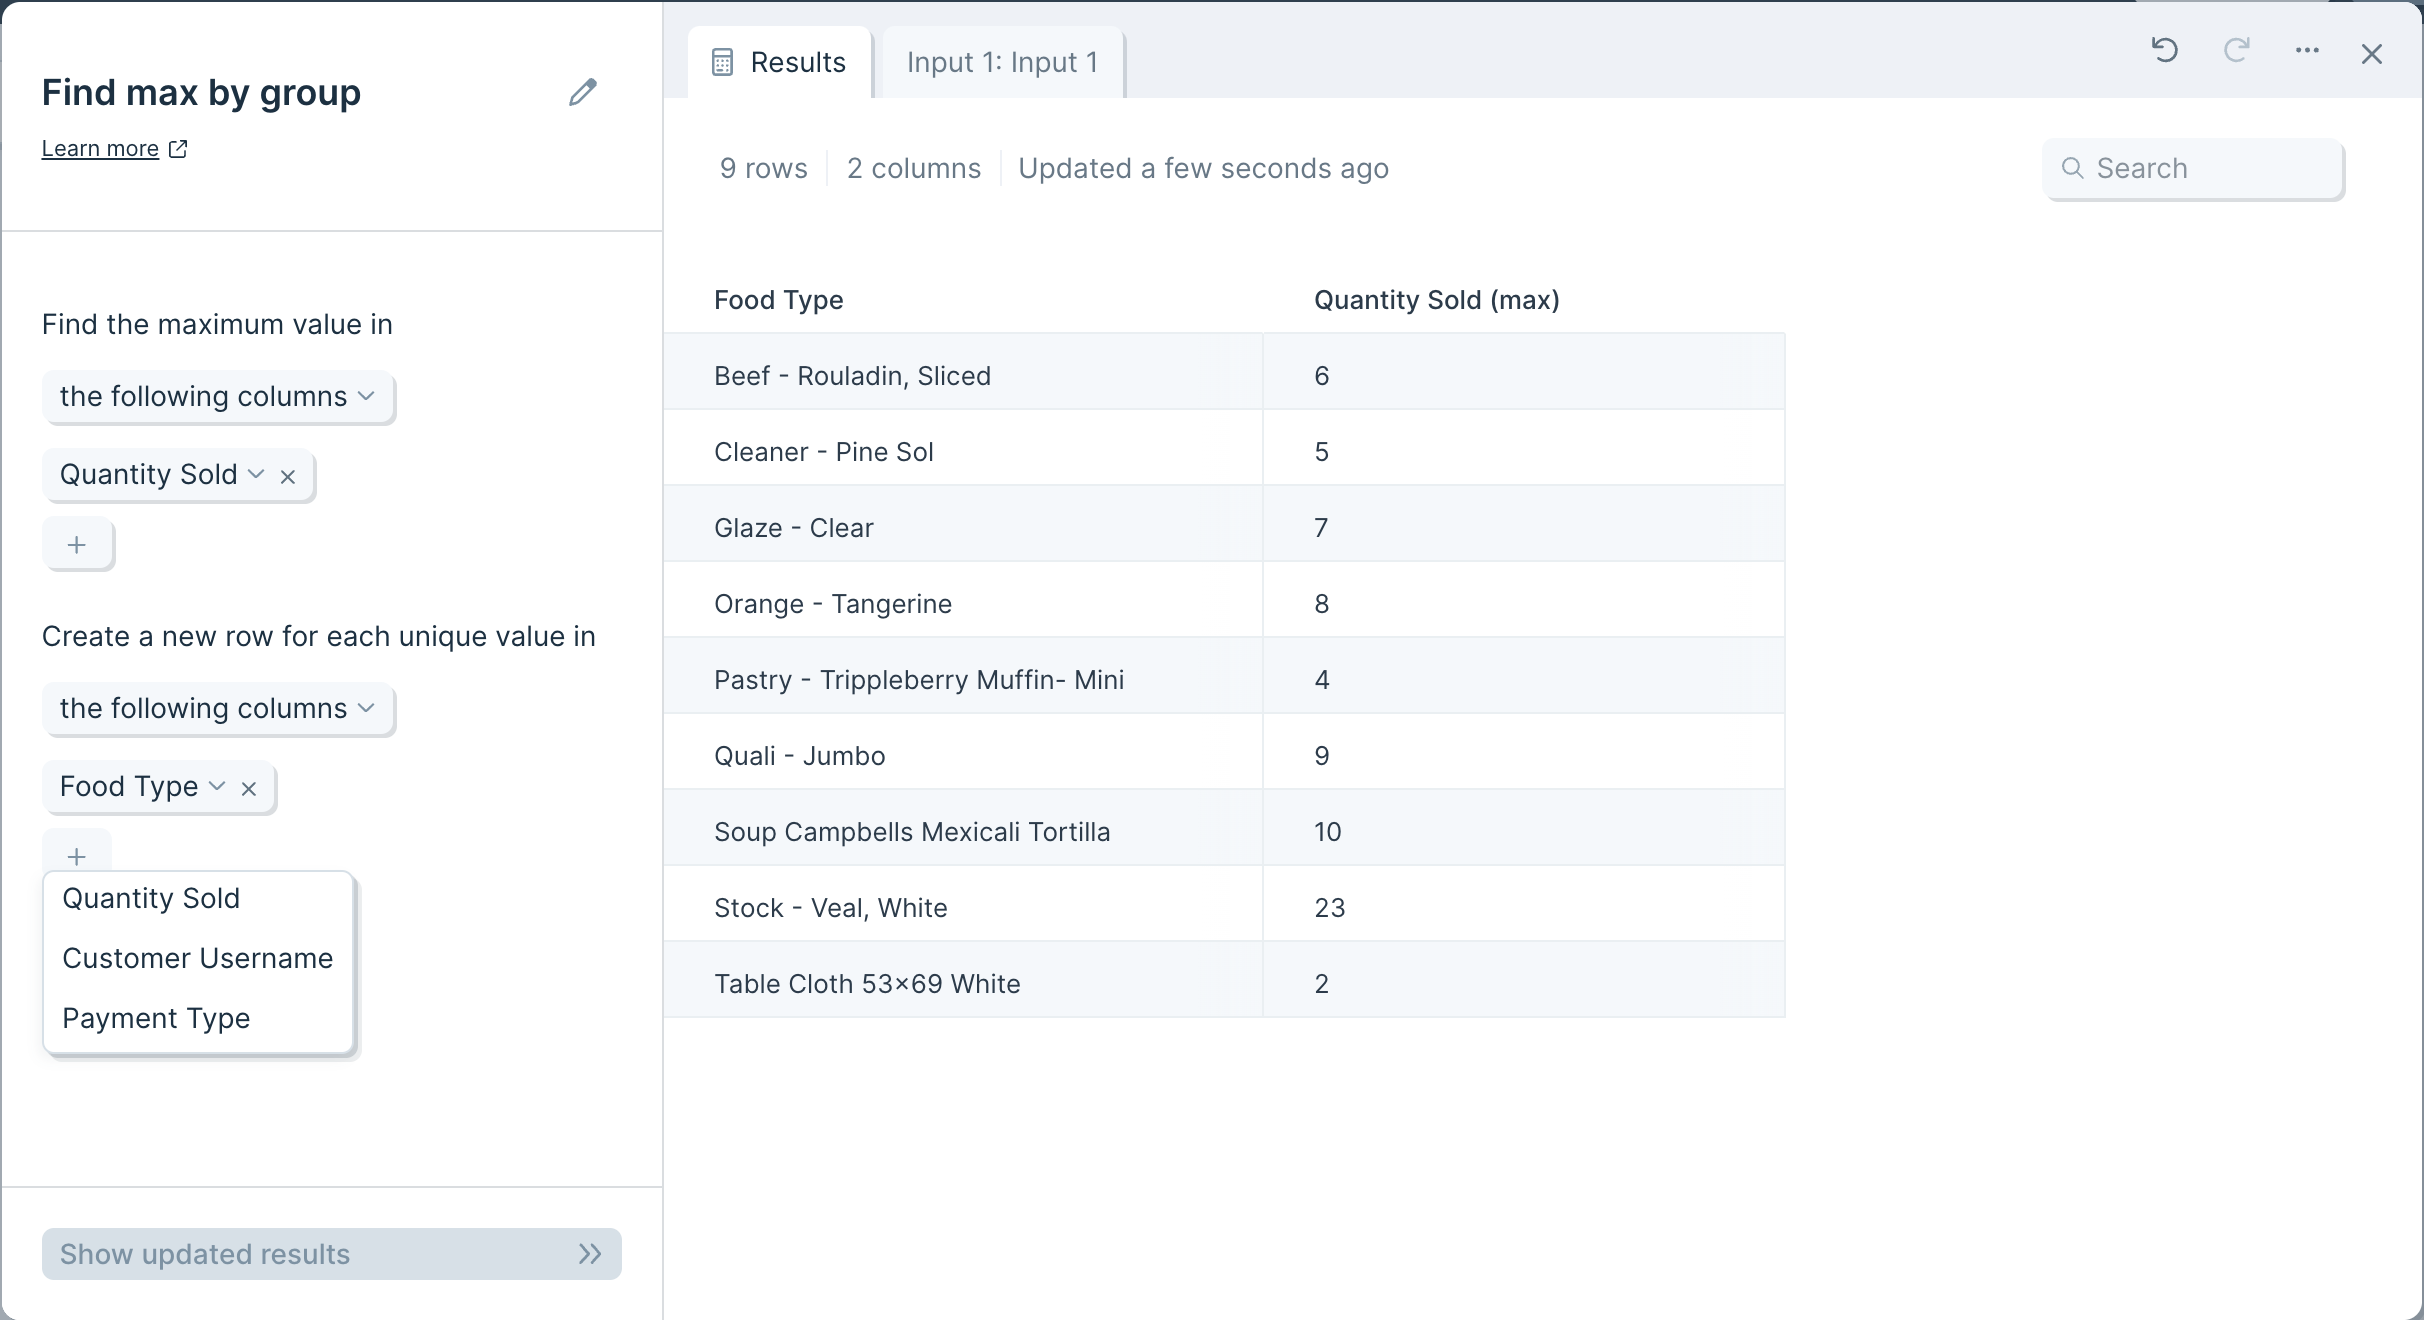
Unique value columns will add left to right, and sort A-Z, and your desired maximum value will display as a new column with "(max)" appended to its header.
Transform step:
Find min/max per row
The Find min/max step calculates the minimum or maximum value across a range of columns.
Input/output
Our input data shows how many items we sold on a given day.

We can use this step to produce an output with a new column at the right side, called 'Most Sold in a Day,' which contains the maximum value in each row.

Default settings
This step will automatically generate an 'Untitled' column after data is connected to it.

Custom settings
In the left-side toolbar, first choose in the 'Operation' dropdown menu whether our new column should show the 'Min' or the 'Max'.

Then choose the columns to operate on by selecting values under 'Range Begin' and 'Range End'.

After this, name your new column and click 'Show updated results' at the bottom to save.

There is an advanced settings menu that you can expand. By default, the box is checked to 'Prefer numbers' when running your operation. You can deselect this option, but we recommend leaving it on.

Your table will now have a column appended, displaying the minimum or maximum value per row, within the columns in your selected range.
Transform step:
Find minimum by group
The Find min by group step calculates the minimum value in a column or a group of columns. This step is similar to the MIN function in Excel.
Input/Output
Our input data has 11 rows of order information showing us how many items were sold, the food type, the customer name, and their payment type.

If we instruct the step to find the minimum value in the 'Quantity Sold' column, and create one new row per value in the 'Food Type' column, we can easily find the smallest sale of each item.
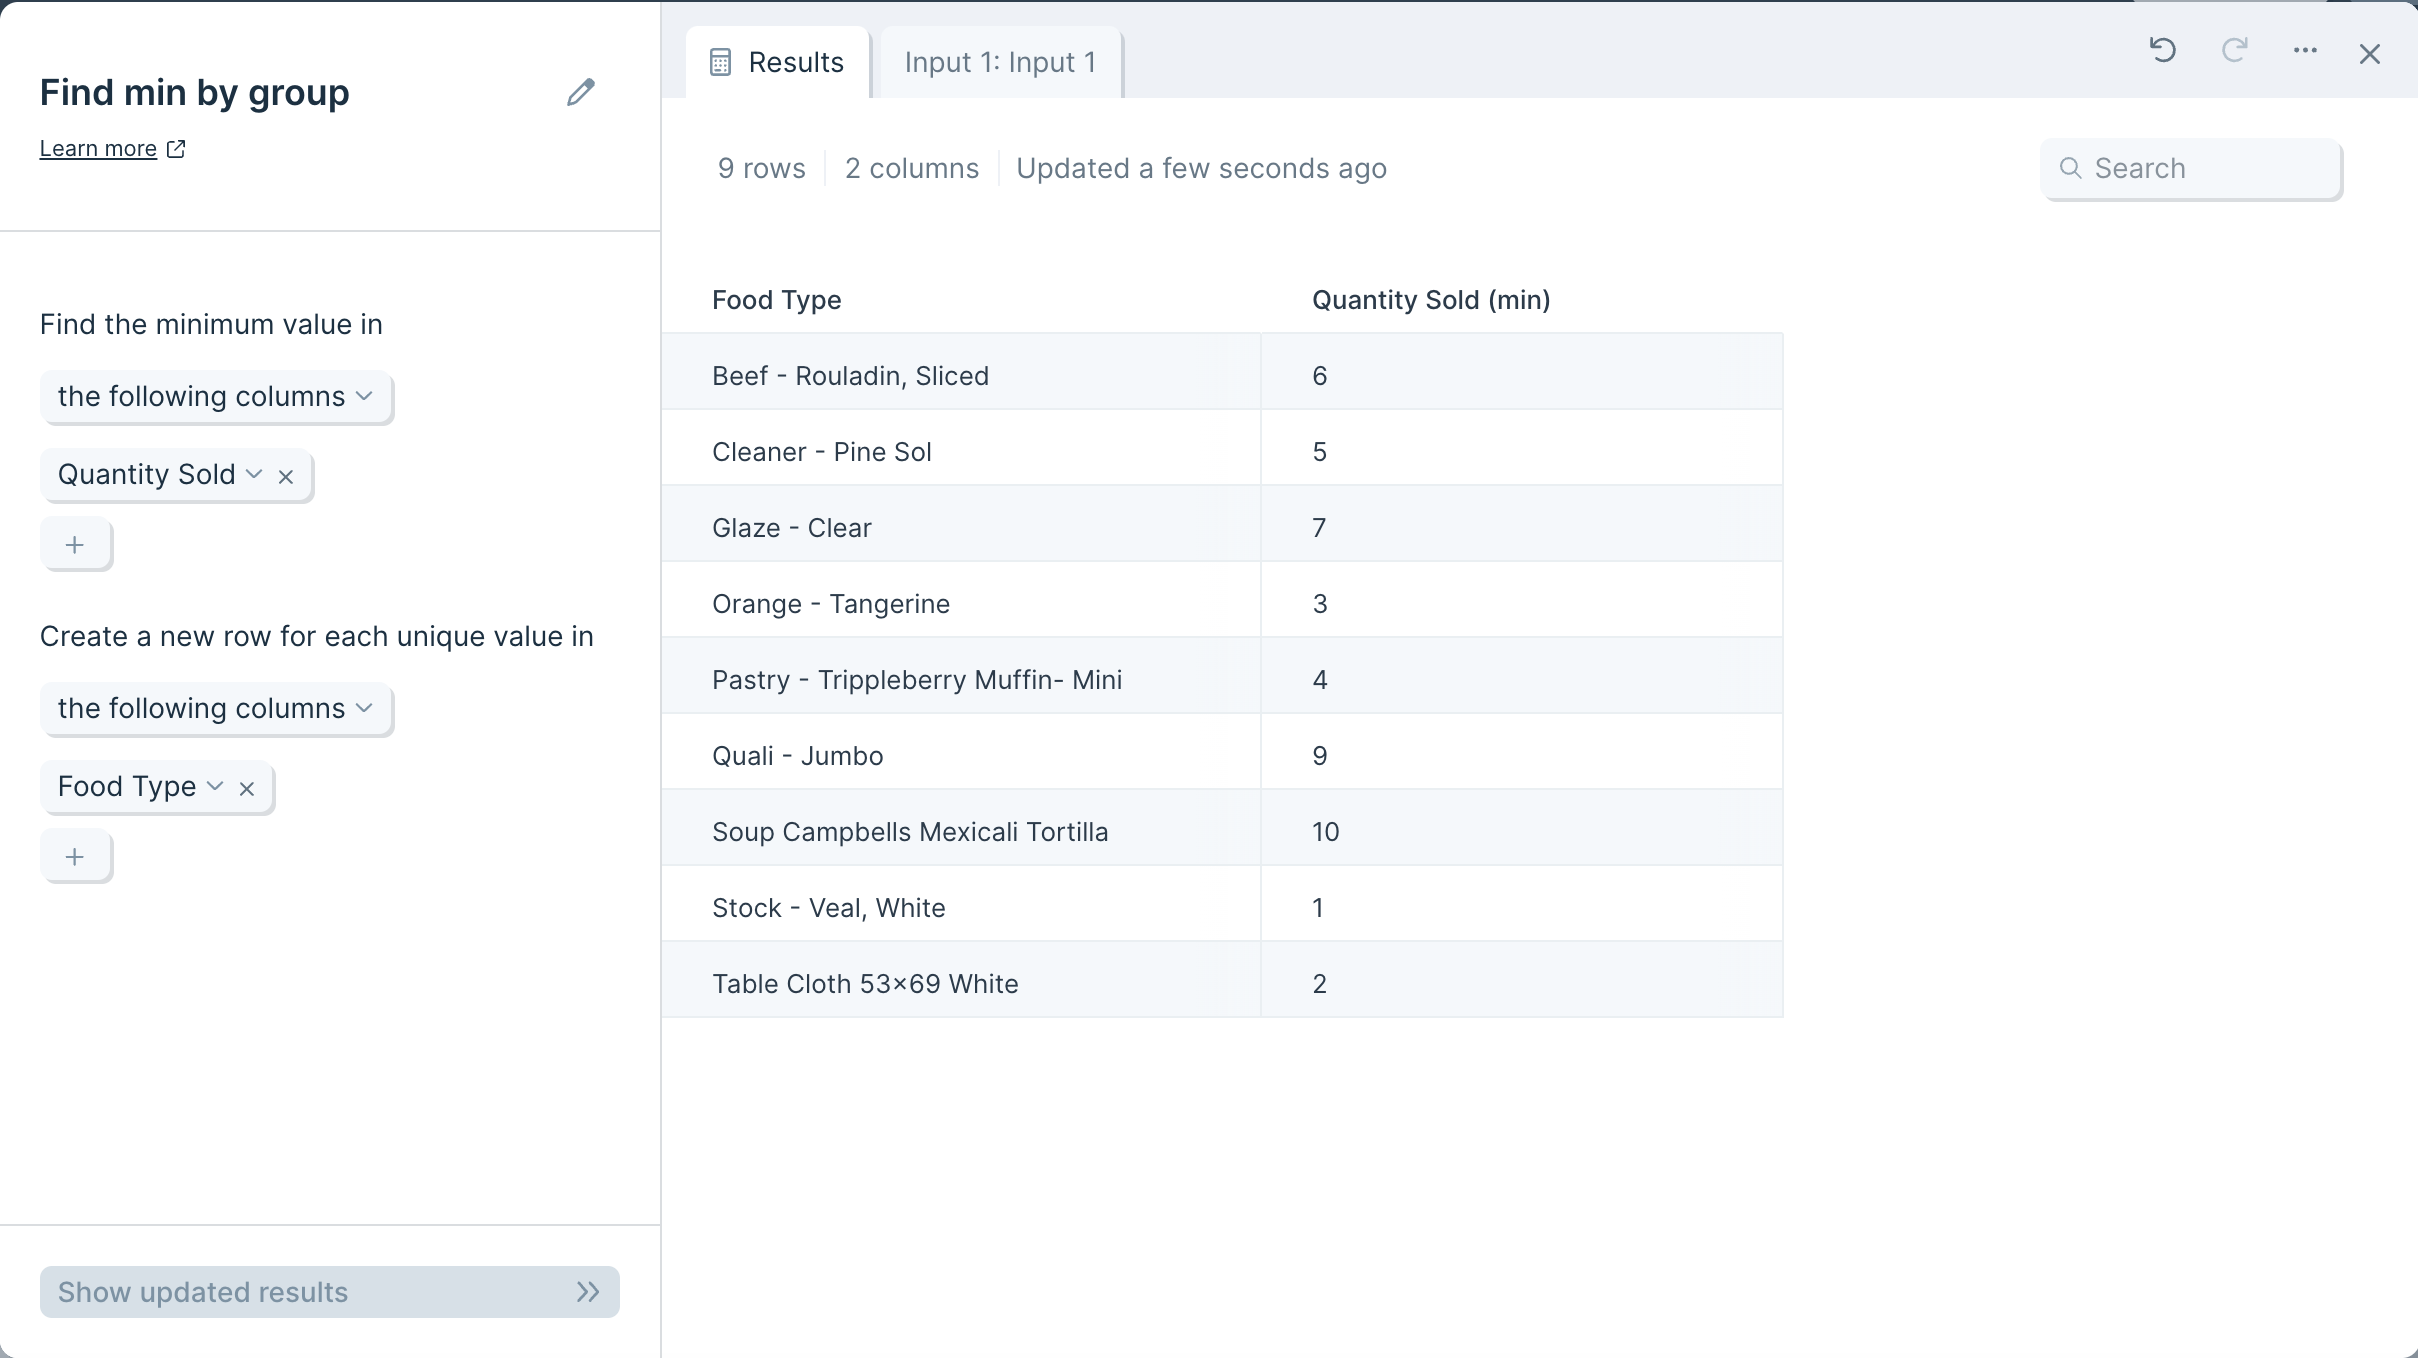
Custom settings
This step has no default behavior, and must be customized to return a useful output.
First, decide whether you would like to include or exclude given columns by selecting 'the following columns' or 'all columns except for'.
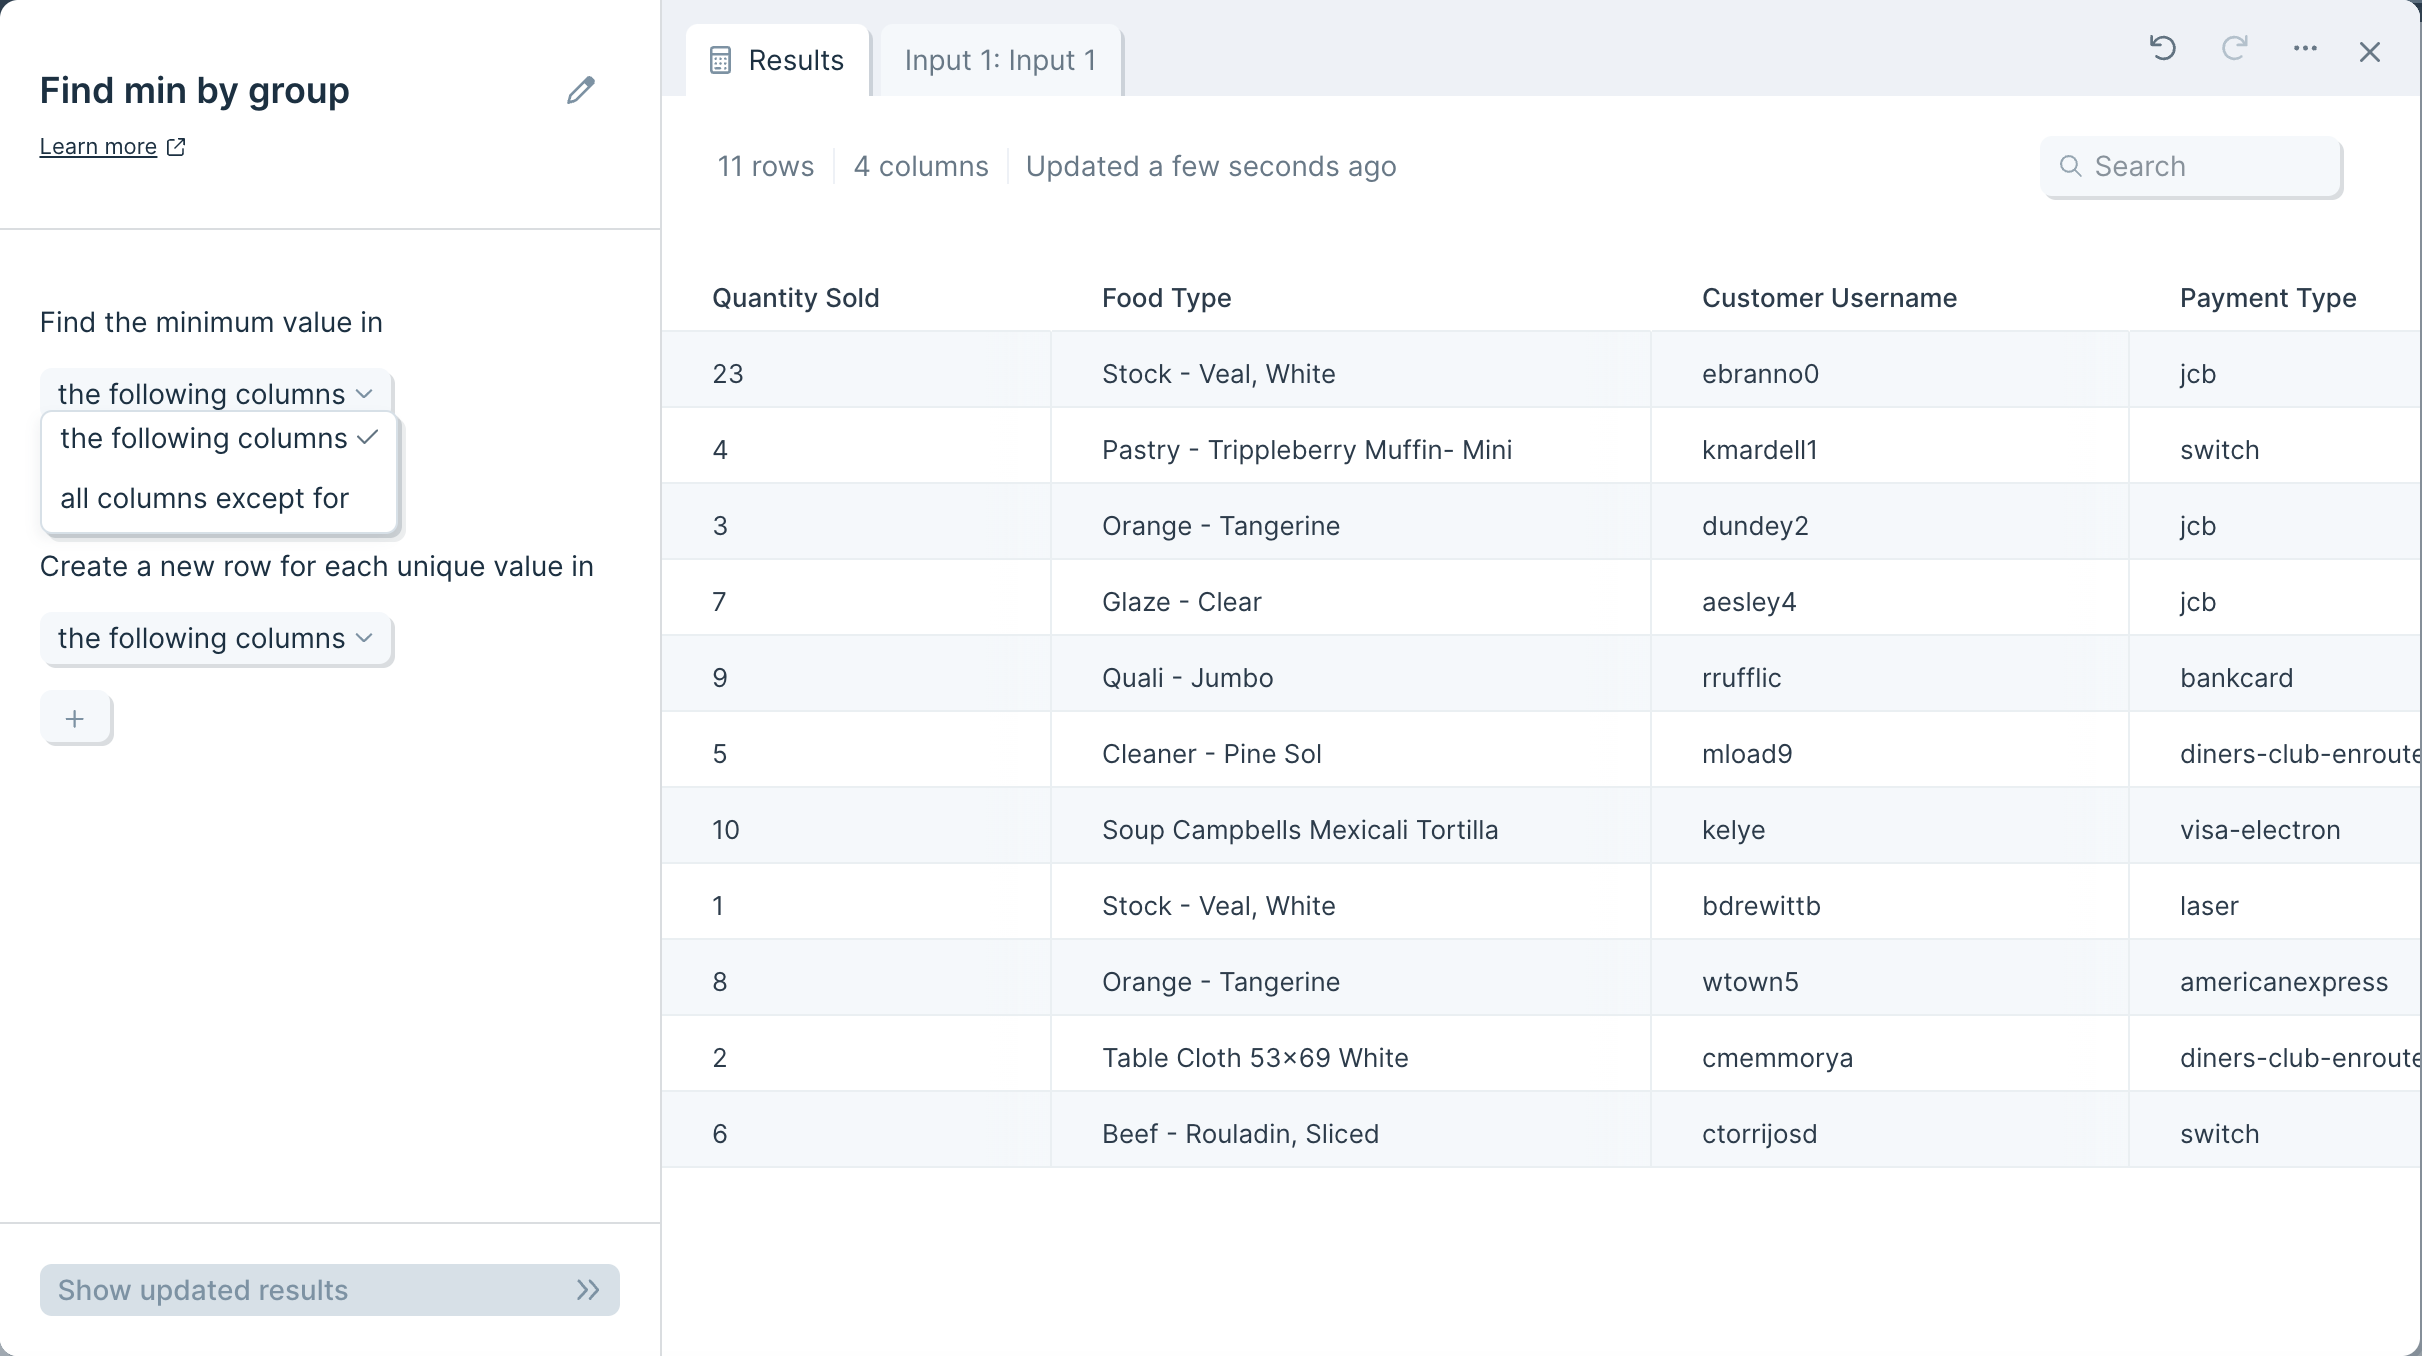
Next, click the plus sign to choose the columns you wish to include or exclude.
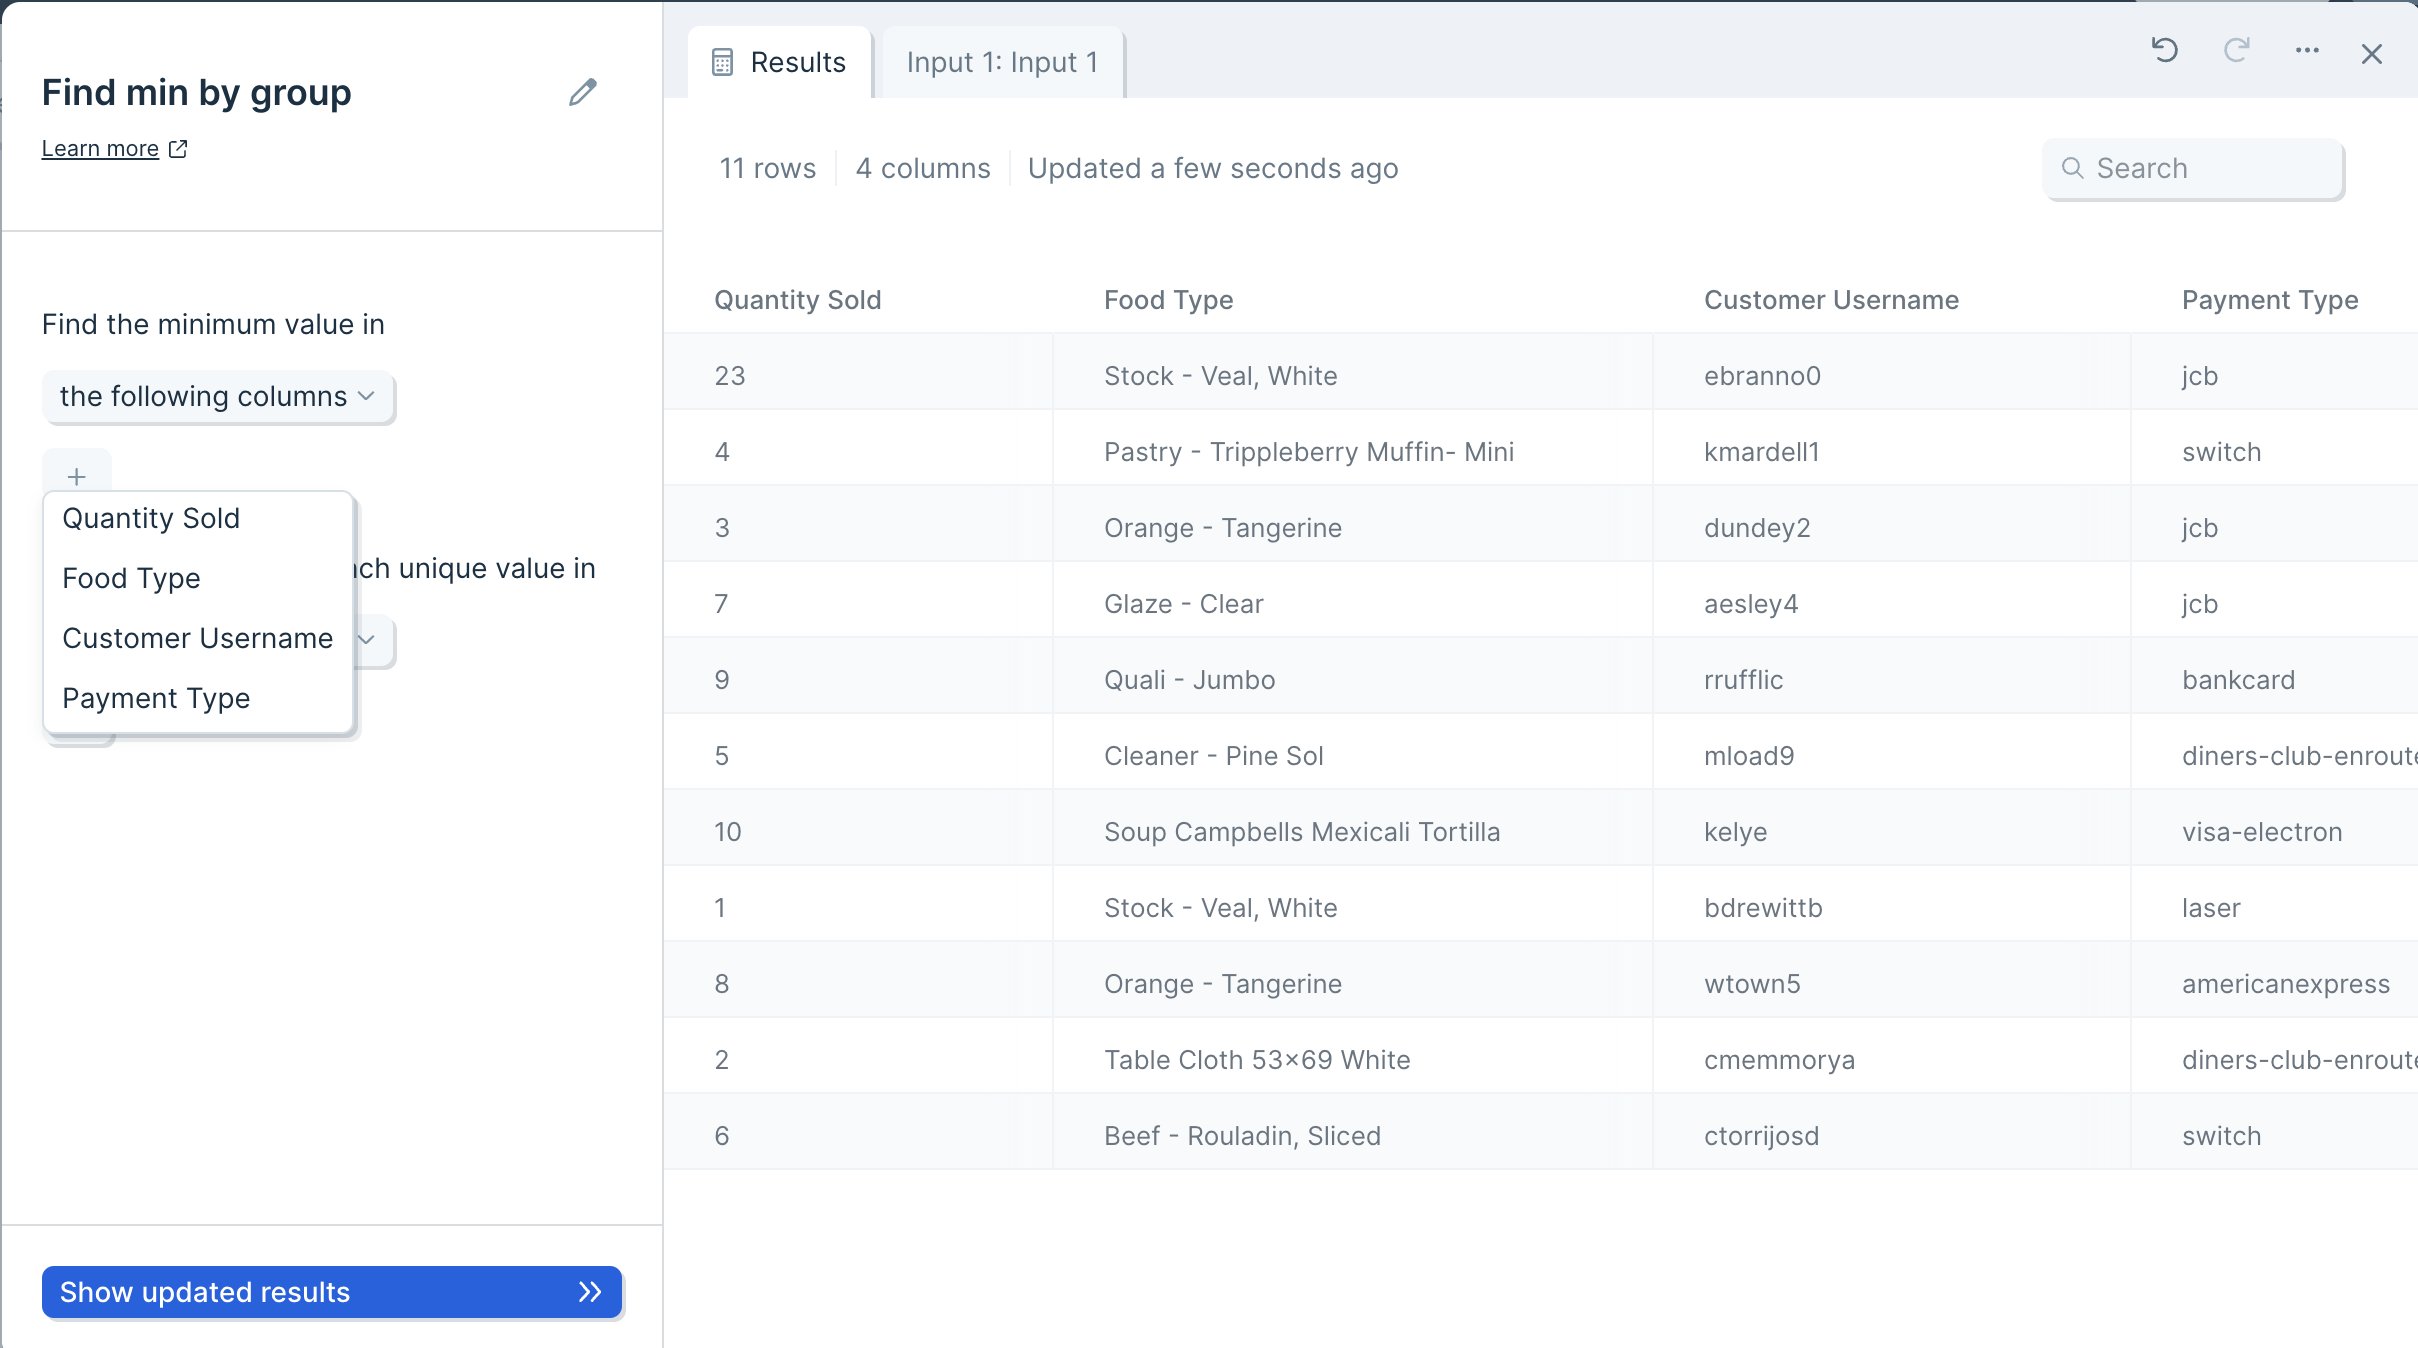
If the 'Create a new row...' option is left blank, the step will return one value per column, according to your specifications in 'Find the minimum...'
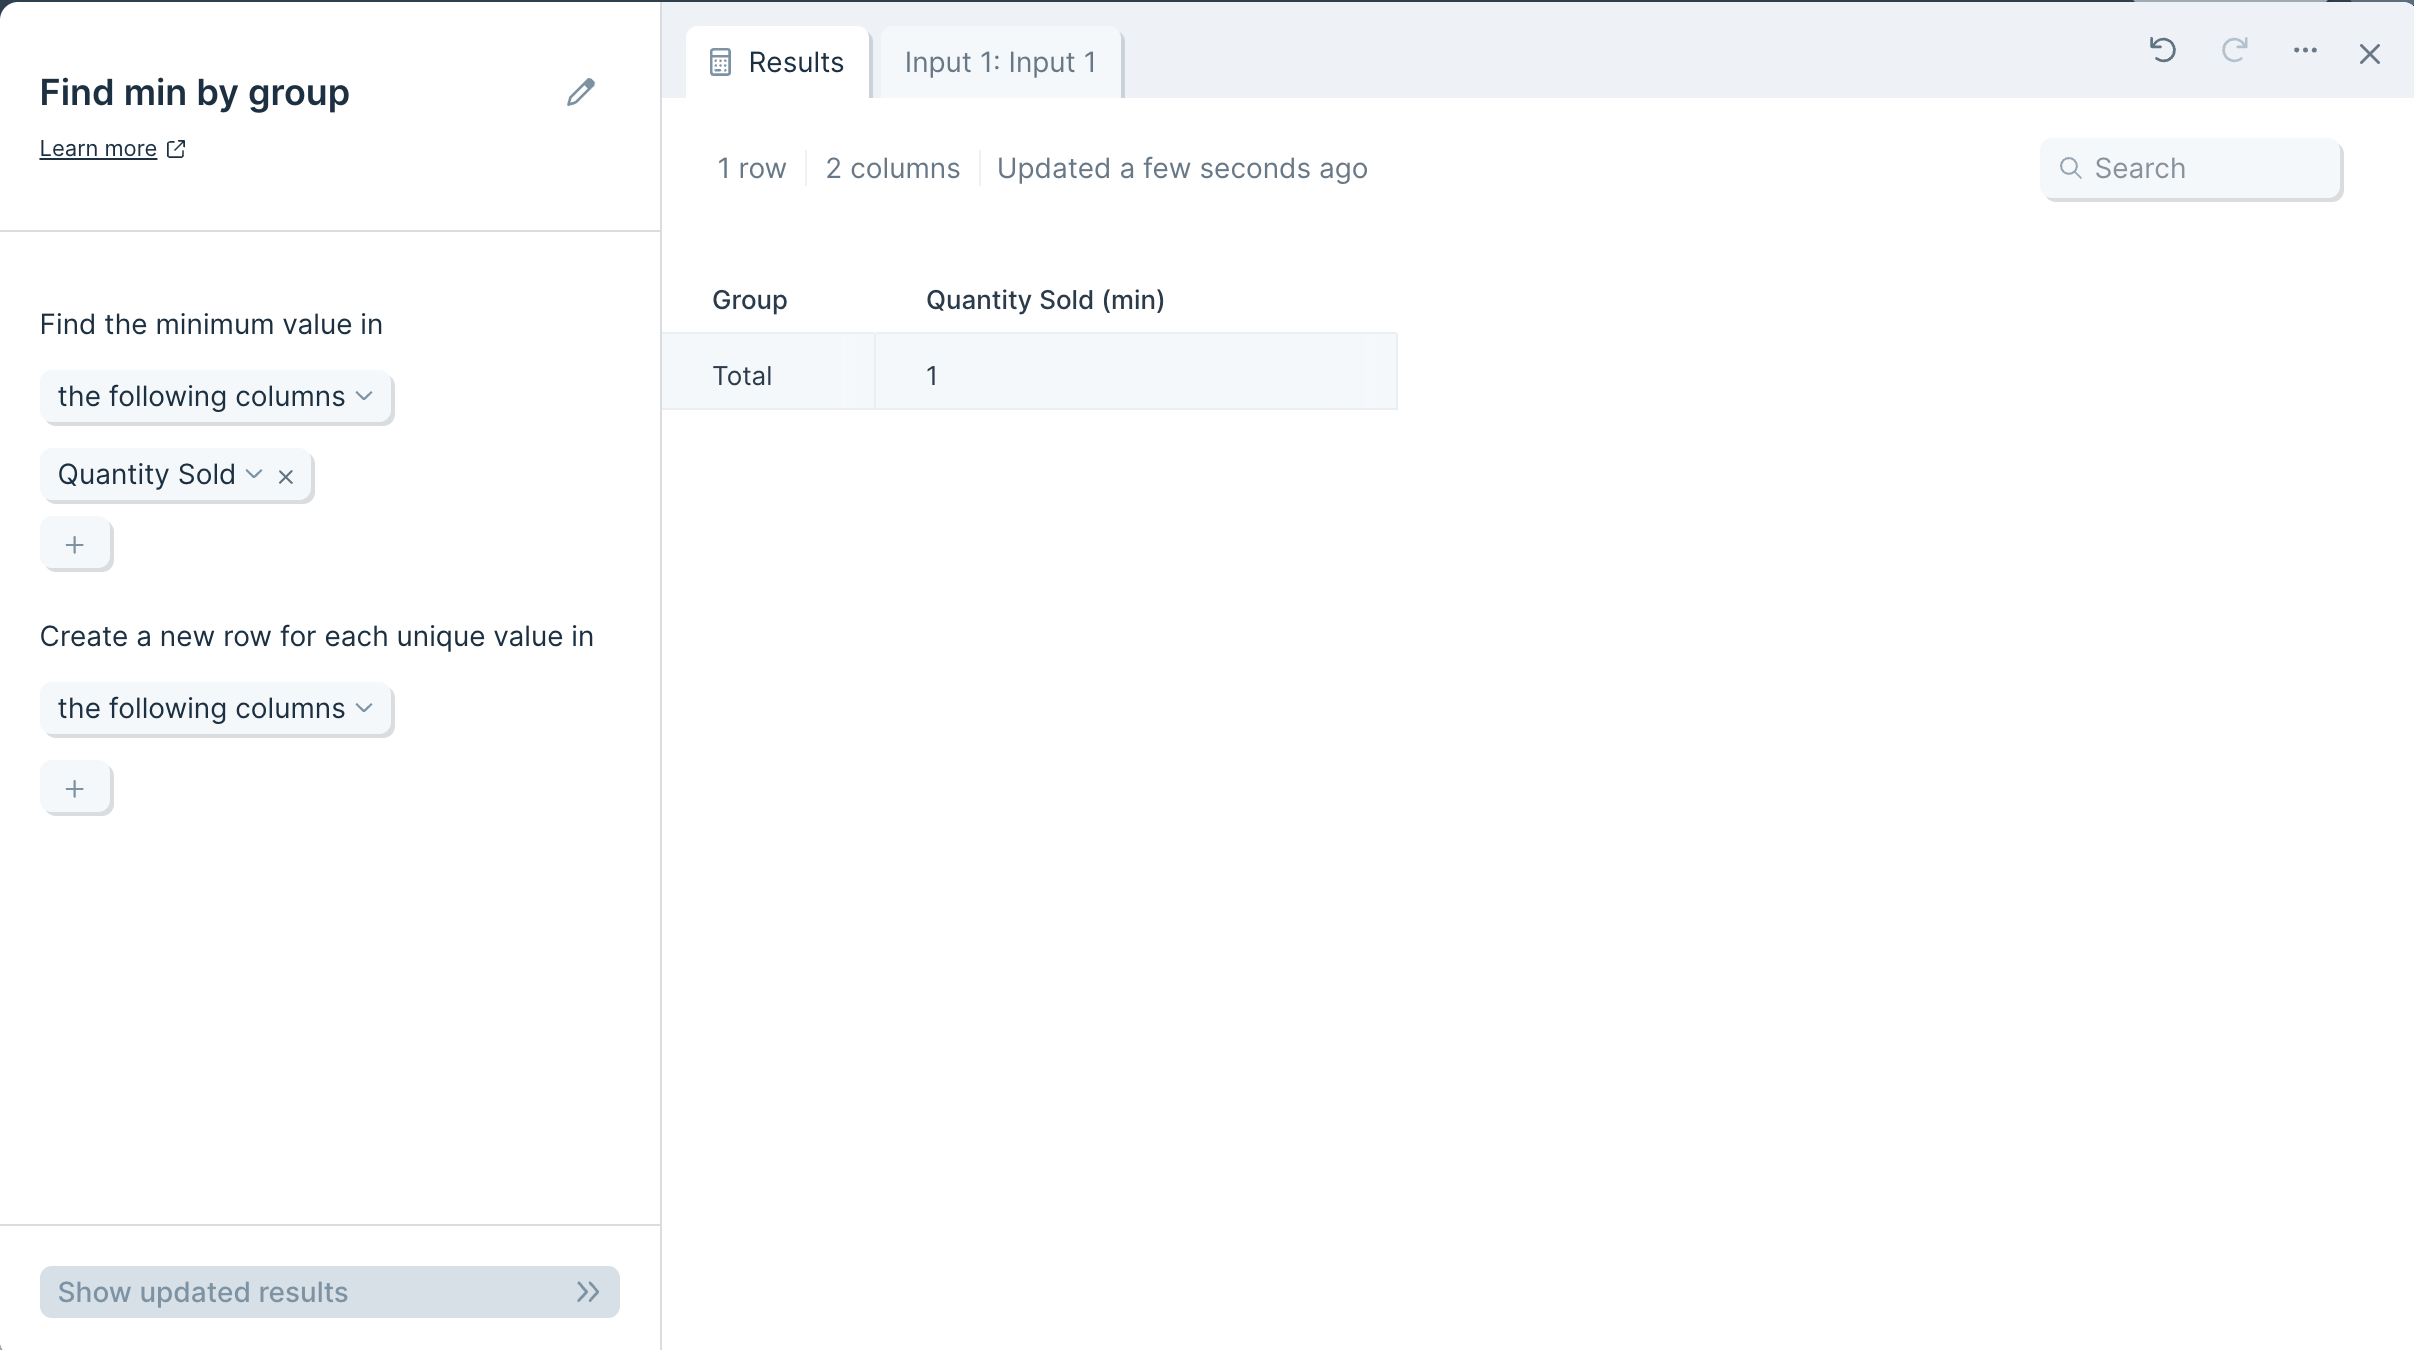
To find minimum values for multiple attributes, you can create a new row per unique value in a specific column or columns. As before, you can include or exclude given columns, and you can click the plus sign to specify.
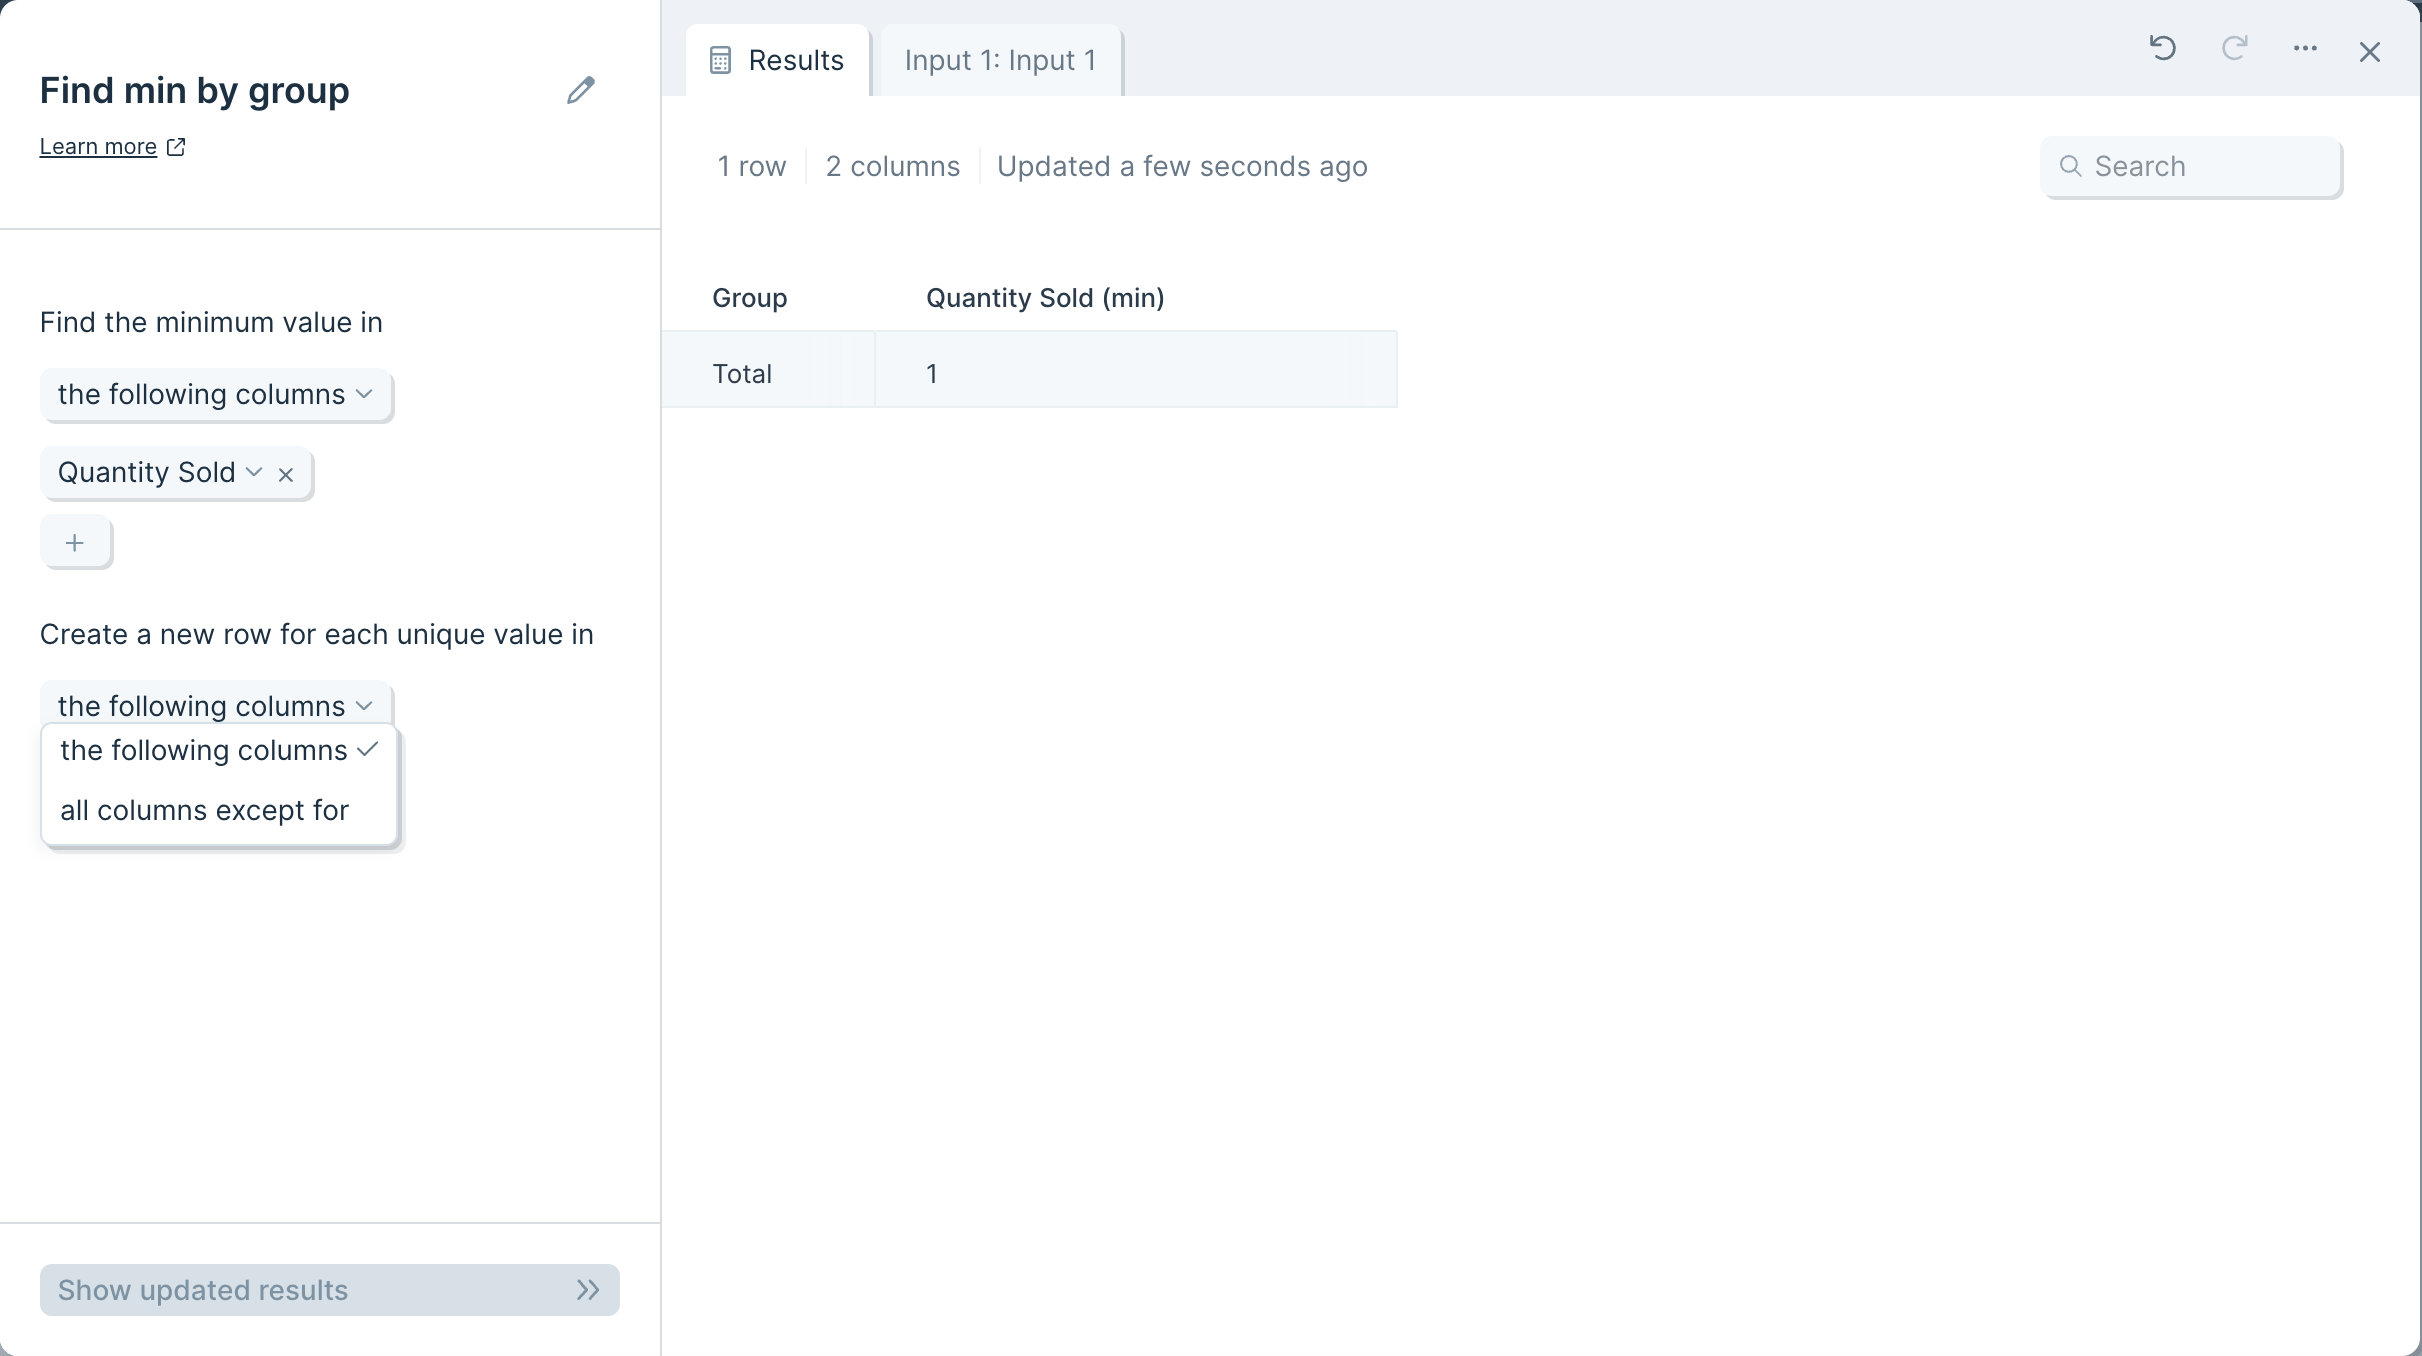
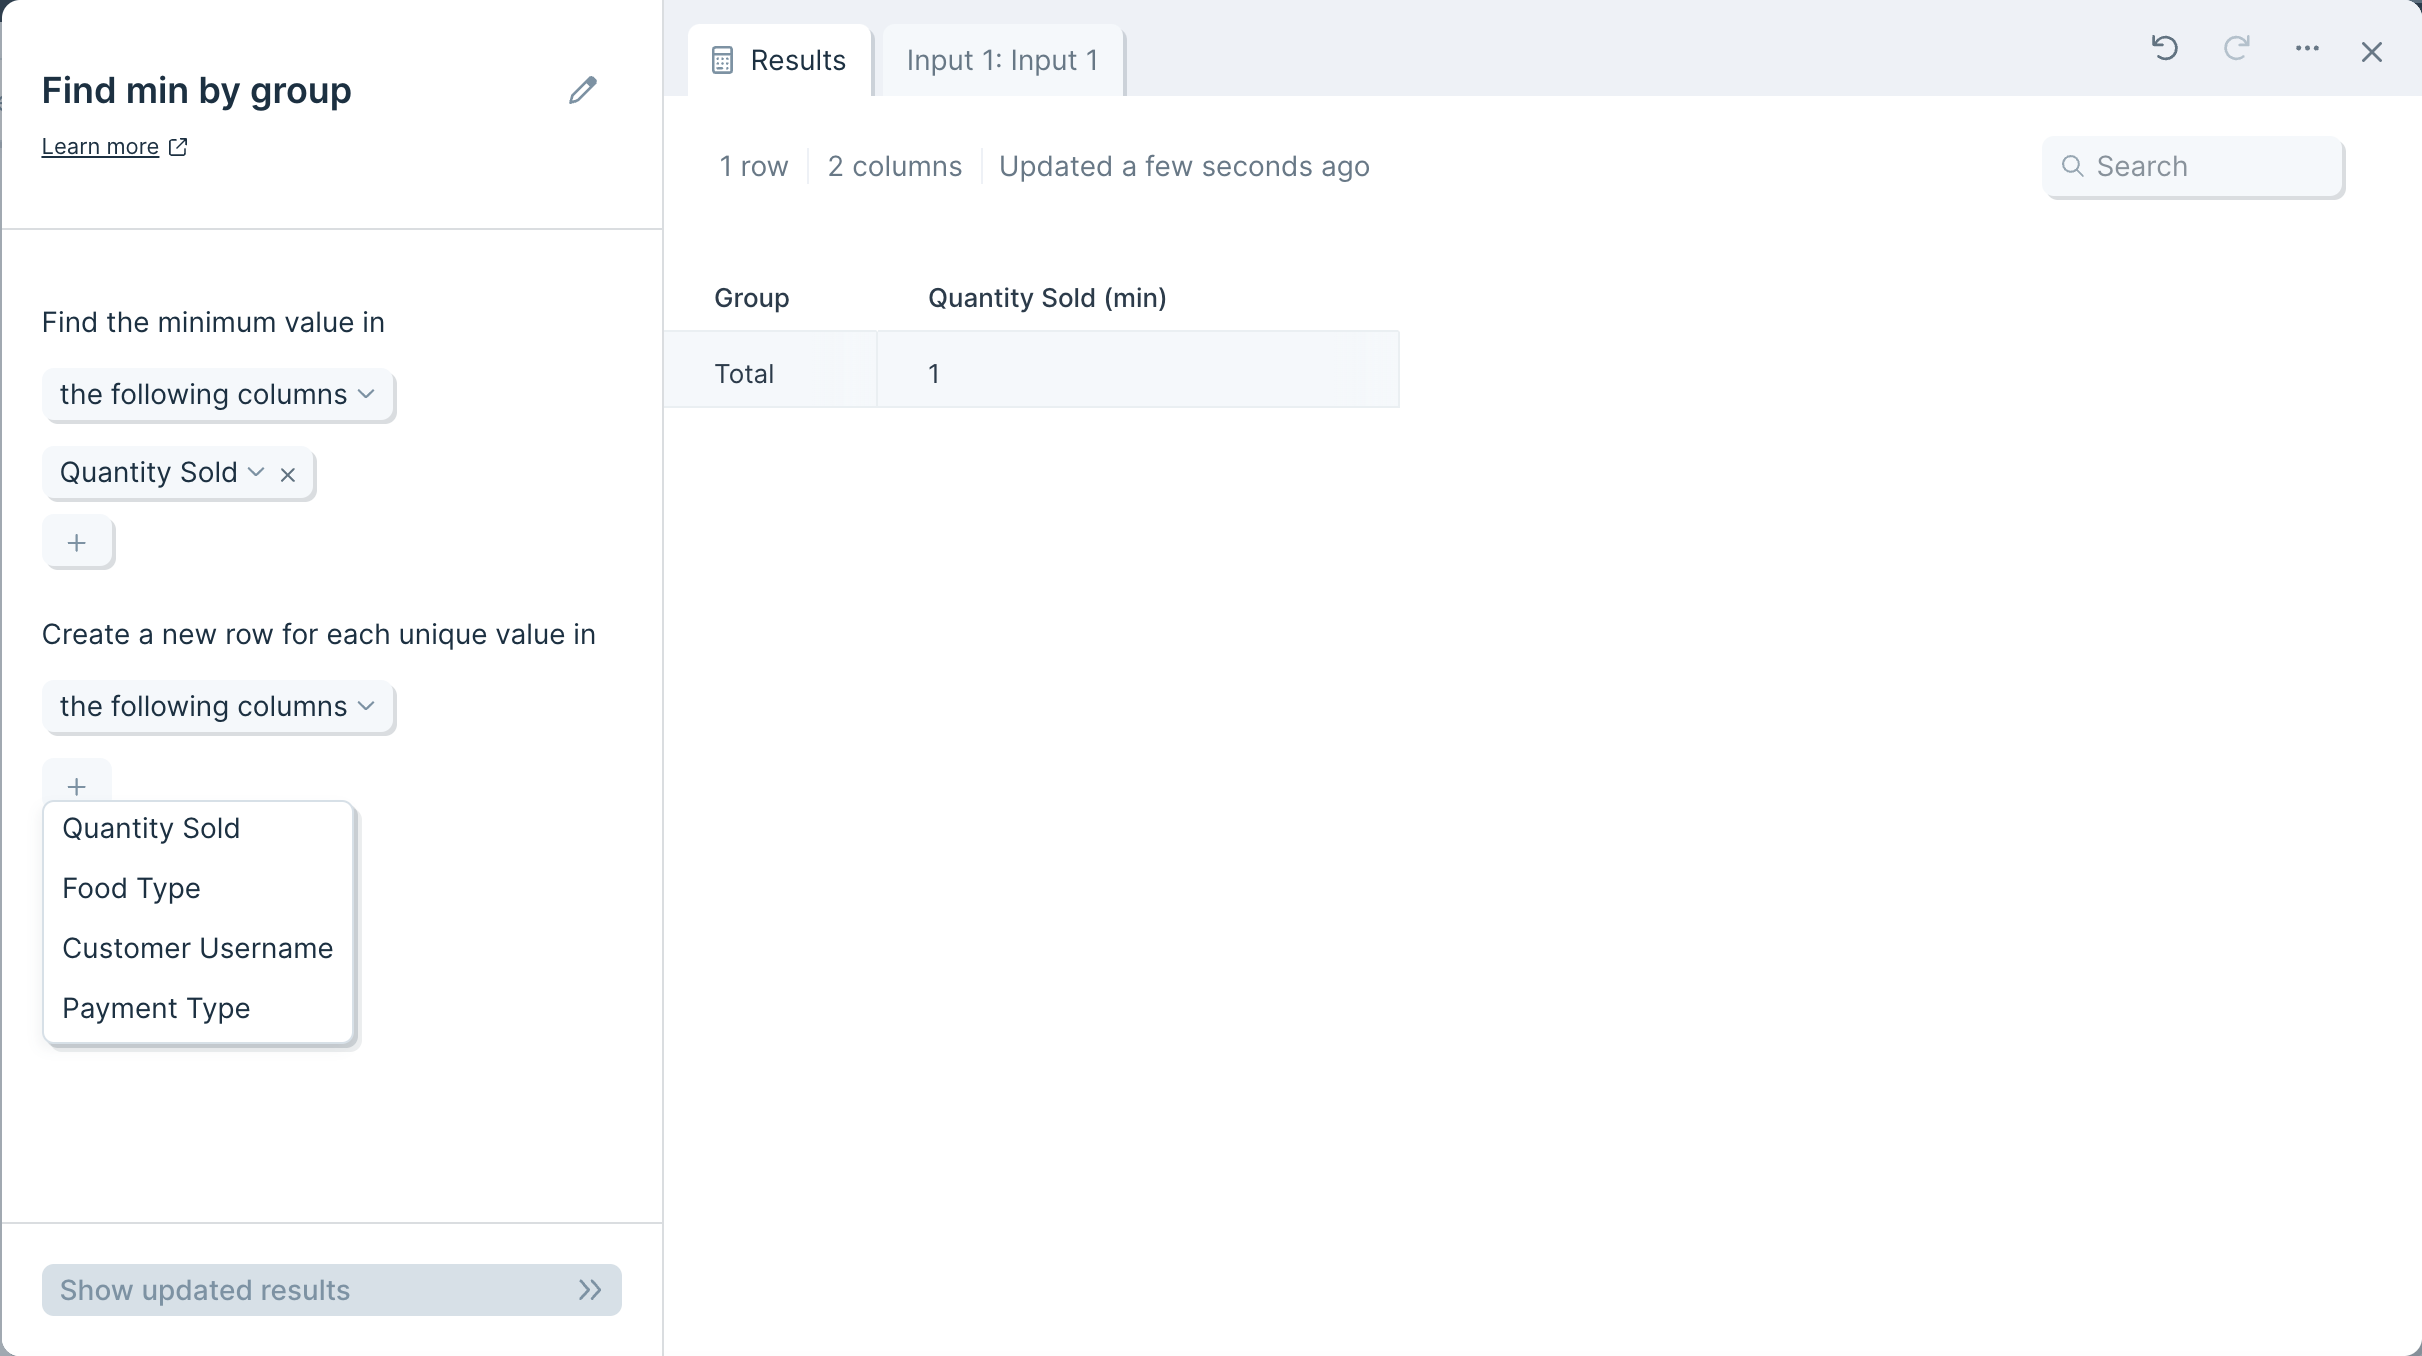
Unique value columns will add left to right, and sort A-Z, and your desired minimum value will display as a new column with '(min)' appended to its header.
Transform step:
Find overlap
The Find overlap step finds matching or non-matching rows between two tables.
Input/output
This step takes two tables as its input and shows you how they overlap. It will help you answer a question like, "Which rows from Table 1 do or do not exist in Table 2?"
Input 1
Table 1 shows products in our first store with three columns: 'Variant ID', 'Name', and 'Sales Price'.
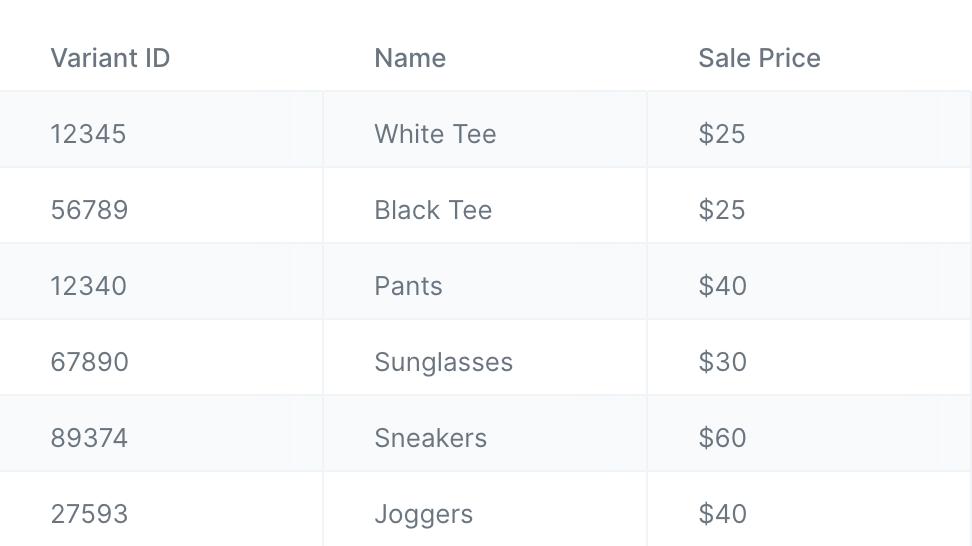
Input 2
Table 2 shows products in our second store with two columns: 'Variant ID' and 'Name'.
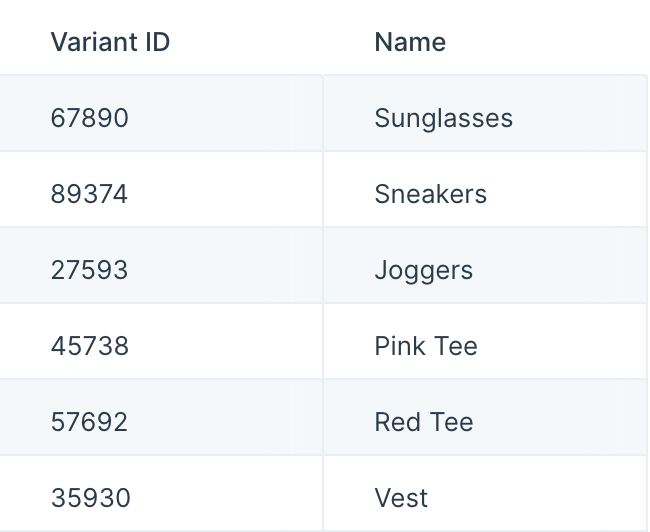
Output
Let's say we want to find which products from Store 1 are also sold in Store 2. The step will immediately tell us this as its output. Below we can see that there are three products sold in both stores. Since 'Store 1' was our primary table in the step, it's showing us the complete rows from that table.

Default settings
When you first connect your two inputs into this step, you'll see that your first input is treated as the primary table, and that rows have been matched by the lead column. By default, the step will keep rows where any of the rules are true.
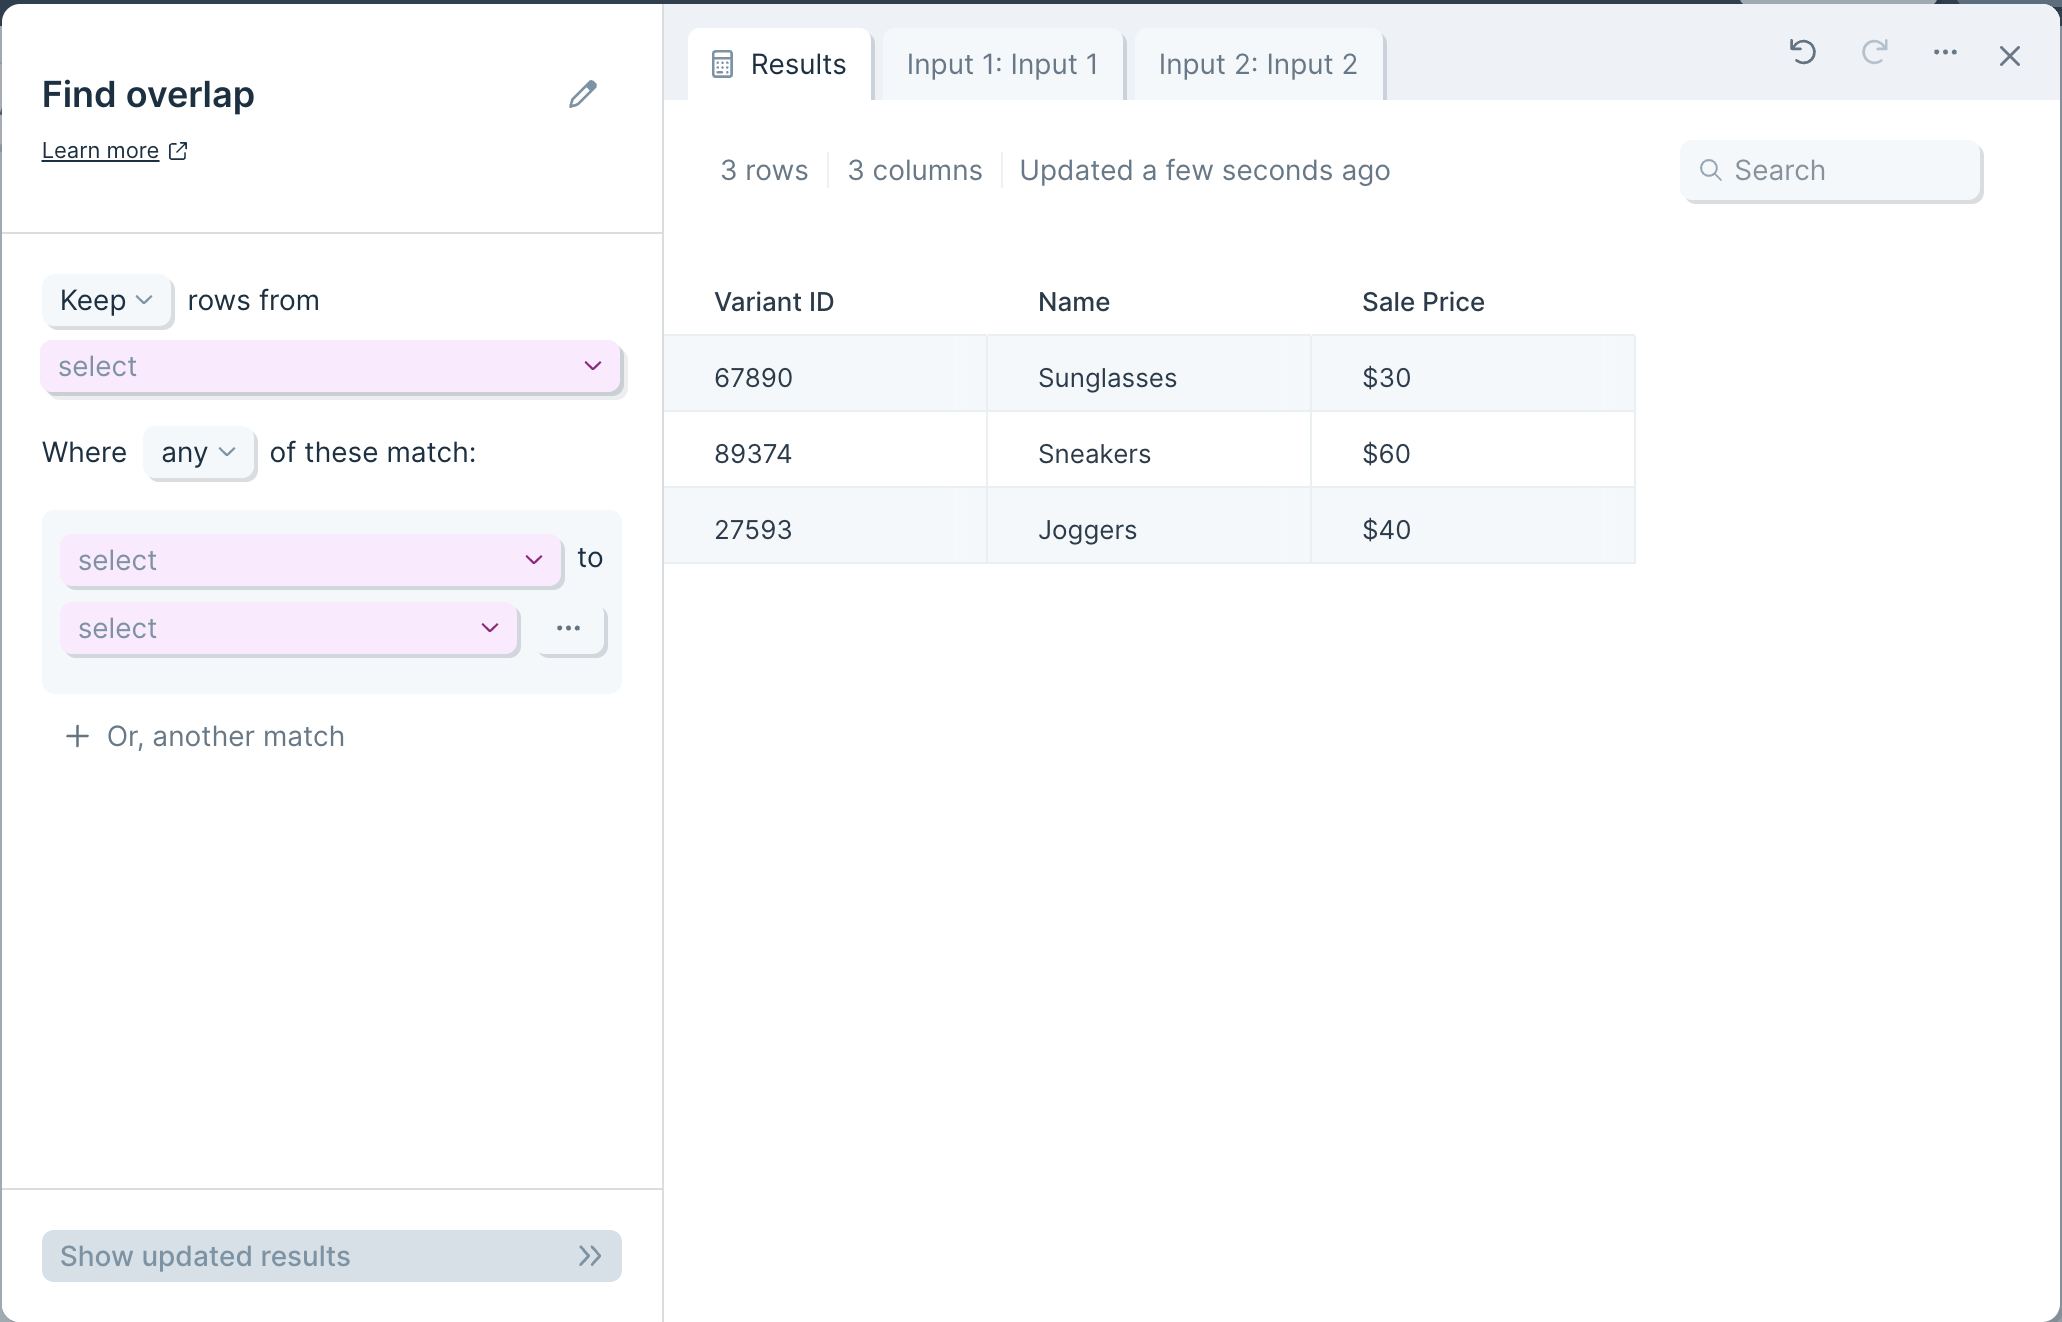
Custom settings
First, make sure the step is configured to use the correct primary table, in this case, 'Input 1'. Then, determine how the rules should be honored. If you are setting multiple rules, the step can be structured so that 'any' rule counts as a match or 'all' rules must be met to be considered a match.
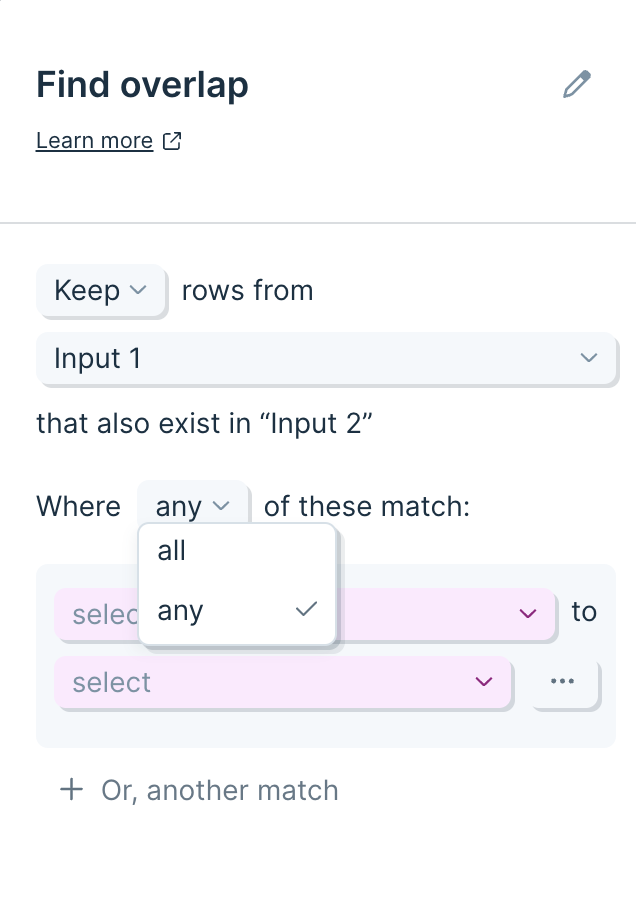
Now we're ready to configure the rules for how the step should identify matches. Each rule compares tables according to values in specified columns. First, select the relevant column from each table. Then, choose one of three options in the match type:

'Exact match' will look for an exact match, including casing. 'Match ignoring case' will allow for differences in capitalization. 'Approximate match' will look for a fuzzy match.
If you choose 'Approximate match', you can adjust the confidence percentage. The higher the percentage, the closer to an exact match this step will attempt to make. For comparison, 100% confidence is equivalent to searching for an exact match.
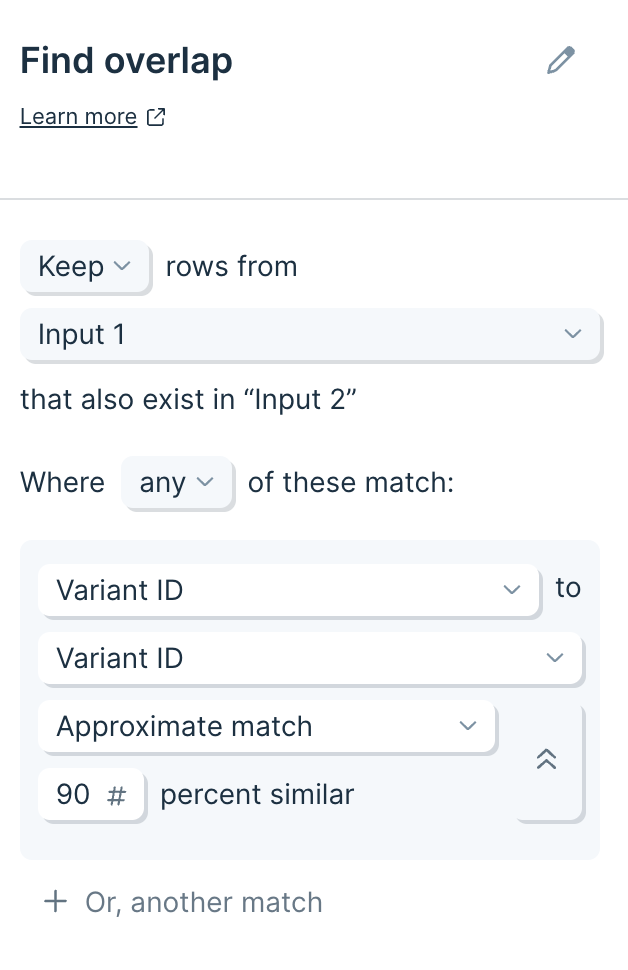
To add another rule, click '+ Or, another match' below your first rule.
Transform step:
Flip table
The Flip table step flips an entire table on its side, turning it 90 degrees. Imagine your column headers transform into rows. This step's functionality is similar to the TRANSPOSE function in Excel.
Input/output
The input table we'll use for this step has 3 rows and over 100 columns. Every column represents a different car in our inventory.

By using the Flip table step, we can turn the table 90 degrees to make the previously 3 rows our columns ("Make", "Model" and "Year") and have the 100+ columns become 100+ rows. This transformed table of 3 columns with 100+ rows makes our data a lot easier to understand.
Custom settings
This step doesn't require any additional configuration. Just connect a step containing data to this one and see your table immediately flipped 90 degrees.
Transform step:
Format dates
The Format dates step converts a column's date values into a new format. It's useful for standardizing date formats across various data sources' columns and making sorting by dates in ascending or descending order easier. This step can also convert between timezones and perform date rounding.
Select columns to reformat
First, select the columns that contain dates to format. Each rule card can be applied to any number of columns. The formats defined in the rule card will be used for all columns targeted by that rule.
Define the starting format
Use the first formatting menu to define the date format of the column(s) that you are targeting. Use a preset, build a custom format using the 'Insert element' dropdown within the format field, or click 'Auto-detect format' to use AI to find the correct starting format.
When creating a format, wrap any non-formatting character in single quotes. For example, '2024-01-01T10:30:59' should be represented as 'yyyy-M-d'T'H:m:s' with the 'T' character in single quotes. Punctuation does not need to be wrapped in single quotes, just letters or words that are not used to format.
If the format you have entered is valid, you will see an example date using that format below the formatting field.
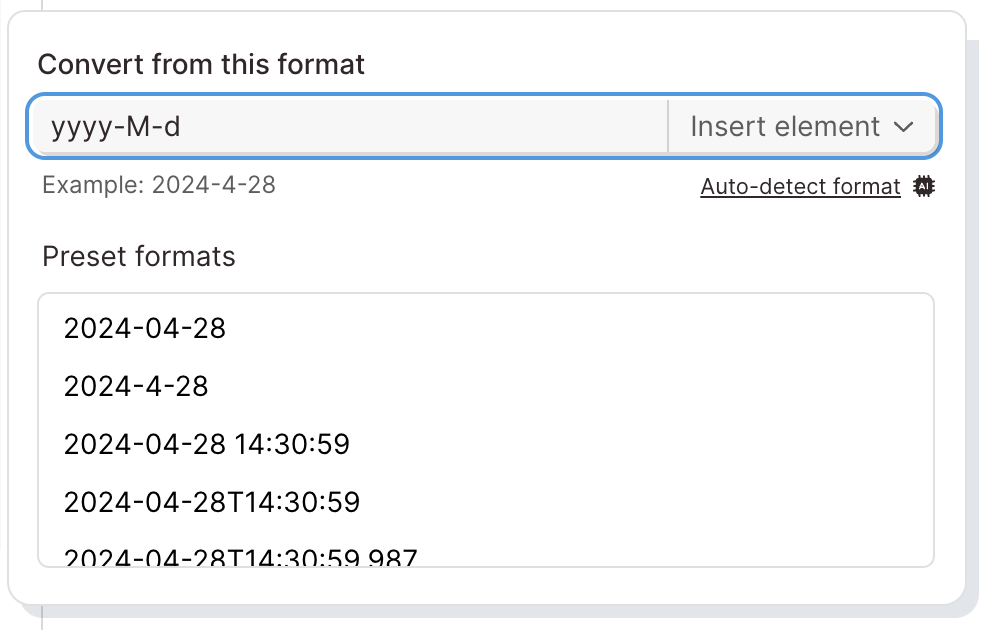
Define the new format
Use the second formatting menu to define the new date format to convert to. Use a preset or build a custom format using the 'Insert element' dropdown within the format field.
When creating a format, wrap any non-formatting character in single quotes. For example, '2024-01-01T10:30:59' should be represented as 'yyyy-M-d'T'H:m:s' with the 'T' character in single quotes. Punctuation does not need to be wrapped in single quotes, just letters or words that are not used to format.
If the format you have entered is valid, you will see an example date using that format below the formatting field.
Formatting Pattern Reference
Date and time formats are based on the pattern strings from Java DateTimeFormatter.
Timezone conversion
To the left of the format fields are icons that represent timezones. The default settings will not convert timezone. Use the timezone menus to define the starting timezone and the new timezone. If a timezone token is provided in the starting format, Parabola will read the timezone directly from the input dates.
Date rounding
Use the date rounding field to round the dates during the formatting process to a specific date-time precision. Use the menu to round to the start or the end of a year, month, week, day, hour, minute, or second.
When using the week option, use the additional field to define the starting day of the week.
Rounding examples:
Round to the end of the month
- Input: February 15, 2024
- Output: February 28, 2024
Round to the start of the week. Weeks start on Tuesday
- Input: Wednesday June 5, 2024
- Output: Tuesday June 4, 2024
Round to the end of the week. Weeks start on Thursday
- Input: Wednesday June 5, 2024
- Output: Wednesday June 5, 2024
Creating new columns
Each rule can either format the dates in their respective input columns, or create a new column for each new format to be placed in. Each column targeted by a rule can be formatting into a new separate column.
Failure settings
If an input date format cannot be formatted, use the failure settings to define what the step does.
- Fail the entire step run
- Keep the date in its original format (default)
- Convert the date to a blank
- Fallback to this value…
Columns with multiple formats
If you have a column with multiple formats in the same column, use multiple rule cards to target each format in that column. When taking this approach, be sure to keep your failure setting set to 'Keep the date in its original format'
Getting the week number
If want to get the week-of-the-year number for a date, Custom Transforms are able to calculate that
Transform step:
Format numbers
The Format numbers step reformats numbers across multiple columns in different styles. Use it to control numeric formatting options such as commas, currencies, rounding, and percentages.
You can watch this Parabola University video for a quick intro to the Format numbers step.
How to use the Format numbers step
- Choose the number columns you want to format
- Format these columns – Select specific columns to apply formatting to.
- Format all columns except – Select specific columns to exclude from formatting.
- Select a formatting option
- Choose from the dropdown list.
- Click the ellipses
...to customize options such as comma grouping, number of decimal places, and rounding. - Check the Invert number (+/-) box to switch positive numbers to negative and vice versa.
- Add multiple formatting rules
- Click Add Format Rule to create more than one rule within the same step.
- Rules apply in top-down order.
Formatting options
Numbers
Use Numbers formatting to remove symbols and standardize values.
Example: $4000 becomes 4000.
Settings:
- Comma grouping – Choose whether to add commas every thousand.
- Decimals – Set the number of decimal places to display.
- Rounding – Round to the nearest value, round down, or round up.
Percents
Settings:
- Comma grouping – Add commas every thousand if needed.
- Decimals – Set the number of decimal places to display.
- Rounding – Round to the nearest value, round down, or round up.
Currency
Settings:
- Currency – Choose Dollars ($), Euros (€), Indian Rupees (₹), Pounds (£), or Yen (¥).
- Decimals – Set the number of decimal places to display.
- Rounding – Round to the nearest value, round down, or round up.
Accounting
Settings:
- Currency – Choose Dollars ($), Euros (€), Indian Rupees (₹), Pounds (£), or Yen (¥).
- Decimals – Set the number of decimal places to display.
- Rounding – Round to the nearest value, round down, or round up.
Key difference:
- Currency – Displays negative numbers with a minus sign (e.g.,
-5.00). - Accounting – Displays negative numbers in parentheses (e.g.,
($5.00)).
Special handling for accounting formats
If your data is already in accounting format, you must first remove the parentheses before applying new formatting. Parentheses cause the value to be read as a string, which can result in incorrect outputs (e.g., replacing with 0).
- Add a Find/Replace step:
- Rule 1: Find
(in any part of the cell → Replace with-in that part of the cell. - Rule 2: Find
)in any part of the cell → Replace with a blank.
- Rule 1: Find
- After running these replacements:
($7.00)becomes-$7.00.
To format numbers further, connect a Format Numbers step and apply the desired settings.
Transform step:
Limit rows
The Limit rows step filters data by keeping or removing a certain number of rows in your dataset. You can keep or remove a certain number of rows from the top, bottom, or a random position in your dataset.
Input/output
In our input data below, we have 100 rows of data.
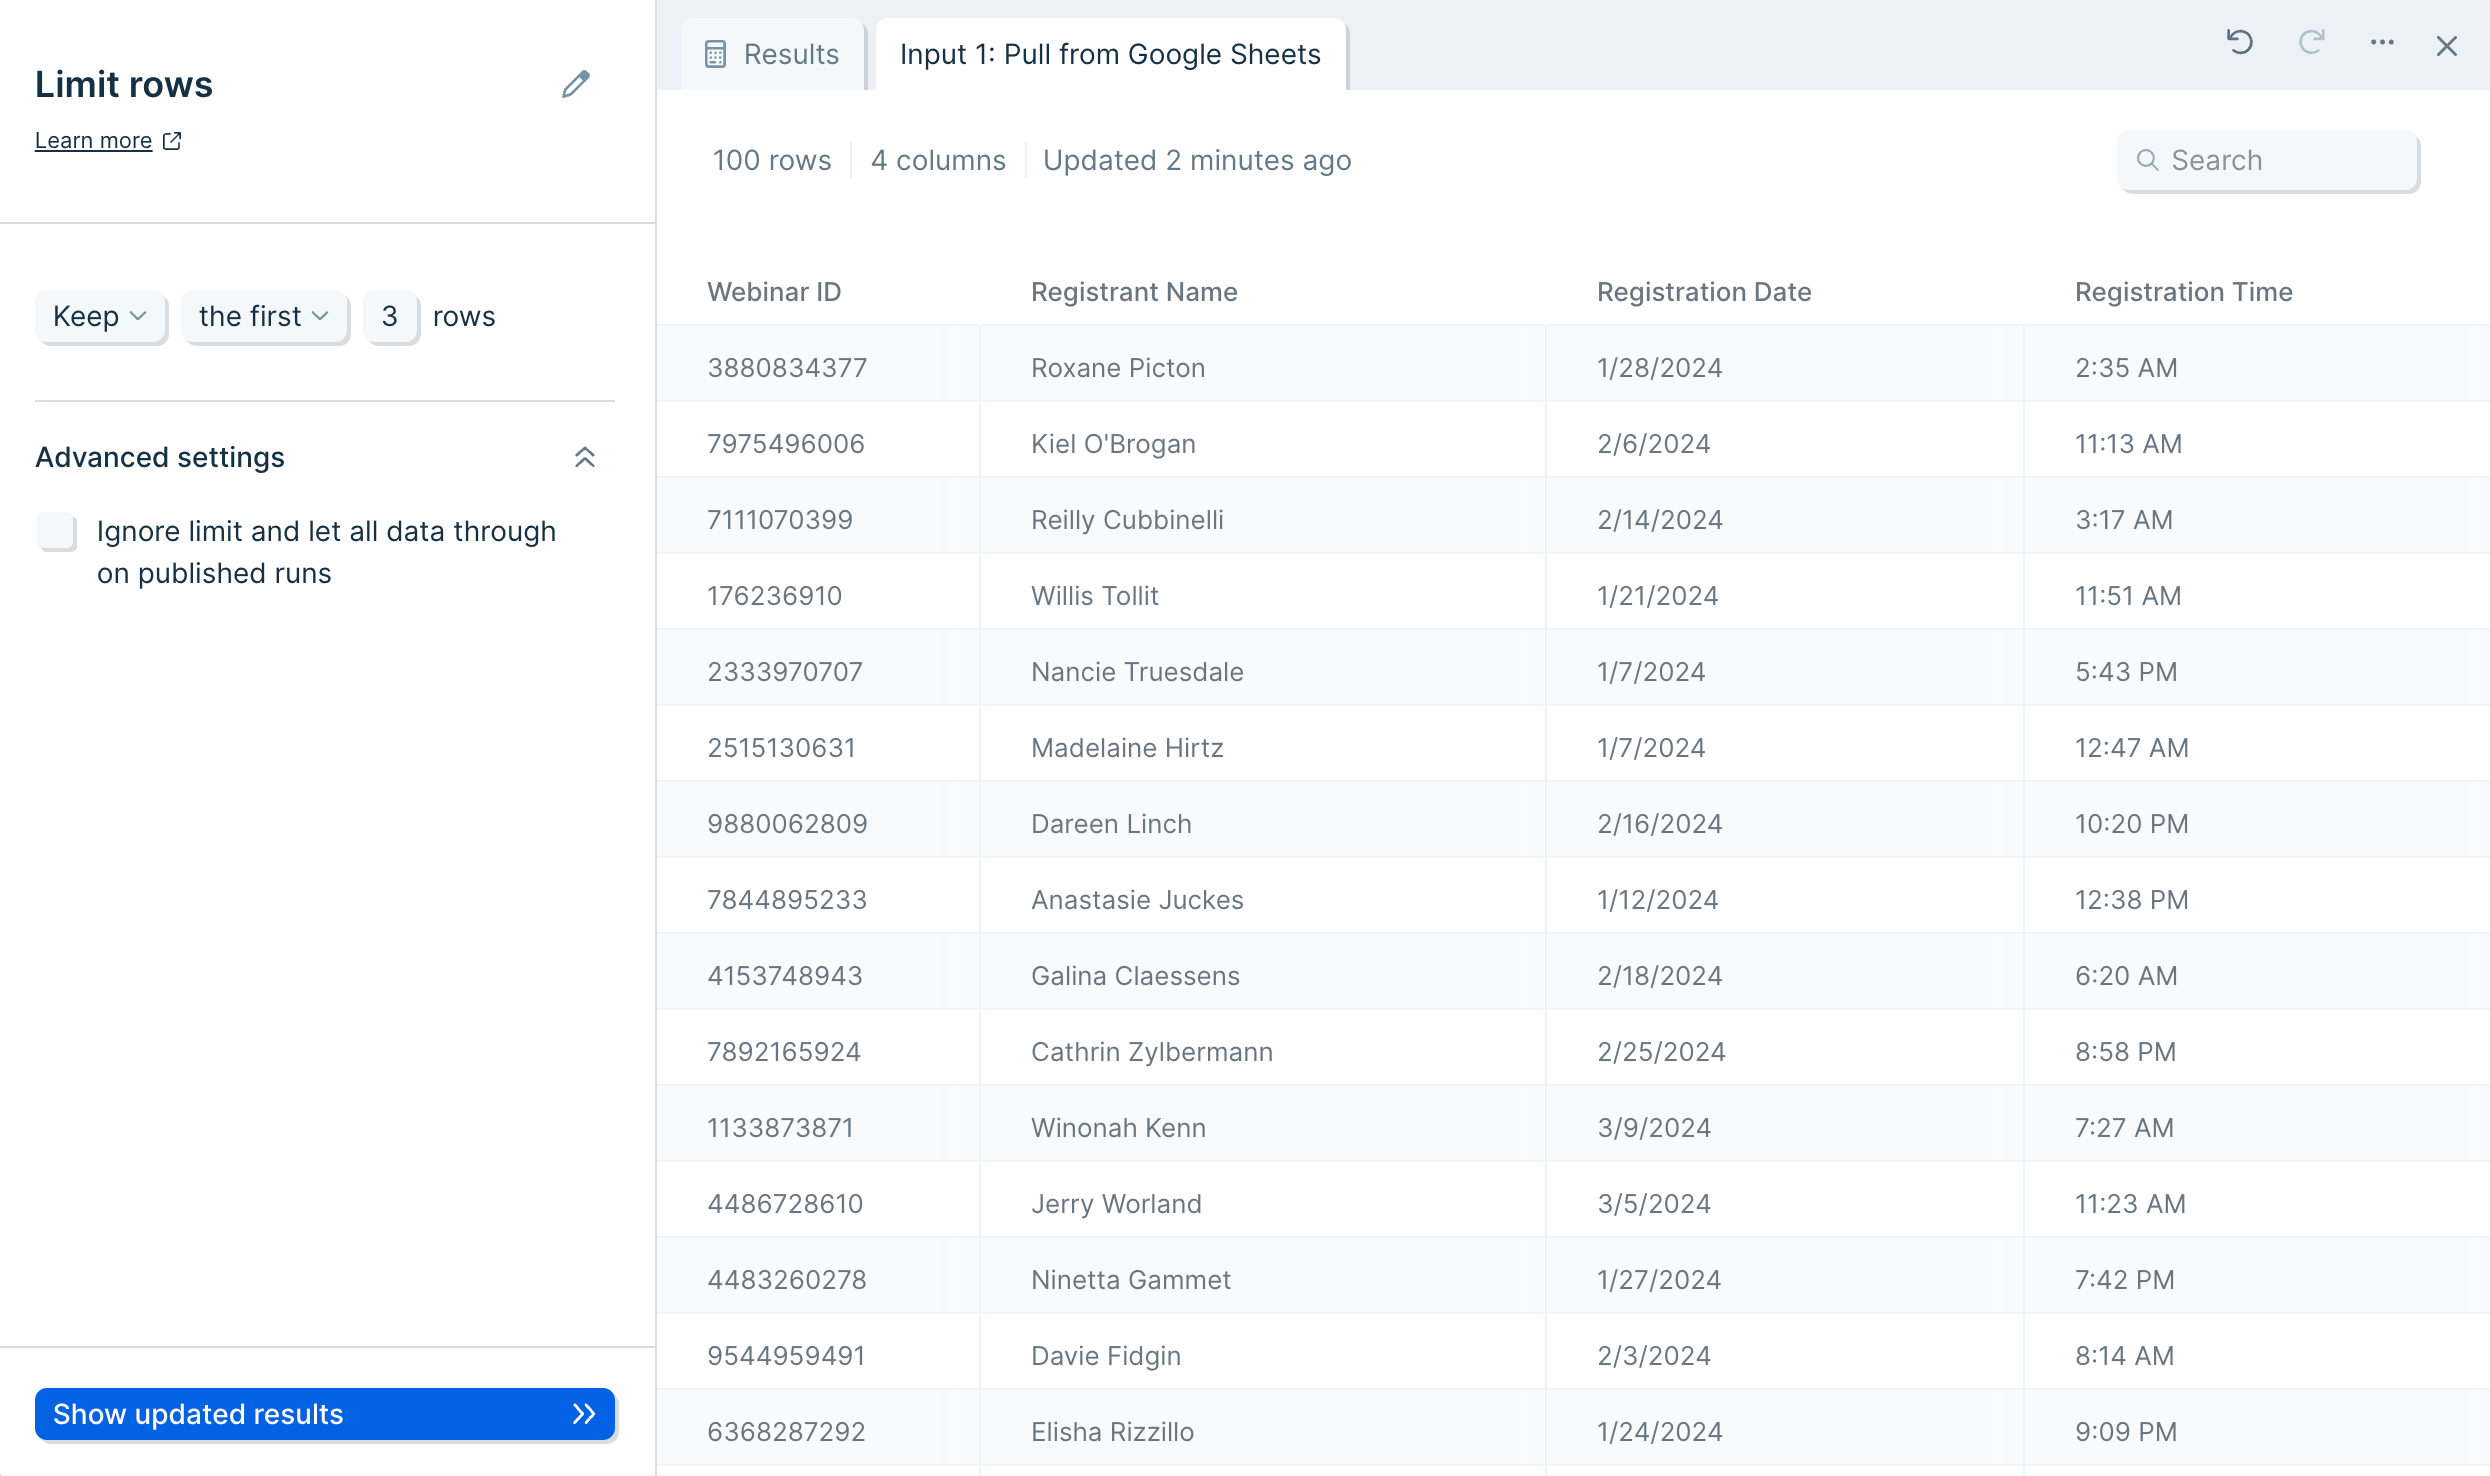
By using the Limit rows step, we can easily filter the number of rows to keep the top 10 rows out of 100, as seen in our output data below.
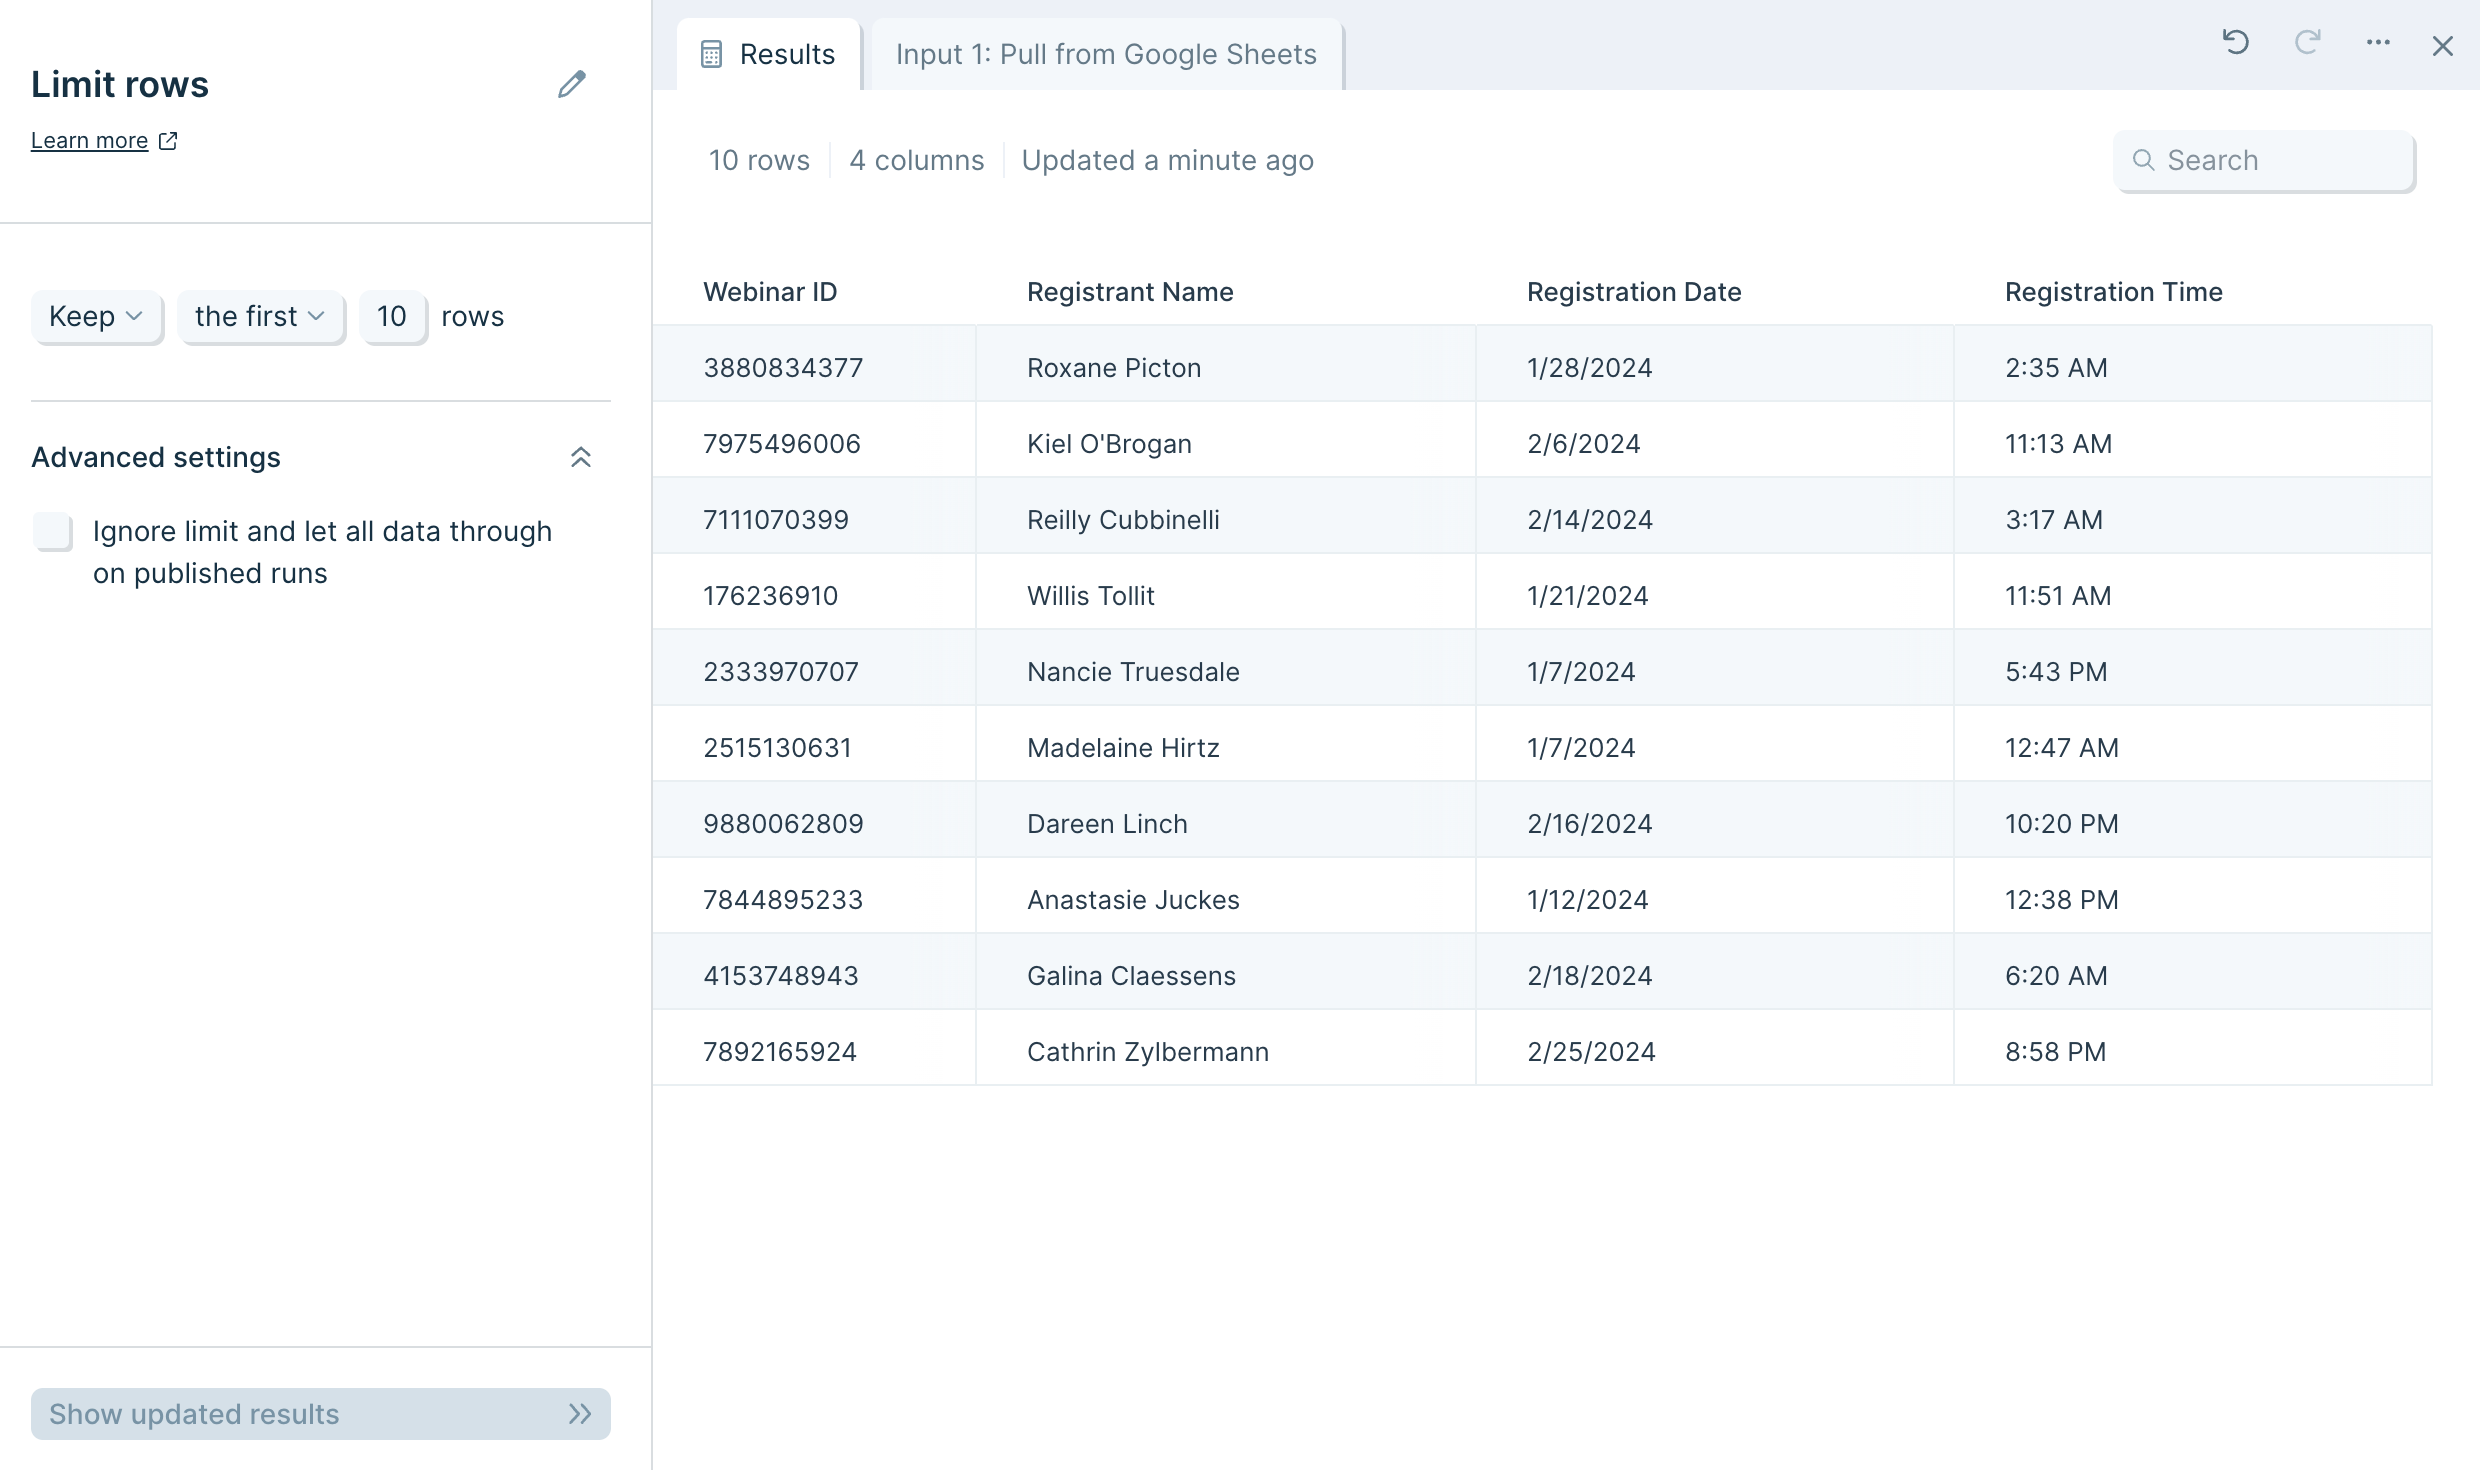
Default settings
By default, this step is set to Keep the first 3 rows of data and apply that limit on published runs.

Custom settings
You have the option to switch the "Keep" selection to "Remove" instead. You may also select other options in the "first" dropdown by switching this to the "last" or a "random" set of rows. Lastly, you can change the number of rows to limit your dataset to by clicking on the "3" and typing in your desired amount.
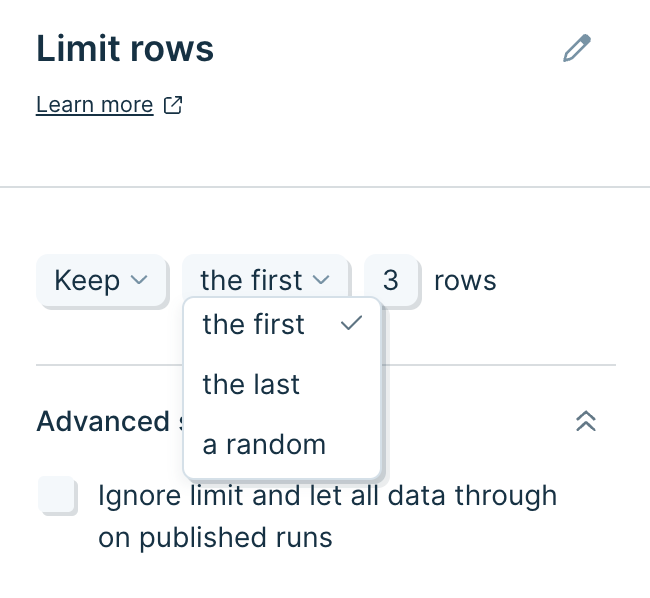
Ignoring the limit set during published runs
Use this setting to only limit rows while you are building in a draft of your Flow. After publishing, any run (scheduled runs, manual runs, email/webhook runs) will ignore the limit imposed by this step and all rows will pass through it.
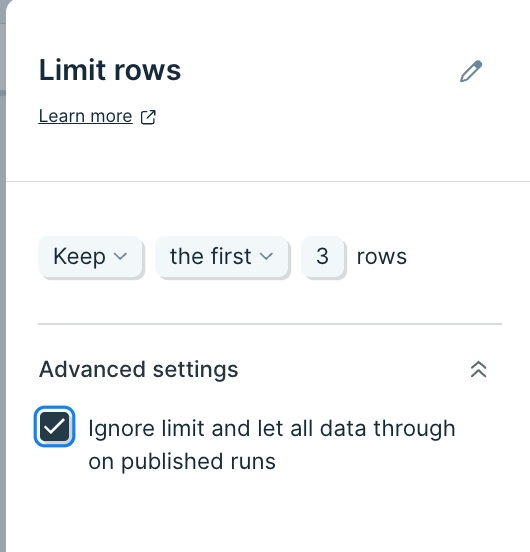
Transform step:
Look up rows
The look up rows step locates the index of the column that the value is in and appends it to a new column. This step is useful for creating connections between different data locations in a table. You can annotate where certain data is, and link it to a new column.
Input/output
Our input data is a table of daily webinar attendance for a week.

Let's try to find which day of the week is the first time we experience a maximum webinar capacity. In this case, our max webinar capacity is 25 attendees. By using the look up rows step, we can create a new column called "Max capacity hit" that shows which day of the week we first experience 25 attendees.
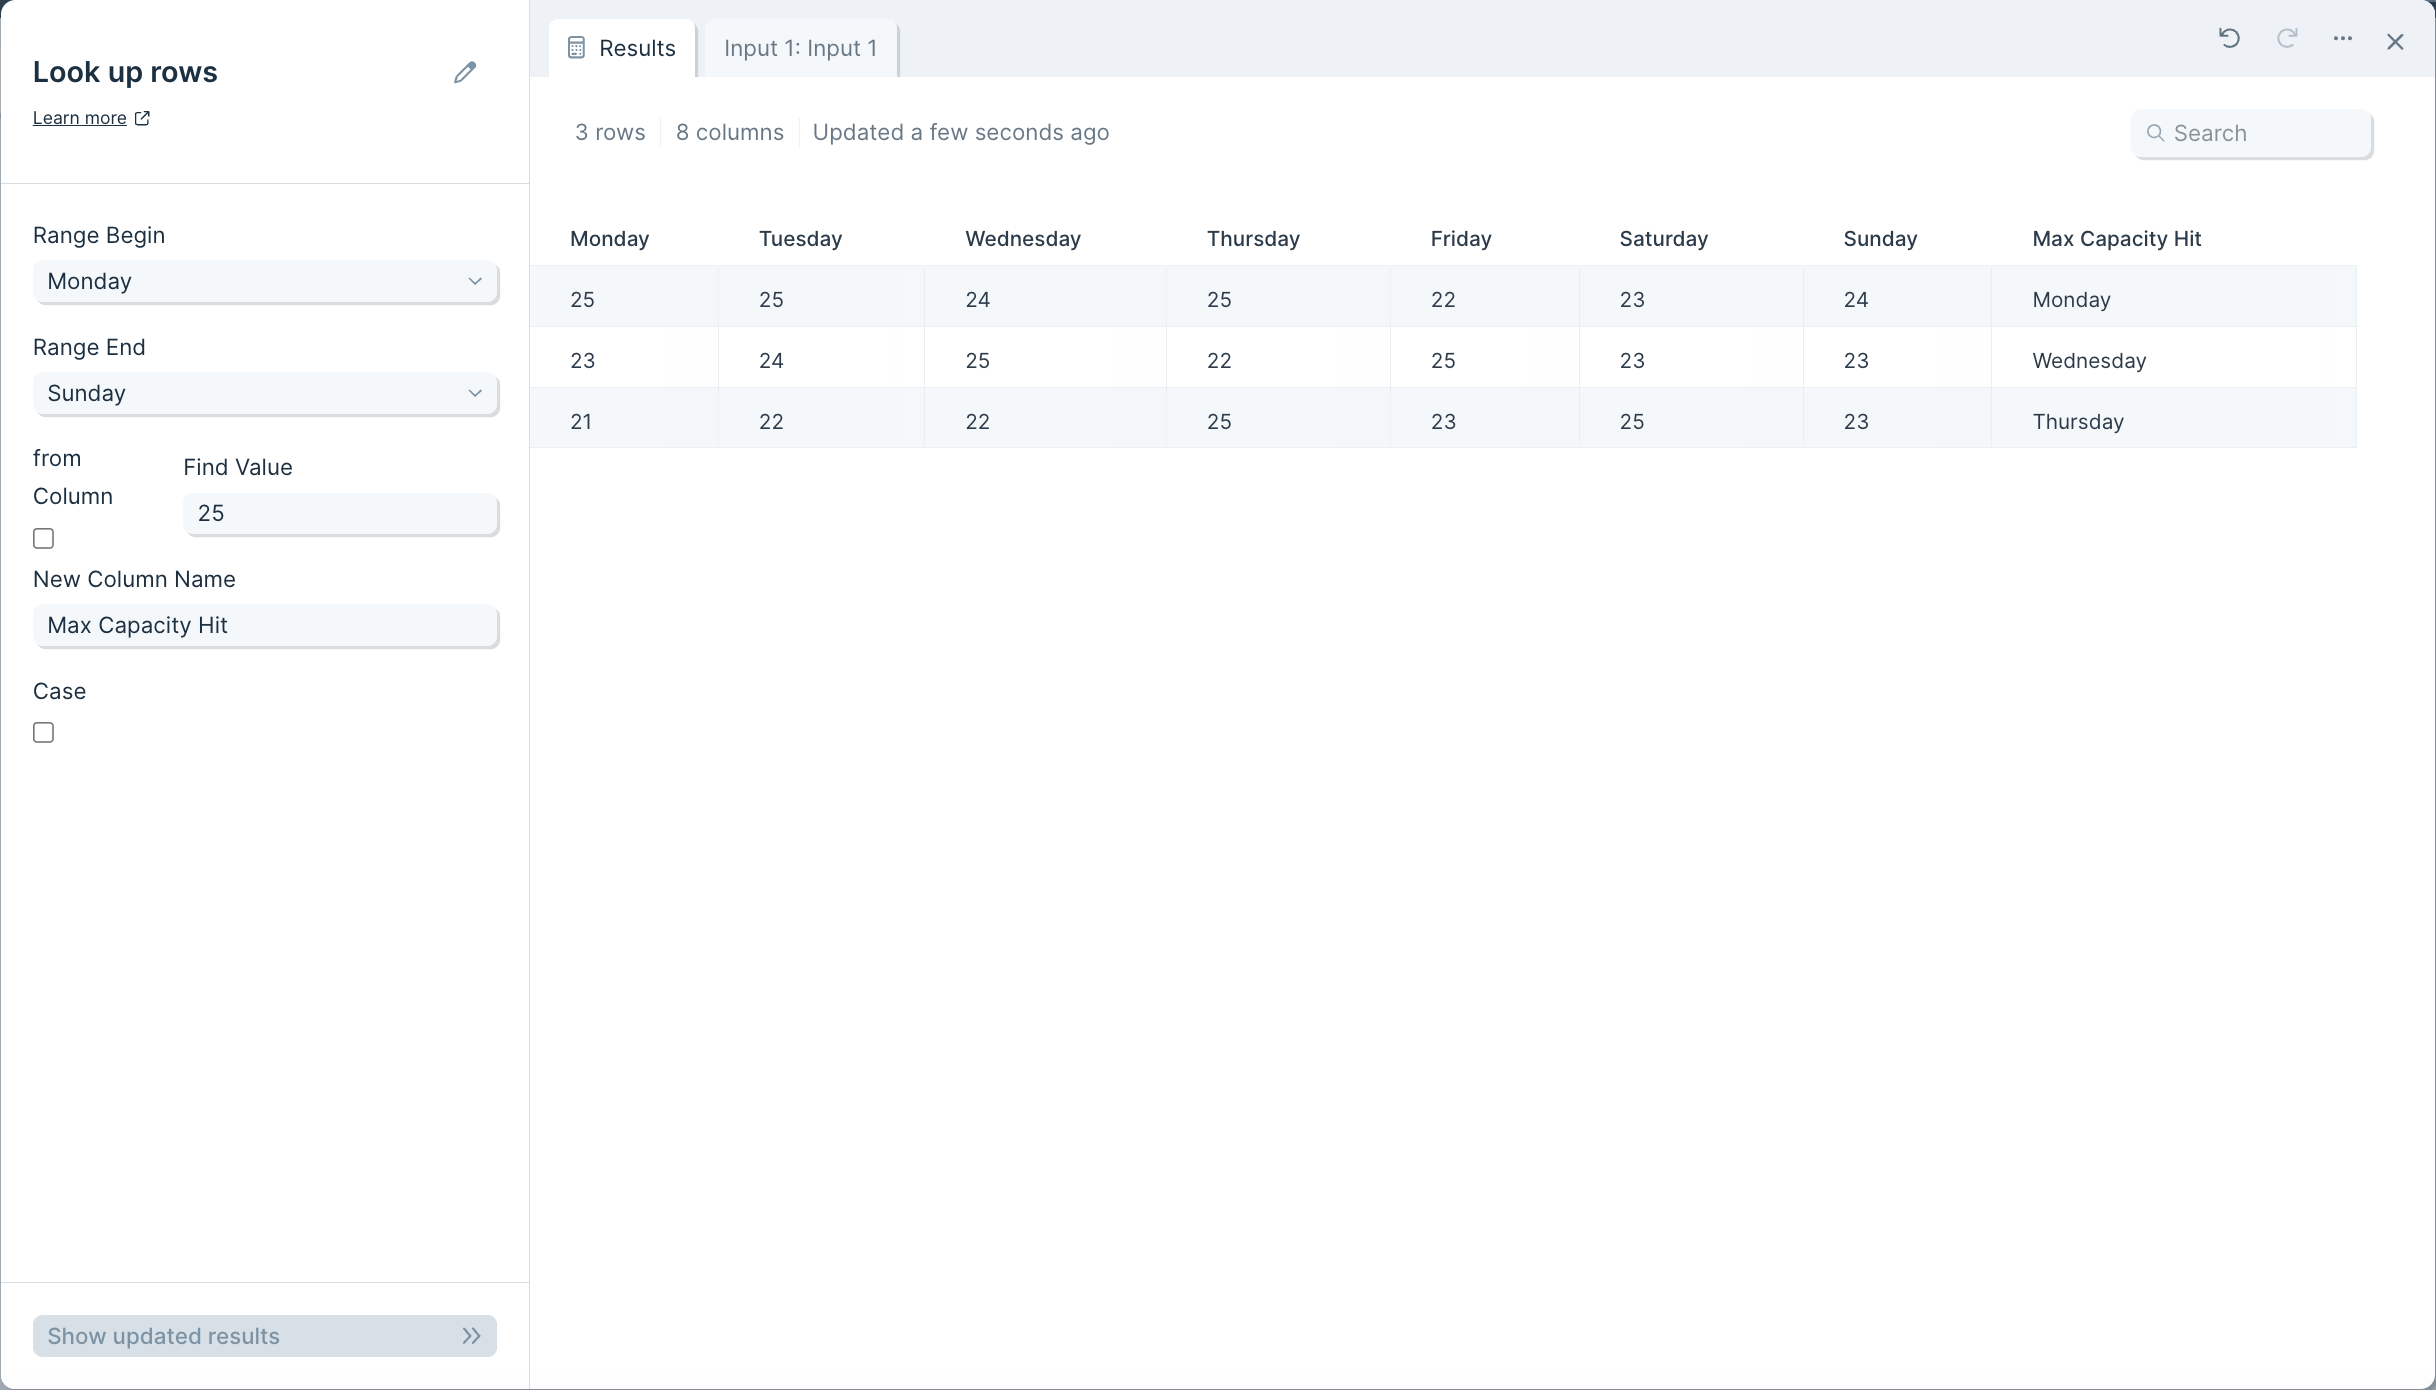
Custom settings
To set up this step, start by noting the range of columns it should look within. Select a column from the Range Begin dropdown and select another column from the Range End dropdown.
Next, in the field Find Value type in the one it should search for within our selected range. You can also check the box "from Column" if you'd like the step to look for a value contained in a specific column within this noted range. Checking off the box "from Column" will convert the Find Value field into a dropdown of column options.
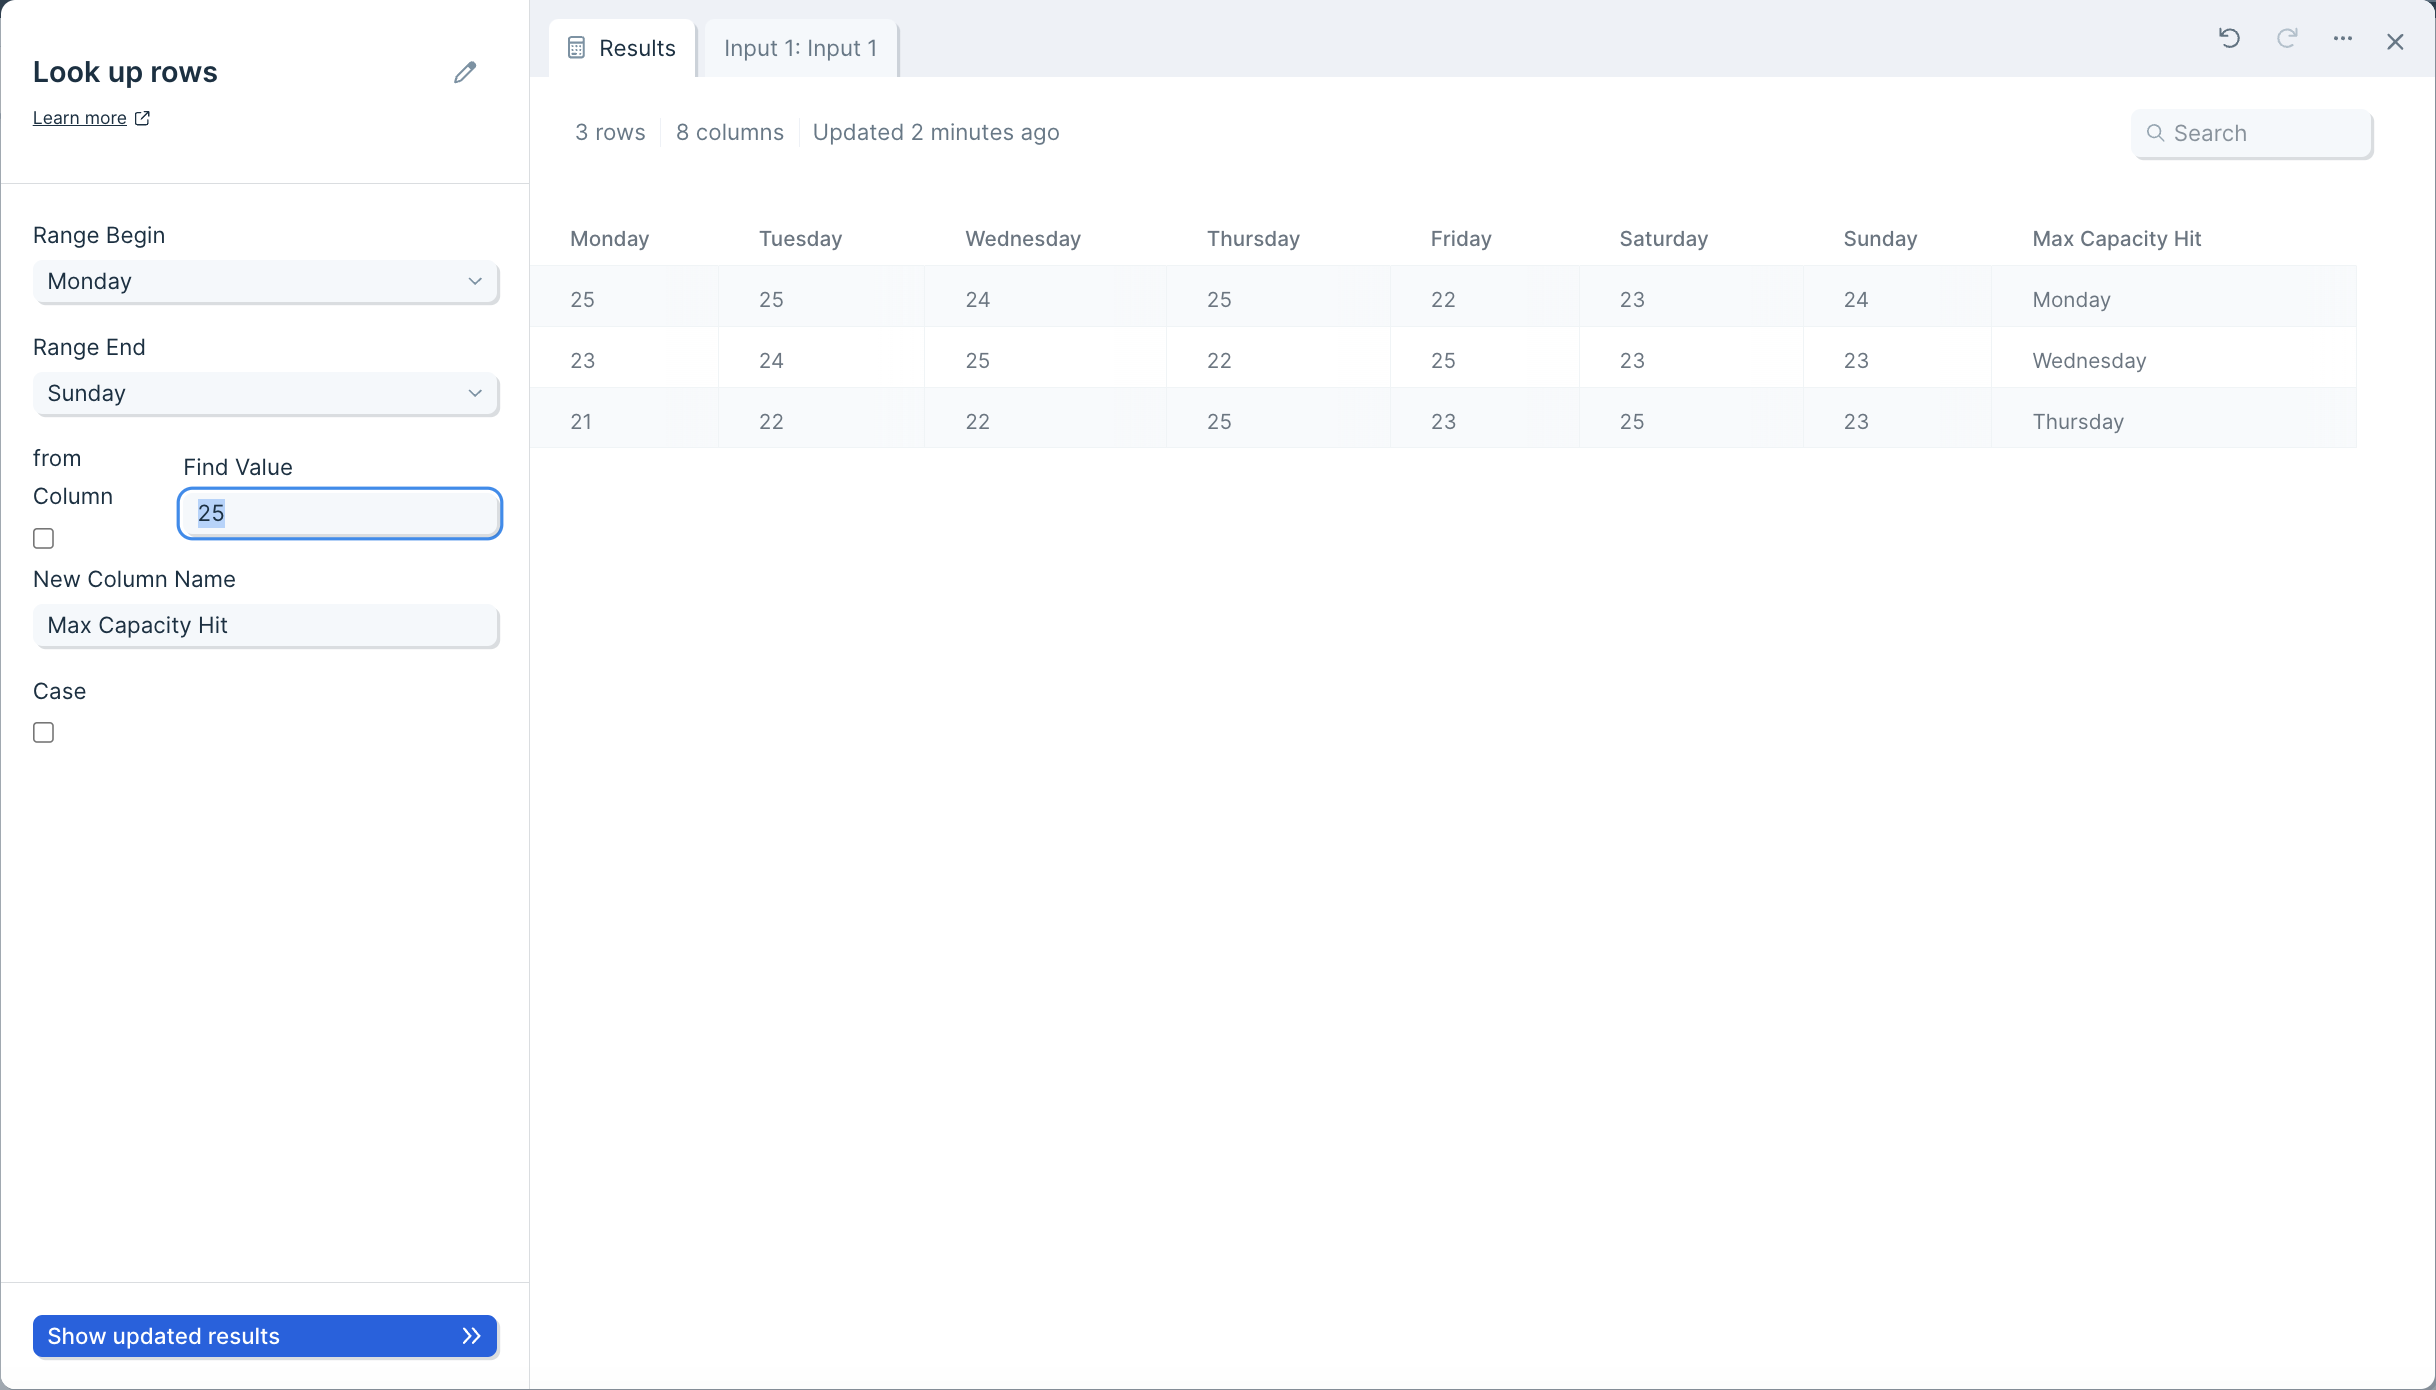
In the New Column Name field, enter the name you'd like this new column to be called.
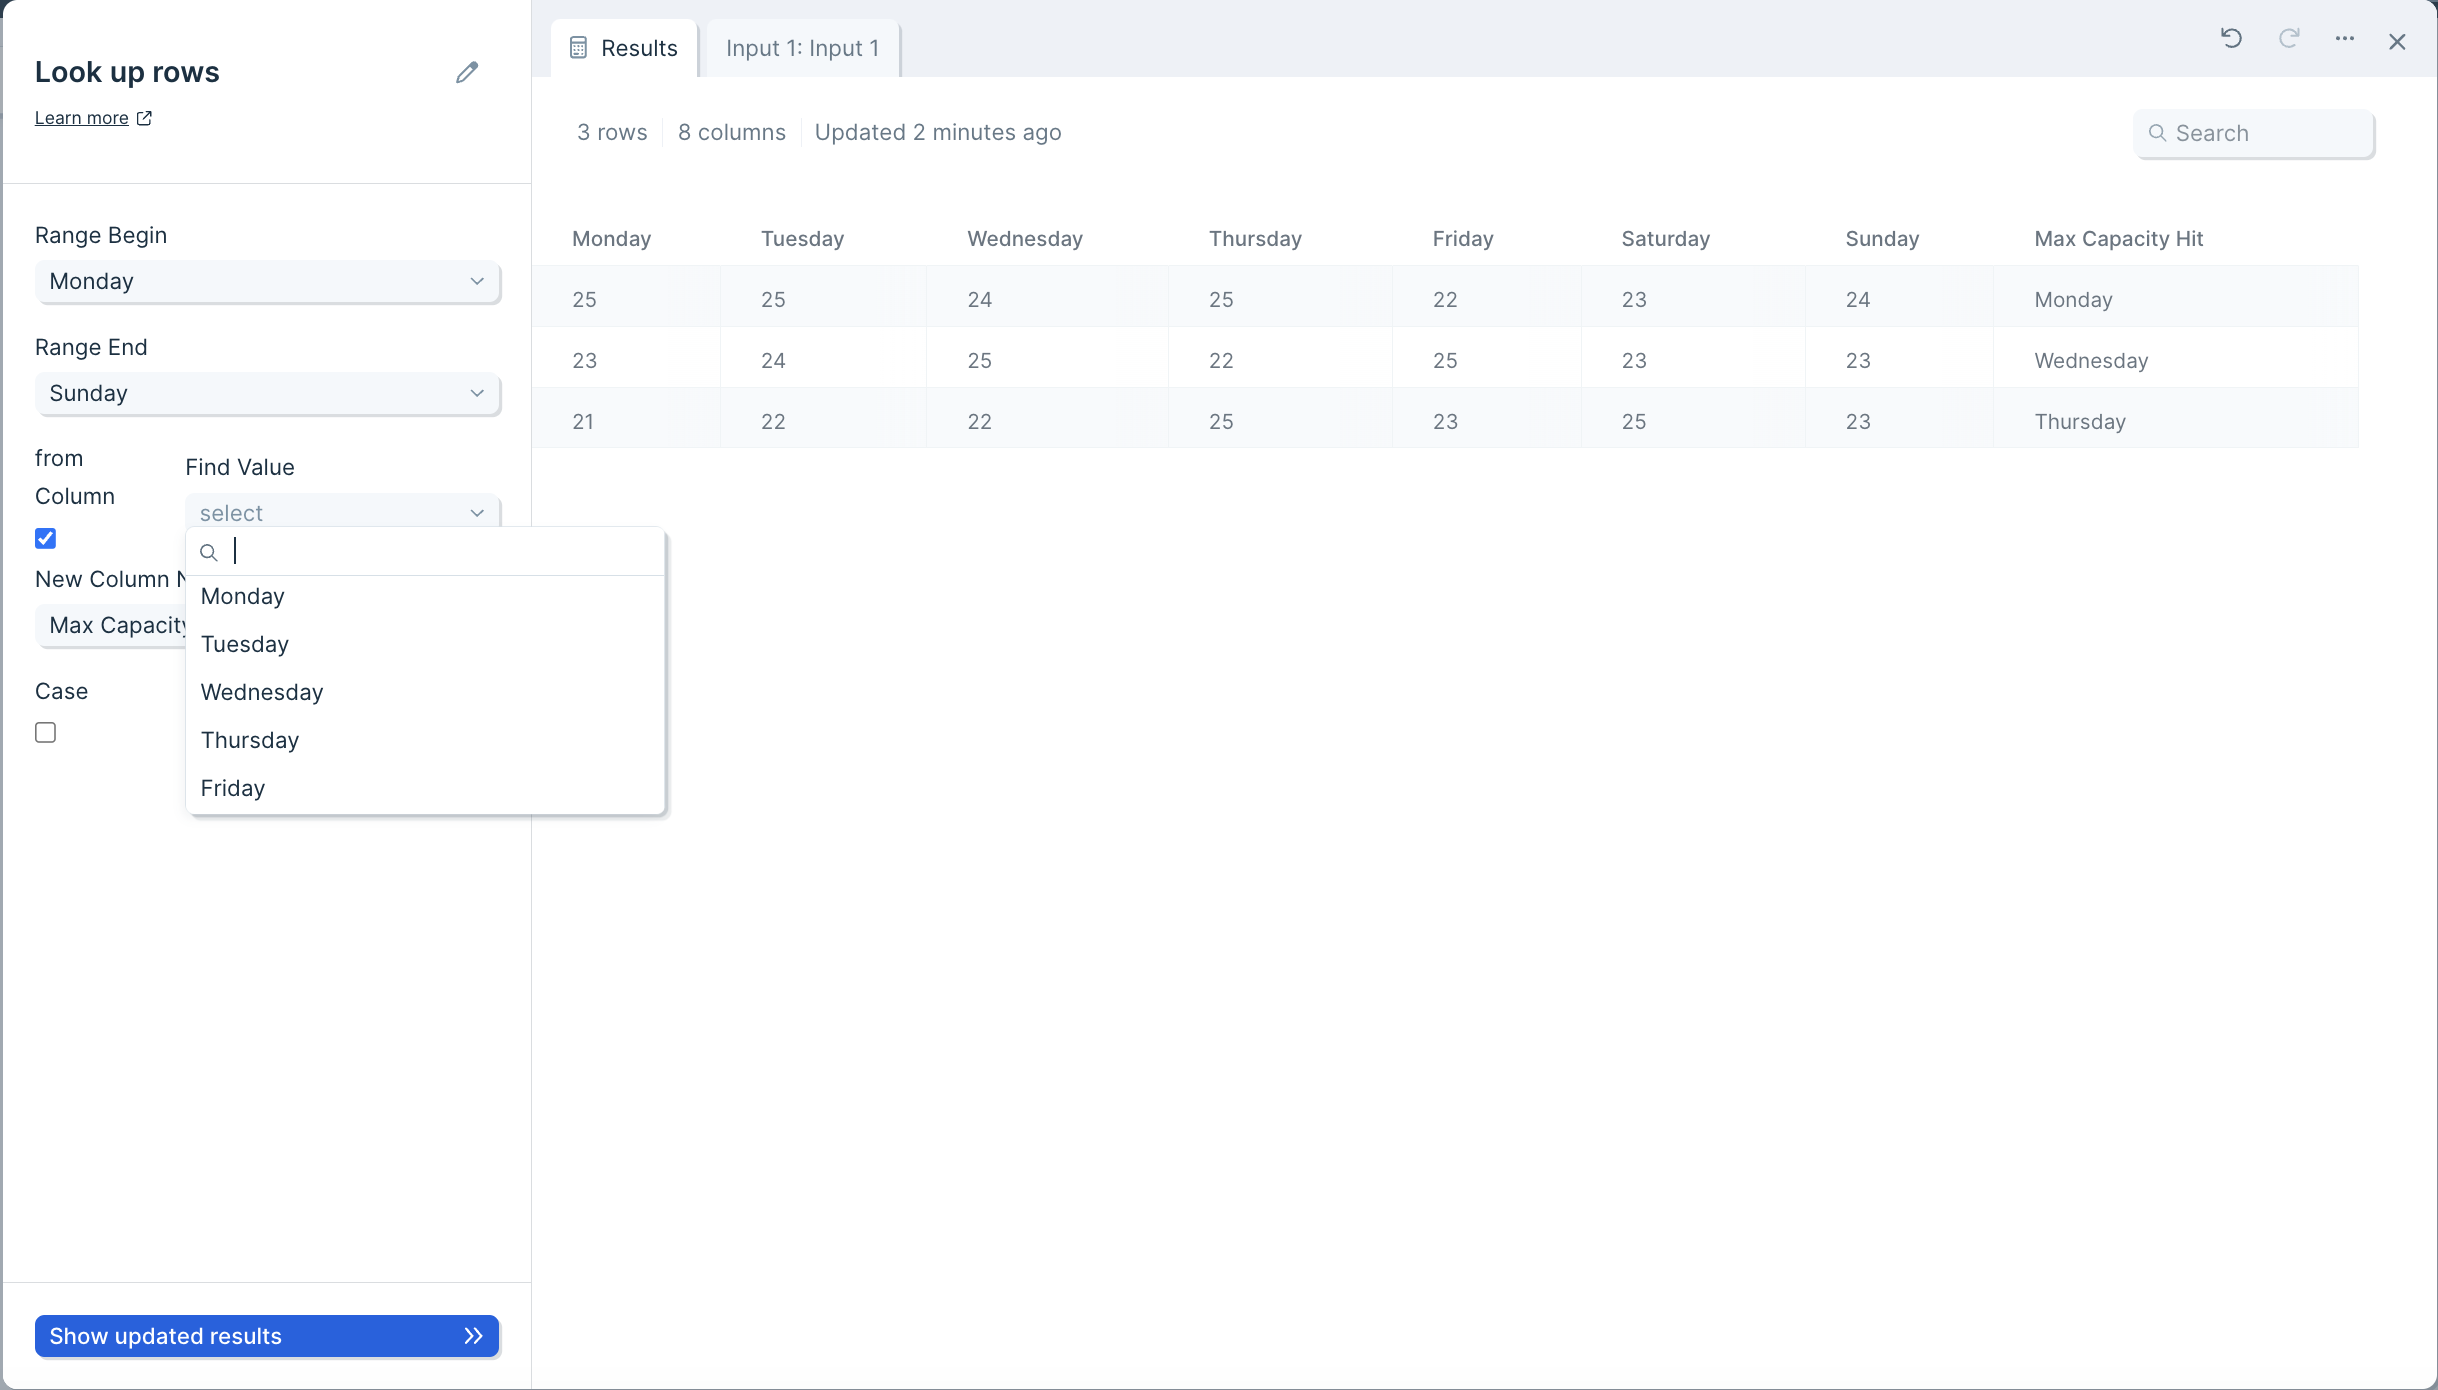
Lastly, checking the box for "Case" will force the matching to be case-sensitive.
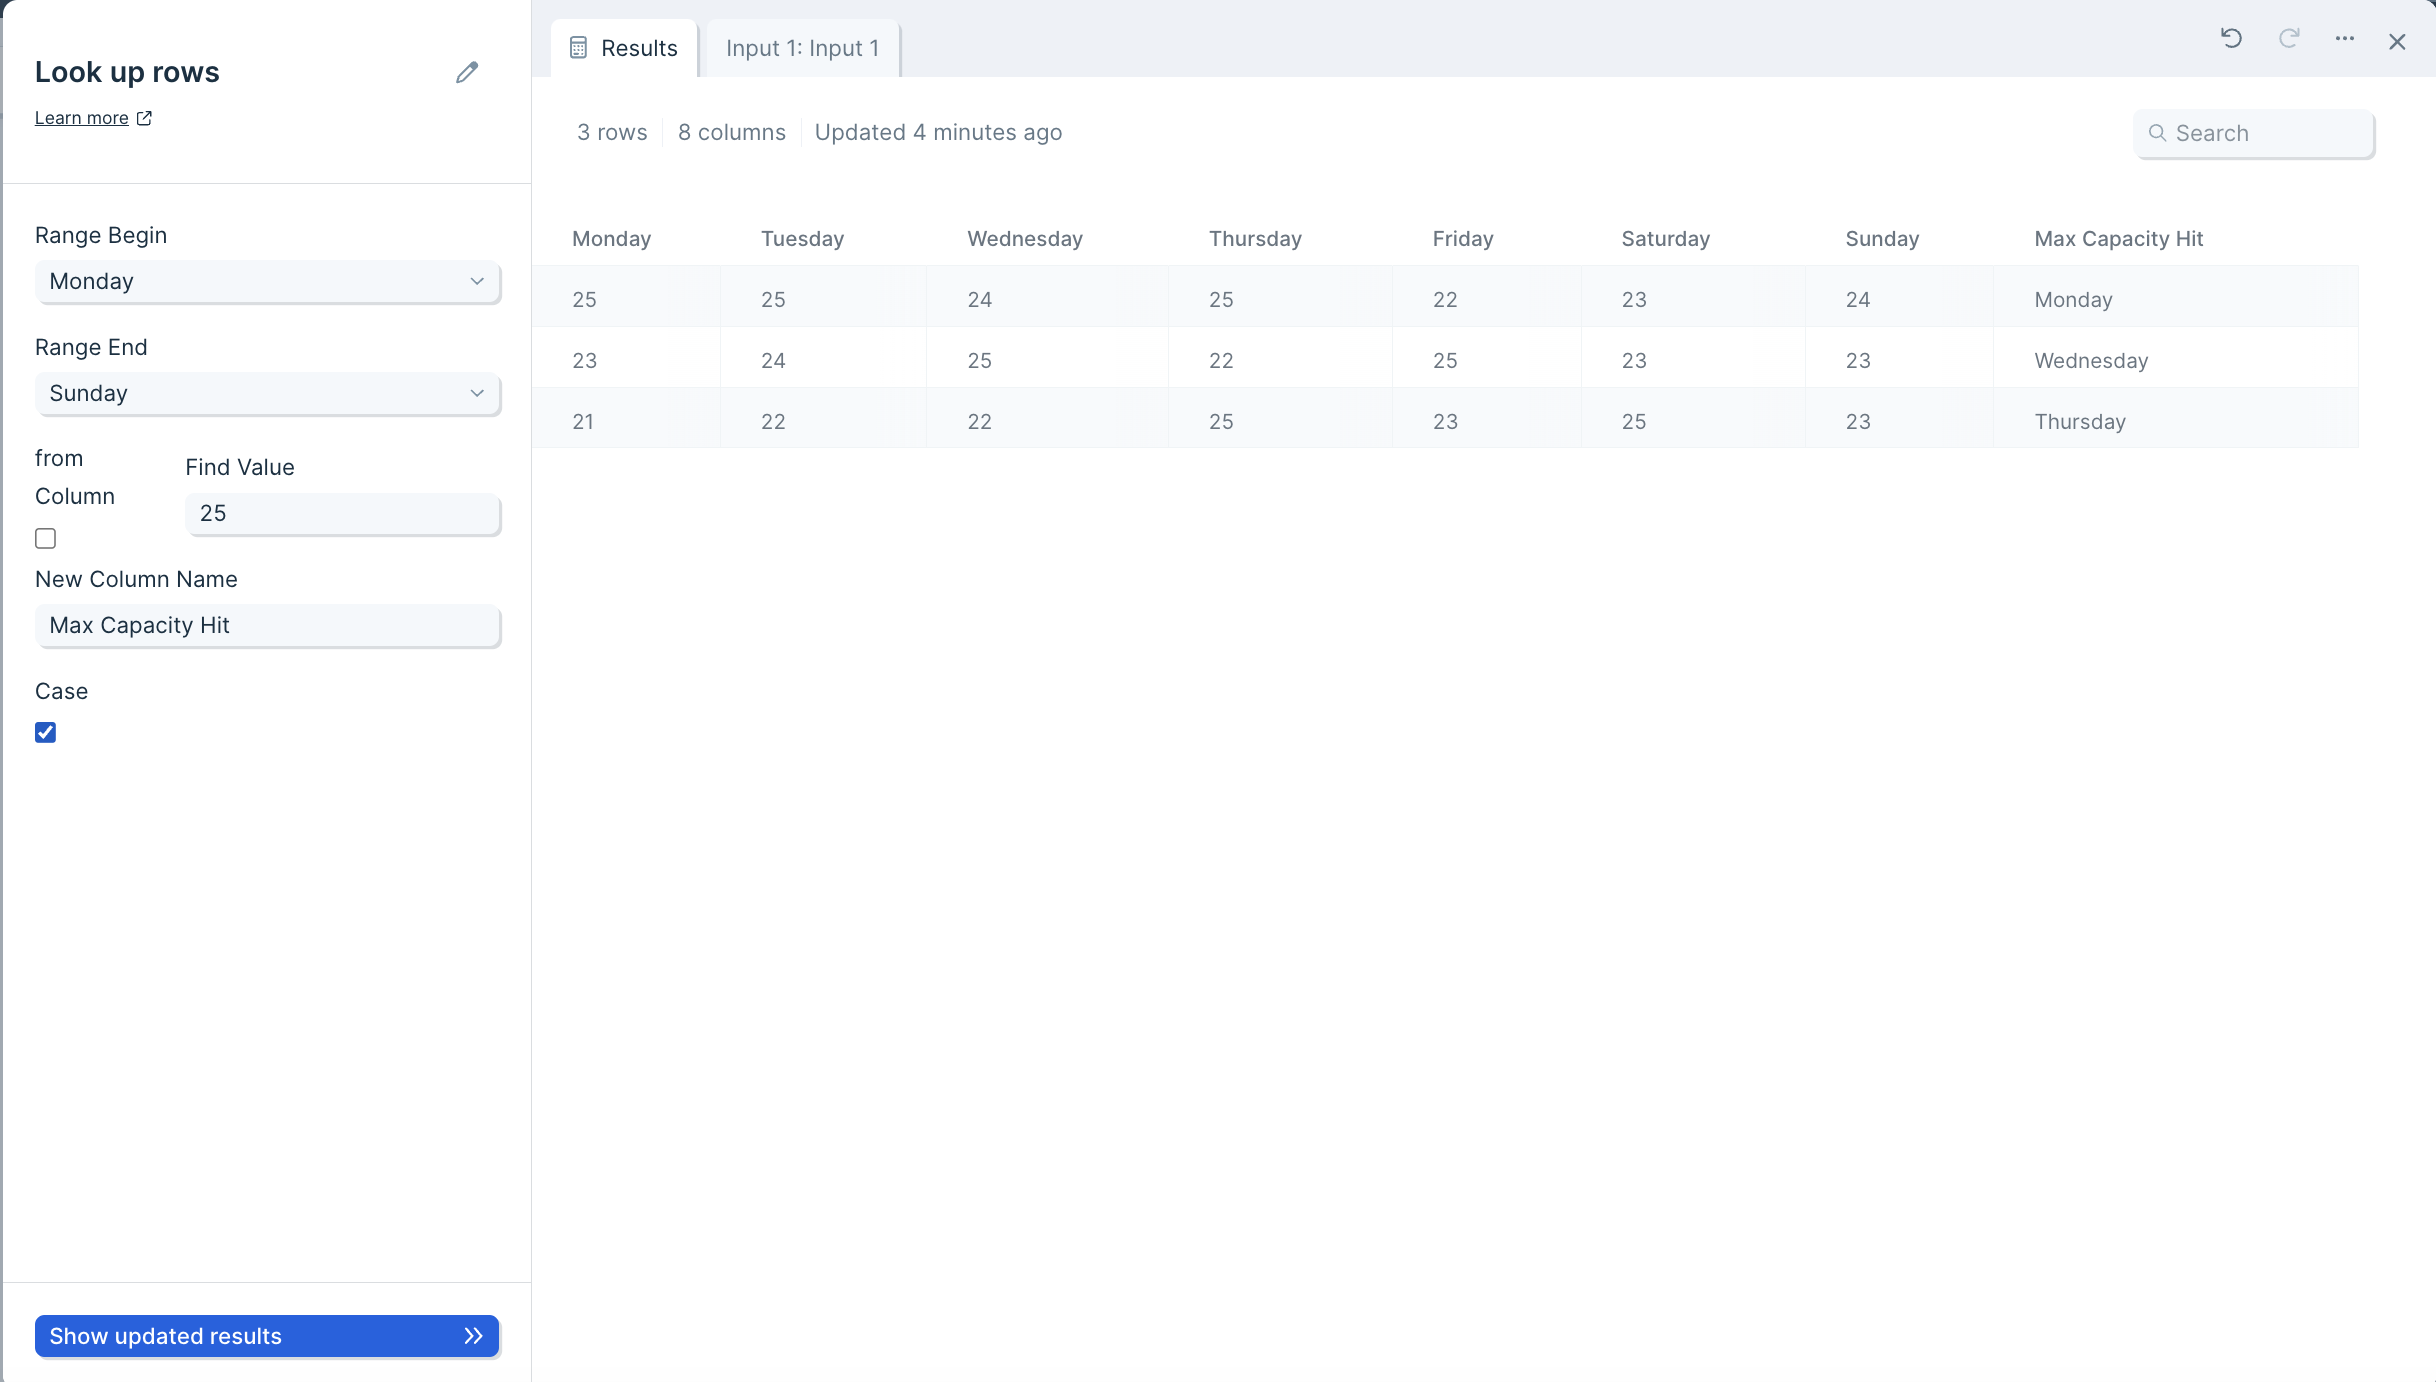
Transform step:
Merge columns
The Merge columns step combines data from two or more columns into a single column separated by a specified character.
This step can serve a lot of different purposes, though it is especially useful for creating lists inside of a single cell, which can help with transferring complex data or creating lists to search against for avoiding duplicates.
Input/output
Let's say we need to combine the data from our columns "Product" and "Size" to create a new column called "Product Label" for easy label creation. The Merge columns step is how we'll achieve this.
Our input data has two separate columns "Product" and "Size".

After using the Merge columns step, we have a new column called "Combined: Orders" where values from the columns "Product" and "Size" were merged while separated by a comma.
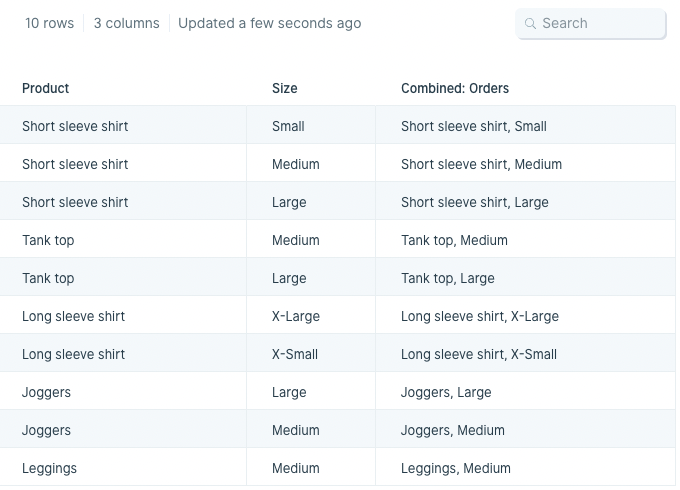
Custom settings
Once you've connected your flow's most recent step to this one, open up the Merge columns step window and under New Column Name, type the name you'd like your new column to be.
Then, under Merge, select two or more columns from your original data that you'd like to merge.
After that, expand Advanced Settings if you want to set a custom delimiter. Our example sets the delimiter to a comma and space ", " which will be placed in between the data from the "Product" column and the data from the "Size" column. If no delimiter is inputted, the step will default to merging the data in the columns with no comma or space in between.
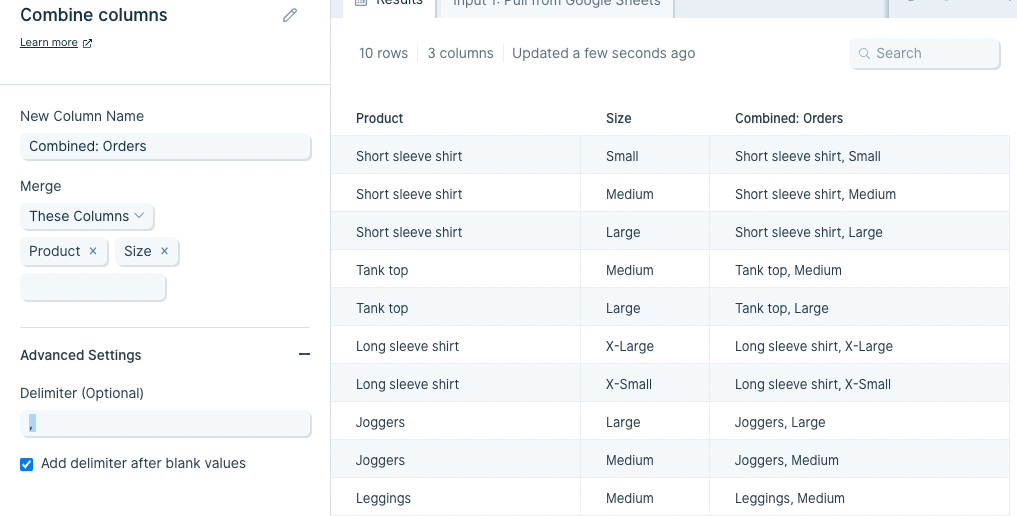
If necessary, you can also check the box next to "Add delimiter after blank values". This is powerful if you're trying to create a JSON array or object and it's important that each object or array has the same number of commas, separating all column values including blank ones.
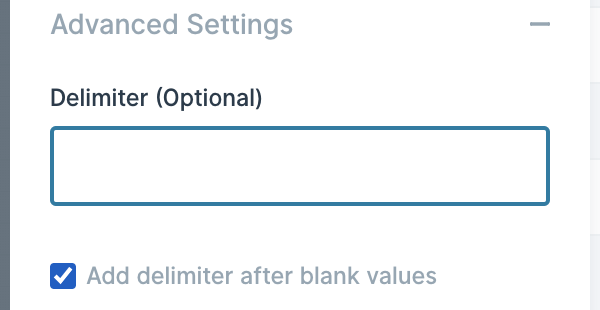
Common questions and how to troubleshoot
Here are a few common questions that come up around the Merge columns step and ways to troubleshoot them:
Issue: I’m seeing my rows multiplied in the results section of the Merge columns step.
Solution: It’s possible that you are matching on data that is duplicated in one or both of your sources. Check your inputs to make sure the selected matching columns have unique data in both inputs. If you don’t have a column with unique data, you may need to choose multiple columns to match with to make sure you’re not duplicating your rows.
Issue: I’m seeing a Missing columns error in my Merge columns step.
Solution: This can happen when you make changes to one of your inputs after you’ve already selected the setting in your Merge columns step. You’ll need to either reselect your matching columns in that step or pull in a new Combine tables step.
Transform step:
Merge duplicates
The Merge duplicates step allows you to group rows in one or more columns and merge their values.
Input/output
The data we'll input into this step has an identifier type to deduplicate and its corresponding columns of data.
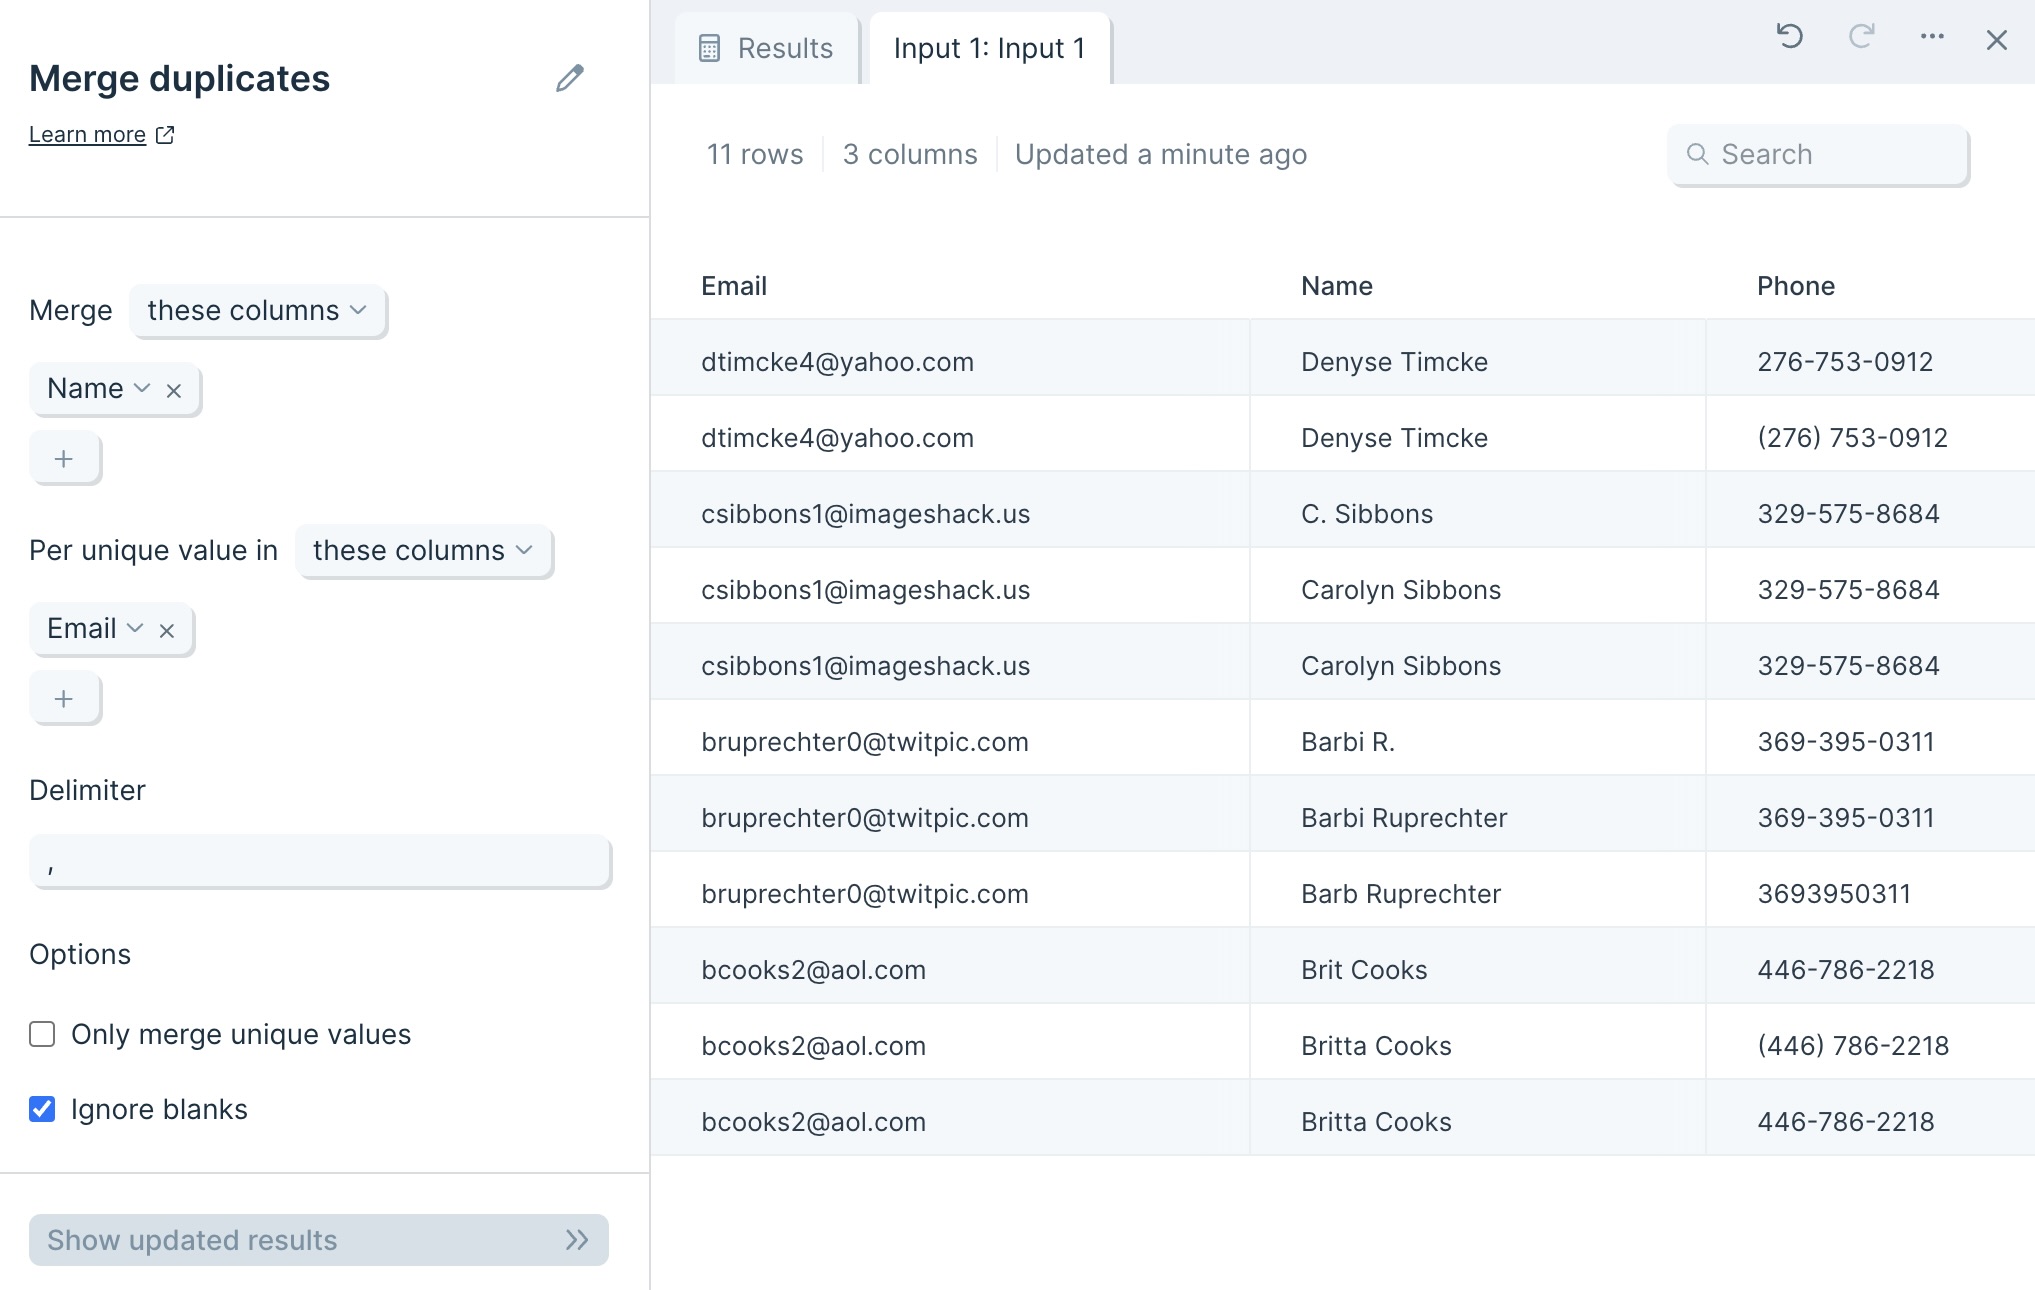
The step provides us with output of deduplicated data (based on a unique identifier value) with the merged values separated by a Delimiter in their corresponding columns.
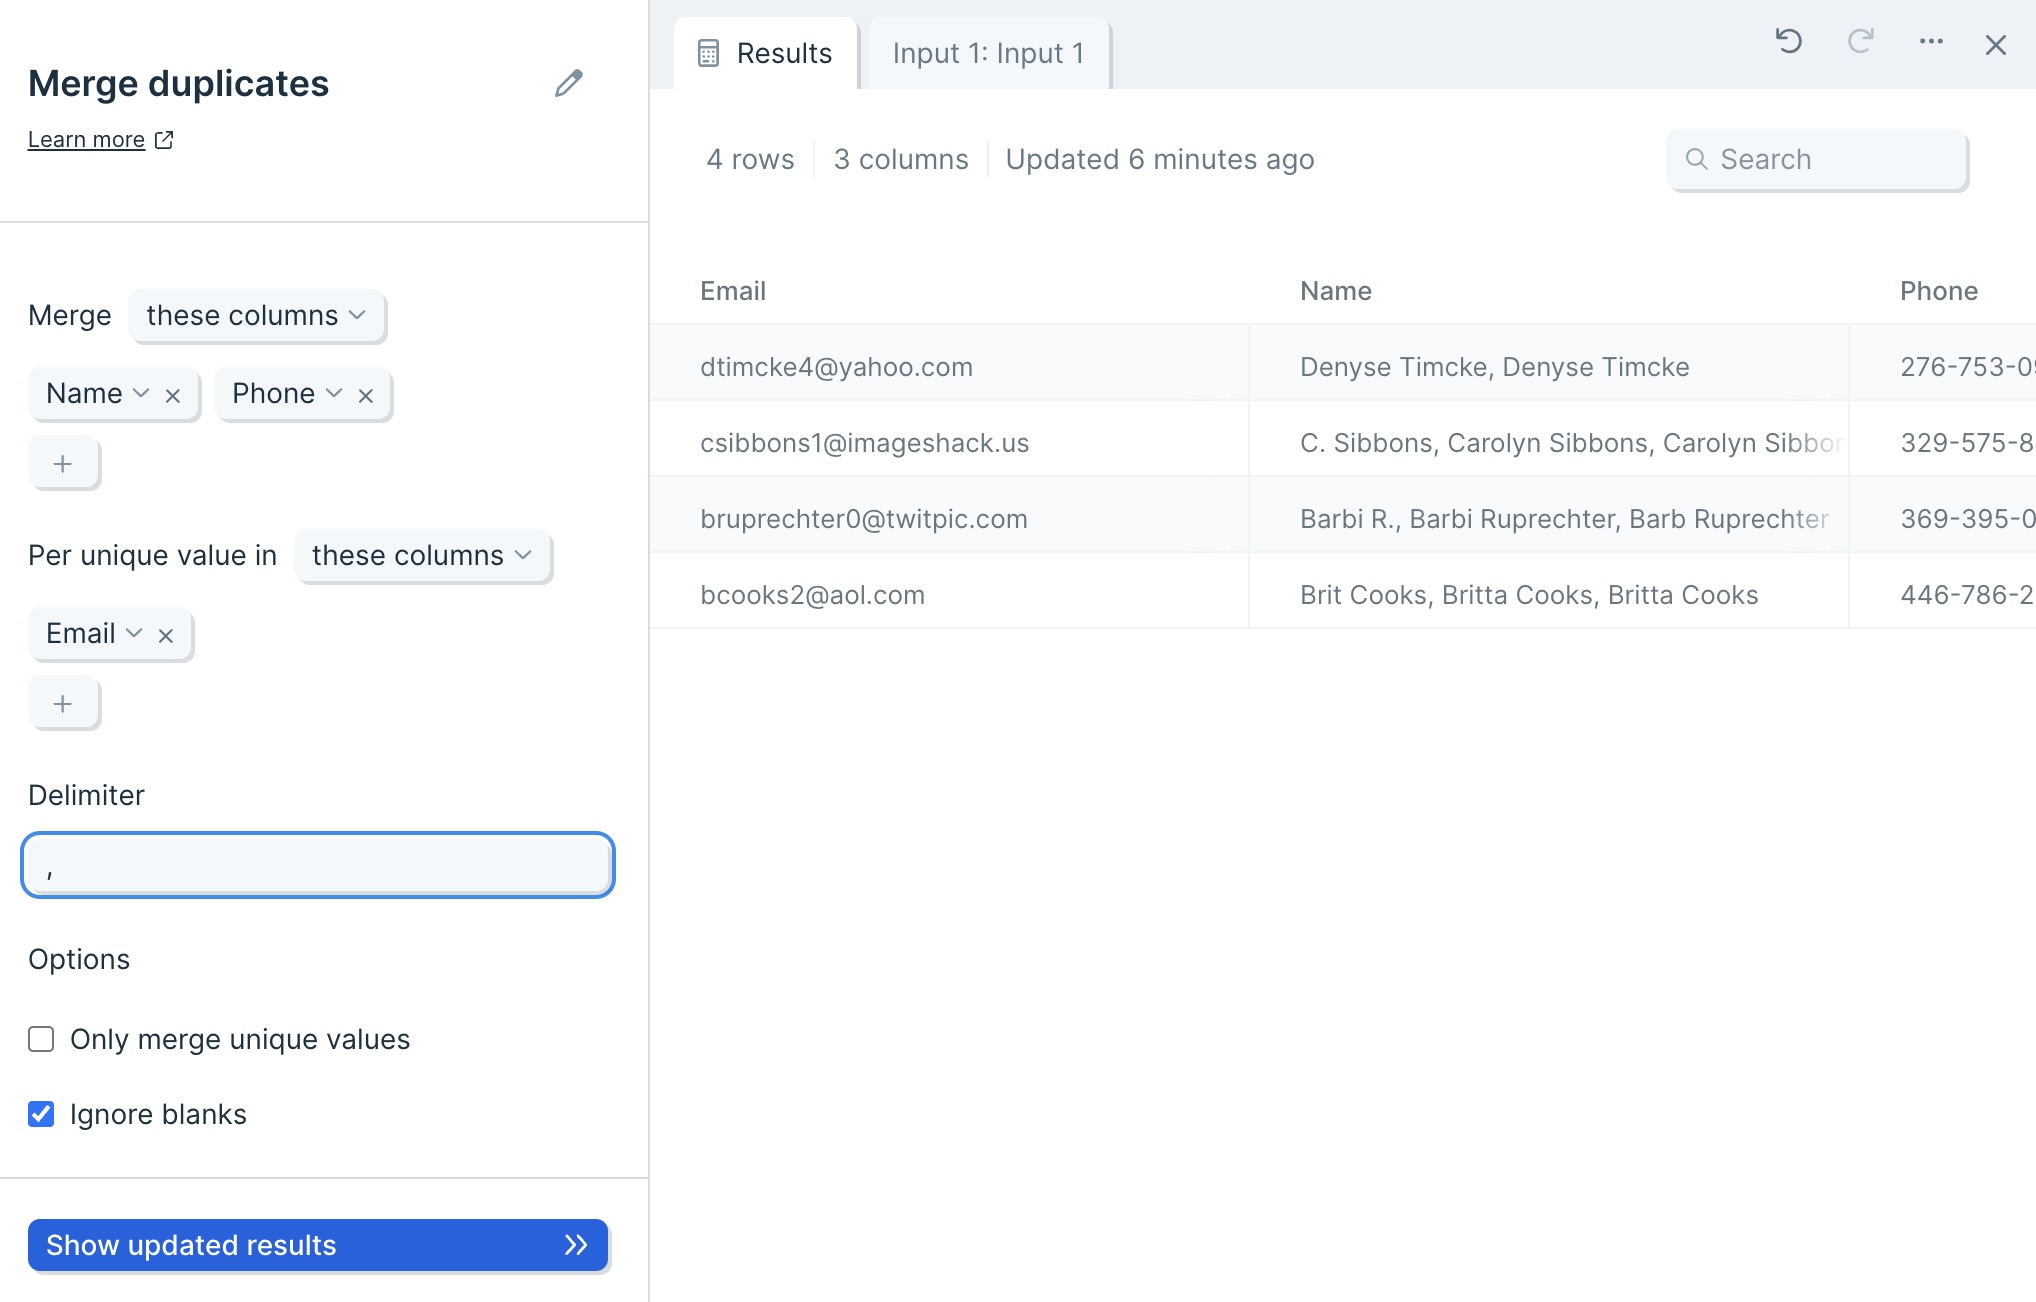
Default settings
By default, Parabola will map your first column to the unique value selector, and your second column to your Merge selector.
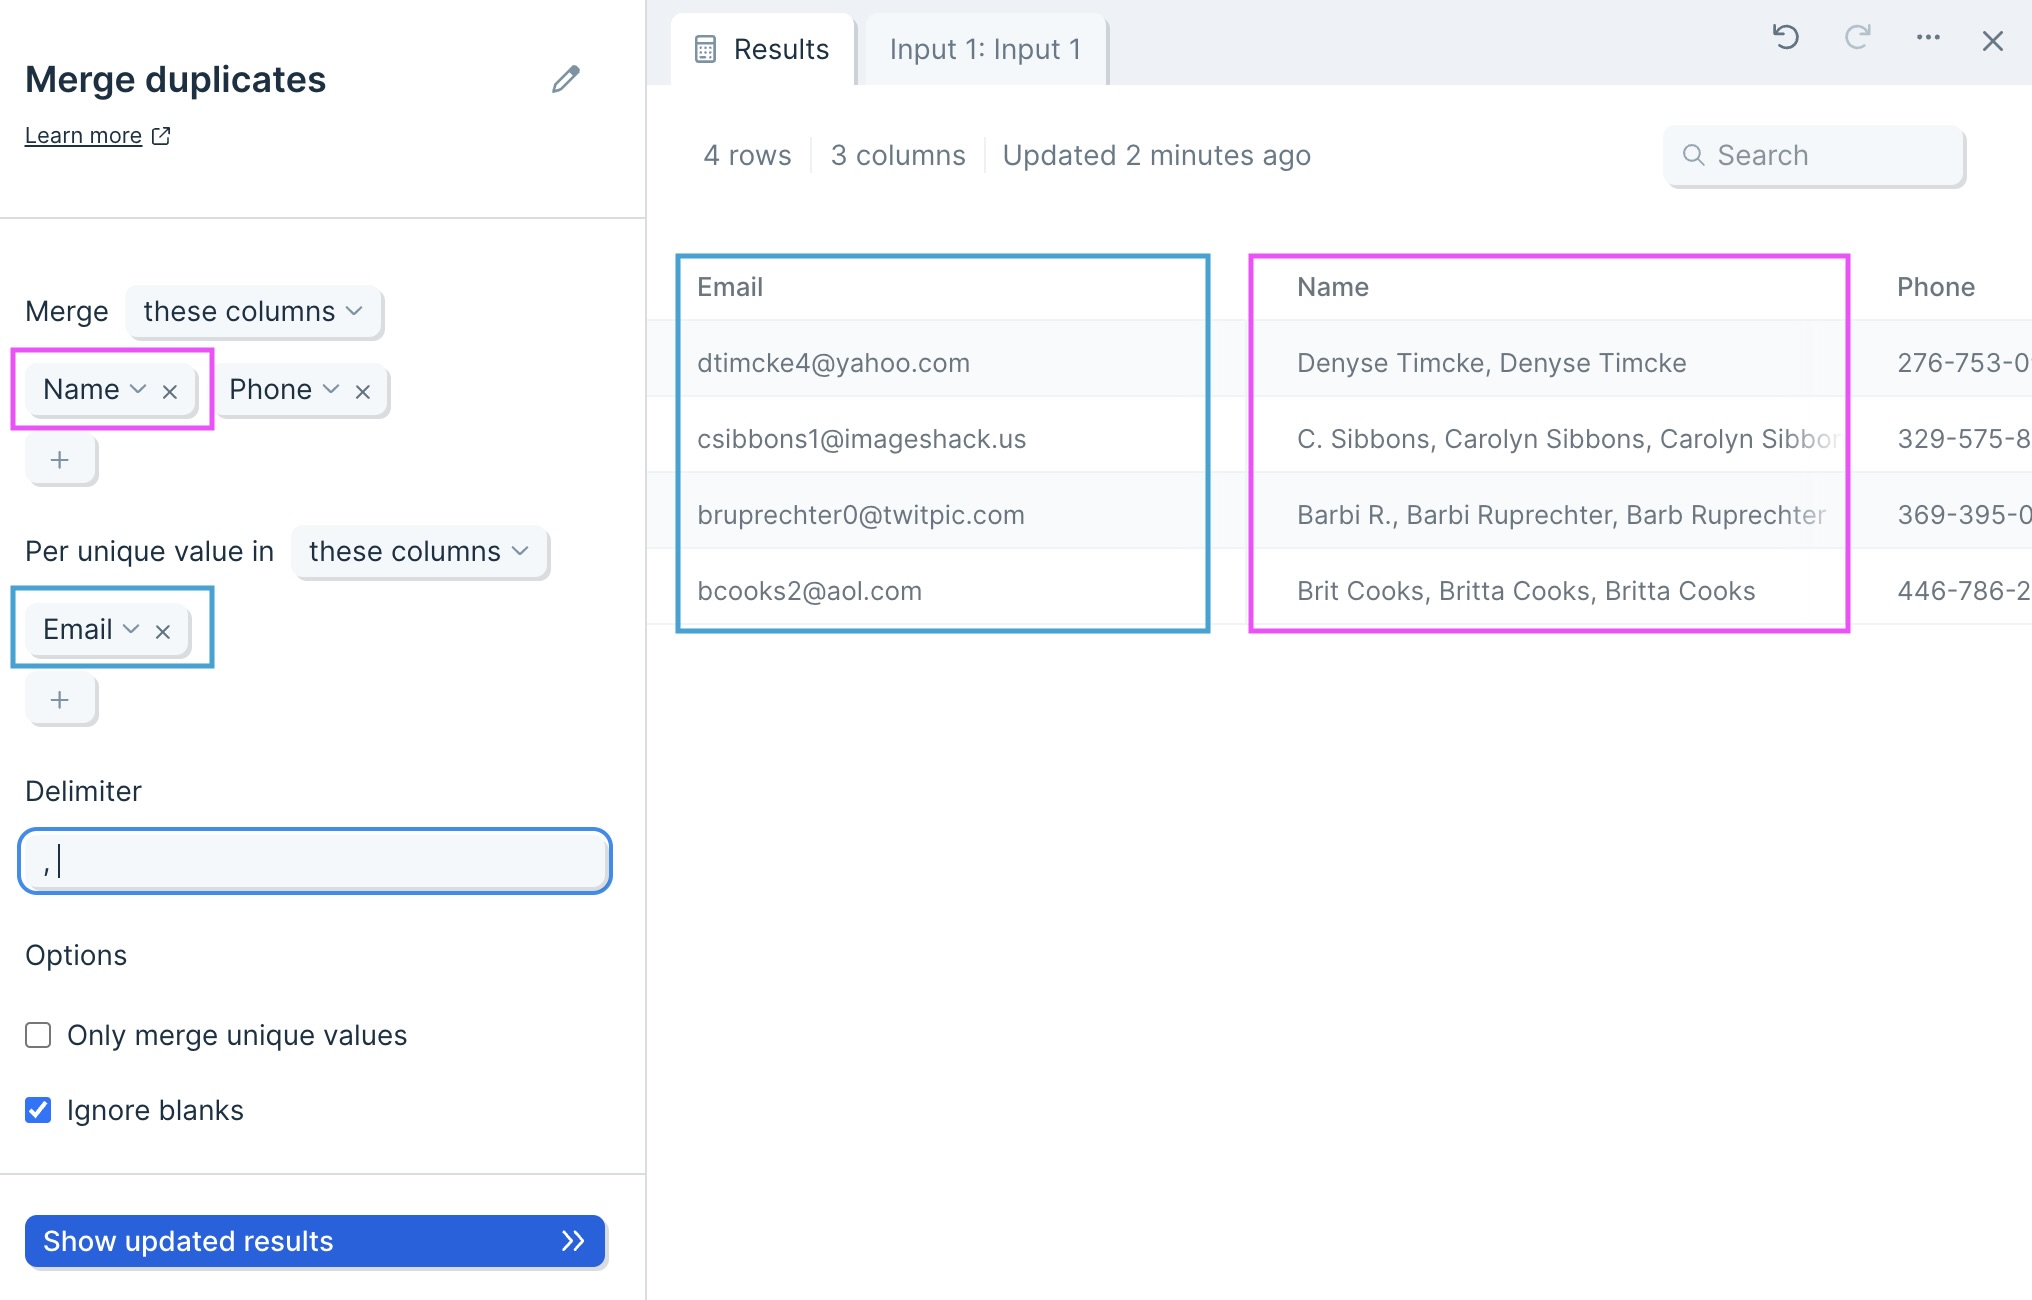
The Delimiter will be automatically set to a comma (,).
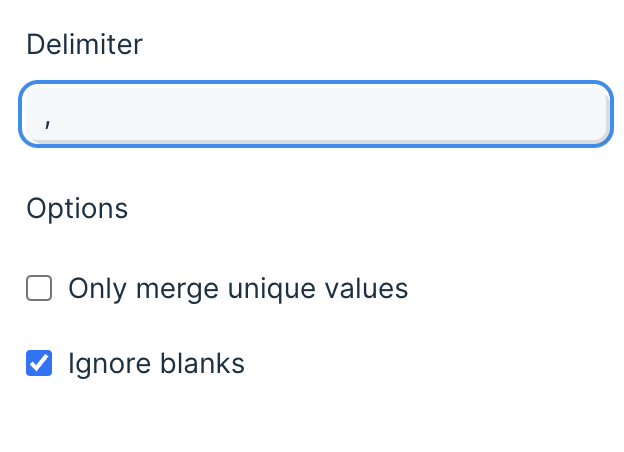
Lastly, the option to Ignore blanks will be auto-selected on.
Custom settings
First, decide whether you want to include or exclude columns, by selecting these columns or all columns except.
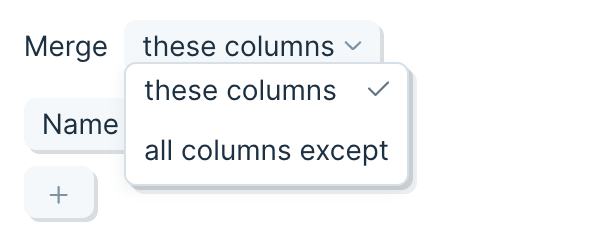
Next, click the plus sign to select the columns you would like to merge.
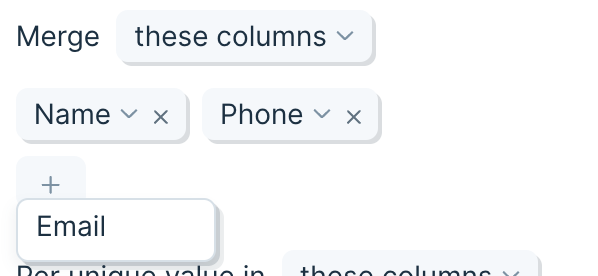
Then, use the Per unique value in selector to set the column which will act as your unique identifier.

You can choose whatever Delimiter you want. By default, it is a comma (,) but you can choose whatever works best with your data, such as a space ( ), a dash (-), or more.

Selecting the option to Only merge unique values keeps all values unique. For example, differently formatted phone numbers will not roll up into one merged number.
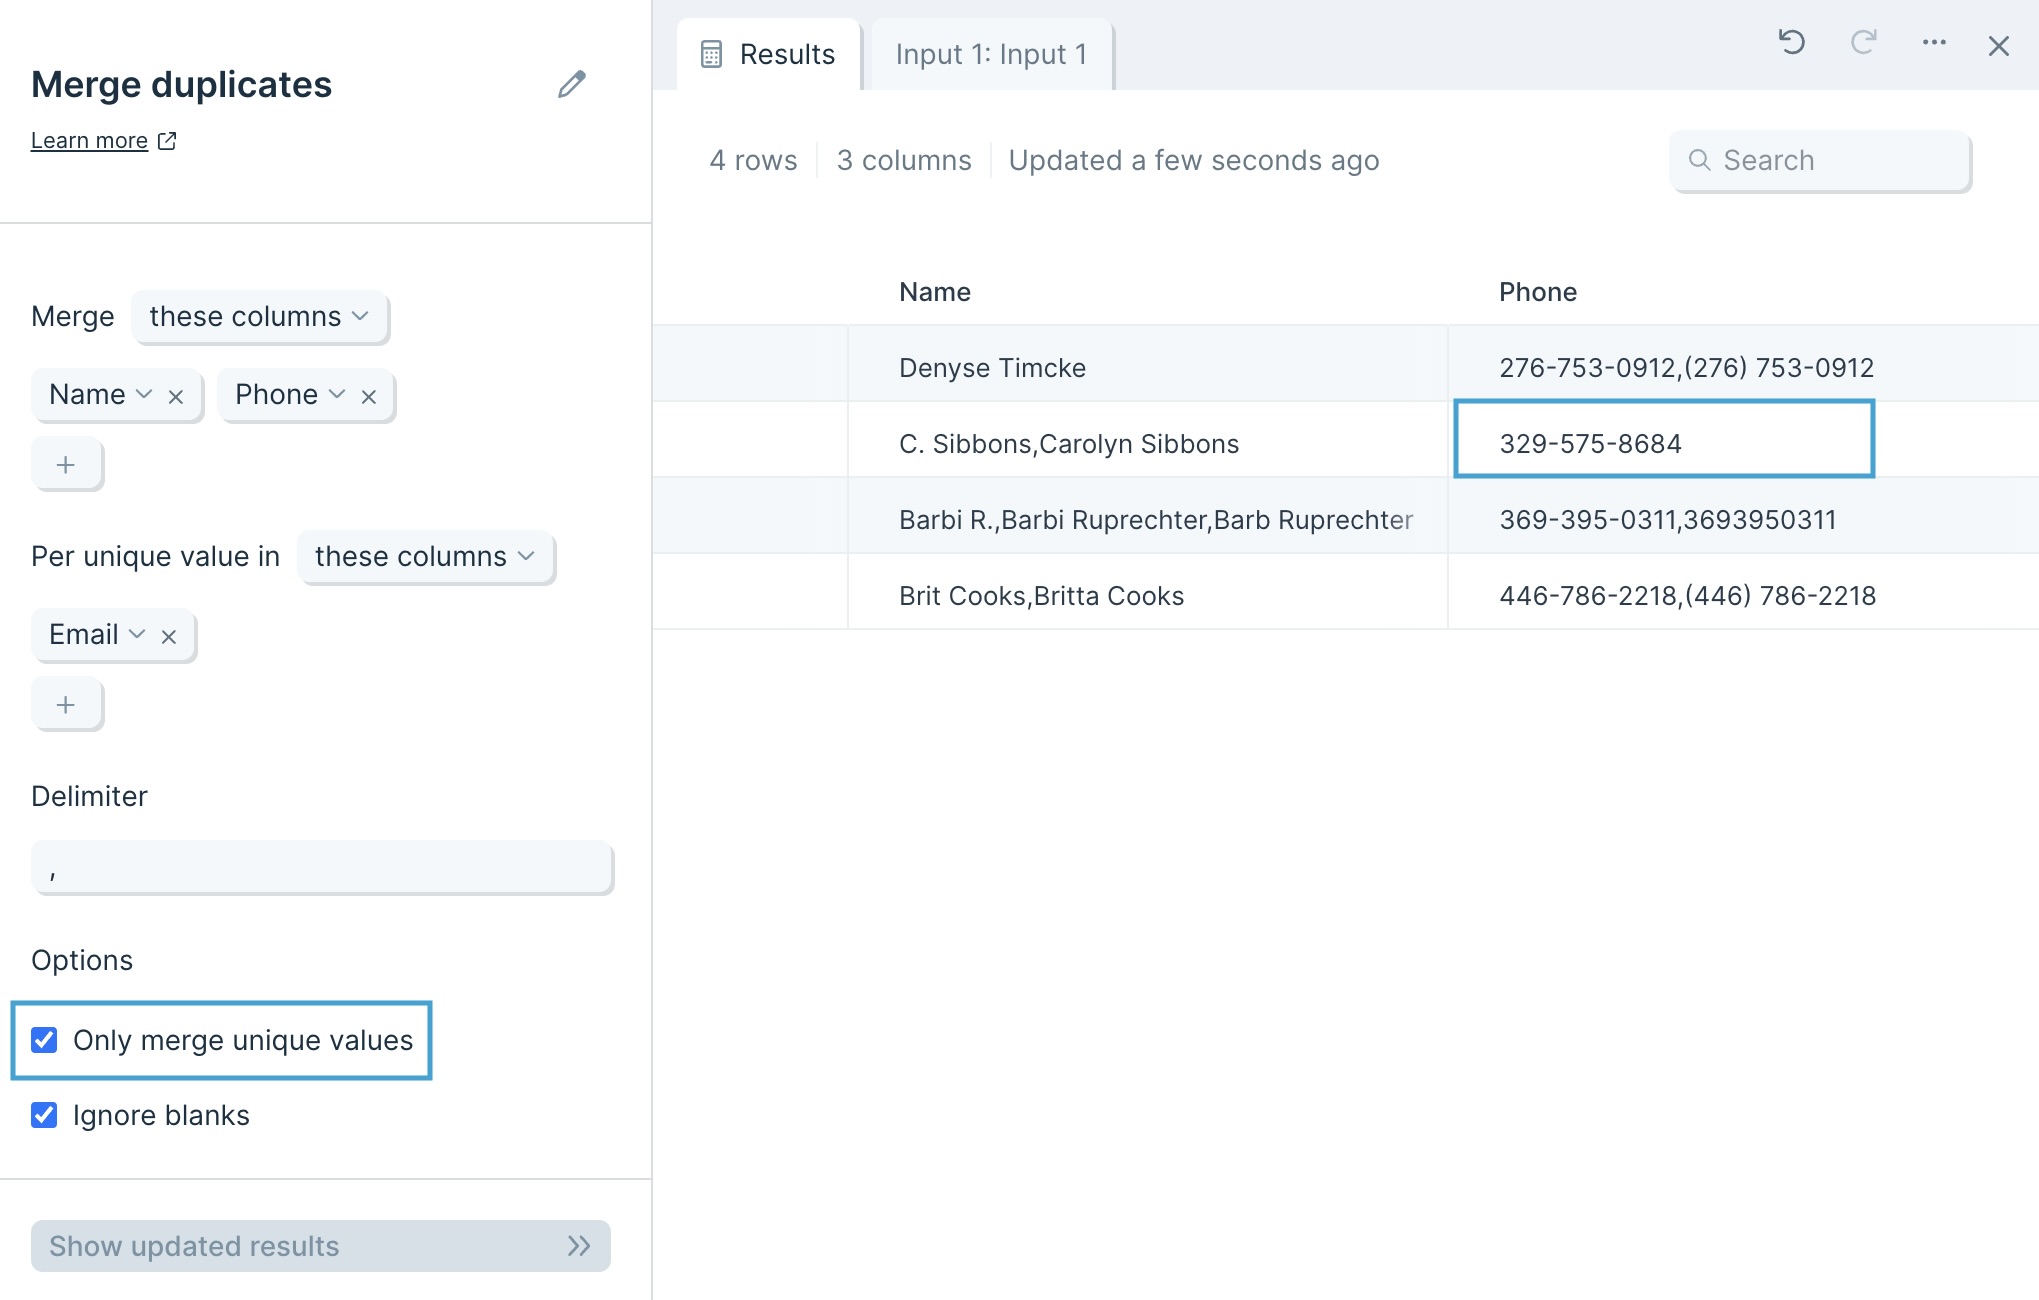
Ignore blanks is selected by default and treats blank cells as if they are not data points. Unchecking this option includes blank cells into your merged values, separated by your Delimiter.
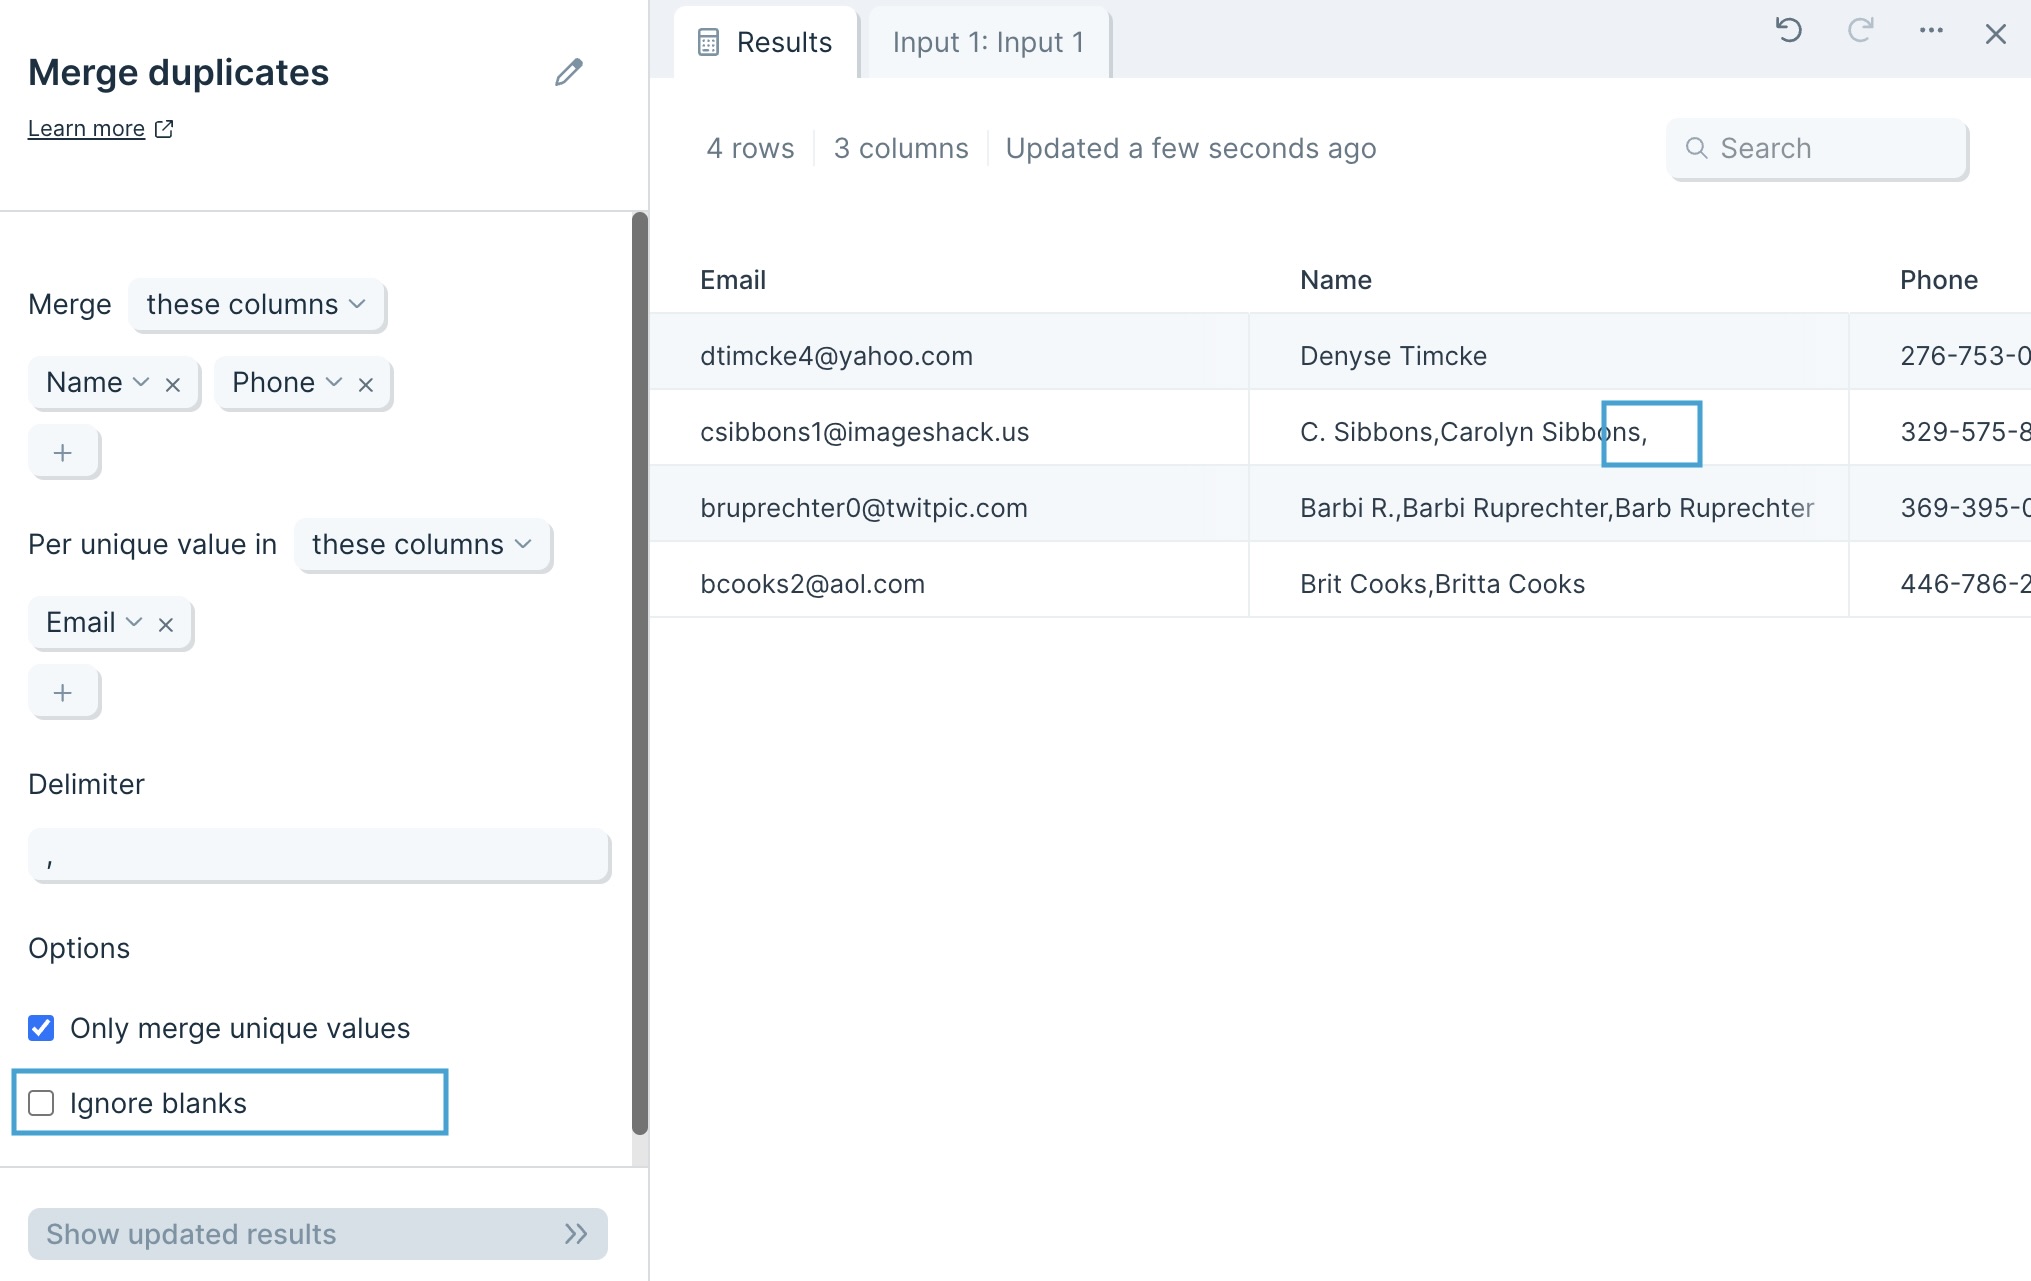
Transform step:
Pivot columns
The Pivot columns step takes a column and turns its values into multiple columns. It is particularly useful when needing to turn order line item information into a unique row per order.
Input/Output
In the example below, our input data has duplicate values in the "Order ID" column, plus other columns specifying "Variant Option" and "Variant Value".

We'll want to create a unique row per "Order ID" where the "Variant Option" becomes the column headers and "Variant Value" becomes the cell value in the corresponding columns. The Pivot columns step accomplishes this for us.

Custom settings
Once you connect data to the Pivot columns step, you'll select a Column to pivot into new column headers, and you'll select a Column with values to fill in
In the example below, we selected the "Variant Options" column to be the pivot column, and we selected "Variant Value" column to be the value column. If no "Variant Value" exists for the corresponding "Variant Options" column header, the cell is left blank.
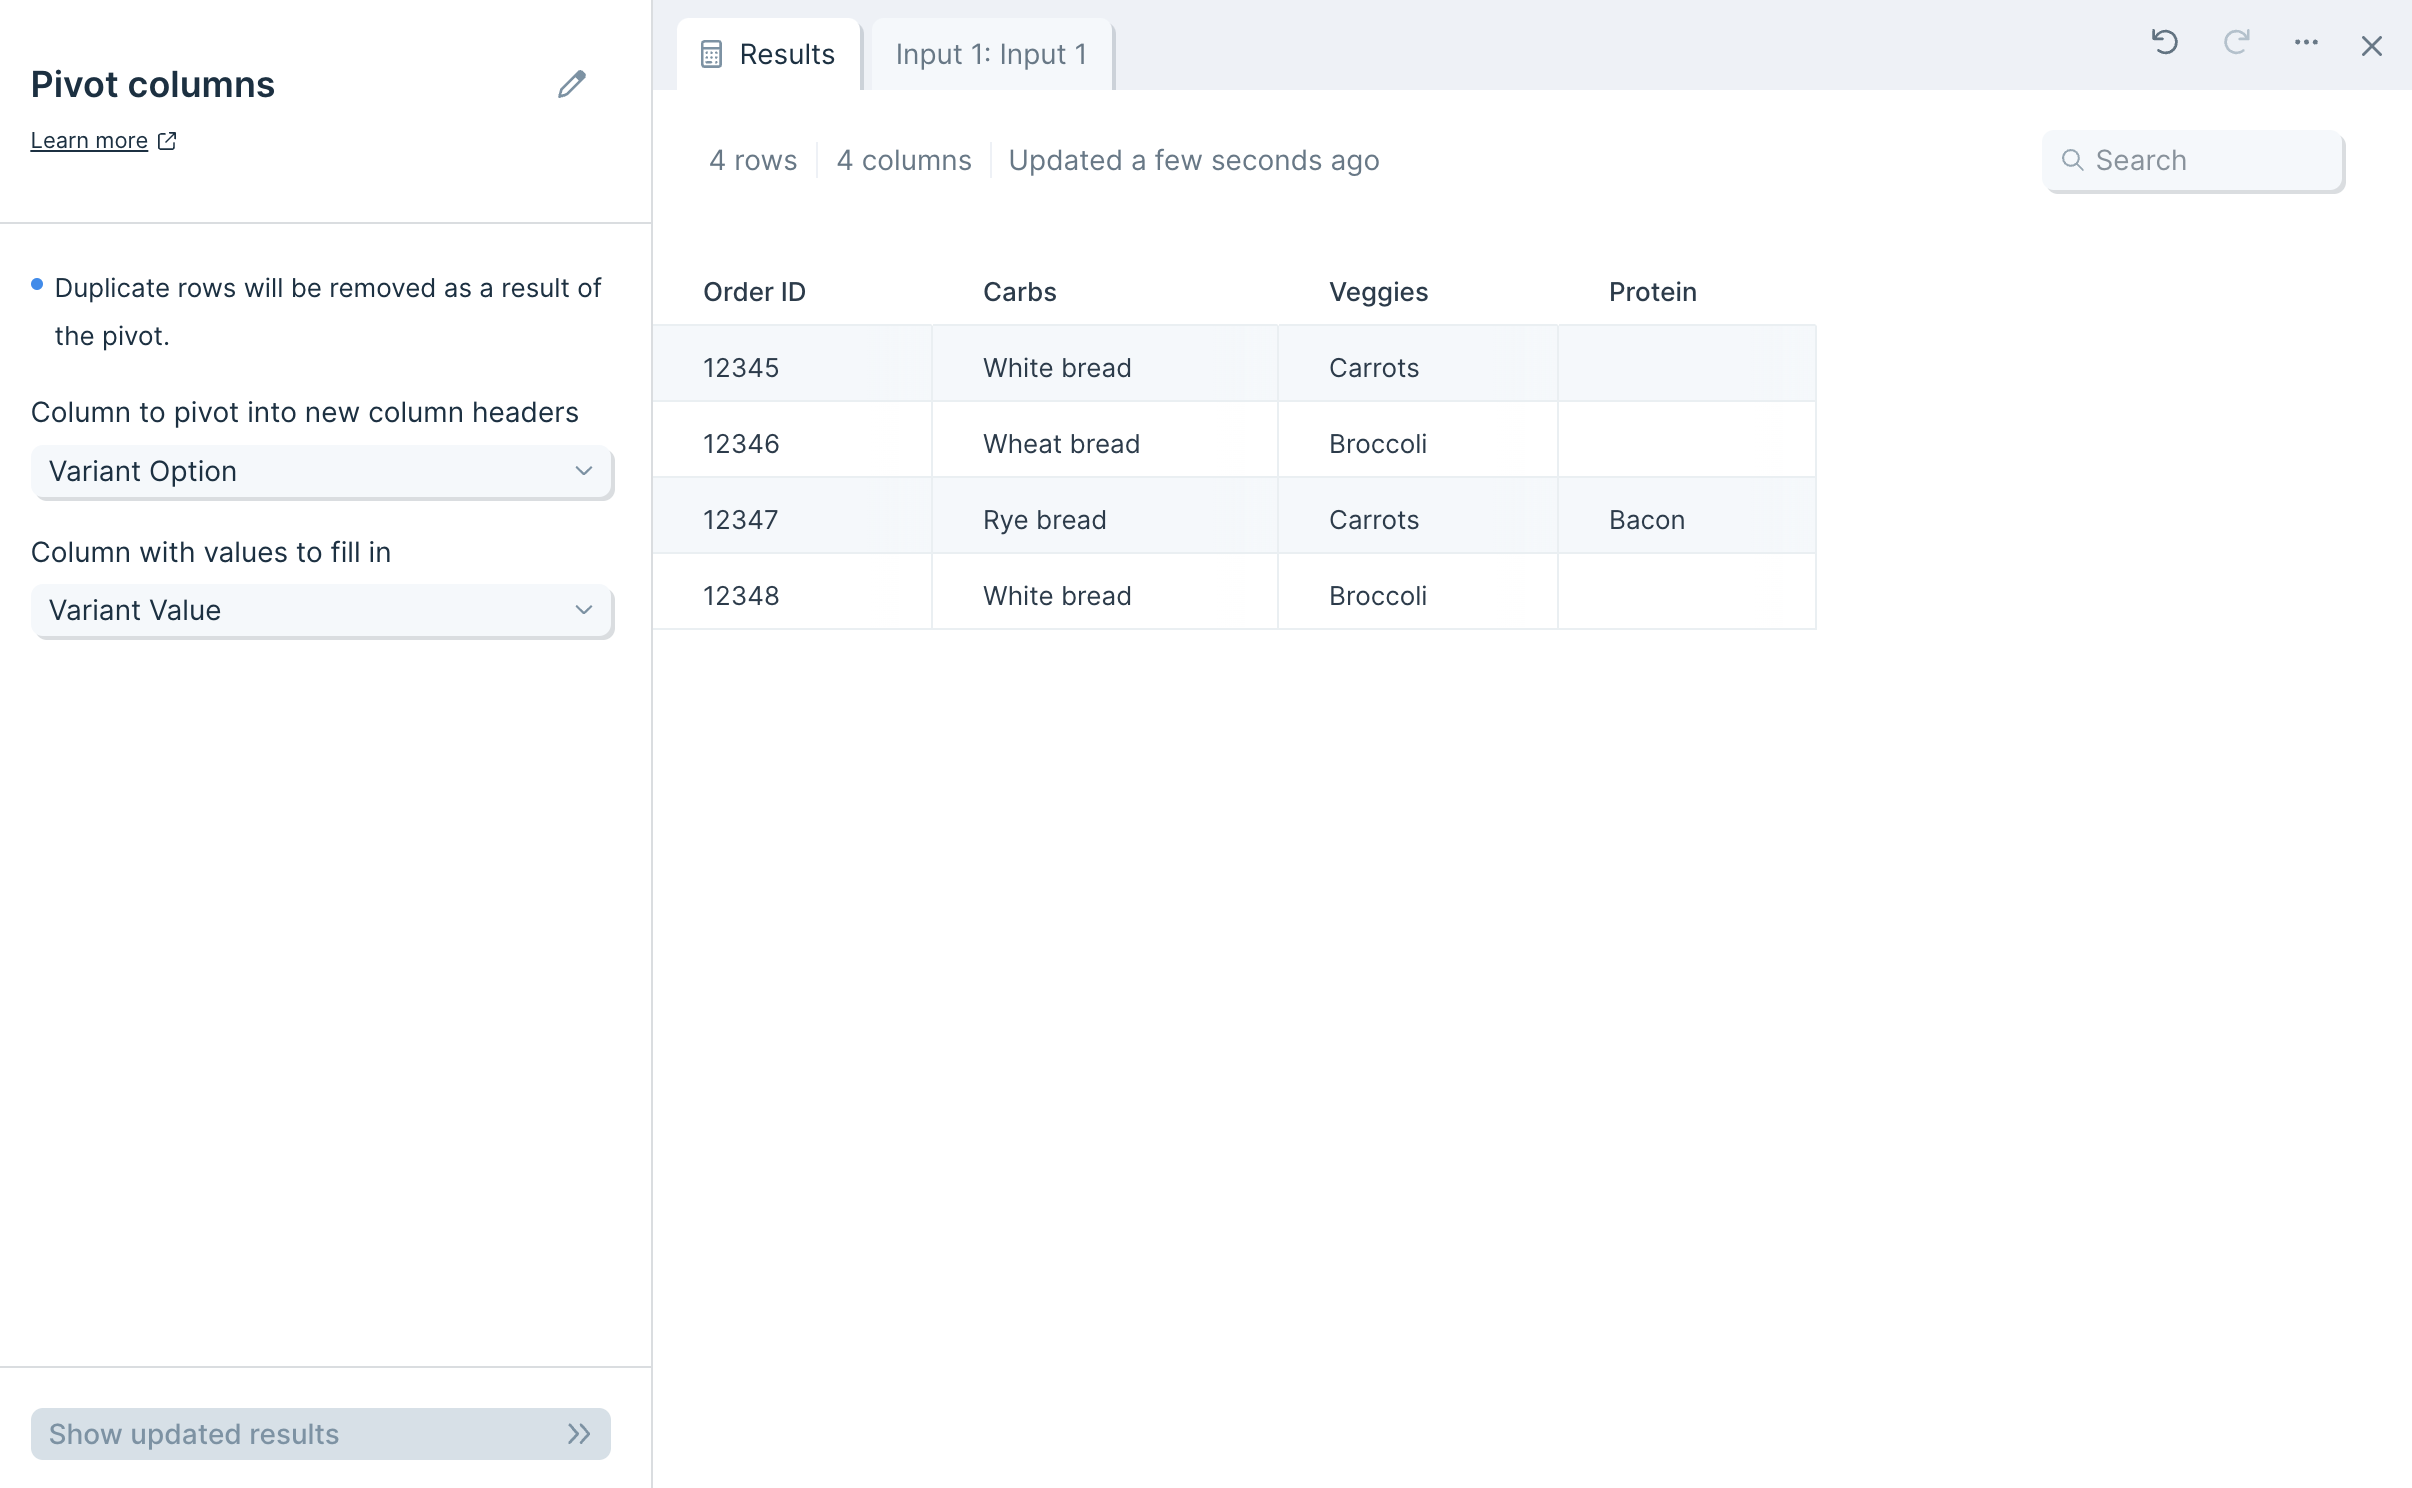
Transform step:
Remove duplicates
The Remove duplicates step removes rows with a duplicate value in any column you choose.
Watch this Parabola University video to see the Remove duplicates step in action.
Input/output
Our input data has 100 rows with these 4 columns: "Webinar ID", "Registrant name", "Registration date" and "Registration time".
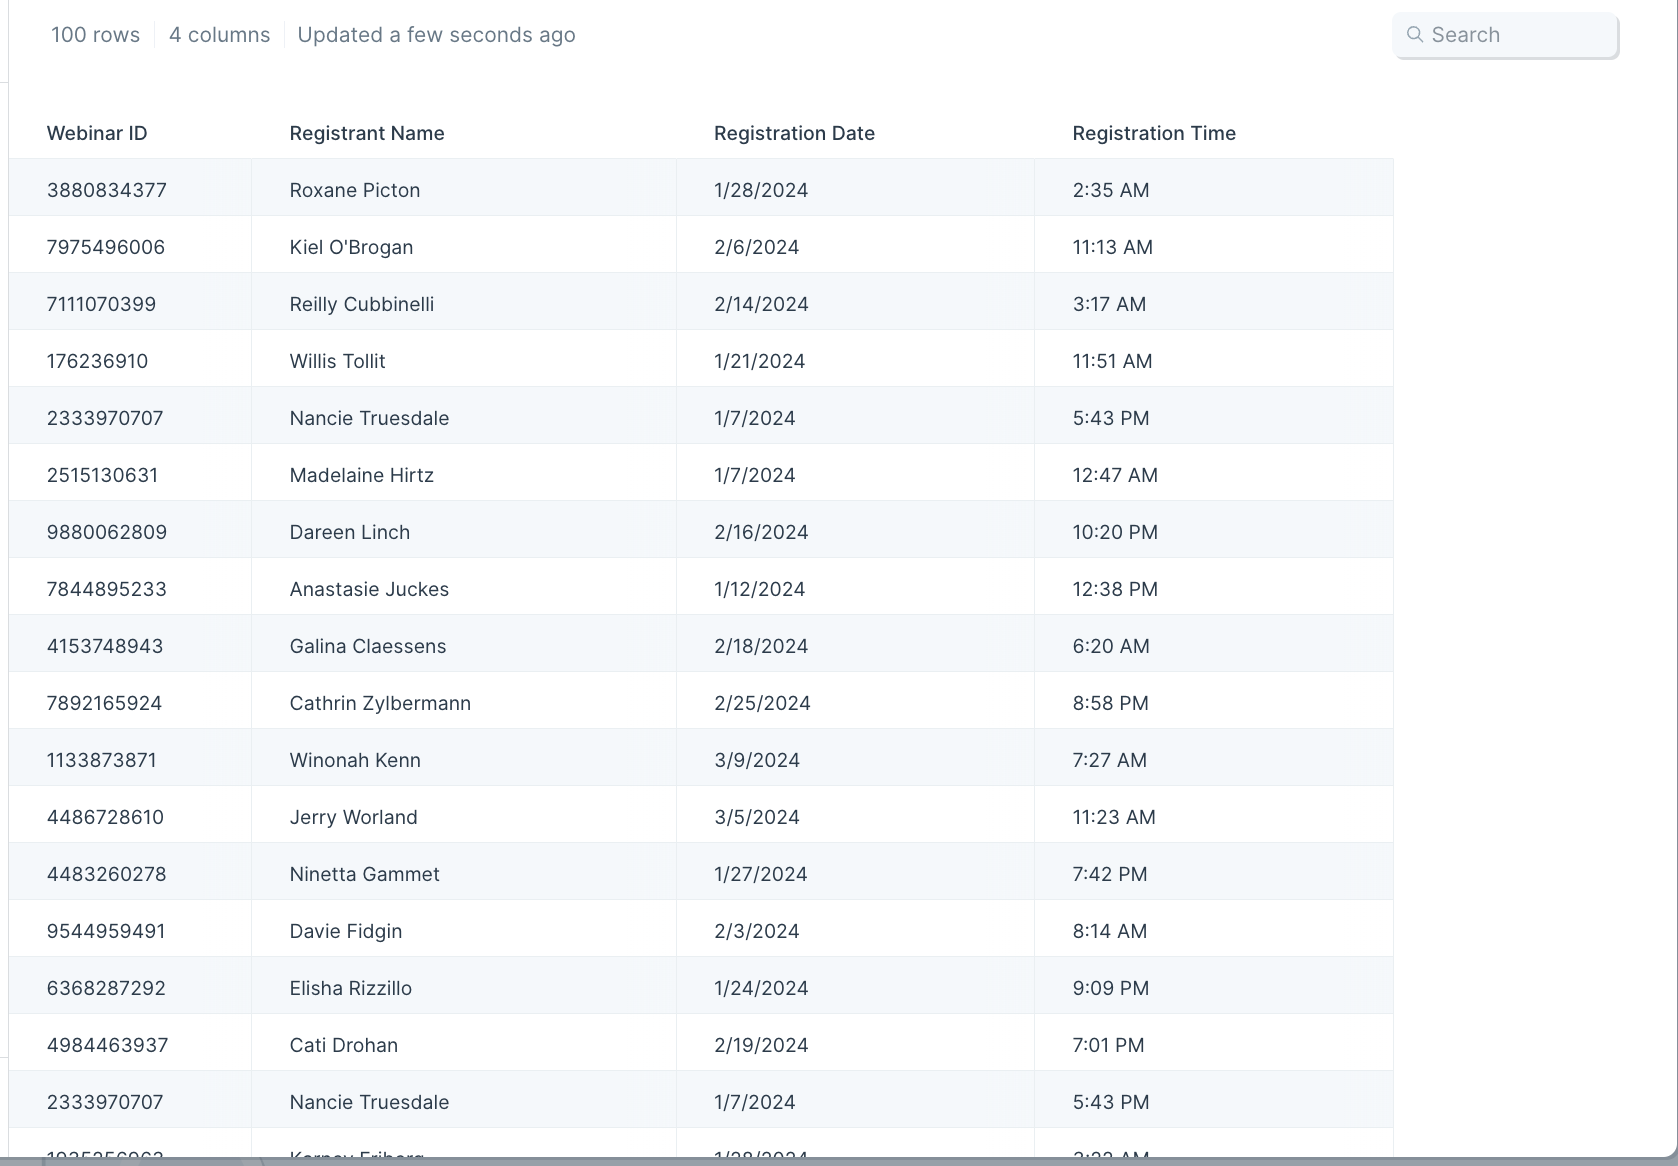
After using the Remove duplicates step to remove duplicate rows in the "Webinar ID" column, we went from 100 rows to 87. This tells us that we have 41 distinct Webinar IDs in our table. You can see from the screenshot above that some Webinar IDs like 532444816-8, 061561006-4, 966924489-7, 905788038-5 are repeated at least twice. It's those duplicates that this step helps remove instantly.
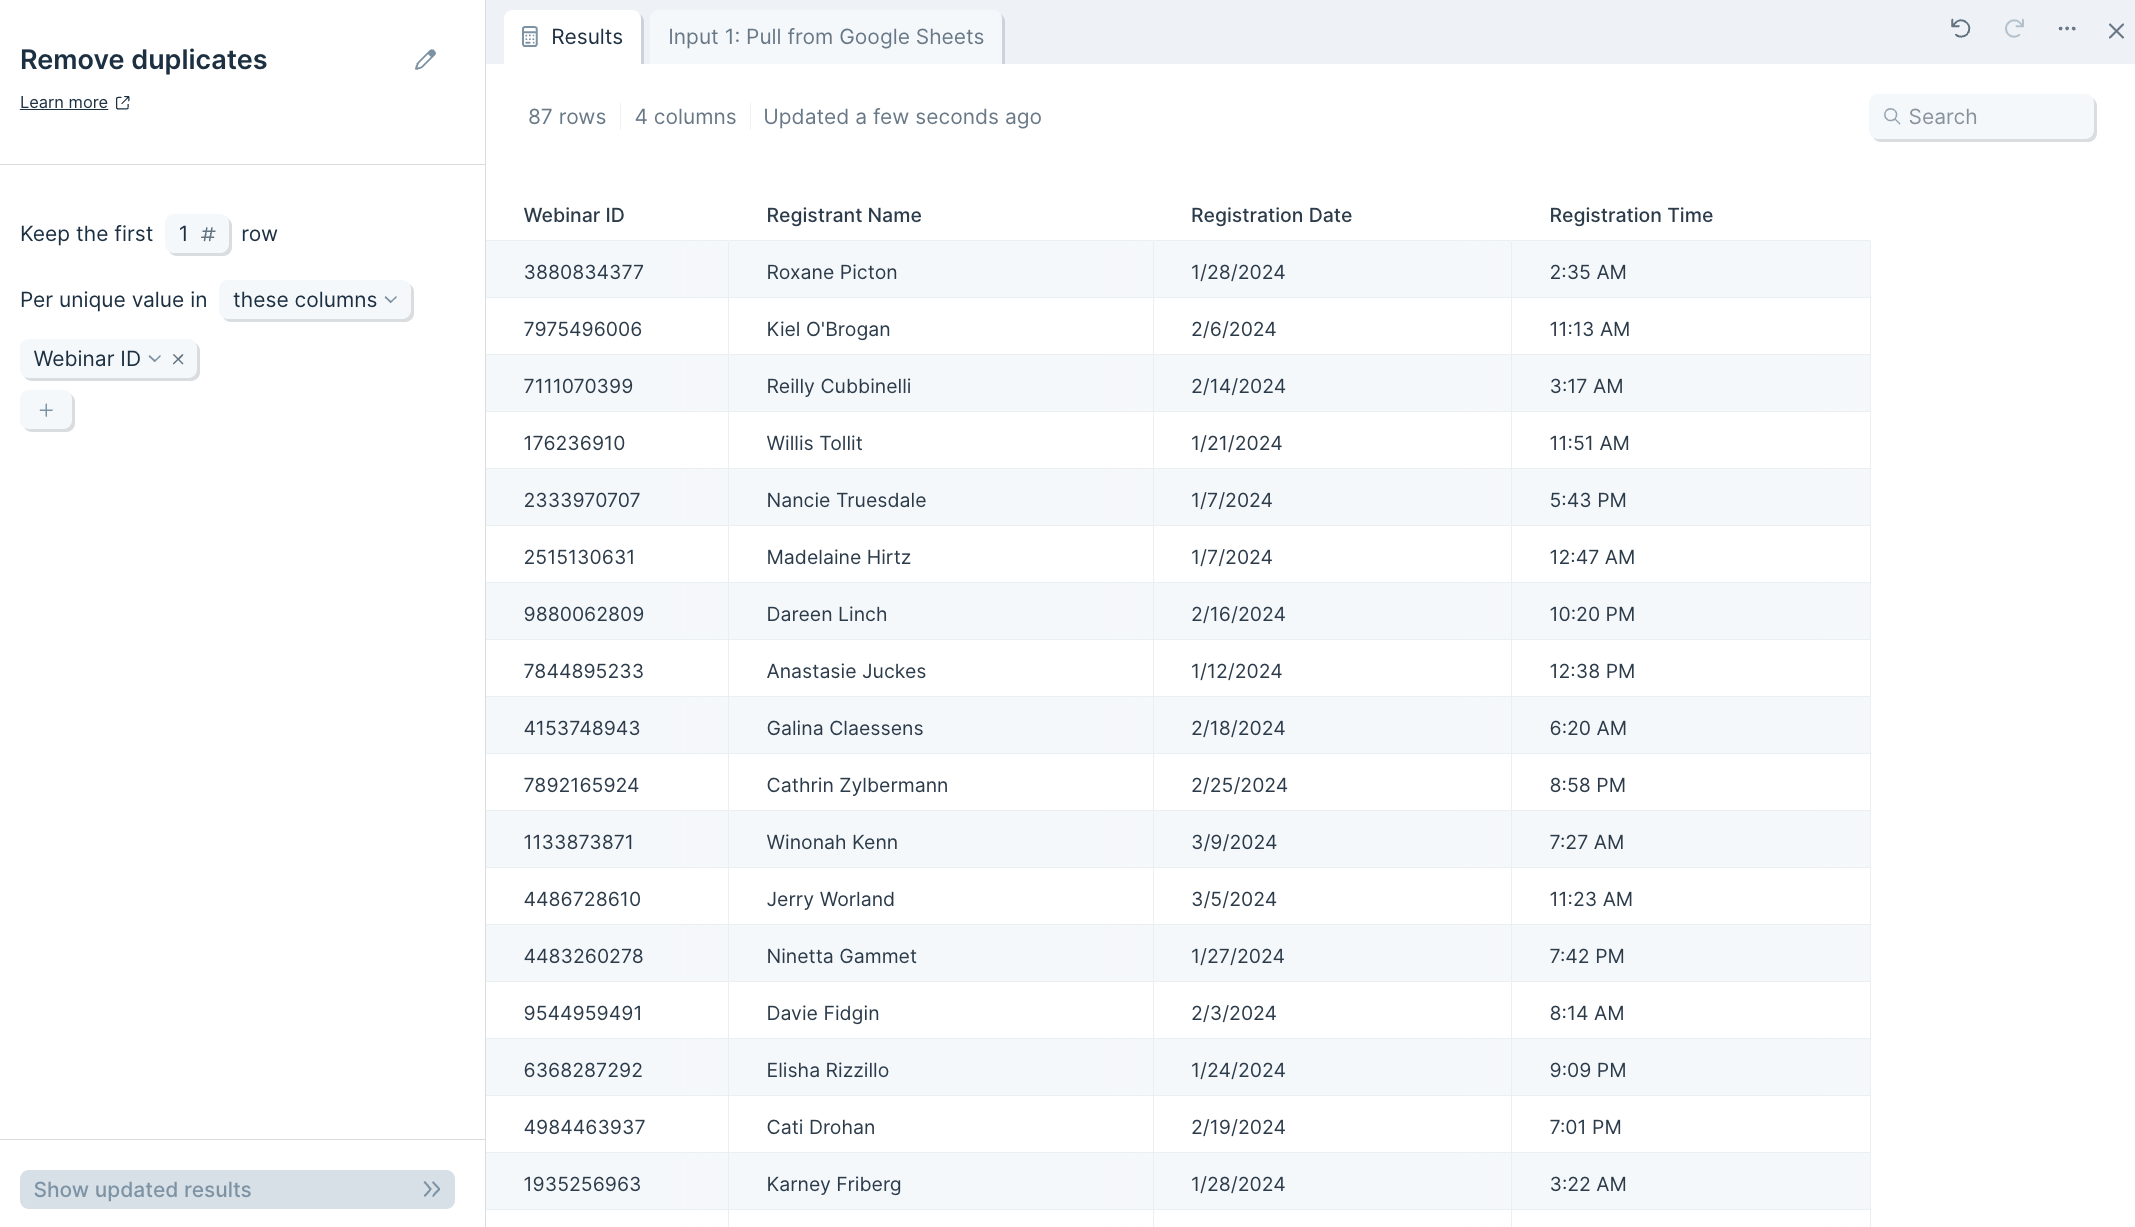
Custom settings
When you connect data into the Remove duplicates step, you'll see a notification at the top of the step configuration that says, Per unique value in these columns: select from menu.
First, select which column to look for duplicates. Clicking into the select from menu dropdown will expand a columns list to choose from.
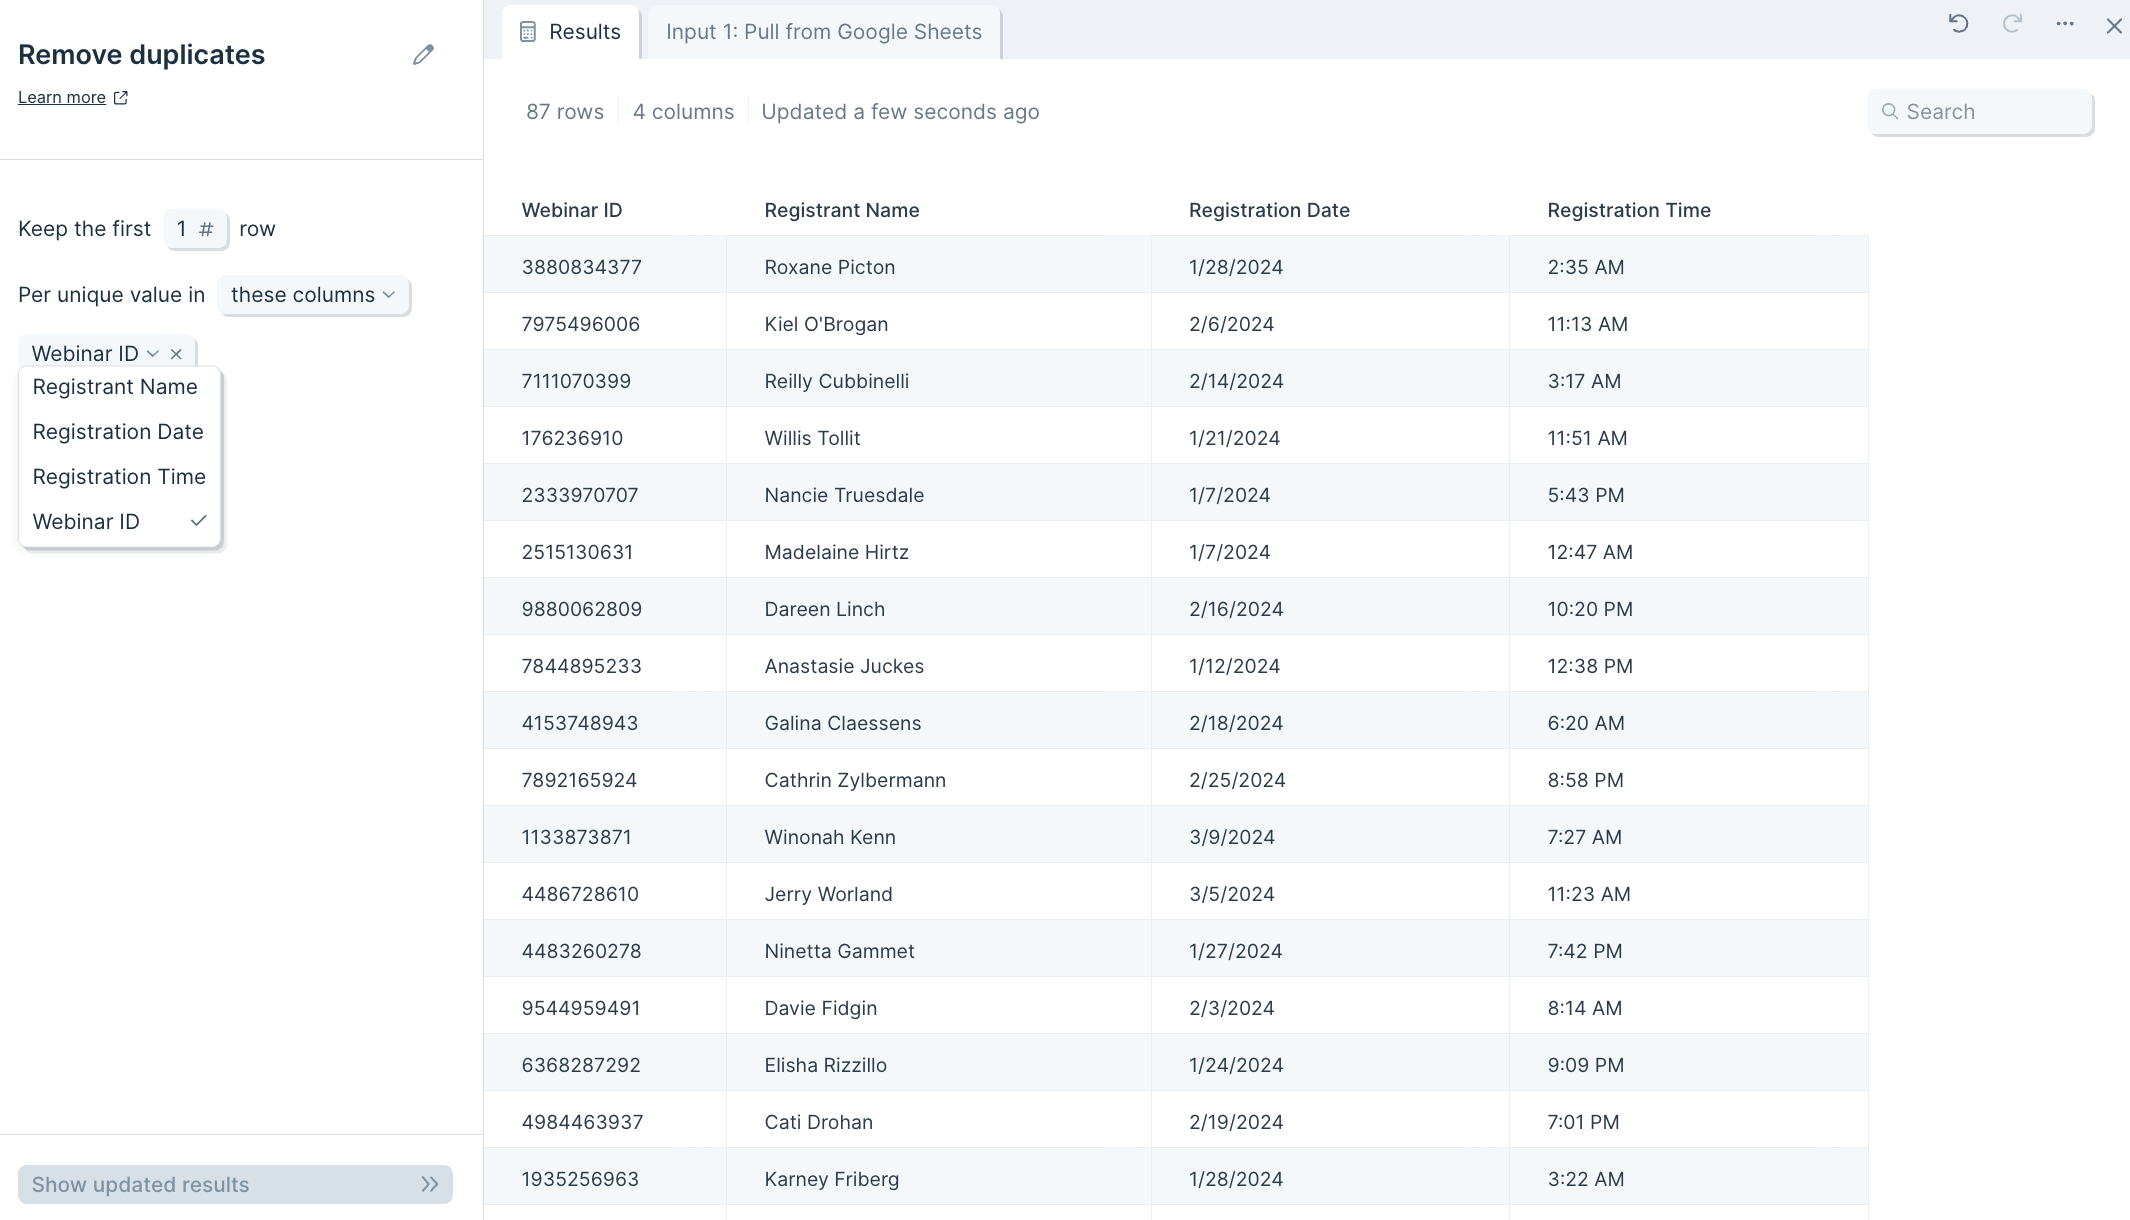
You can also adjust the number of duplicates you'd like this step to keep. By default, this step will only keep 1 row per unique value, though can be changed to whichever number you'd like.
A common task is to take a list of data and keep the first 1, 2, 3 or N number of entries depending on a certain order. For example, say we wanted to take our list of webinar registrants and keep the first 2 registrants per webinar to recognize the customers who registered early. First, we'll make sure that the input data is sorted by "Registration time" where the oldest times display at the top. We would then update the Keep the first _ to 2 and you'll see, as opposed to the example above, it keeps 2 rows per Webinar ID.
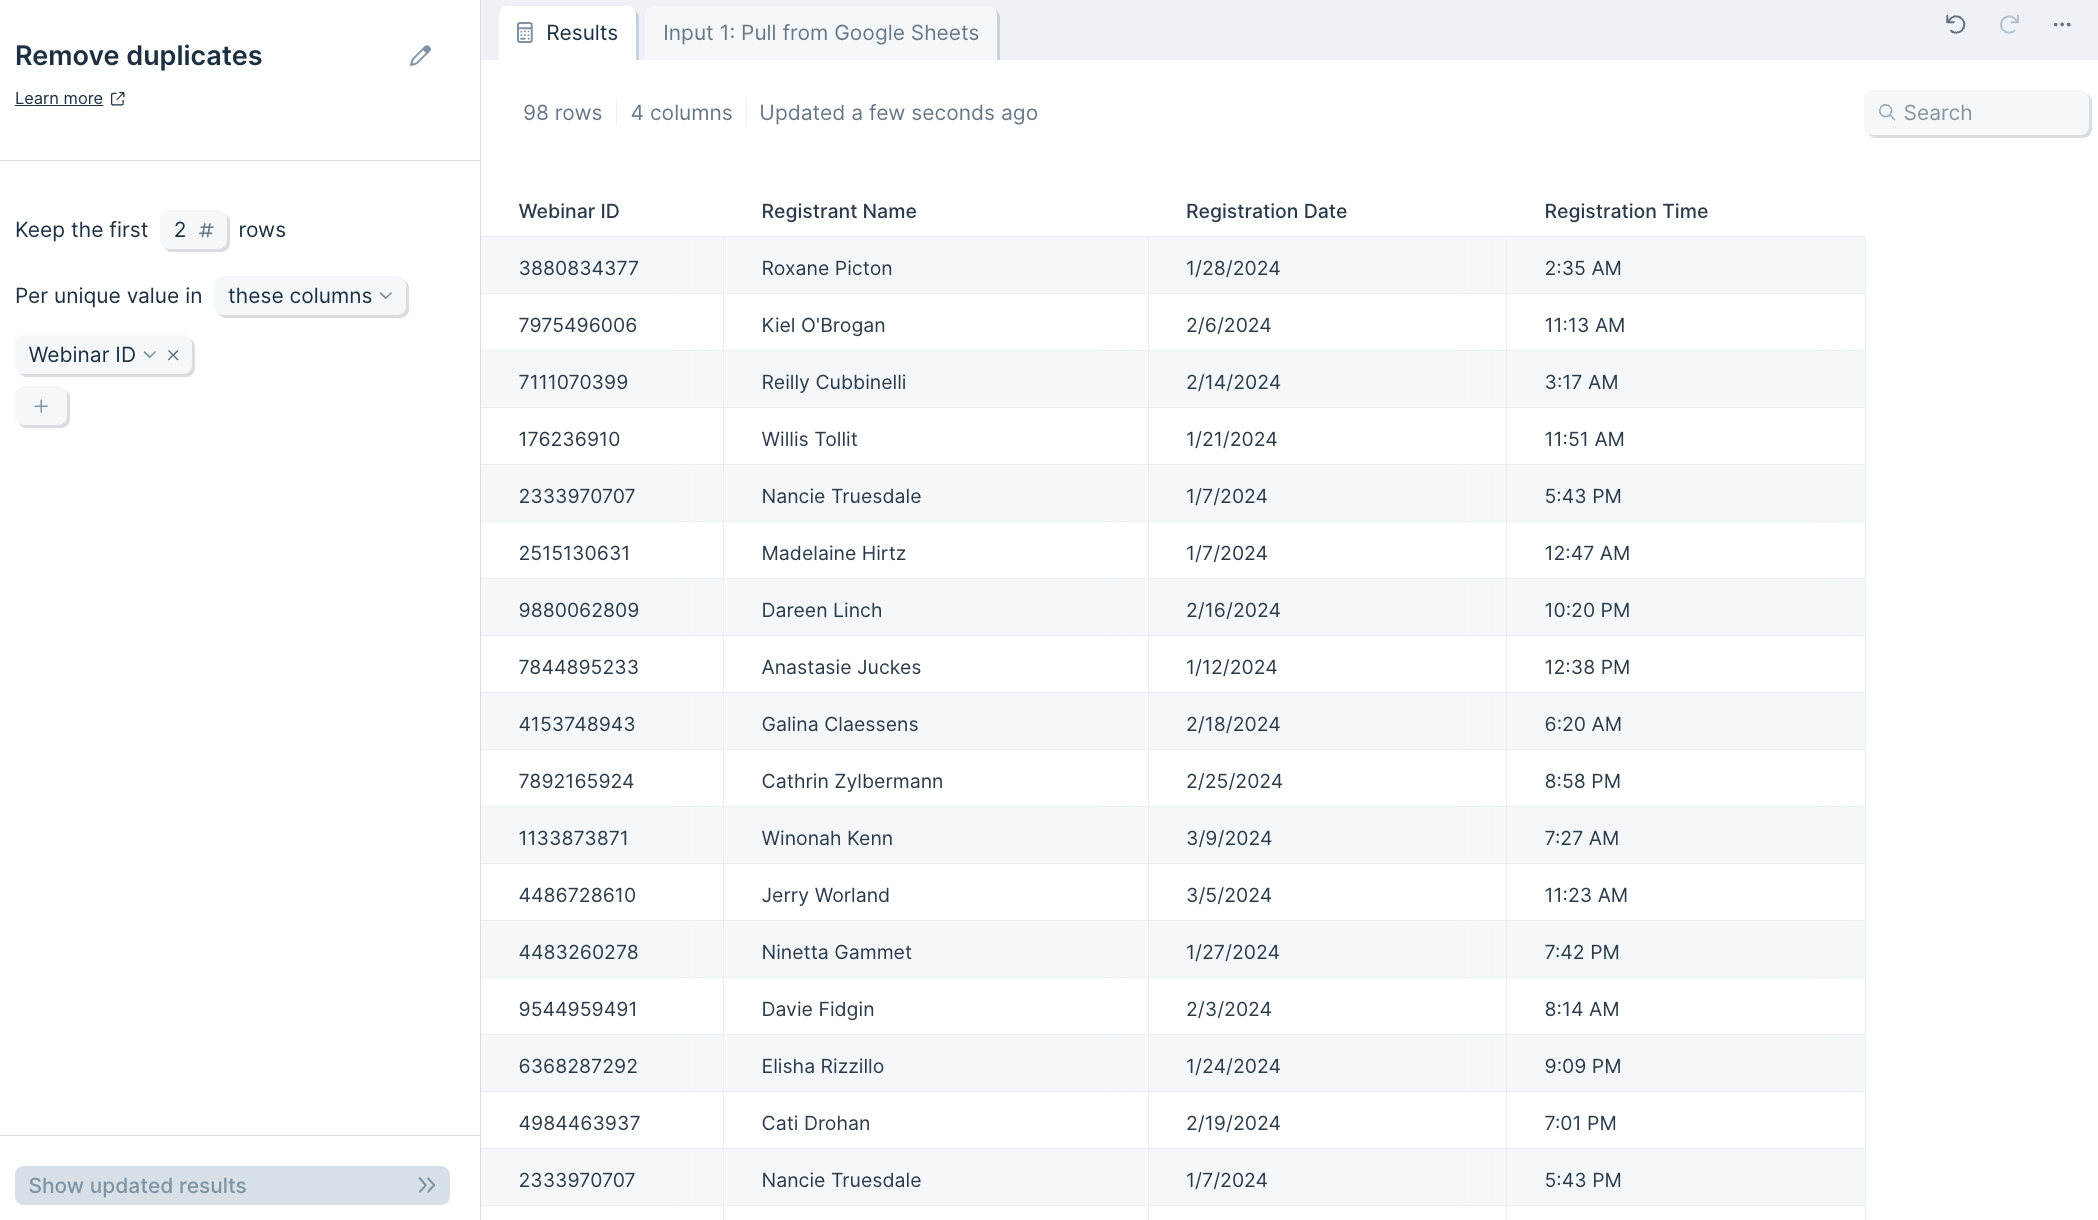
Helpful tips
- If you want to dedupe based on data existing across two or more columns, use a Combine columns step before the Remove duplicates step. This creates a column that has the values across your columns. You can then select that newly created column in your Remove duplicates step.
Transform step:
Rename columns
This step is now part of the Edit columns step. If you are using this step in an older Flow, it will continue to work but will not be available for new Flows.
Input/output
Our example input data has orders data that informs us of the units sold per product variant. We have a column called "ID", but we'd need this to be more exact about what "ID" this actually is for our colleagues.

We can use the Rename columns step to give the "ID" column a more descriptive column name, such as "Variant ID".

Custom settings
The configuration for this step is thankfully very simple. Start out by selecting the column you'd like to rename from the dropdown link select from menu and provide a new name in the type value... field. Select Show Updated Results at the bottom of the step settings, and you're all set to go!
Helpful tips
- You can add as many rename rules as you need by clicking on the Rename Another Column link below the step's first one.
- If you have to rename a lot of columns (10+) or the columns have ambiguous names that are difficult to locate in the select from menu dropdown, you could create a CSV file with the desired names as headers (with no row data). Then, you can use the Stack tables step to combine this headers table at the top with the rest of your main data underneath.
Transform step:
Reorder columns
This step is now part of the Edit columns step. If you are using this step in an older Flow, it will continue to work but will not be available for new Flows.
Input/output
In this example, the input data we'll use has orders information that displays the units sold per product variant. However, our columns are in a randomized order that's difficult to understand quickly.
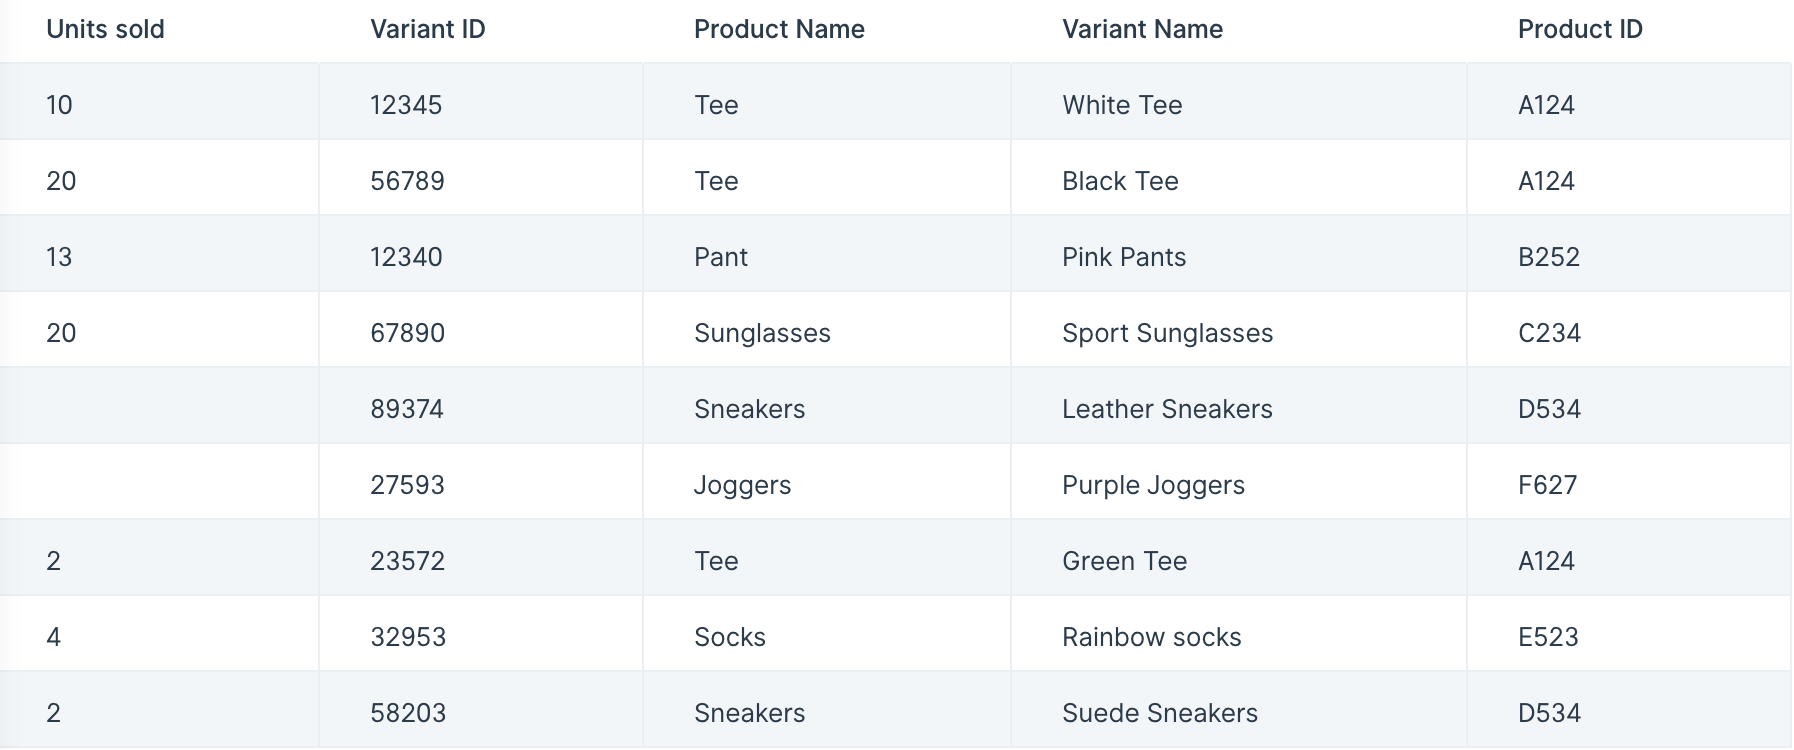
We can use the Reorder columns step to move our columns into whichever form that makes the most sense to us. As seen in the below screenshot, we've grouped our product data together with the variant data, and then placed the "Units sold" column at the very end (right-side).
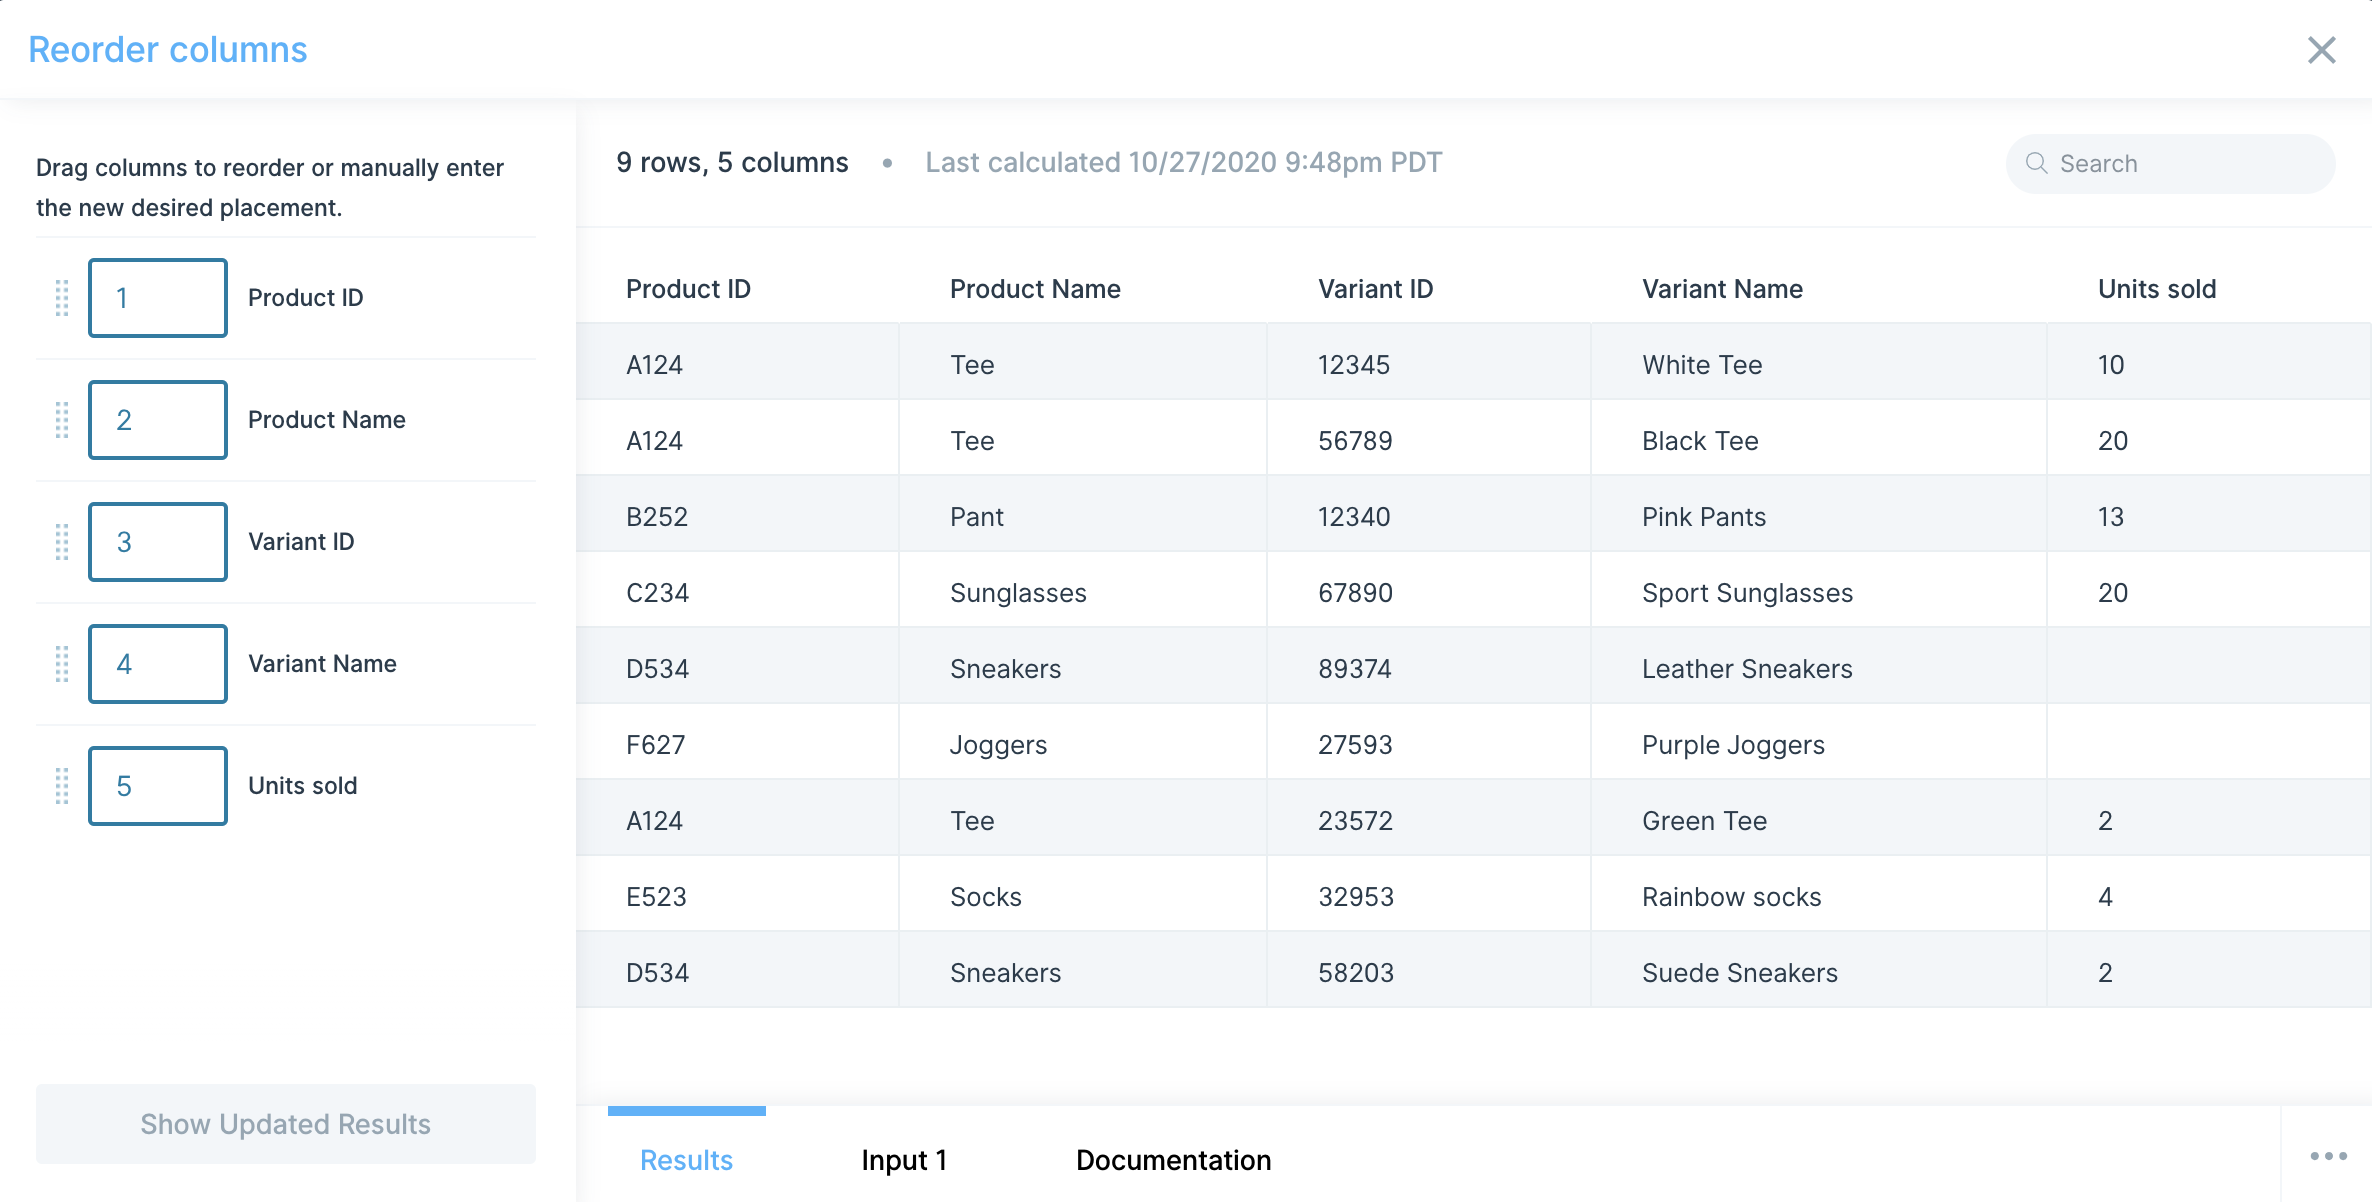
Custom settings
When you first connect your data into the Reorder columns step, it'll display your columns in their original order.
You can click down on a specific column and drag it into the desired placement. You may also type in a number representing the position of the column. The placement of the other columns will automatically update based on your input.
Transform step:
Replace with Regex
The Replace with Regex step matches patterns using Regular Expression to find or replace values. Regular Expressions, or RegEx for short, are useful for matching patterns in text or numbers (or anything, really). RegExr.com is an excellent resource to use when composing your regular expression.
Before you jump in... We recommend exploring the "Extract text from column," "Find and replace," and "Clean data" steps. These steps are often able to accomplish the same result without writing a Regular Expression.
Input/output
For our input data, we'll use a list of nine Webinar IDs. The number displayed after the hyphen "-" is the number of attendees that can sign up for the Webinar. We're looking to extract the Webinar ID and display it in a new column.
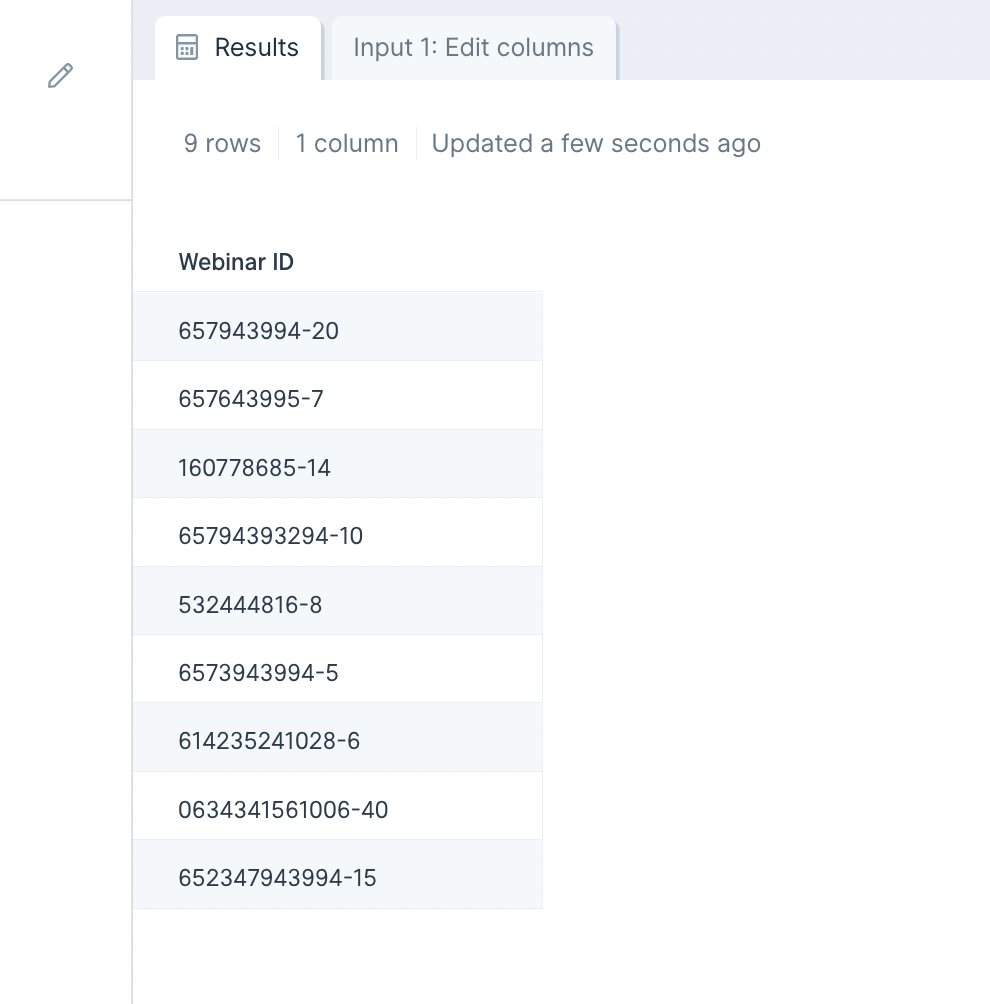
Our output after using this Replace with Regex step is a new column "Remove Attendee Count" with the numbers that display before the hyphen in the original Webinar ID values.
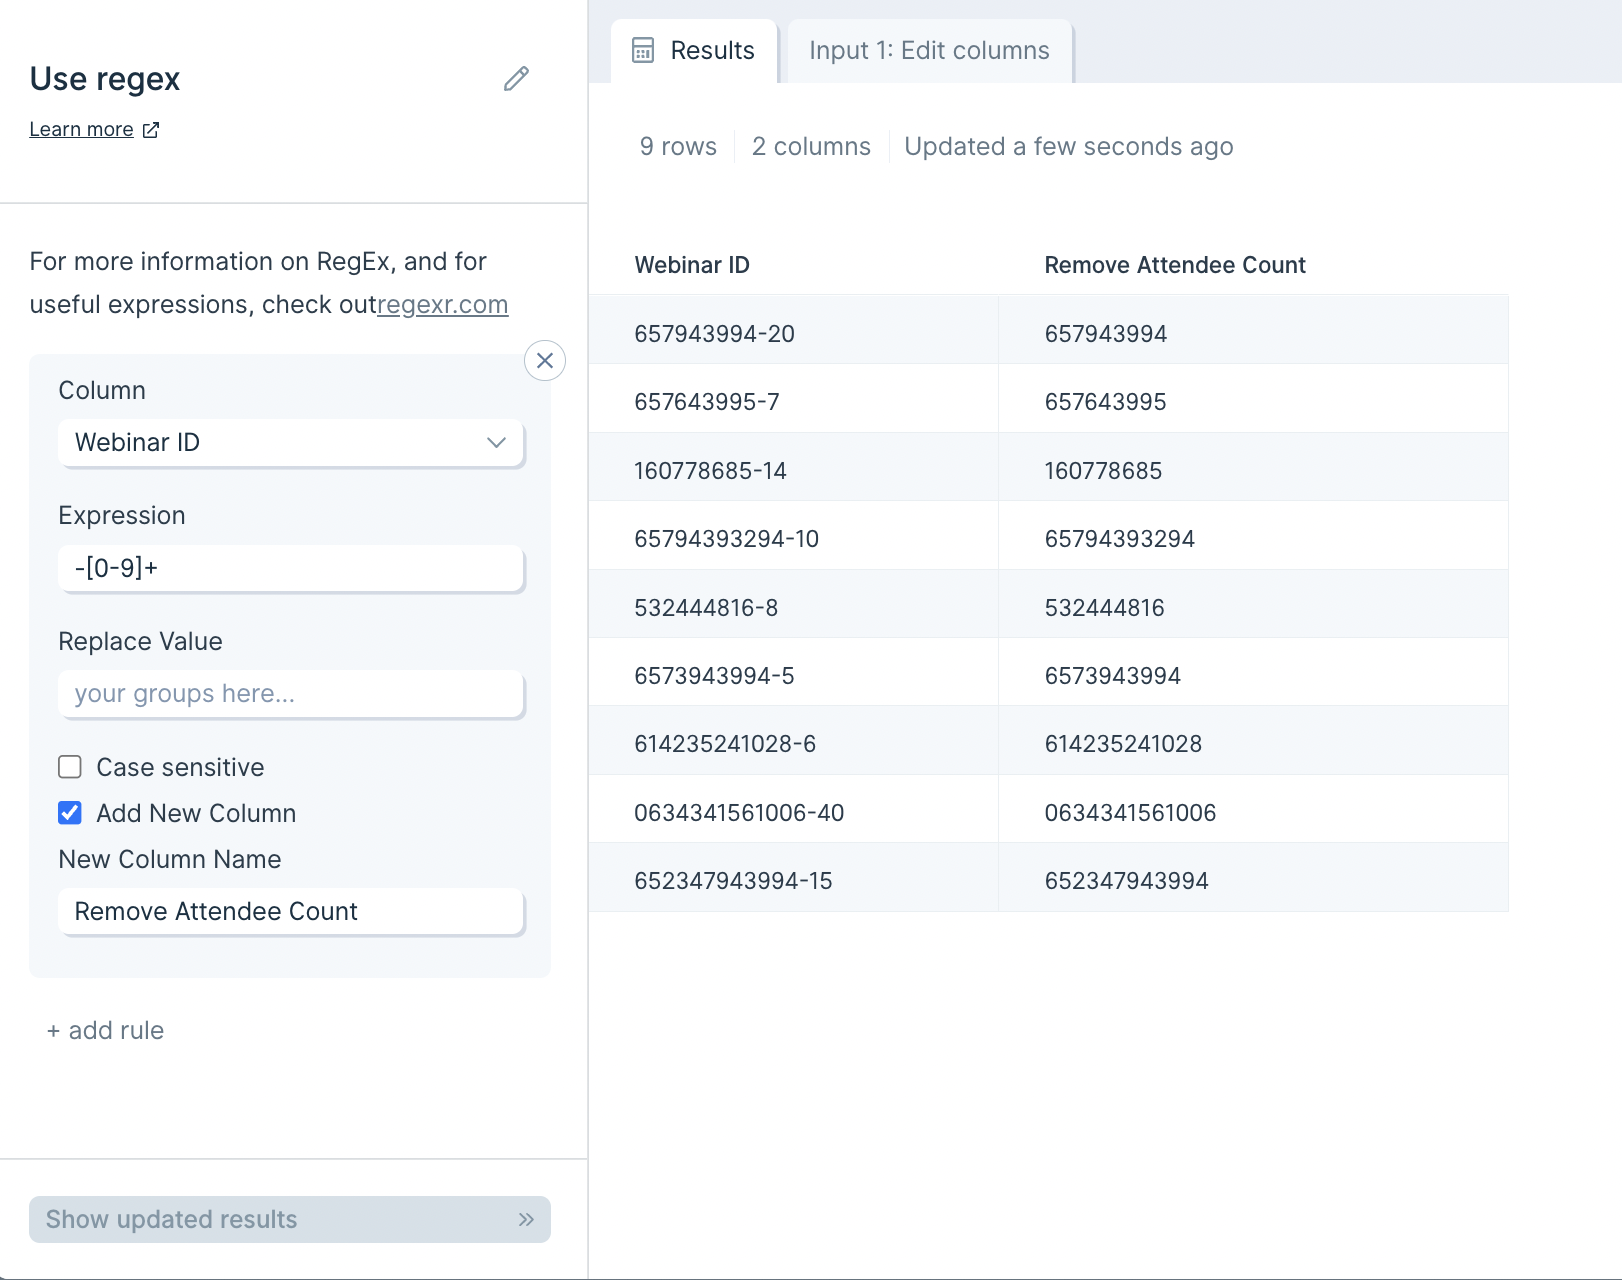
Custom settings
To start configuring your first rule, you'll select the column we should apply the RegEx too. You can also select to search through All from the Column dropdown.
Then, input the expression we should look for in the Expression field.
If you'd like to replace the value with something specific, put that value in the Replace Value field. In my case, since I wanted to remove the found expression and only retain the remaining number, I left this field blank.
You can click the checkbox to "Add New Column" if you want to preserve the original data column but display the extracted value in a new column. In my example, I selected to "Add New Column" and placed my column name, "Attendee count" in the New Column Name field.
You can create as many RegEx rules as you'd like in a single Replace with Regex step. To do so, click the button to "+ add rule".
Helpful tips
Again, we recommend RegExr.com as a useful tool when working with RegEx. We particularly find their "Community Patterns" section useful where you can find RegEx patterns that others have used before.
You can also consider experimenting with AutoRegex.xyz, which is a useful app that uses GPT-3 to convert plain English to RegEx.
Characters
- . any character, except a newline
- \w any word
- \d any digit
- \s any whitespace
- \W anything except a word
- \D anything except a digit
- \S anything except whitespace
- [abc] any of a, b, and/or c - you can use dashes in here too such as [a-z] or [0-9]
- [^abc] not a, b, nor c - you can use dashes in here too such as [a-z] or [0-9]
- [a-g] any character between a and g
- [0-5] any digit between 0 and 5
Quantifiers and Alternators
- a* any amount of the letter a in a row. 0 or more
- a+ 1 or more of the letter a in a row
- a? 0 or 1 of the letter a
- a{5} exactly 5 of the letter a in a row
- a{2,} 2 or more of the letter a in a row
- a{1,3} between 1 and 3 (inclusive) of the letter a in a row
- a+? 1 or more of the letter a in a row, but match as few as possible
- a{2,}? 2 or more of the letter a in a row, but match as few as possible
- ab|cd match either ab or cd in a cell
Anchors
Anchors help you define how an expression is related to the beginning or end of a cell
- ^abc the cell that starts with abc
- def$ the cell that ends with def
- ^$ a blank cell
Escaped characters
Using a backslash, you can indicate invisible characters, or escape any character that normally has a special purpose
- \. escape a dot so that it is seen as an actual dot
- \* escape an asterisk so that it is seen as an actual asterisk
- \\ escape a backslash so that it is seen as an actual backslash
- \t find a tab in your text
- \r find a newline in your text
- \n find a different type of newline in your text
Groups & Lookarounds
Groups are used to capture bits of text and then interact with them in the replacement function.
- (abc) capture the group that contains abc within a cell
- $1 reference the first capture group (in the "replace" field). Use $2 for the second capture group, etc.
- $& reference all capture groups (in the "replace" field)
- (?:abc) non-capturing group that contains abc within a cell
- (?=abc) positive lookahead
- (?!abc) negative lookahead
Transform step:
Select columns
This step is now part of the Edit columns step. If you are using this step in an older Flow, it will continue to work but will not be available for new Flows.
Input/output
In our input data below, there are four columns: "Variant ID", "Product Name", "Variant Name", and "Sale Price".
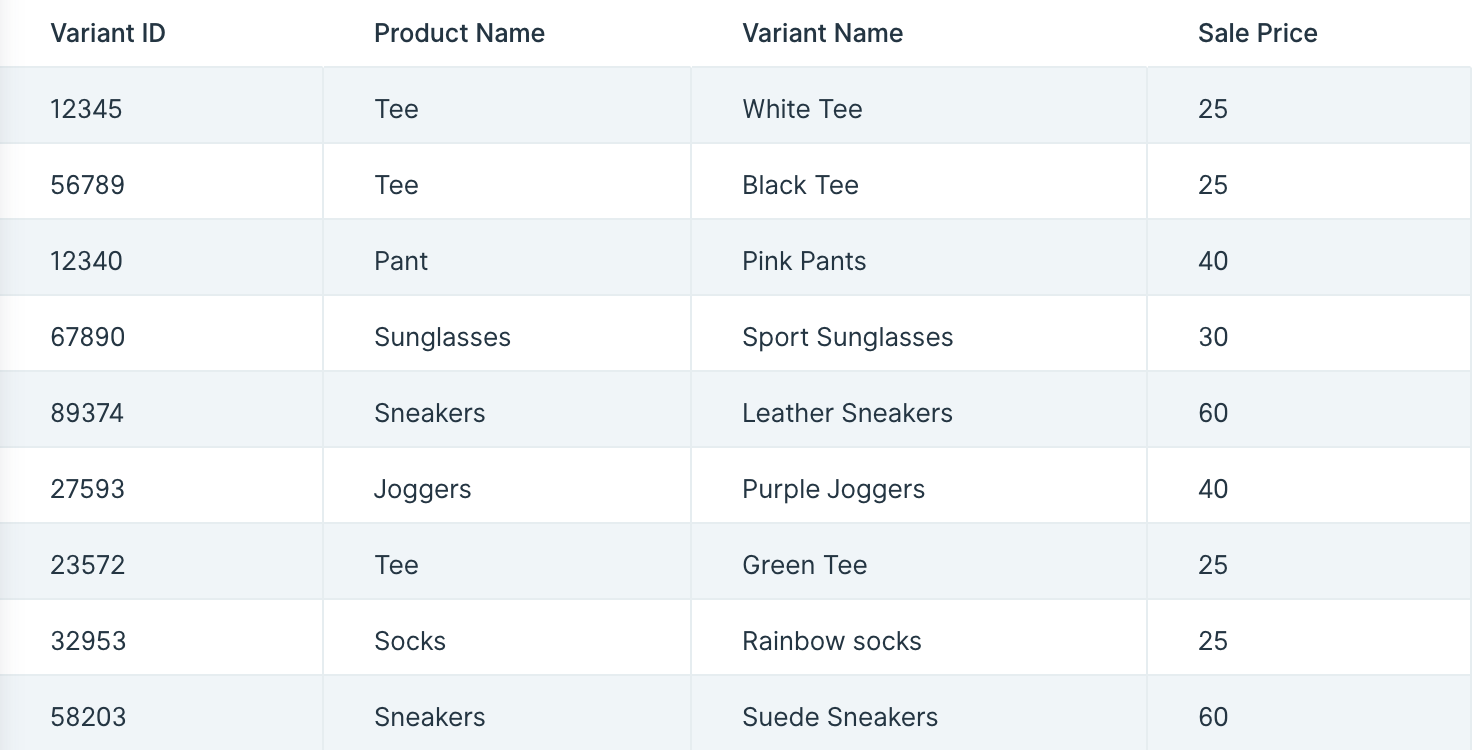
After connecting our data into this step, it produces an output of the two columns selected to keep: "Variant ID" and "Product Name".
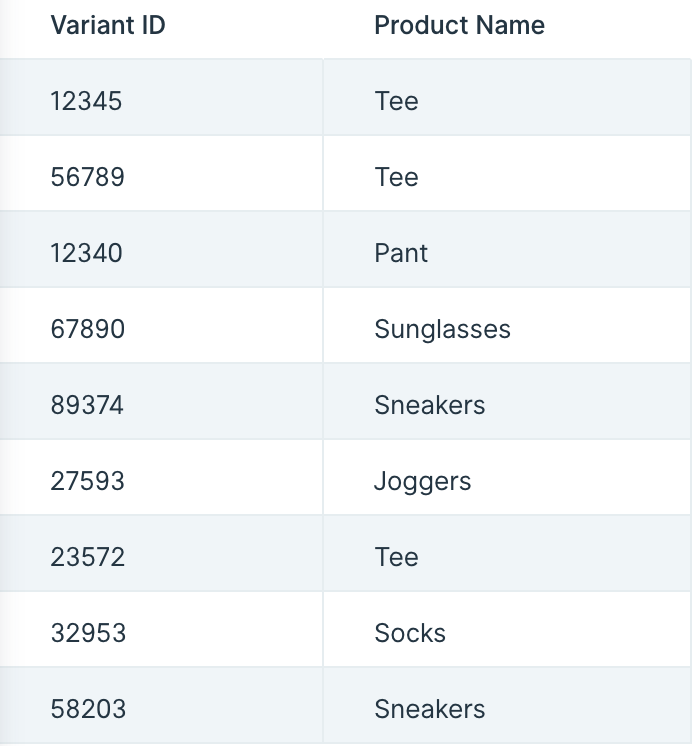
Default settings
When you first connect your data into the Select columns step, it will auto-select to Keep instead of Remove columns. It will also default to keeping your first two left-side appearing columns in a table.
Custom settings
To customize these settings, first decide whether you'd like to keep or Remove columns. We generally recommend selecting the option with fewer columns to select, since this will save you time when finalizing the step's settings.
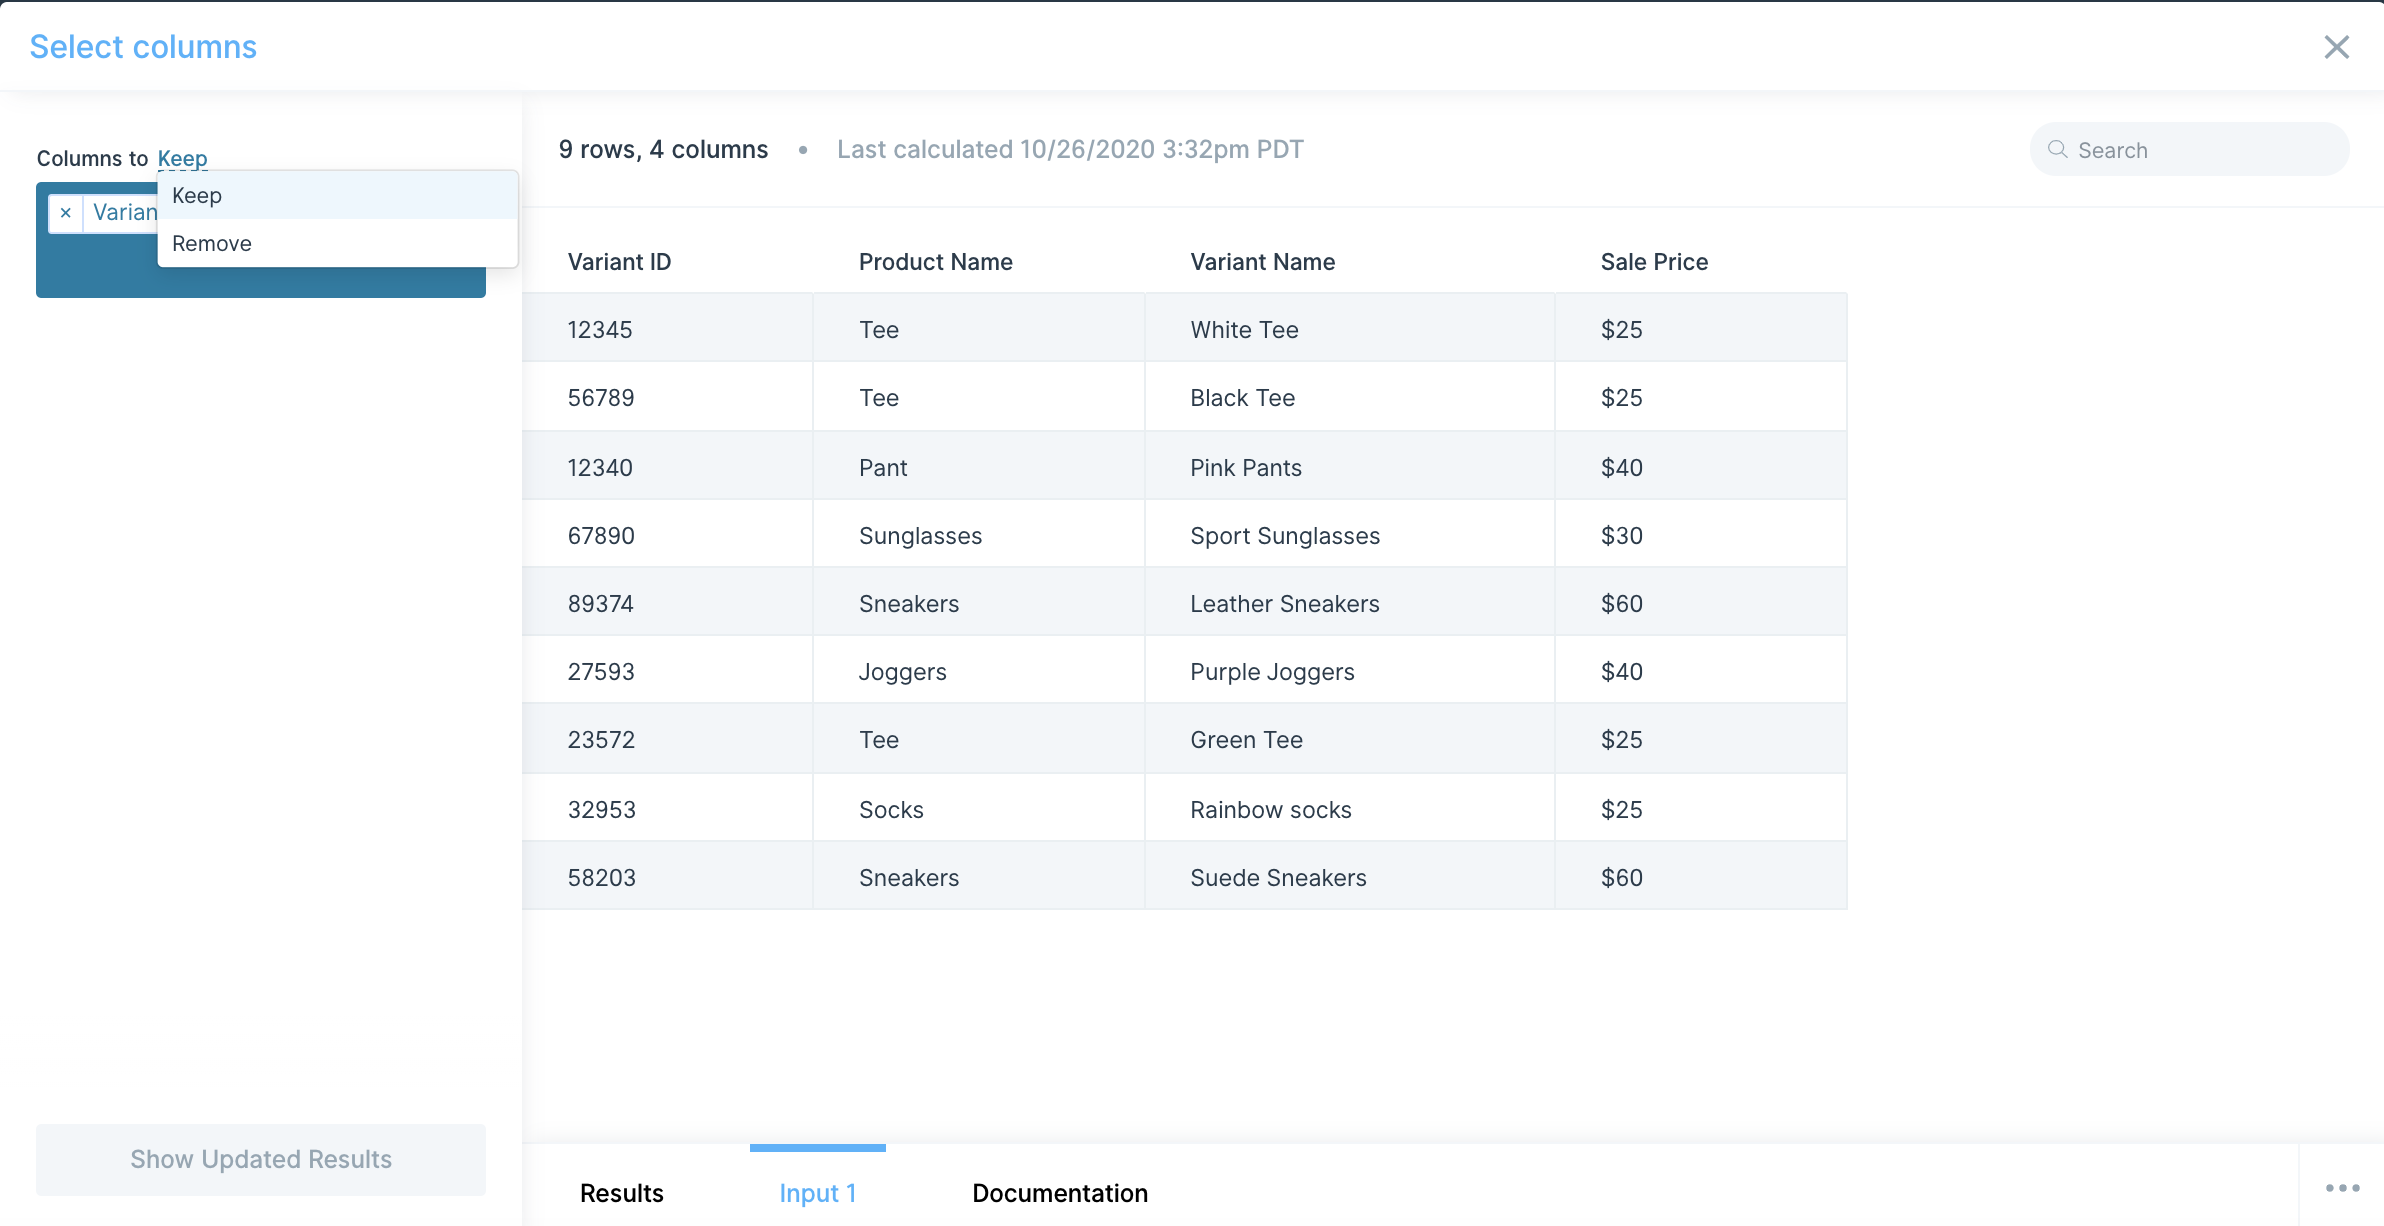
After this, you'll then customize the column selection. Clicking on the blue dropdown box brings up a list of columns. You can select columns directly from that dropdown, or type the name in directly. If a column is selected in the dropdown, you can hit "return" or "enter" on your keyboard to select it.
To remove columns from your selection, click the "x" next to the column name in the blue box or use the backspace key on your keyboard near it.
Helpful tips
- Depending on your data source, usually when working with APIs, the data source's column structure varies. If a column you selected to remove or keep no longer exists in the input, the step will error. Try to Keep or Remove selections in a way that'll focus on the most consistent columns. We generally find that keeping columns are a safer bet. If you hit this error when running your flow, you can use an Insert static text columns step with its advanced setting enabled (to only add columns if it does not exist in your input).
Transform step:
Sort rows
The Sort rows step sorts the entire table in ascending or descending order based on values in the column(s) you choose.
Input/output
The example data we'll connect to this step has a table of 100 webinar registrants.

Let's say we're wanting to view this data with the top being the newest registrants by registration date. We can do this by setting a sorting rule where the values in the column "Registration date" are sorted in Z-A (descending) order.

Custom settings
When you connect data to a Sort rows step, you'll first select a column with the values you're wanting to sort the data by.
You can then choose whether it should be sorted in A-Z (ascending) or Z-A (descending) order.
If you'd like Parabola to ignore blank values during sorting, you can check the box to "Ignore Blanks". Without checking this box, blank values will be considered the lowest value. Checking this box may be useful when sorting your data in ascending order.
If you require multiple sorting rules, click on the Add Sort button to add multiple rules in. The rules are applied top-down, so the first rule will be the first sort, and the second rule will sort entries within each group that has identical values in the column used in the first sort.
In the example below, we're first sorting by "Registration date" in descending order so we can quickly see the most recent registrants at the top. Then, we sort by "Registration time" in ascending order. We'll see that for rows where "Registration time" is 3/20/2024, the "Registration time" is properly sorted in ascending order.
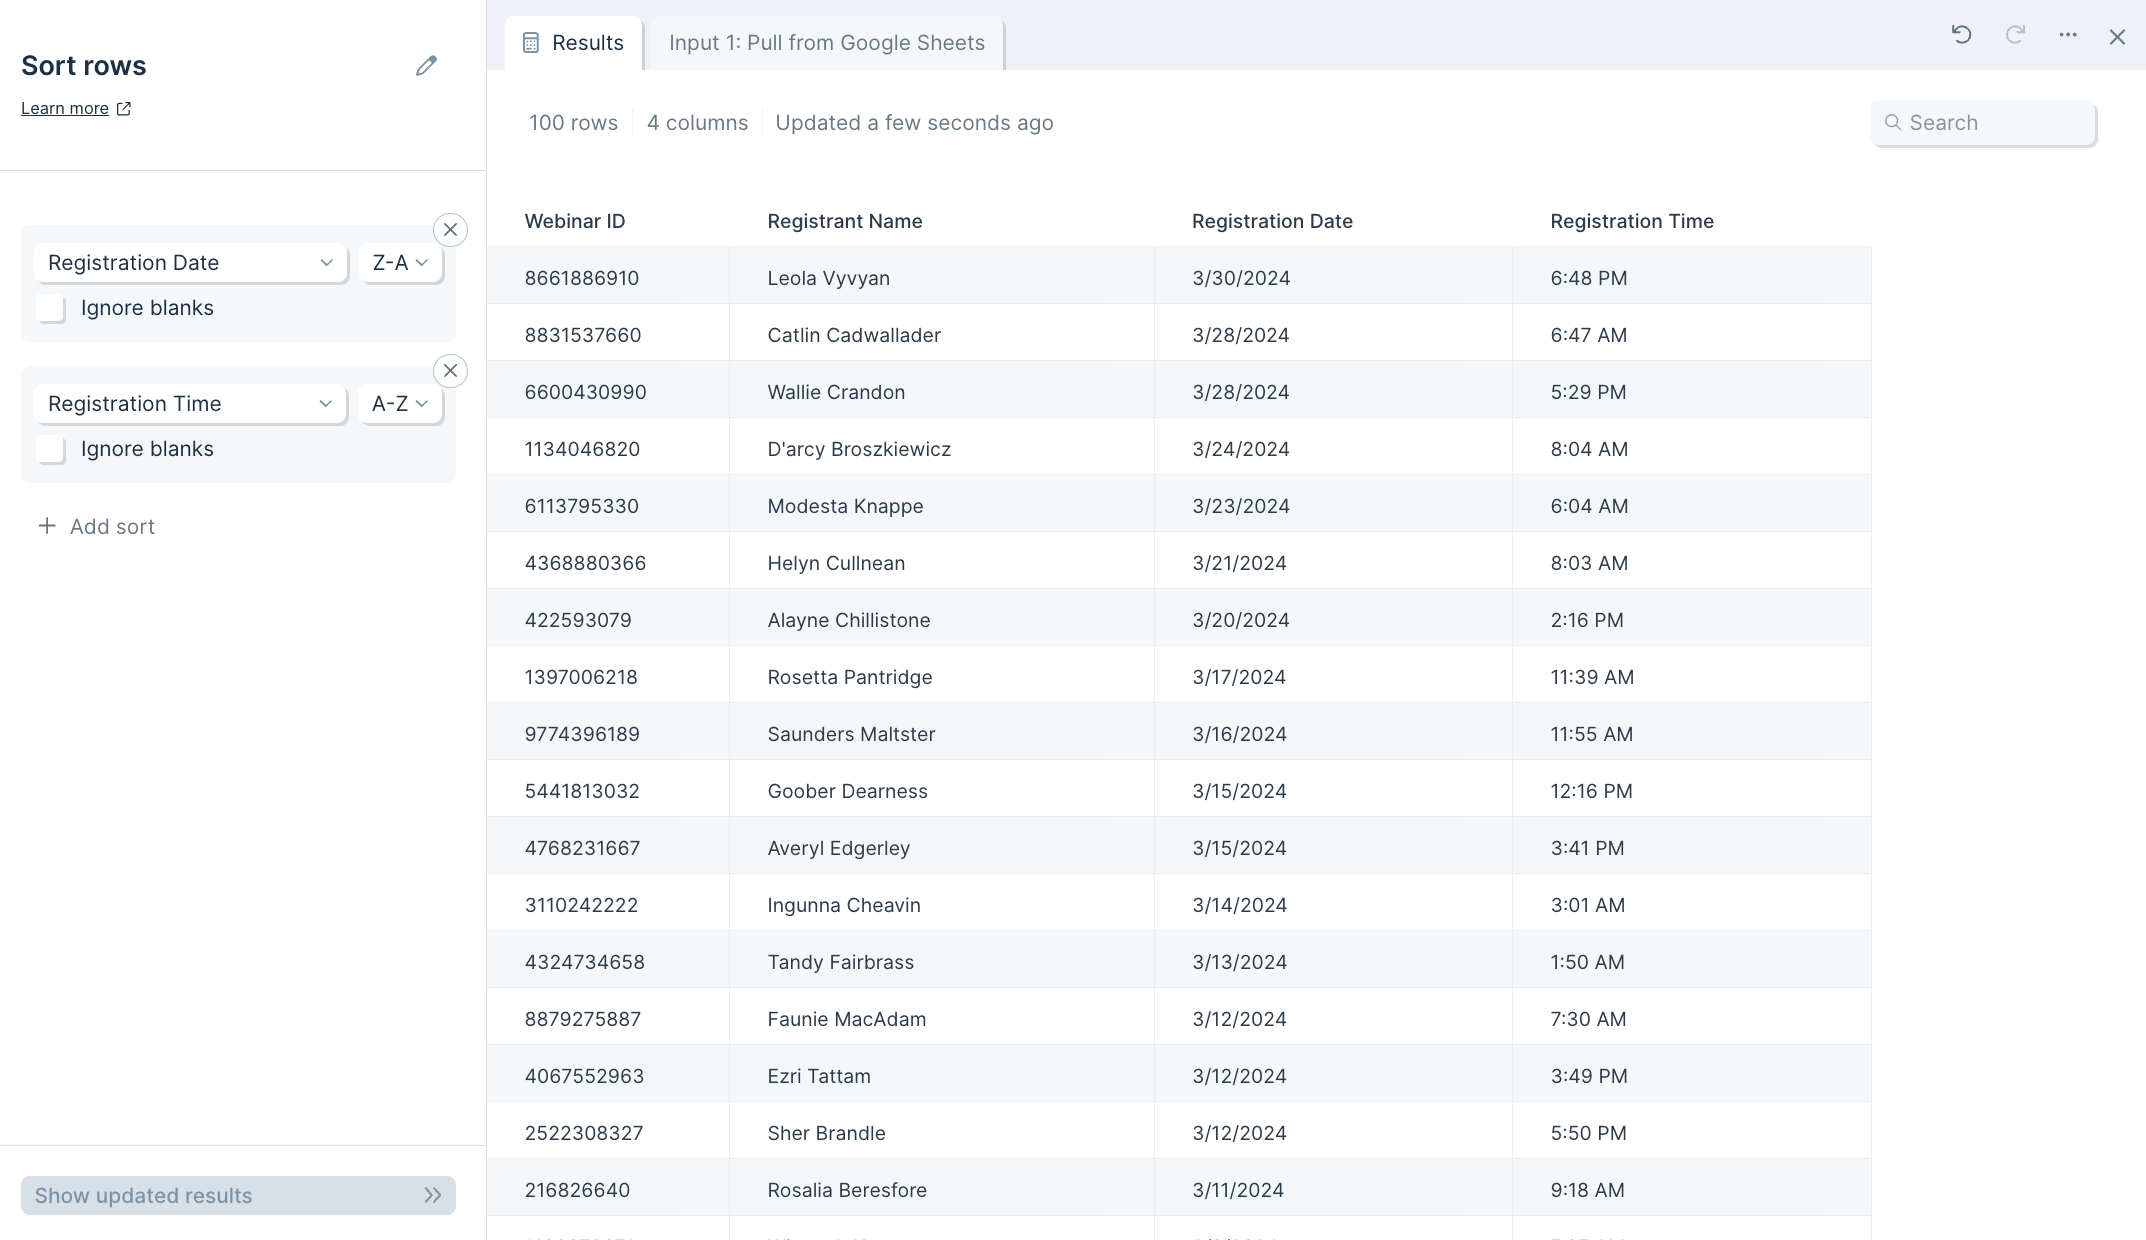
Helpful tips
- A key concept to remember when sorting data in Parabola is that you are sorting rows, and not cells.
- Ambiguous dates (such as MM/YYYY) are difficult to sort. Try using a Format Dates step to convert your dates into a less ambiguous format before sorting.
Transform step:
Split column
The Split column step splits a column into one or more based on a specified delimiter, such as a comma.
Input/output
Our input data below is a single column called "Data".
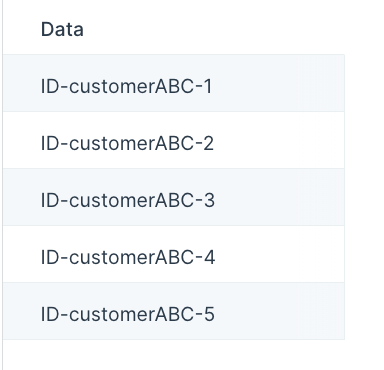
We'll use the Split column step to split this single column into three different columns using the delimiter of a dash mark "-". The output data will look like this:
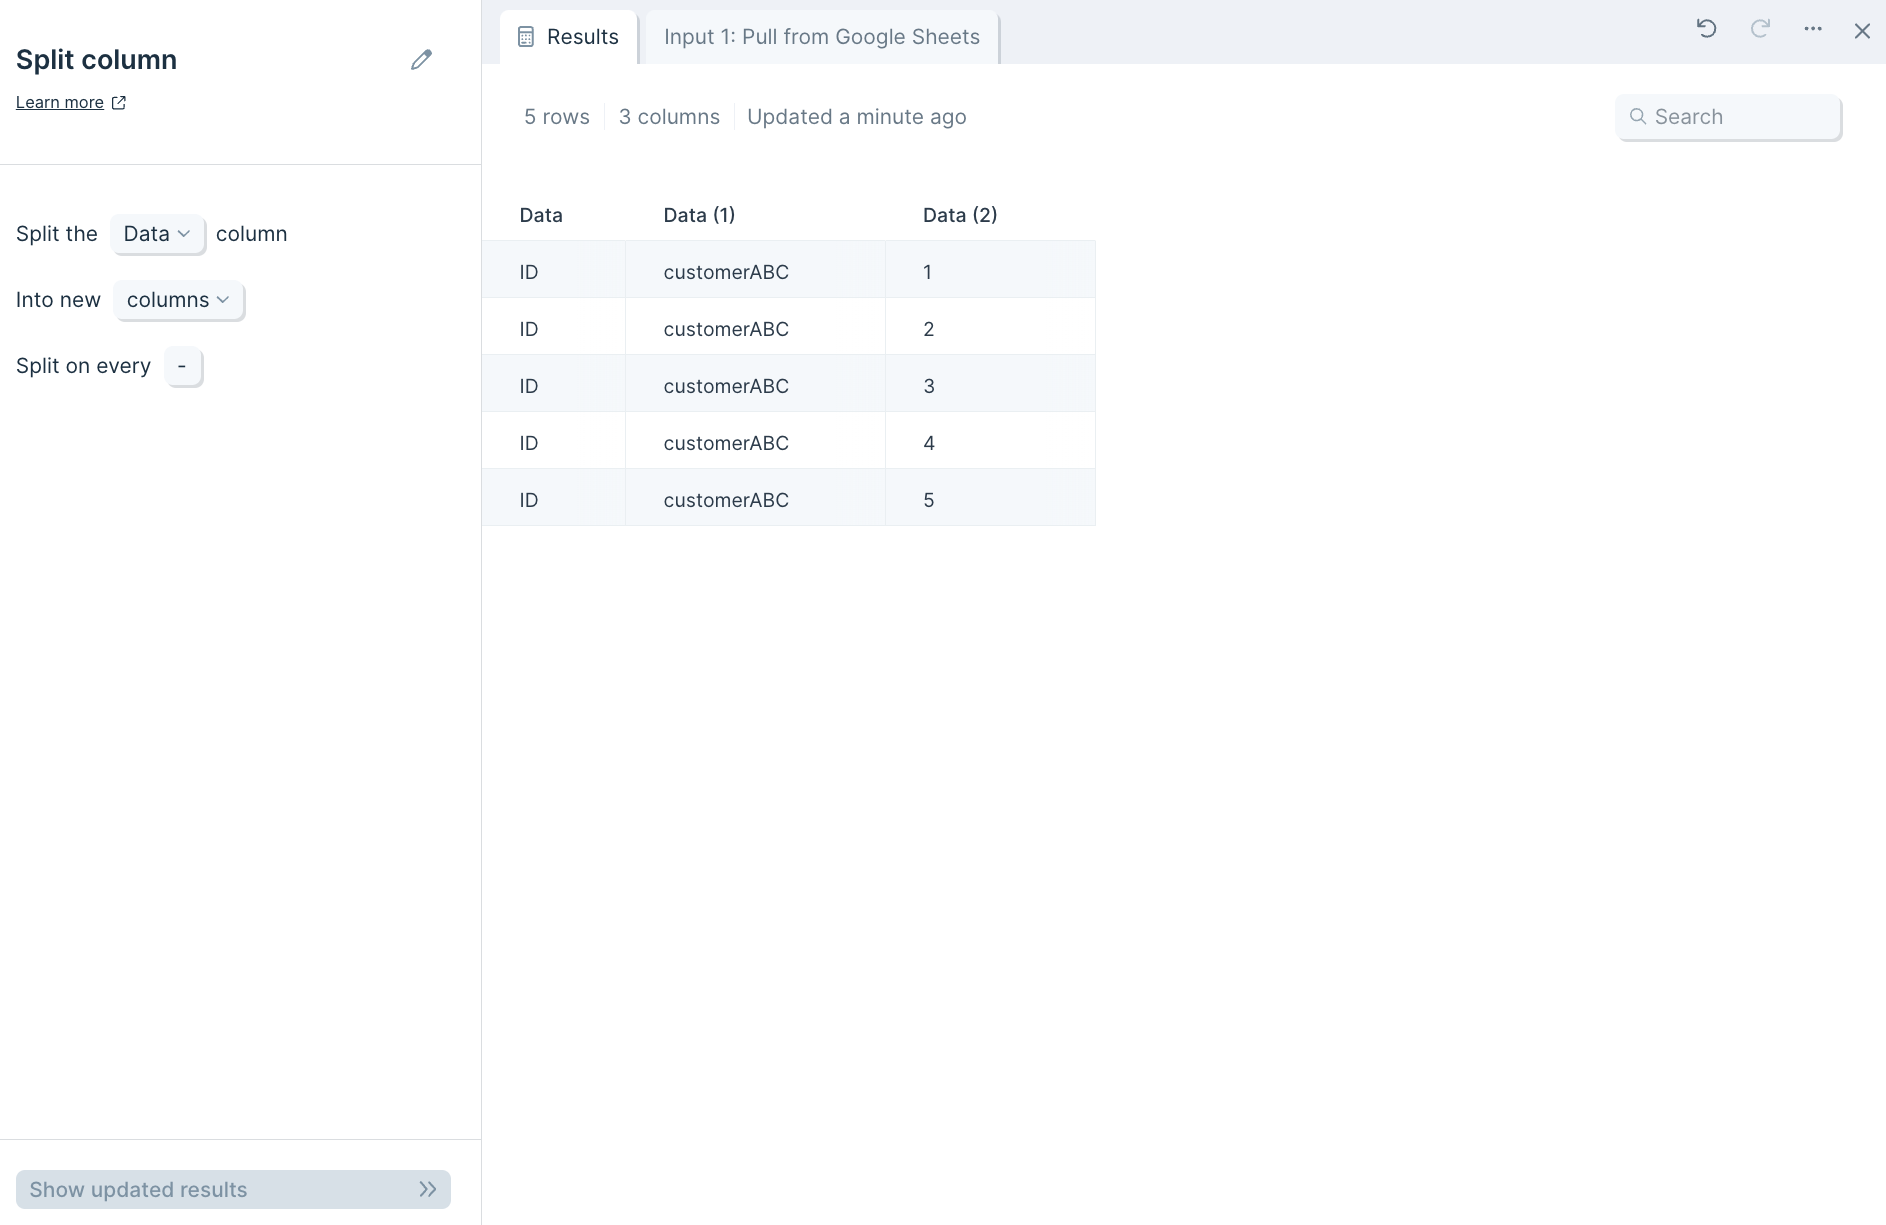
Custom settings
First, in the dropdown select from menu, choose which column to split into one or more.

Next, decide if you'd like your data split into new columns or rows by clicking into the linked dropdown menu columns.
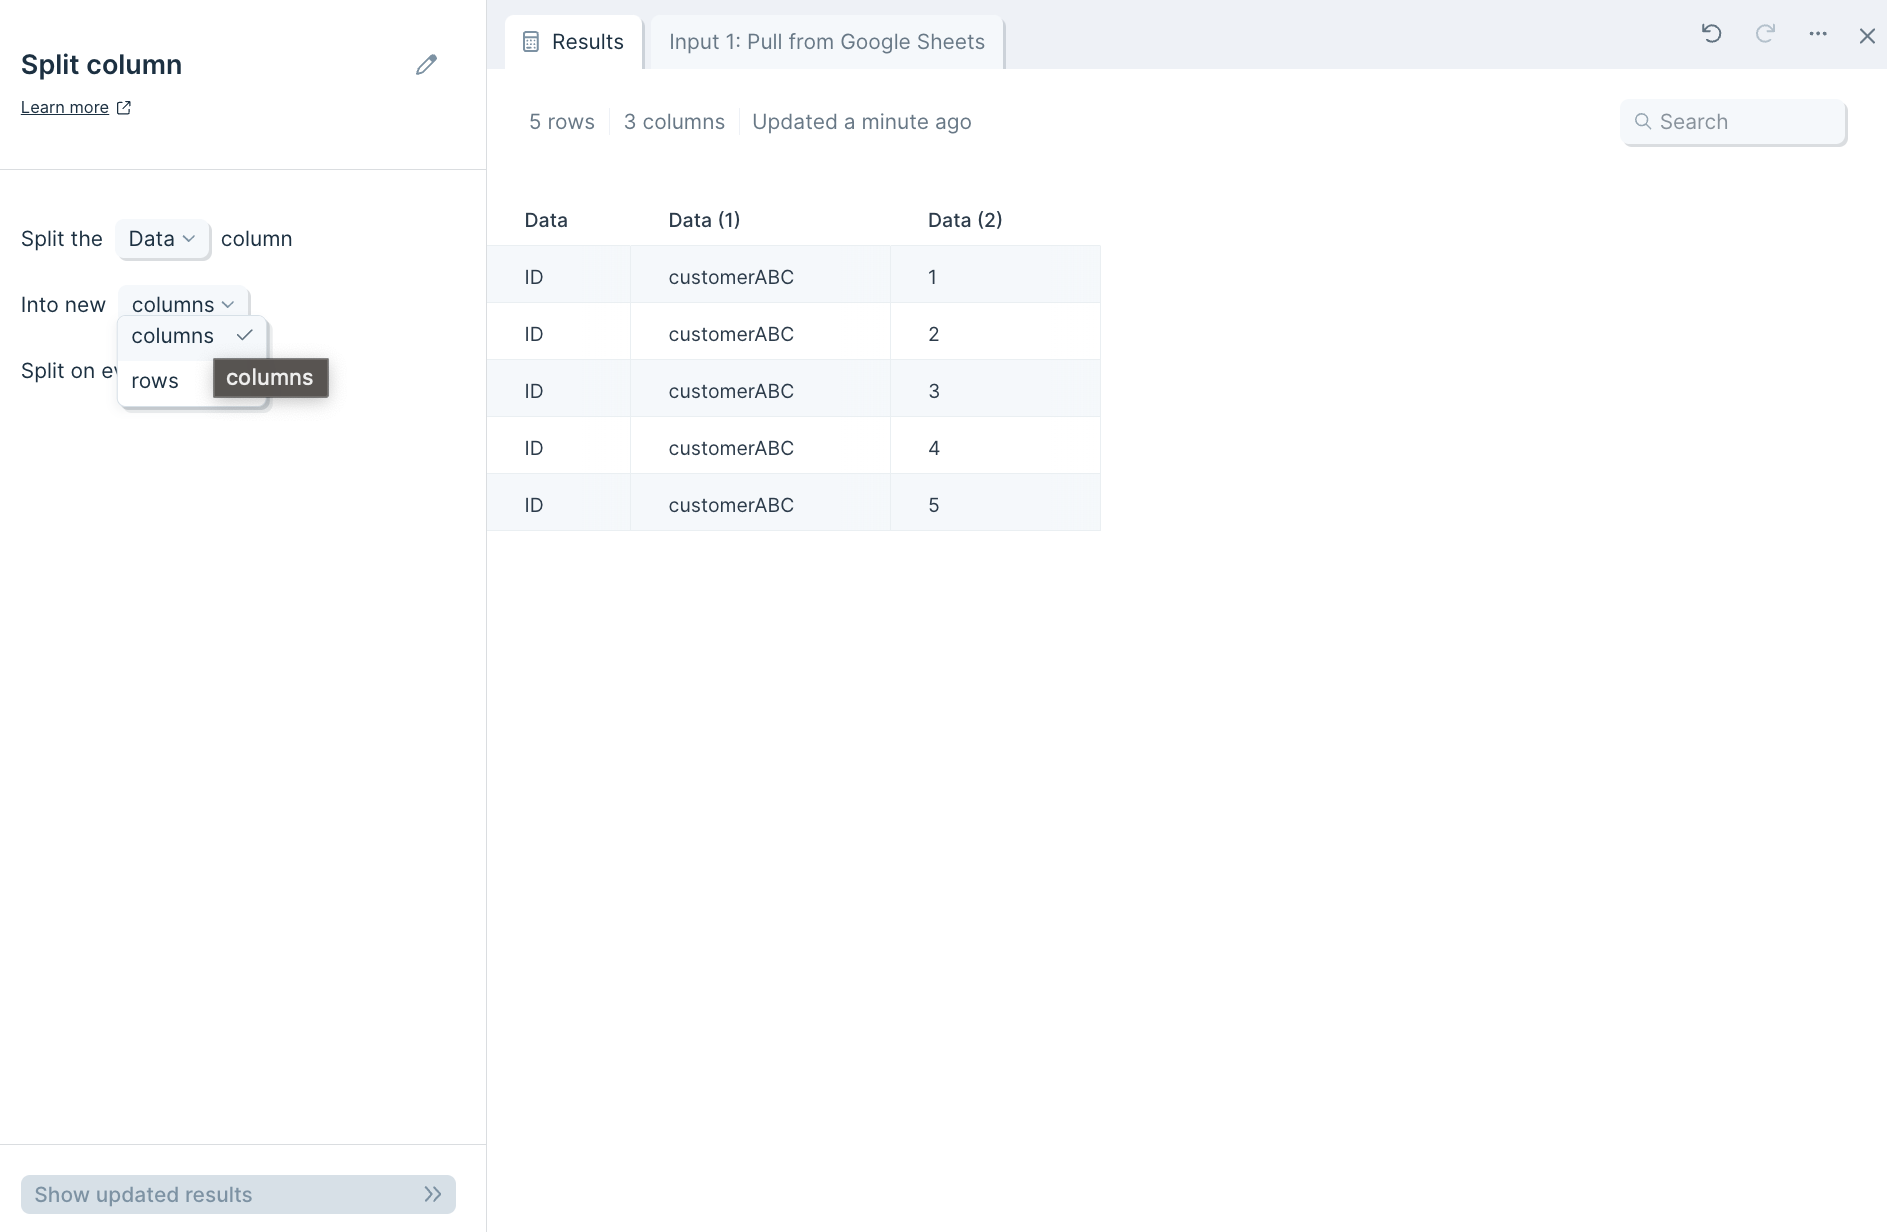
You can separate a column's value based on any delimiter by typing into the section type value... whether it be a comma, semi-colon, dash, space, number, letter, or special character. In our screenshot examples, the "Data" column is split into three columns based on a dash mark -.

Helpful tips
- If you'd like to join a dataset using this step to another one based on the step's newly-generated column output and choose to separate values by a comma, be sure to include the space after the comma in order for values to start with the letter or number. For example, splitting apart a column of orders like "shirt, pants, hat" by the comma without a space — like (,) versus (, ) — will create the output of rows "shirt", " pants", and " hat".
Transform step:
Split names
Use the Split names step to split a full name value into smaller parts (first, middle, last, etc.).
Input/output
Your input data should consist of a column of full names.

Your output will have multiple new columns of your names, separated into their parts, depending on the parts of the name you chose to split.

Custom settings
First, select the column that has the names you'd like to split by selecting it in the Column to Parse dropdown.

Next, pick the category that you want your full names broken down into by selecting them in the Choose Parts of Name dropdown.

You can select multiple parts in this dropdown, including Salutation, First Name, Middle Name, Last Name, Suffix, and Full Name.

If you select a part that does not exist in a name, the row's column will appear blank.

Helpful tips
- Names ending in a comma may not be parsed.
- Names such as "Mister" may be parsed as the salutation, as opposed to the name.
Transform step:
Stack tables
The Stack tables step provides the ability to vertically stack any table(s) on top of one other.
Input/Output
The Stack tables step needs at least two data inputs. In the example below, we have two tables that both have the columns "Product Name" and "Food Type".
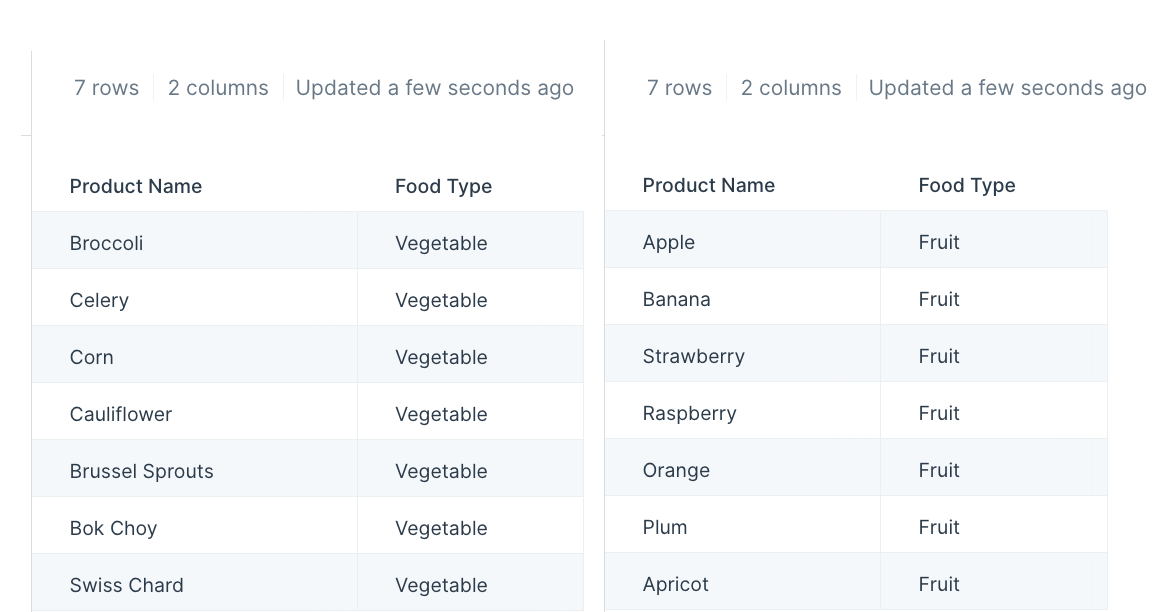
After using the Stack tables step, these two tables are now stacked one on top of the other.
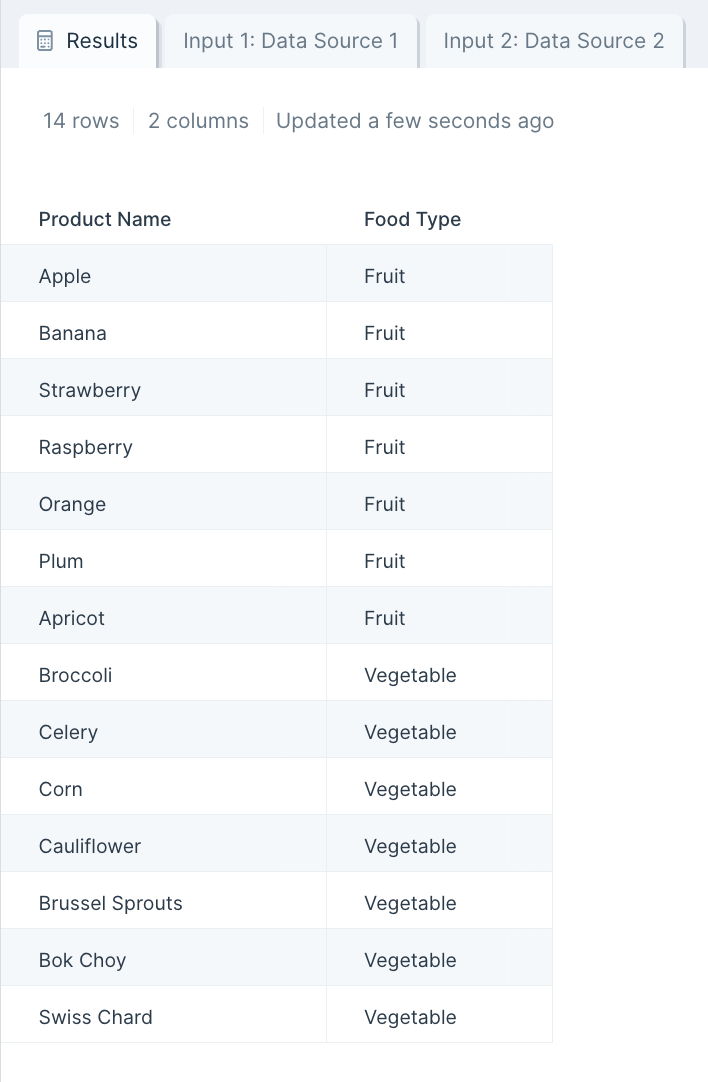
Custom settings
First, connect at least two datasets (or flow branches) to this step on your canvas.
Then, double-click on the Stack tables step to open up a pop-up window. This displays your datasets combined where the first connected dataset is on top while the second dataset is right below.
By default we stack the tables vertically based on the order of columns. If you prefer, you can click a checkbox to have Parabola match up data by column names. If your inputs are integration steps or APIs, we recommend selecting this option to match data by column names for a more stable flow, in case the API/integration decides to change up its column ordering.
Helpful tips
- This step requires at least two inputs. Make sure you have at least two arrows connected to this step. You can have as many inputs as you need. There's no maximum number of inputs.
- The order of the arrows matter. This is how we know what order to stack the tables in. The column headers from the first input are the headers used by the step's output result. The numbers you see in the arrow indicates the order. Your first input is the one with a blank arrow.
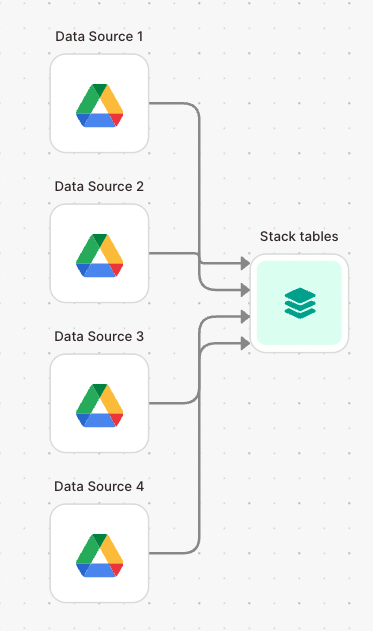
- If you have fewer columns in your first data input than you do in your other ones, the step's result won't retain those extra columns from the other data inputs.
Transform step:
Standardize with AI
The Standardize with AI transform step evaluates data and standardizes it based on examples that you predefine.
Examples of categorizing data with AI
- Clean a table where the names of columns are not always consistent, such as packing lists from multiple vendors. Convert columns with names like “Product ID,” “sku,” and “Style” into “SKU”
- Take a list of clothing items with inconsistent size names and standardize those names. Convert sizes with names like “Med,” “M,” and “mdium” into “Medium”
- Correct words that are misspelled, contain errant spaces, or have undesirable casing.
After running the step and seeing how the AI responds, it’s normal to modify your examples and re-run it to fine-tune your results.
How to use this step
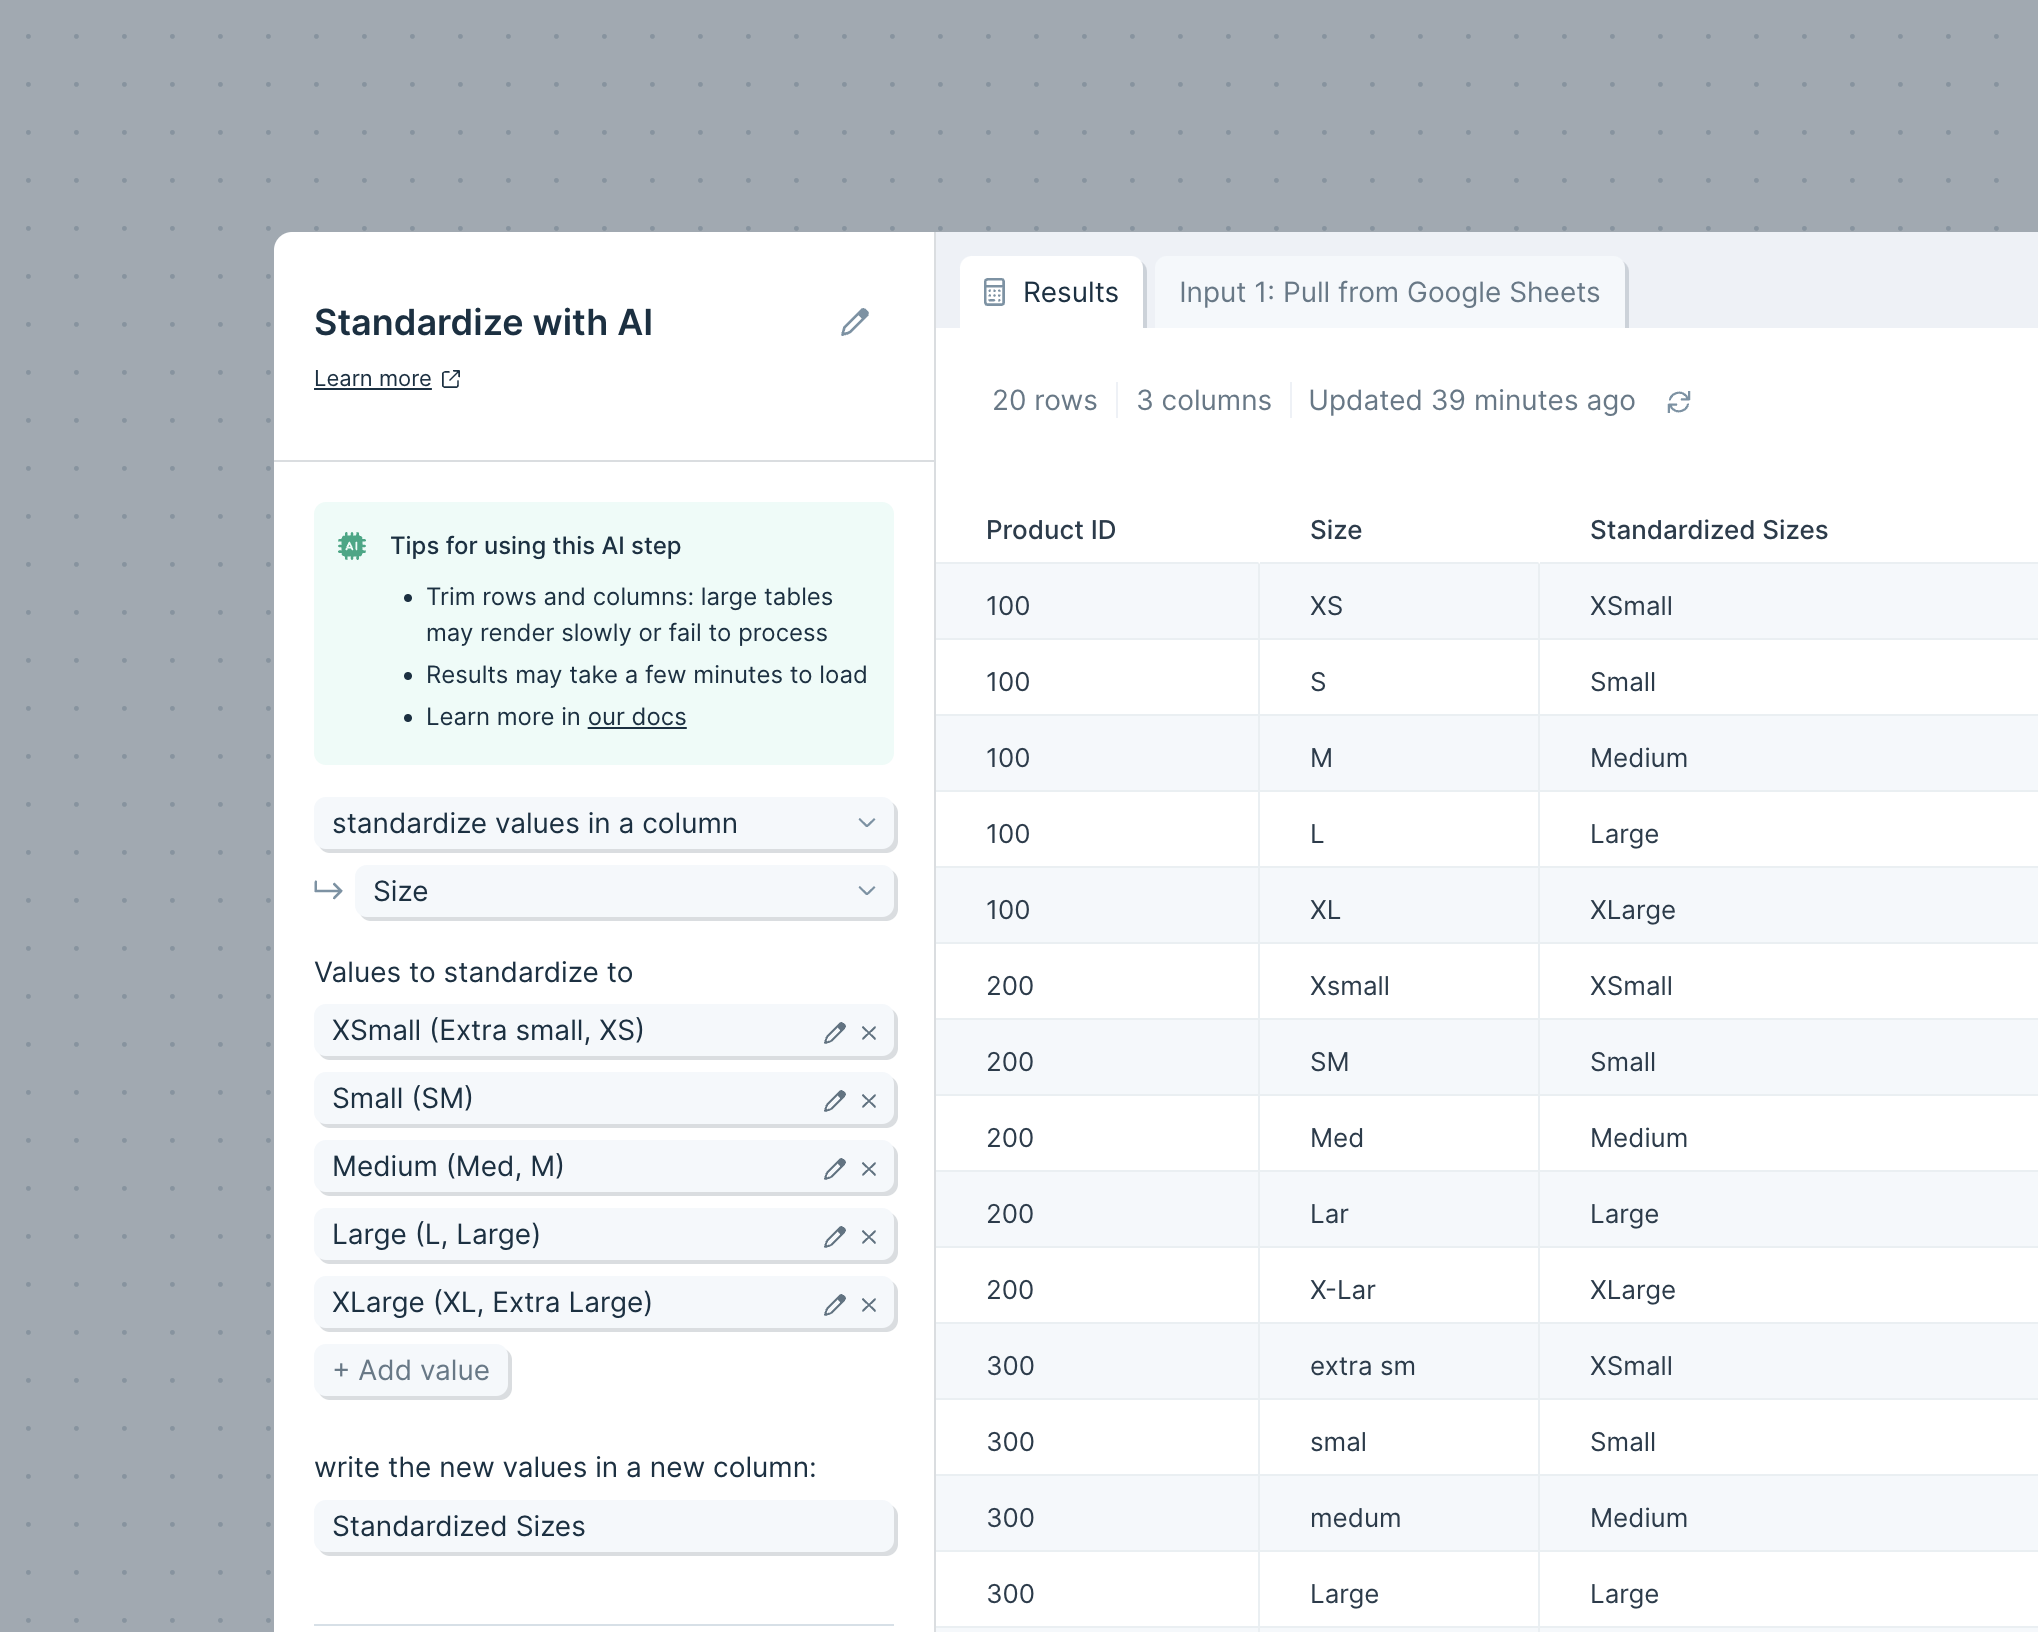
Selecting what to evaluate
Start by choosing whether you want to clean up the names of your columns, or the values in a specific column.
- Standardize column names: the AI will rename columns based on examples that you provide.
- Standardize values in a column: The AI will clean values in a specific column using examples that you provide as a guide. The cleaned values will be displayed in a new column, next to the column that the AI evaluated
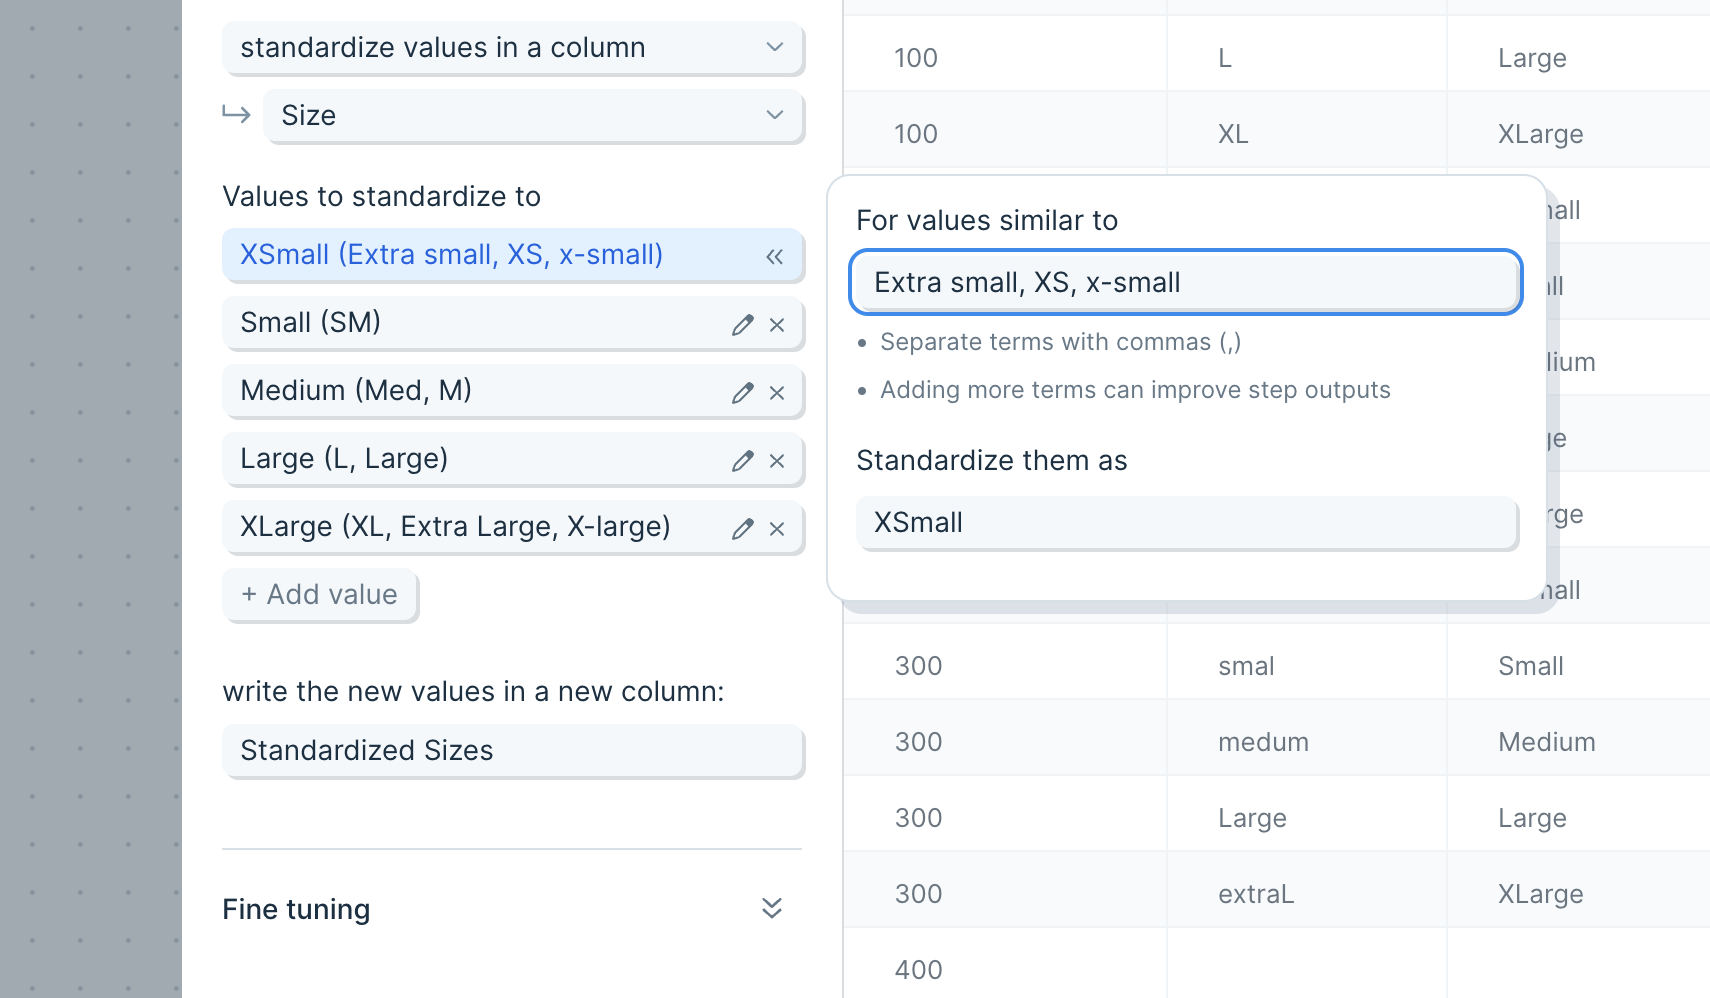
Setting up examples
This step is designed to use examples to guide the AI to find values or column names to update. The better the examples, the better the AI will be at evaluating and standardizing your data. When evaluating a value, the AI will use the examples, as well as the desired new value, to make decisions. It will also infer and guess at names that you may not have given an example for.
Include as many examples in each value as you would like, and separate them with commas. Each “Value” in the step settings should correspond to a single new value that you want to use as a column name or a cell value.
Fine tuning
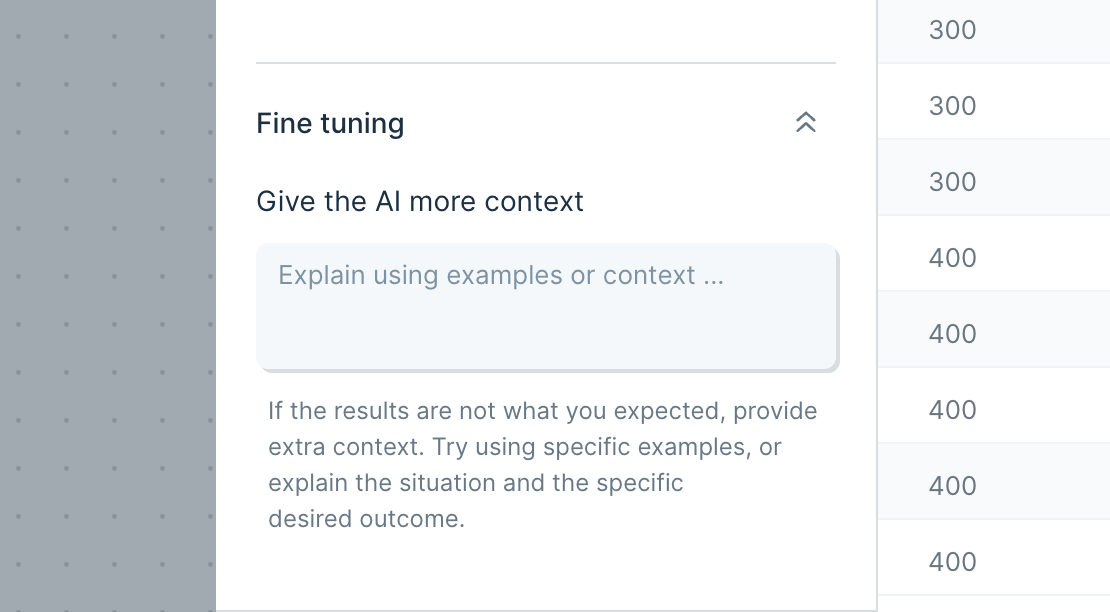
Open the "Fine tuning" drawer to see extra configuration options. Using this field, you can provide additional context or explanation to help the AI deliver the result you want.
If the AI is not quite catching everything you want, try using this field to explain how to find those edge cases. You can explain things in the same way that you’d explain them to another person.
Helpful tips
- Sometimes you’ll see a response or error instead of a result. Those responses are often generated by the AI, and can help you modify the prompt to get what you need.
- Adding more examples in each value can help guide the AI
Transform step:
Sum by group
The Sum by group step calculates the sum of all values in one or more columns. This functionality is similar to the SUMIF function in Excel.
Take a look at this Parabola University video to watch the Sum by group step at work.
Input/output
Our input data has 39 rows of order information showing the quantity sold, food type, customer username, and payment type per order.
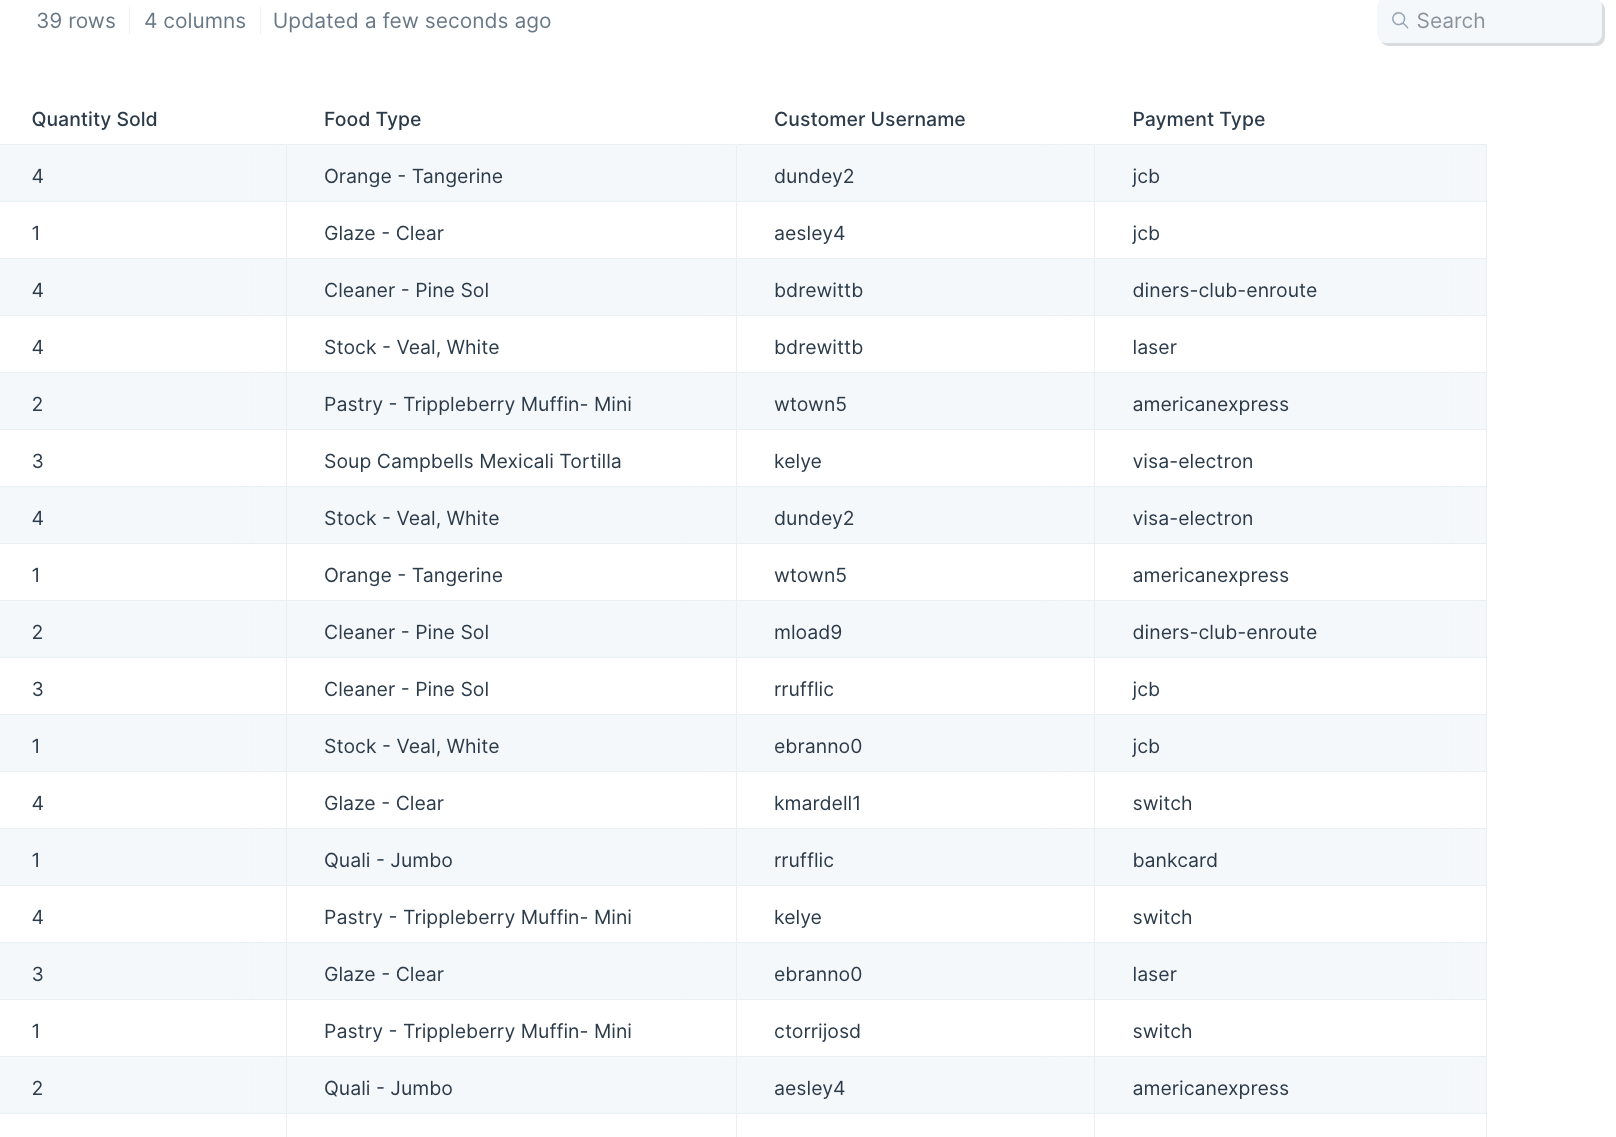
After we connect this data to the step, it'll produce an output of 9 rows that sum quantities sold per food type in the "Quantity Sold" column.
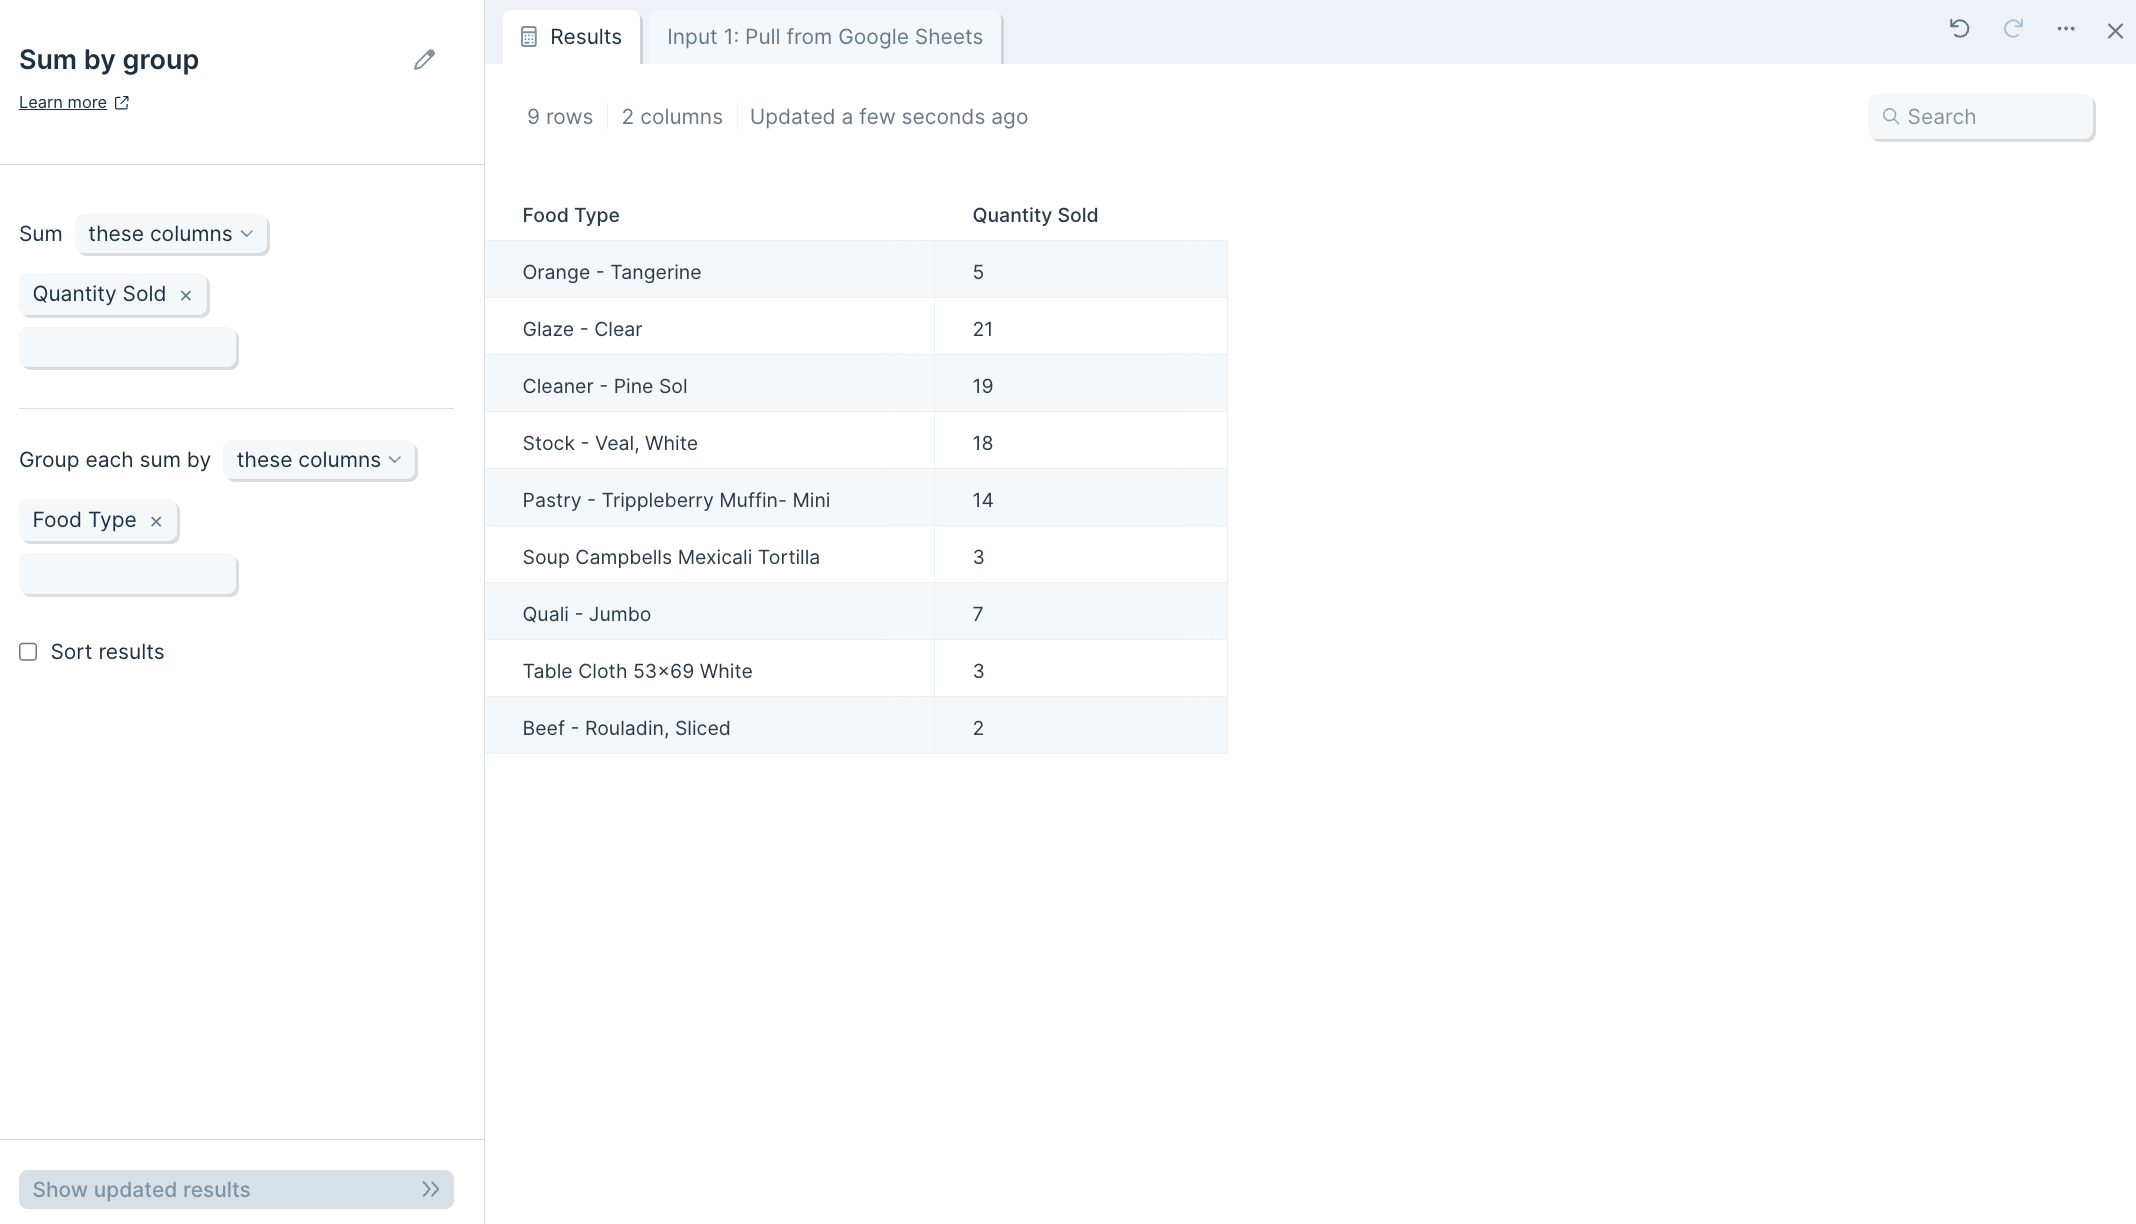
Default settings
Once connected to your flow, this step will auto-select a column to find the total amount per data group/category like quantity sold per food type. The result will display your grouped values and the total sum of them as a new table.
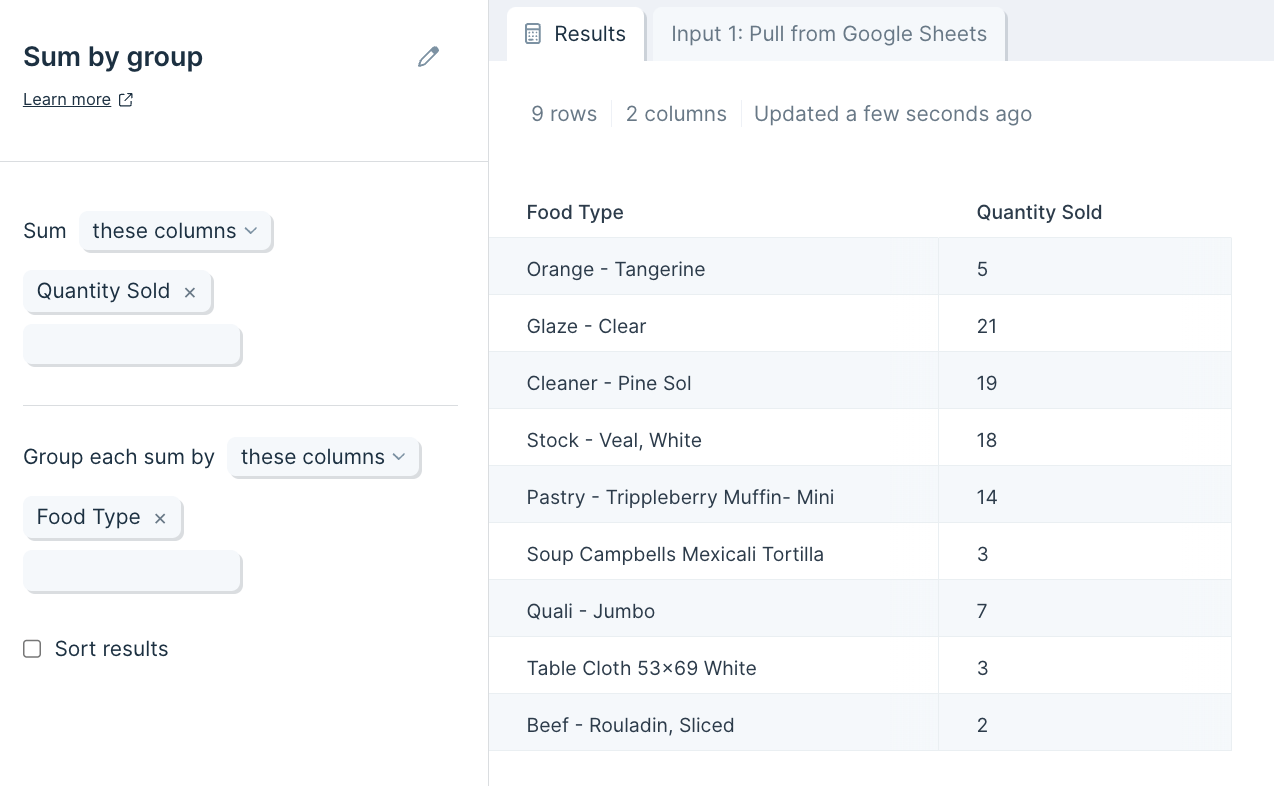
Custom settings
If you'd like to choose other columns for your sum calculation and which rows the calculation is grouped by, you can change the auto-selected ones by clicking into the blue boxes on the left-side toolbar.
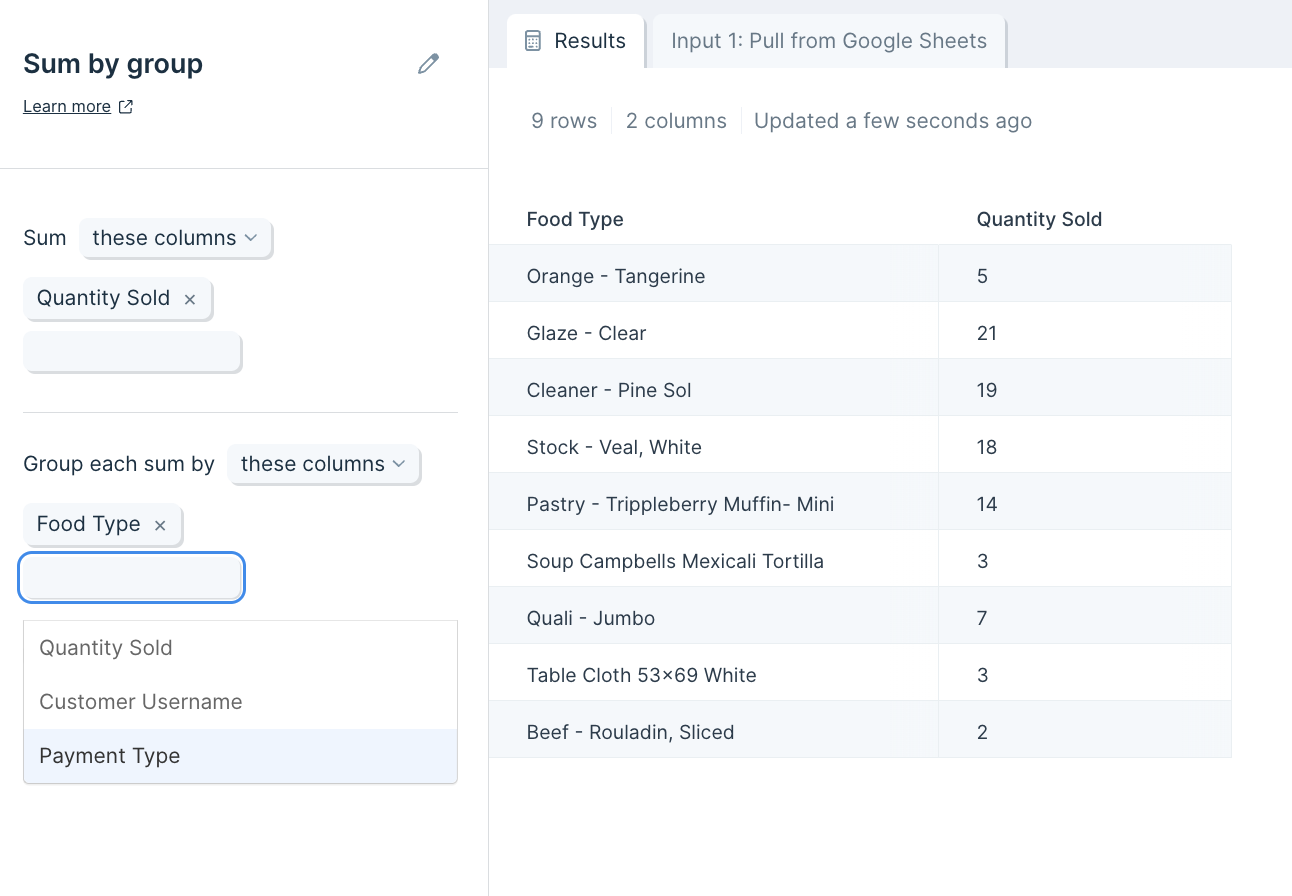
You can also select multiple columns to sum and multiple rows to group by, or choose which columns to exclude.
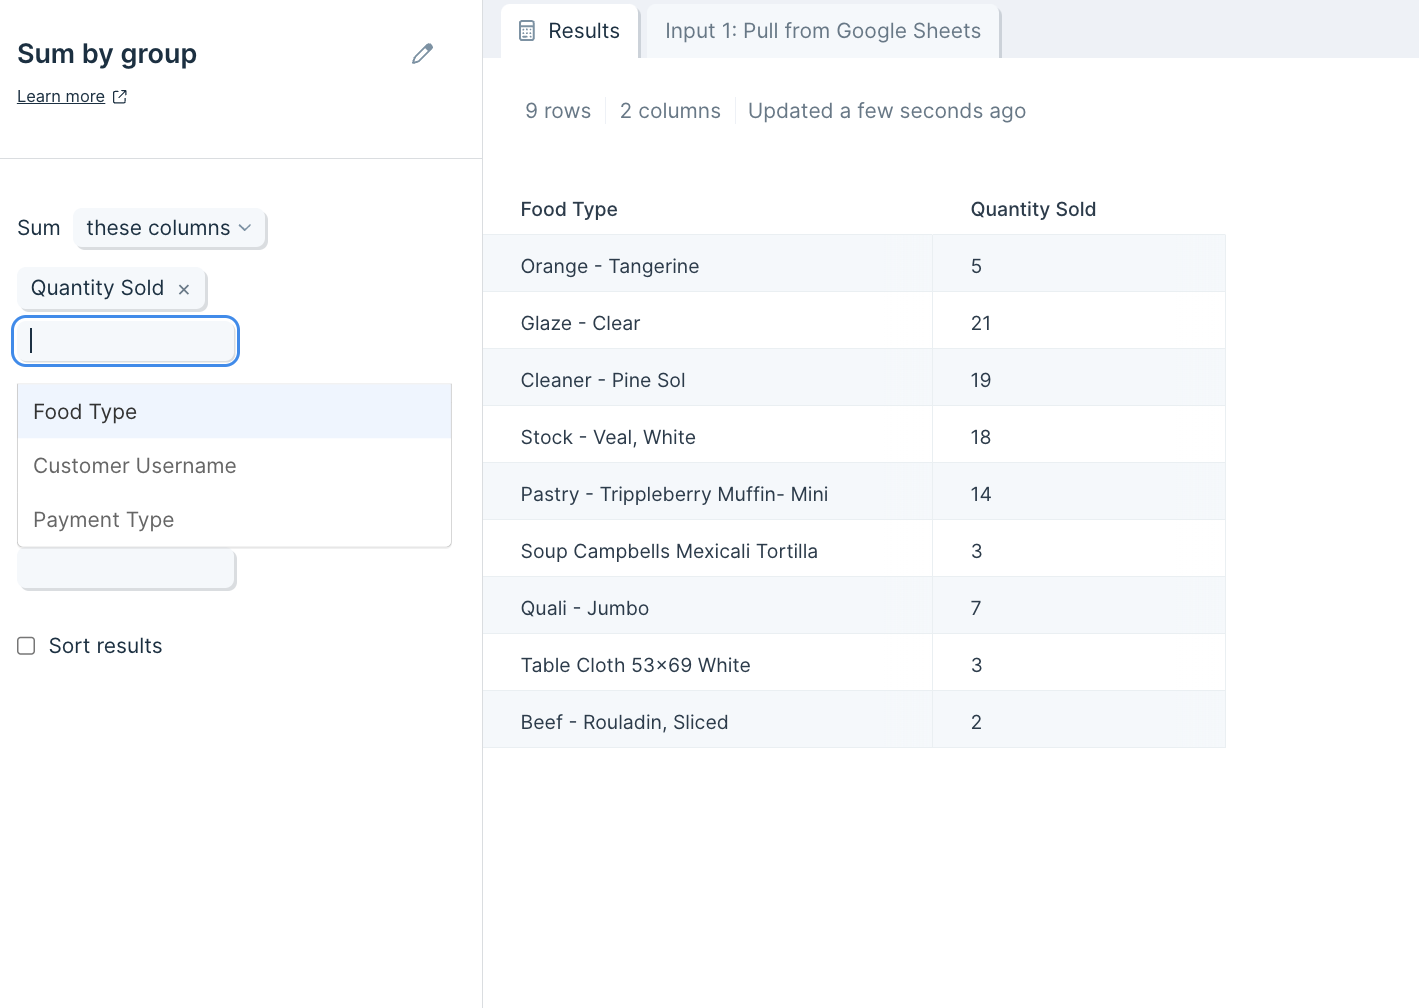
Transform step:
Unpivot columns
The Unpivot columns step will take every column that you choose and line them up into a single column called "Value". A new column will be made next to it called "Type" that holds the value of the column header that data points used to be in.
Input/output
The input data we'll use for this step is a table of three columns: "Store Location", "Profit", and "Loss".
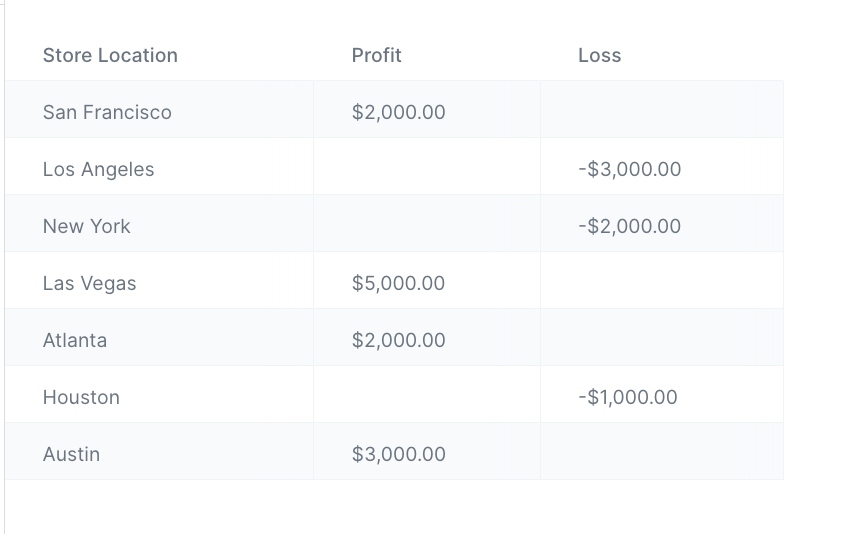
Below is a screenshot of our output data after using this Unpivot columns step. It has taken our columns "Profit" and "Loss" and merged them into a single column called "Value". The "Type" column holds the value of the column header these values came from.
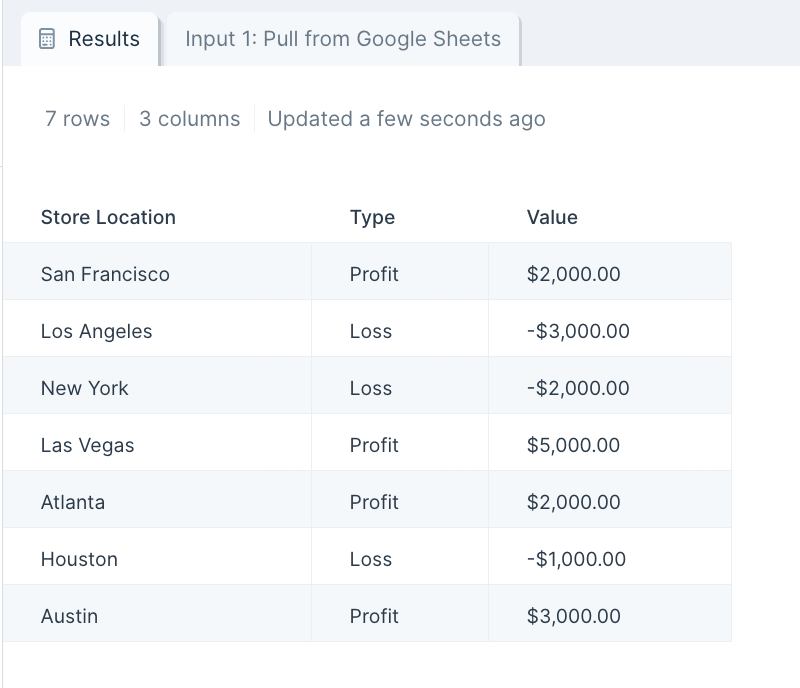
Custom settings
After you connect your data into this step, select the dropdown menu of Unique Identifier Column to choose the column (type of data) you'd like to use as an identifier for this data set. This should be the column you don't want pivoted, and will be used as a key if the data needs to be pivoted back into shape. This could be a customer ID, store name, store location, customer full name, or more.
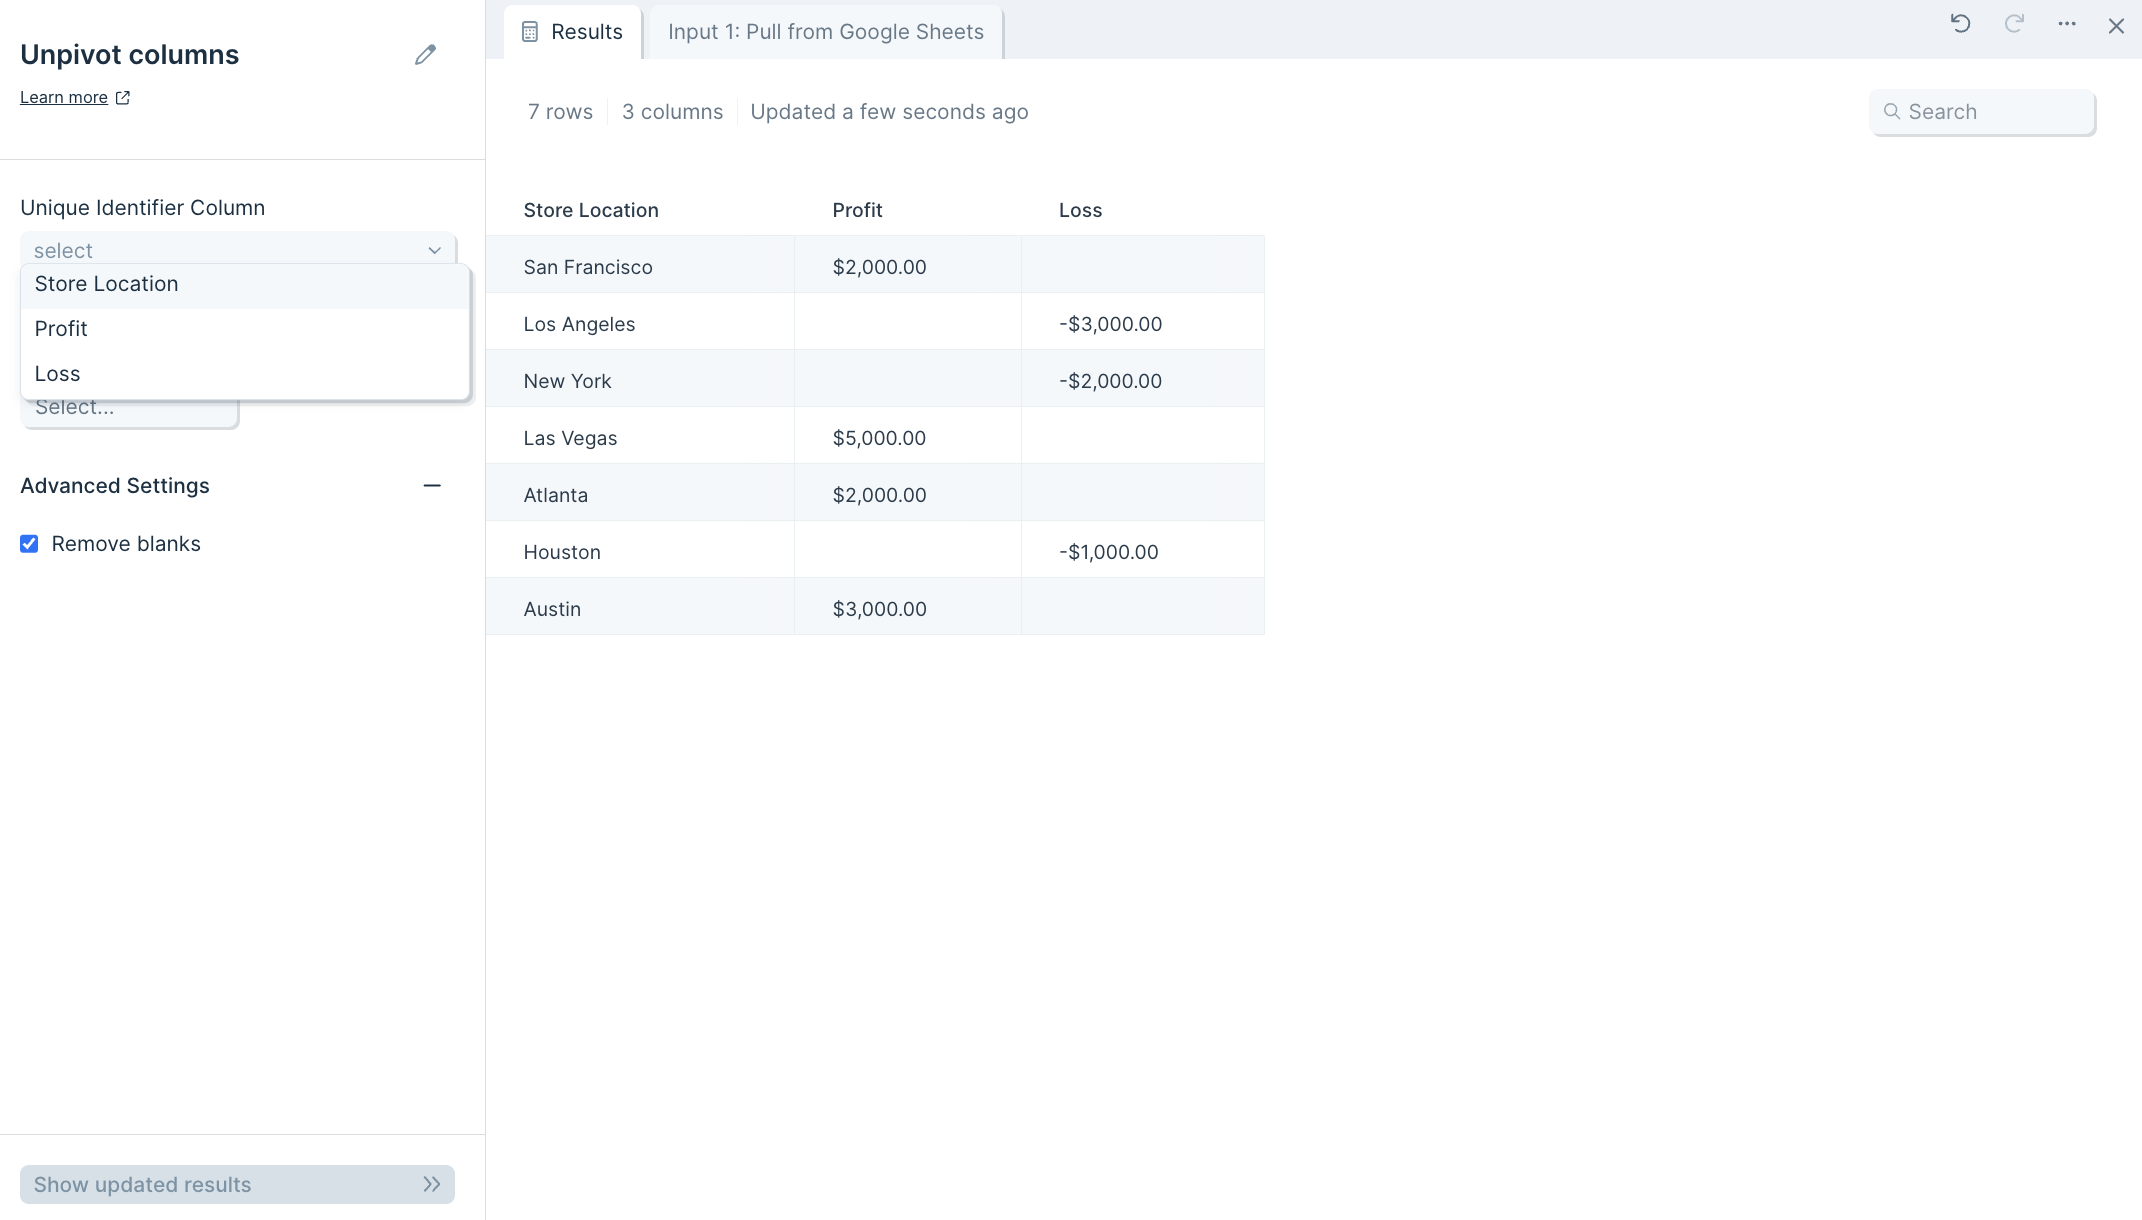
Then, select the remaining column headers (data categories) that you'd like to merge the values of those columns into a single column.
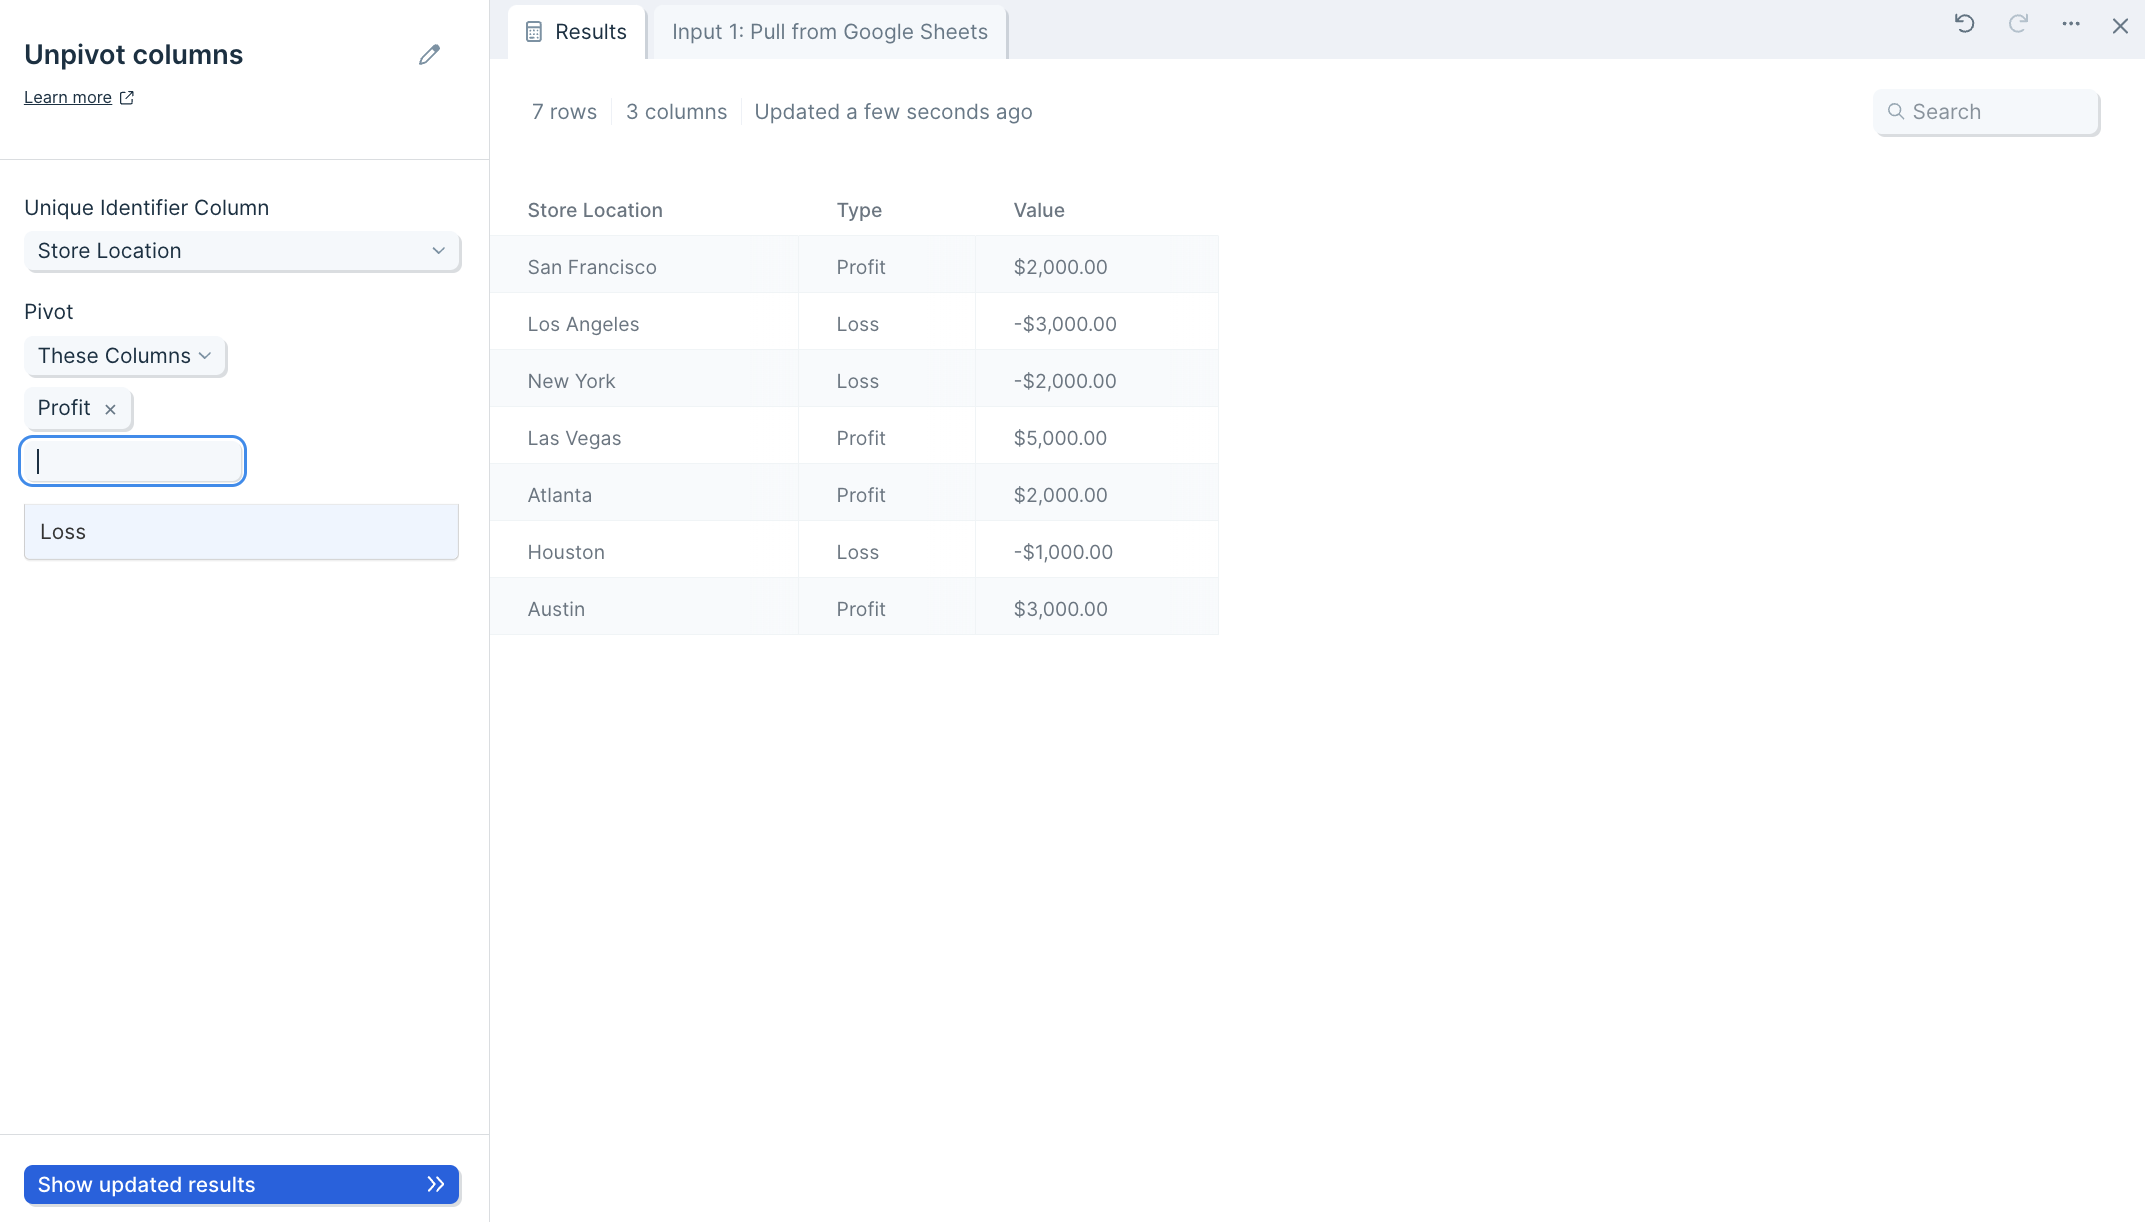
Finish by clicking Show Updated Results to save the step's settings.
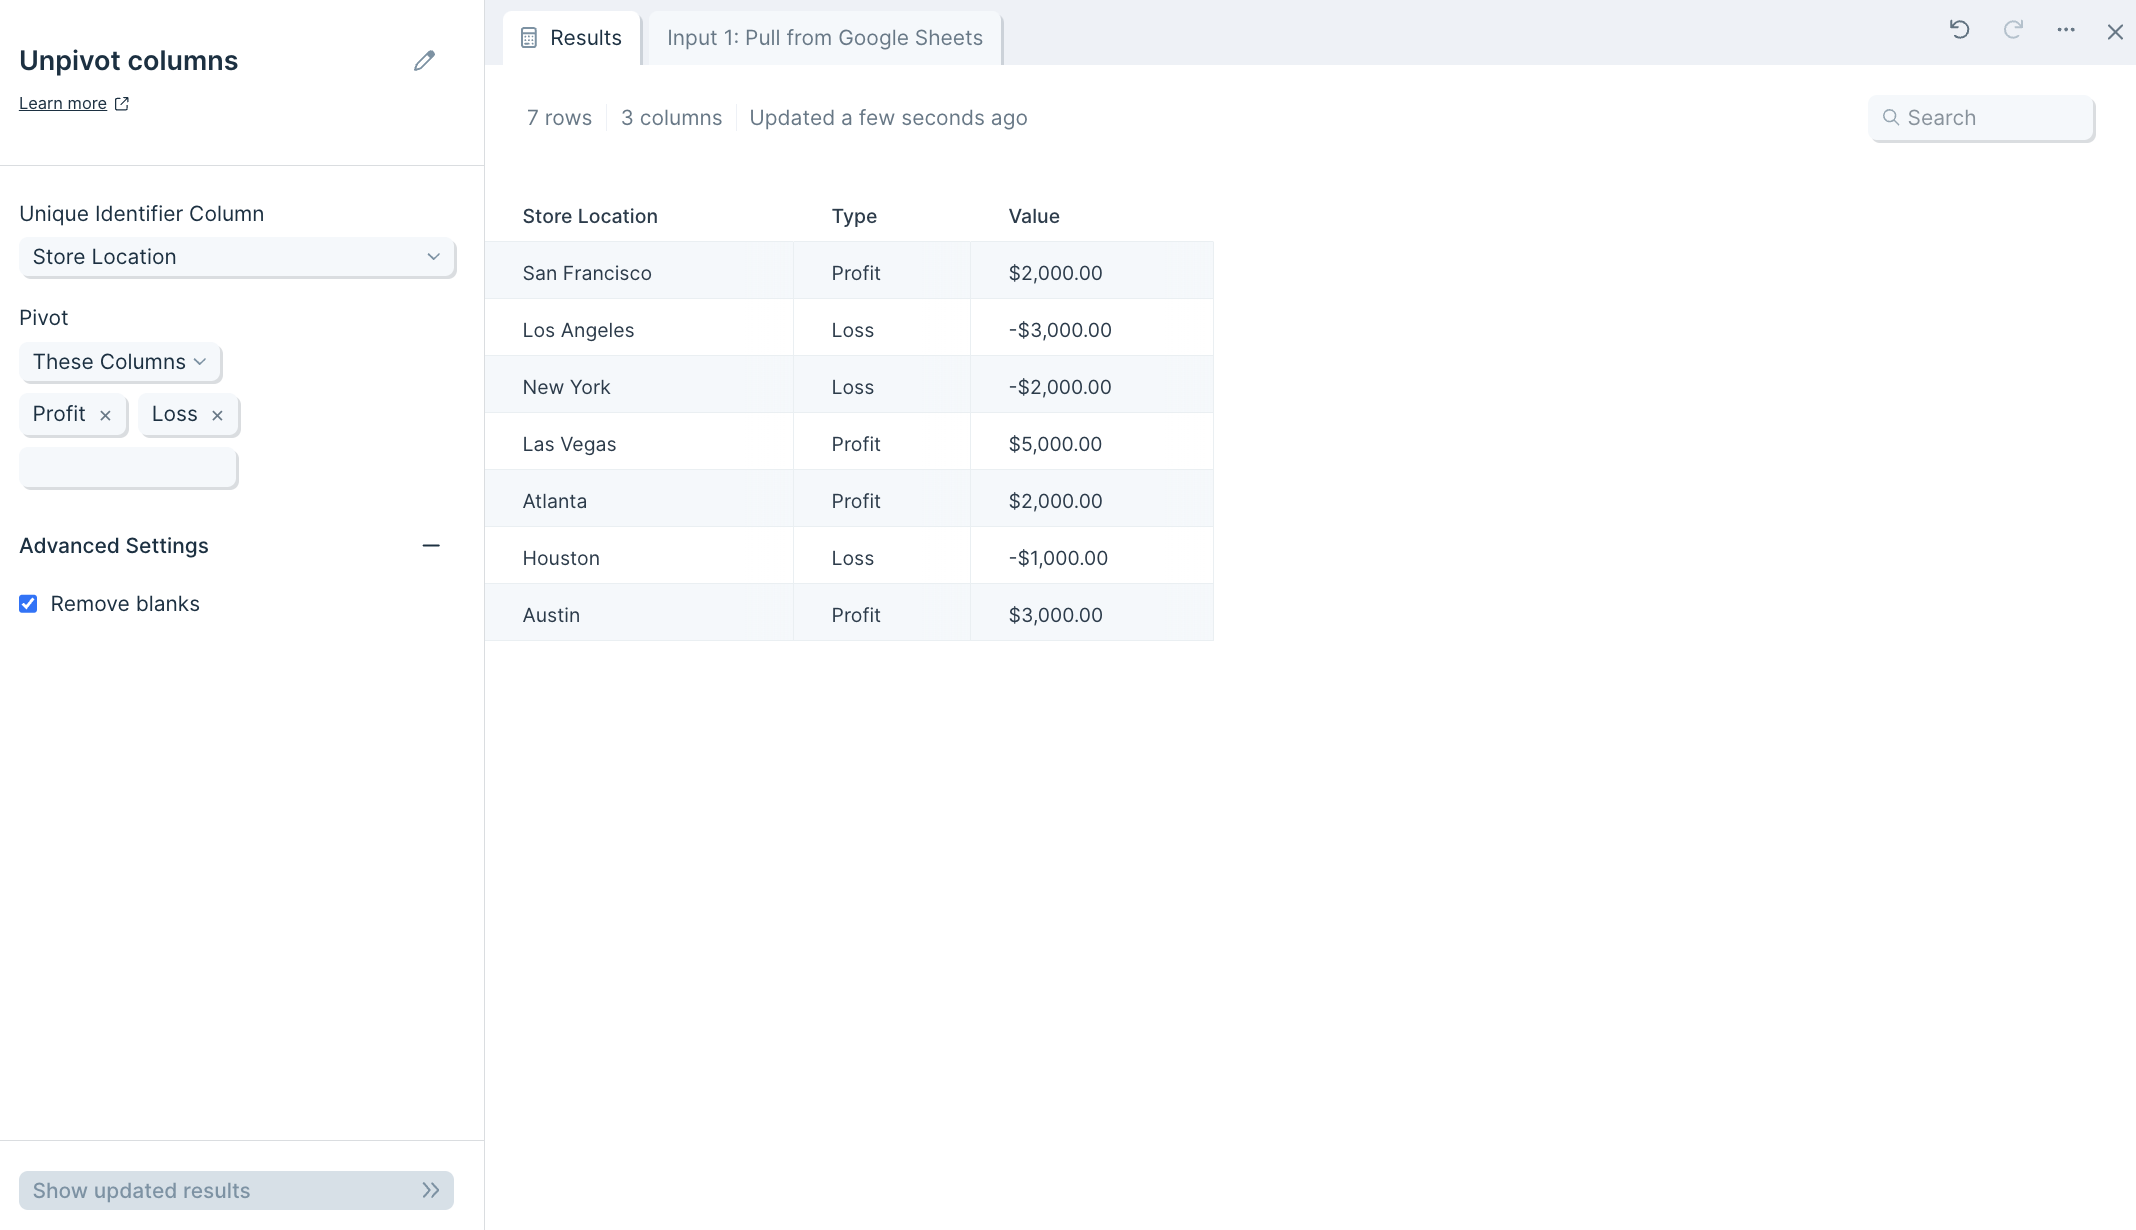
Helpful tips
- Optionally, in the Pivot These Columns section, you can choose to select the columns to exclude from the unpivot operation.
