

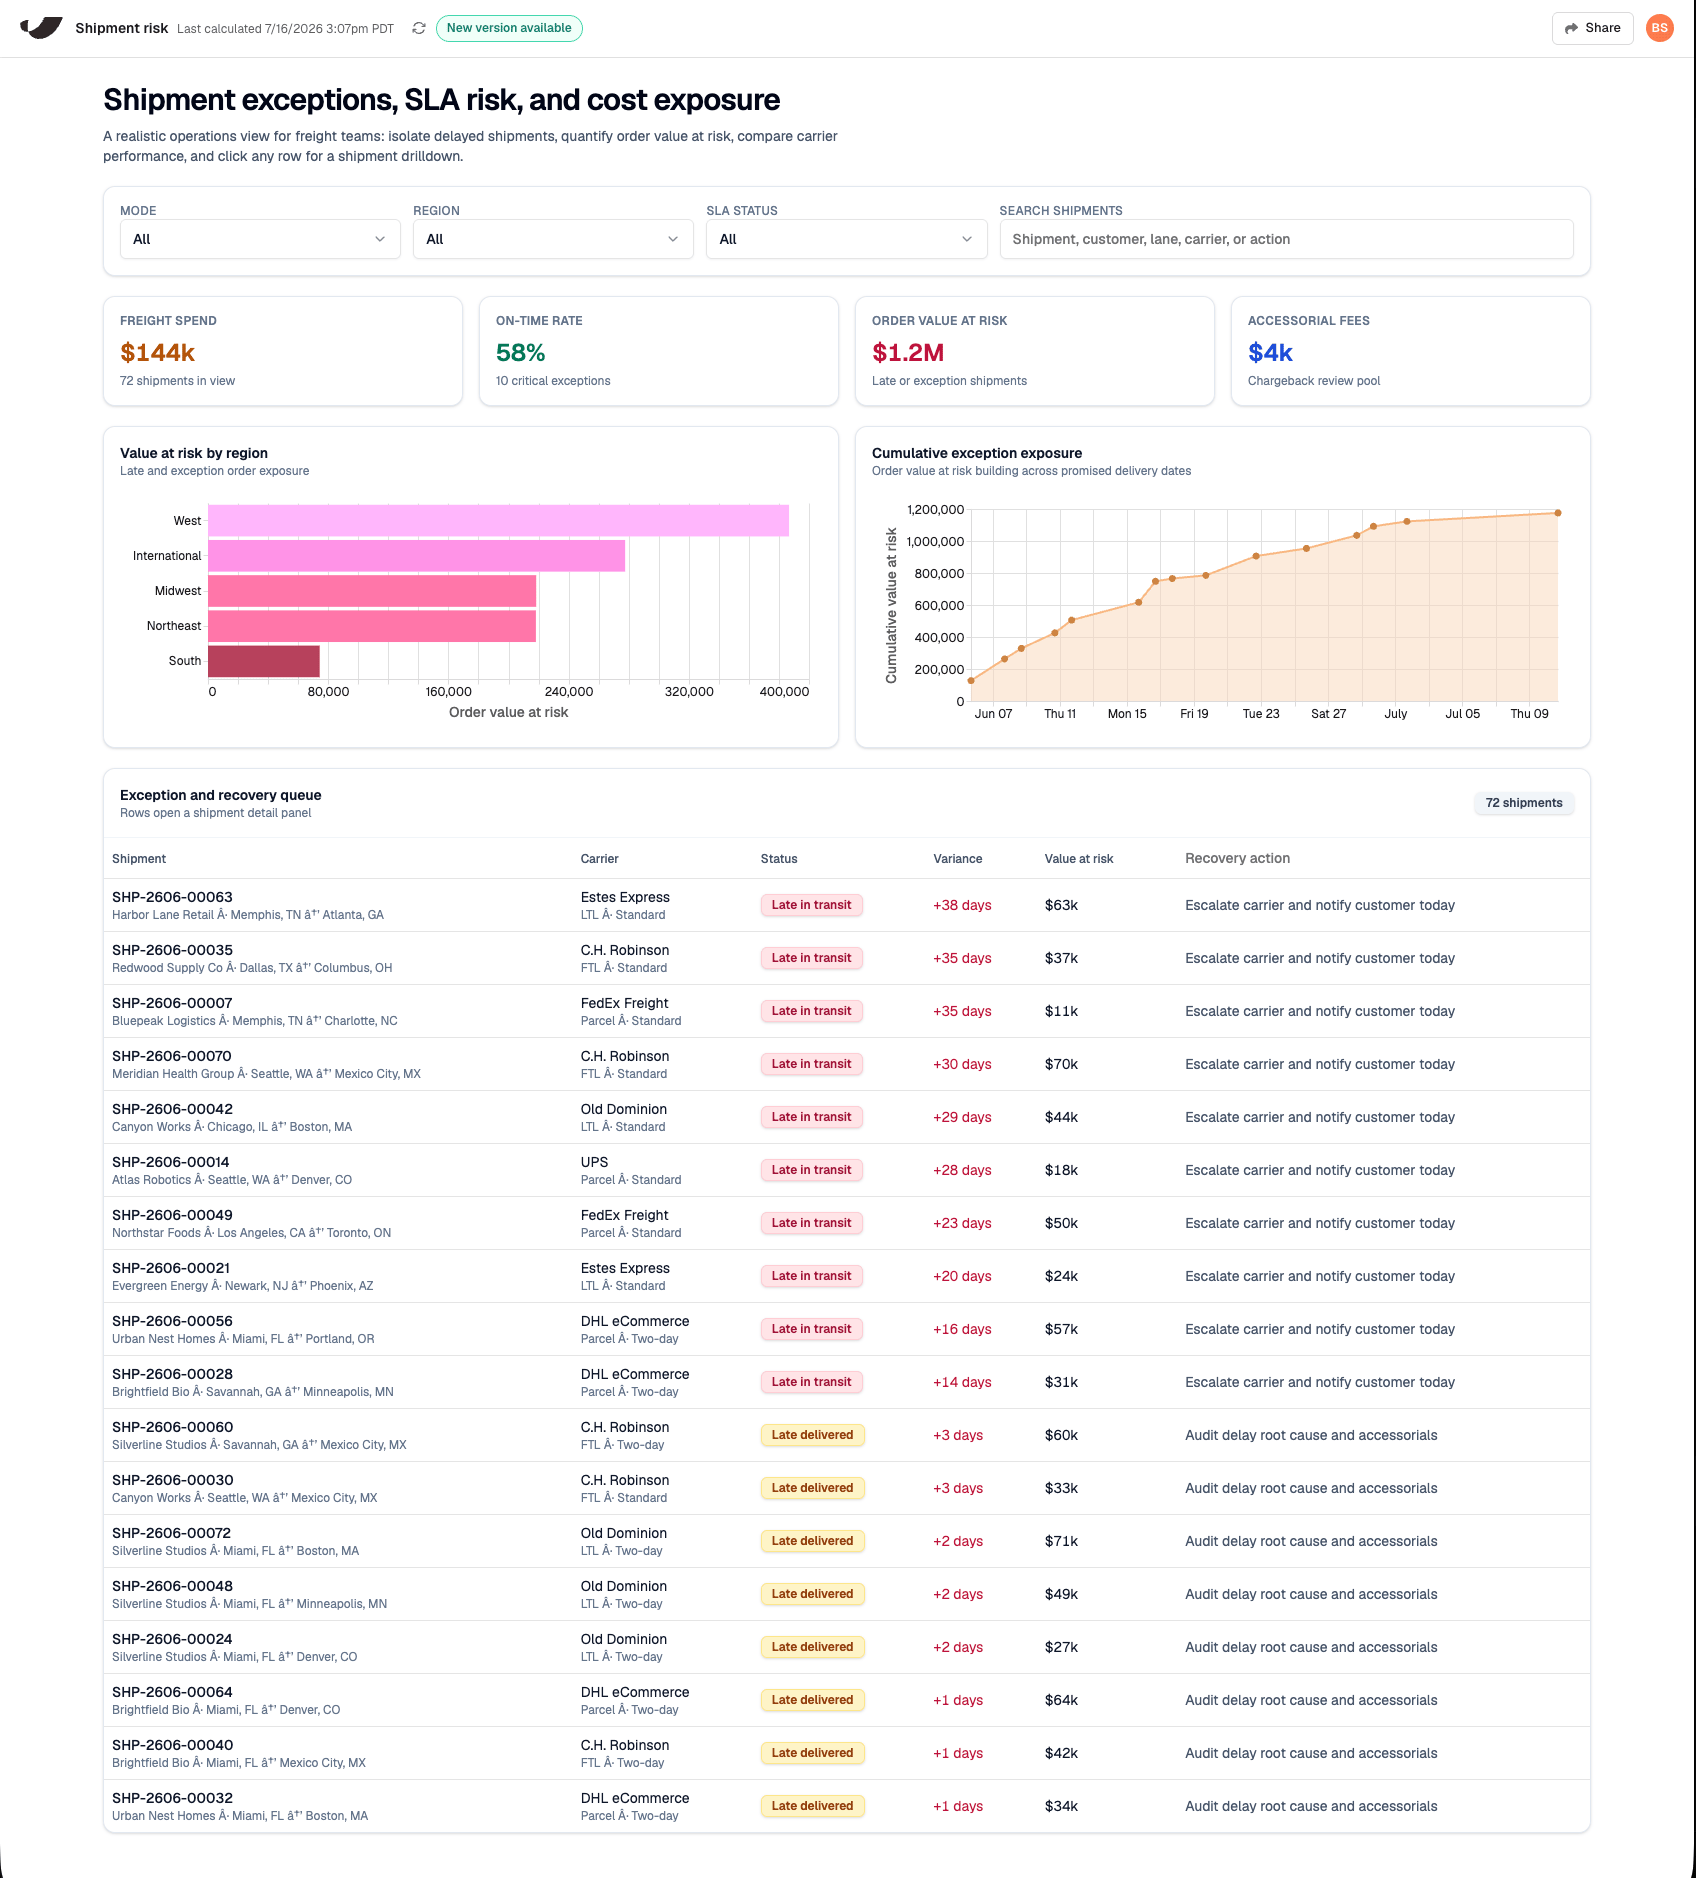
What an Artifact can contain
An Artifact can hold any combination of the following:- Charts. Bar, line, area, pie/donut, and more, in themed colors.
- KPI stat tiles. The row of big-number metrics across the top.
- Interactive tables. Sortable columns, searchable, with rows you can click to open a detail panel.
- Controls that work instantly. Filter bars, search boxes, tabs, toggles, sliders, expand/collapse, and drill-downs.
Example Artifacts
Here are a few things you might build:- A “Q1 sales recap” one-pager to send to a stakeholder.
- A slide-deck-style recap you can click through section by section, then share as a link instead of exporting a deck.
- A weekly executive summary with KPI tiles up top and a short set of supporting charts.
- An ops dashboard with a filter bar, a grid of charts, and a searchable table.
- An inventory or reorder tracker with a searchable table and stock-level highlights.
- A vendor or carrier scorecard that ranks performance across your suppliers.
- A month-end close dashboard that surfaces exceptions and totals at a glance.
- Just a single bar chart filling the step.
Controls you can add
Artifacts are interactive, and the controls work instantly on the data from the latest run. Ask Prowork for any of these, or describe the behavior you want and let it choose:- Filter bars. Narrow the whole page down to a segment, date range, or category.
- Search boxes. Type to find matching rows in a table.
- Tabs. Split content across sections you can click between.
- Toggles. Switch between views, metrics, or on/off states.
- Sliders. Set a range or threshold and watch the view respond.
- Sortable columns. Click a column header to reorder a table.
- Expand and collapse. Open and close sections or grouped rows.
- Drill-downs. Click a row to open a detail panel with more about that record.
- And more! There are limitless possibilities.
How to make one
You make an Artifact by describing what you want to Prowork, Parabola’s agent. There’s no manual setup and no code. Just ask:- “Visualize this data”
- “Make me a dashboard”
- “Chart revenue by region”
Styling and brand
Every Artifact comes with default styles, so what Prowork builds looks beautiful and modern out of the box without any extra work from you. You don’t have to think about design unless you want to. If you do have specific styling or brand guidelines in mind, just describe them to Prowork. You can name colors, fonts, spacing, a general look and feel, or anything else, and Prowork will build toward it. You can also upload an example to match, such as a brand guide or a design you like. You can even upload a screenshot or a PDF of an existing report, dashboard, or anything else you want to reproduce. Prowork uses it as a reference point and builds an Artifact toward that look.How it refreshes
Each time the flow runs, the Artifact regenerates on the latest data. The interactivity, including filtering, sorting, and searching, works on the snapshot from that run, and new data shows up the next time the flow runs. If you are viewing an artifact that has an update, refresh to see the latest version.Sharing an Artifact
Click Share on the Artifact. You get a copyable link (plus an Open in a new tab option) and a Who can view picker with two levels:
As the share header puts it: “Anyone you share with sees the latest run of this artifact.”
Recipients open the Artifact inside Parabola’s own viewer page, which shows the Artifact’s name, when it last ran, and a Refresh button.
Permissions to know
- Only someone who can edit or share the flow can create a link or change who can view it. Everyone else gets the existing link.
Limits and things to know
- An Artifact can’t take actions. There are no download, export, email, or save buttons, and no internet access. It only displays and lets you explore the data it was given. If you need to export or email data, do that with other steps in your flow rather than the Artifact.
- Size caps. An Artifact is roughly a 5 MB page, and classic charts cap around 5,000 rows.
- No external maps. Maps that rely on external geographic data aren’t supported.