Connecting via API with with Google Data Studio (now Looker Studio)Connecting to BigQuery via API enables organizations to automate their data visualization and reporting operations through Google's business intelligence platformefficiently manage and analyze large datasets through Google's enterprise data warehouse. This powerful connection allows businesses to streamline their reporting workflowsprocess massive amounts of data while maintaining seamless data integration and interactivity, all through a robust API that supports comprehensive dashboard managementsophisticated data operations.
How do I connect via API?
- Connect to the Data Studio API through Parabola by navigating to the API page and selecting Google Data StudioConnect to the BigQuery API through Parabola by navigating to the API page and selecting Google BigQuery
- Authenticate using your Google account credentials and configure necessary permissions
- Select the data endpoints you want to access (reports, data sources, parameters)Select the datasets and tables you want to access
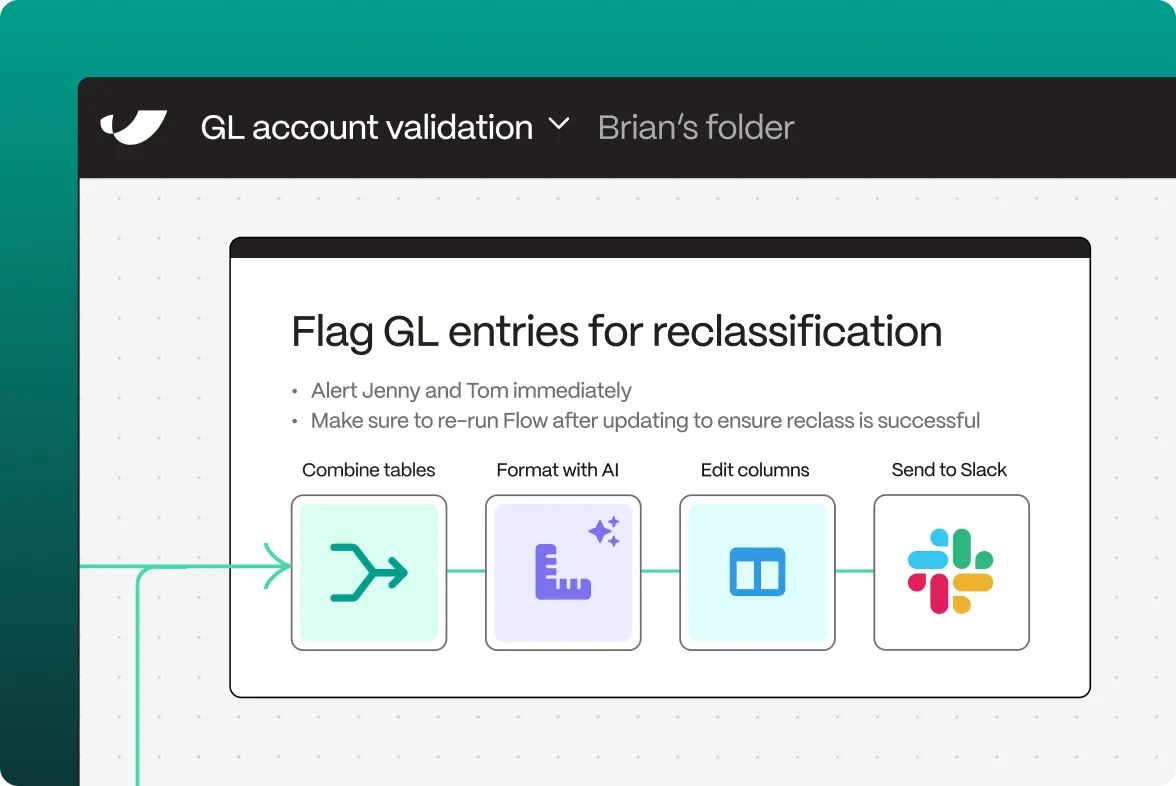
- Configure your flow in Parabola by adding transformation steps to process your reporting data
- Set up automated triggers for report updates and data refreshesSet up automated triggers for data processing and updates
What is Google Data StudioBigQuery?
Google Data Studio, now known as Looker Studio, is a free business intelligence and data visualization platform that transforms data into customizable informative reports and dashboards. As part of Google's analytics ecosystem, Data Studio enables organizations to connect to various data sources and create interactive reports that drive data-driven decision making.BigQuery is Google's fully managed, serverless data warehouse that enables super-fast SQL queries using the processing power of Google's infrastructure. As part of Google Cloud Platform, BigQuery enables organizations to analyze massive datasets efficiently and make data-driven decisions at scale.
What does Google Data StudioBigQuery do?
Google Data Studio provides a comprehensive reporting platform that enables organizations to create and share interactive dashboards and reports. Through its API, businesses can automate sophisticated reporting workflows while maintaining seamless integration with various data sources. The platform excels in data visualization and storytelling, supporting everything from simple charts to complex interactive dashboards.BigQuery provides a powerful data warehousing solution that enables organizations to analyze enormous datasets using standard SQL. Through its API, businesses can automate sophisticated data processing workflows while maintaining seamless integration with various data sources. The platform excels in handling large-scale analytics, supporting everything from simple queries to complex data transformations.
The API enables programmatic access to Data Studio'sBigQuery's full feature set, including report management, data source configuration, and parameter controlsquery execution, dataset management, and table operations. Organizations can leverage this functionality to build automated reportingdata processing workflows, manage dashboard updatesdata updates, and coordinate data refreshes while maintaining consistency and reliability.
What can I do with the API connection?
ReportData Processing Automation
Through Connecting via API with Data StudioBigQuery, analytics teams can automate their reportingdata processing workflows. The API enables automated data updates, report generationquery execution, and distribution processesresult handling. This automation ensures timely insightsefficient data processing while maintaining reportdata accuracy.
Data Source Management
Organizations can leverage the API to automate their data source connections. The system can handle connection updates, manage credentials, and coordinate data refreshes. This automation helps maintain data freshness while reducing manual intervention.
ParameterQuery Configuration
Report developersData engineers can automate their parameterquery management through the API connection. The system can update filter controls, manage date ranges, and coordinate dynamic contentexecute queries, manage job operations, and handle query results. This automation streamlines report customizationdata processing while enhancing user experienceperformance.
DashboardData Distribution
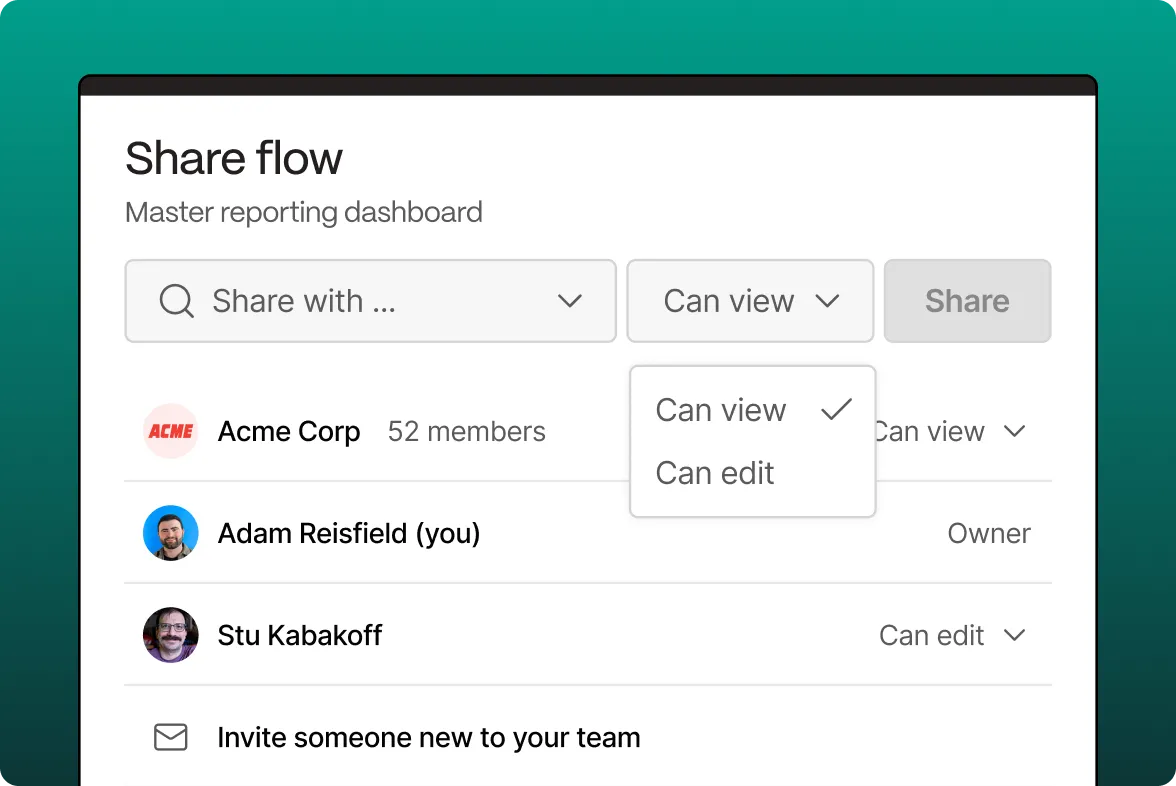
Business teams can automate their dashboard sharingdata distribution workflows through the API. The system can manage access permissions, schedule report deliverydata exports, and track usage patterns. This integration ensures insightsdata reach stakeholders efficiently while maintaining security controls.
Performance Monitoring
Operations teams can automate their reportquery monitoring through the API. The system can track loading timesquery performance, monitor data freshness, and identify potential performance issues. This automation helps maintain optimal user experiencesystem performance while reducing administrative overhead.
Through this API connection, organizations can create sophisticated reportingdata processing workflows that leverage Data Studio's visualizationBigQuery's analytical capabilities while eliminating manual operations and reducing complexity. The integration supports automated data updates, seamless reportquery management, and efficient distribution, enabling teams to focus on analysis rather than reportinfrastructure maintenance.