As global supply chains grow increasingly complex and economic headwinds persist, brands face mounting pressure to optimize their operations while controlling costs.
The result?
A technology landscape where companies must carefully balance innovation with pragmatism, seeking tools that deliver clear ROI without overwhelming already-at-capacity teams.
Based on a comprehensive survey of 90 supply chain leaders — primarily director-level and above at brands doing $50-250M in revenue — along with in-depth interviews with industry experts, this report examines how companies are navigating these challenges and where they’re placing their technology bets for the future.
Executive summary
The 2025 supply chain tech stack landscape reflects an industry at a crossroads.
Based on our survey, only 7% of brands report being “very satisfied” with their current technology solutions. This dissatisfaction stems from a fundamental tension: the need to innovate while operating under significant resource constraints.
Key findings
Integration remains the biggest challenge
- 60% of respondents cite lack of integration between tools as their primary pain point
- 50% struggle with limited visibility or reporting capabilities
- Despite these challenges, 41% still don't use any workflow automation platform
Cost pressures driving conservative tech adoption
- Budget constraints are the primary barrier to adoption for 45% of respondents
- Team bandwidth emerged as a critical limiting factor in write-in responses
- Mid-sized companies ($50M-$250M) struggle most with tech satisfaction
AI is reaching critical mass
- 52% are already using AI-powered tools
- 35% are planning to implement AI
- 54% view AI as “essential” to future operations
- Notably, zero respondents dismissed AI as overhyped
Supply chain visibility is emerging as a top priority
- Advanced supply chain visibility tools were cited by 53% as a key 2025 tech opportunity
- AI/ML for demand forecasting leads future investment priorities at 55%
- Financial visibility and reconciliation are emerging as critical pain points
What’s next?
Success will come to organizations that can make strategic technology investments while building the internal expertise to leverage them effectively. The challenge isn’t just selecting the right tools — it’s creating an integrated technology ecosystem that can scale efficiently while delivering clear ROI.
Report methodology
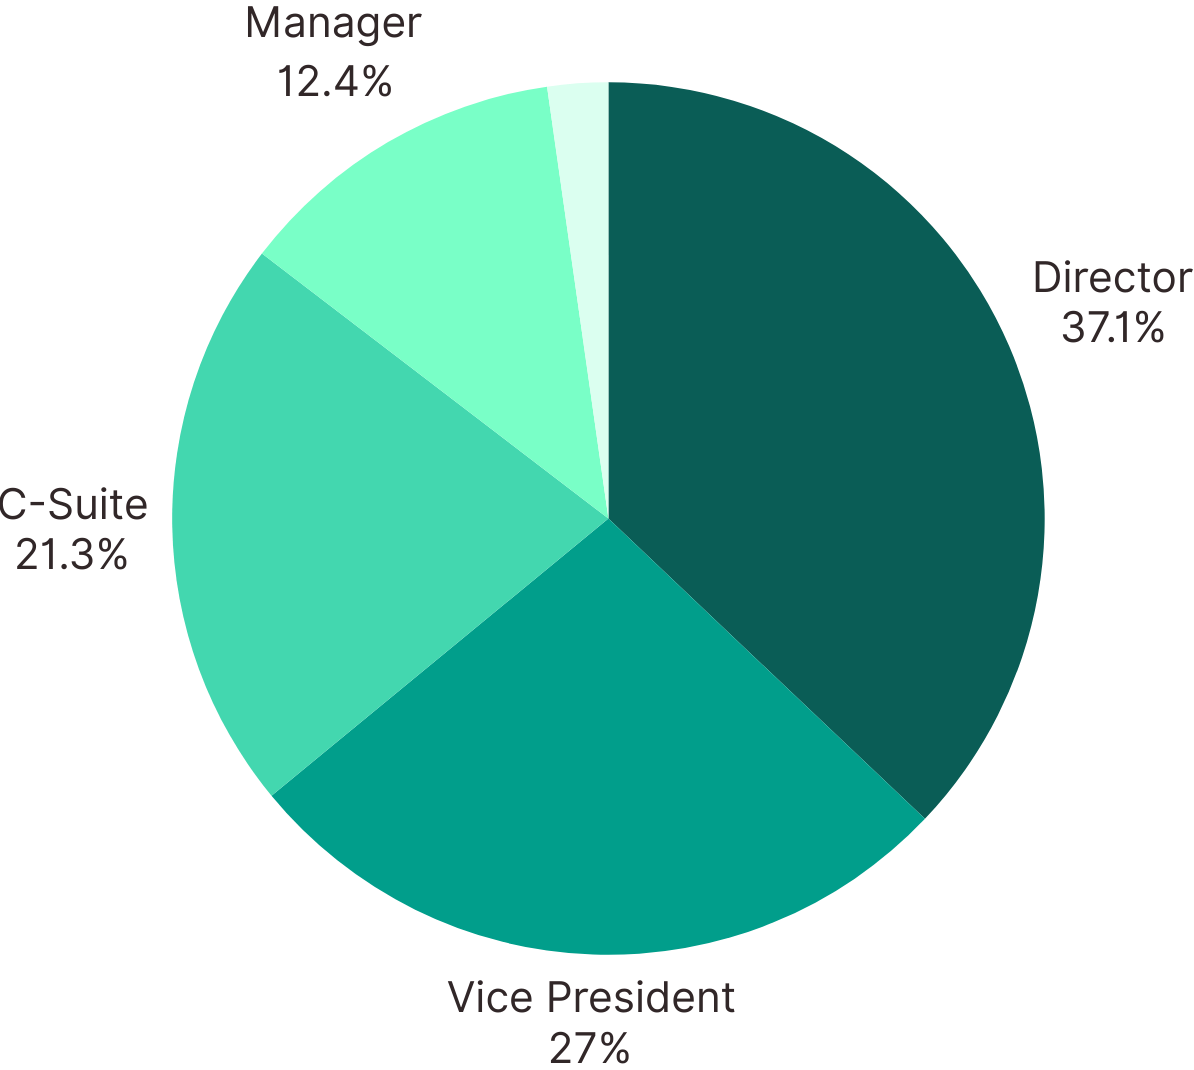
This report is based on a comprehensive survey of 90 supply chain and operations leaders conducted in early 2025 by Parabola and StartOps. The respondent pool primarily consisted of senior decision-makers at consumer brands:
Seniority level
Company size by annual revenue
.png)
The survey covered current technology usage, satisfaction levels, pain points, and future investment priorities across key operational areas including:
- Enterprise Resource Planning (ERP)
- Warehouse Management Systems (WMS)
- Workflow automation
- AI implementation
- Supply chain visibility tools
- Inventory and demand planning
The state of supply chain tech stacks in 2025: A mixed bag
Only 7% of respondents are “very satisfied” with their current tech stack.
The data reveals a sobering reality: only 7% of respondents report being “very satisfied” with their current tech stack. The majority fall into the “somewhat satisfied” (44%) or “neutral” (33%) categories, suggesting widespread recognition that current solutions aren’t fully meeting needs.
How satisfied are you with your current tech stack?
.png)
When breaking down the data by company size, we found that generally, larger companies ($250M+) tend to be more satisfied overall; smaller companies (<$50M) show more varied satisfaction levels, possibly reflecting different levels of tech sophistication and needs; and mid-sized companies ($50M-$250M) seem to struggle the most with their tech stacks.
As founder and CEO of 3PL discovery software Third Person Matthew Hertz notes, “To get different stakeholders in a room is really challenging. If you’ve got 8 people sitting around a table at a company, you can make decisions more effectively than in this 50 to 250 million range, which probably has several dozen people, if not over a hundred.”
Biggest tech stack pain points
The top challenges cited by respondents paint a clear picture of where technology is falling short.
What are the biggest pain points with your current tech stack?
.png)
"You have certain supply chain platforms that are slam dunks, that fully automate things and take you out of Google sheets or manual tracking," explains Paige Zachs, VP of Supply Chain, Ops and Customer at Coterie. "But then you have other tools that are overly complex where even basic integrations become a huge challenge."
Cost pressures drive conservative tech investment
Rising costs and economic uncertainty mean that brands often have no choice but to operate with as few resources as possible when it comes to new technology adoption. Budget constraints were cited by 45% of respondents as the primary barrier to adopting new tools, while many wrote in that lack of team bandwidth was a major limiting factor.
“It’s kind of a catch-22,” Zachs observes, “because the people who have budget and bandwidth are people who already have their lives together. They probably need it less, but that's because they thought about their future self. They’re constantly thinking about scalability.”
There’s so much cost pressure on brands right now. Tariffs, the cost of 3PL services, cost of goods going up — there’s so many things strapping budgets.”
Kyle Bertin, CEO and co-founder of Two Boxes
Kyle Bertin, CEO and co-founder of Two Boxes, notes that this conservative approach to tech investment may be shortsighted: “A lot of brands don’t spend enough time really evaluating the ROI of tools upfront…and I think a lot of brands are just very skeptical because there’s frankly a lot of bad tech out there.”
The solution, according to almost everyone we talked to, lies in better ROI analysis and social proof. And vendors who are committed to proving their value to prospects should take it upon themselves to make connections between similar brands and outline the clear outcomes their customers experience.
But that doesn’t mean that brands themselves are powerless.
Keith Frymark, Senior Vice President of Supply Chain and Quality at Seed Health, thinks that ops is actually well situated to get tech buy-in, though, if they’re eager: “I think supply chain and ops teams have the most leverage in the business — $20,000 doesn’t scare me, I can save that tomorrow,” he says.
“Renegotiate a contract, shave off 10 cents on packaging, look at your tariff codes, reclassify something…we have so much ability to save money. I would encourage teams that are having trouble arguing for this tech investment to highlight the savings they’re creating in other areas that can pay for this tool,” Frymark recommends.
The automation gap: Why workflow tools remain underutilized
Despite the clear benefits of automation — and endless thought leadership on “digital transformation” and the power of “operational excellence” — our survey revealed a surprising statistic: 41% of respondents don't use a workflow automation platform. Of those who do, Parabola* leads with 37% adoption, followed by Make (7%) and other solutions.
Which workflow automation platform do you use?
.png)
This automation gap represents a significant missed opportunity, particularly as brands aim to scale efficiently. “We have a culture of being lean and mighty,” explains Zachs. “We’re trying to grow our business by 50% this year without increasing our headcount… you do that by hiring only the best and investing in tech.”
Operators need automation — but they don’t have the capacity to implement it
Despite leaders like Zachs who embrace automation as a strategic advantage, many brands remain hesitant to adopt workflow automation tools. This resistance is particularly puzzling given that “lack of integration between tools” was cited as the top pain point by 60% of respondents — precisely the challenge that automation platforms are designed to solve.
The issue?
They’re just surviving, there are a lot of smaller ops teams where they’re running a lean operation. On a small team of maybe 3 or 4 you’re forced to do a lot at a fast pace, and you just don’t have time to sit down and truly build out workflows.”
Keith Frymark, Senior Vice President of Supply Chain and Quality at Seed Health
And with a number of respondents writing in comments like “bandwidth/headcount to support implementations” or “several large projects in one year with a small team” as the biggest barrier to tech adoption, the survey showed that sentiment rings true.
The reluctance may also stem from the same challenges plaguing all tech adoption: budget constraints (45%), complexity of implementation (17%), and lack of internal expertise (17%).
However, as Ronak Shah, CEO of Obvi notes, “I’d much rather rely on someone saying ‘Hey, I’m gonna use this tool and it's gonna do the job of two other people.’ I think in today’s climate I’m much more like, ‘Let’s move fast, let’s go and get whatever we can use to forge ahead.’”
According to Parabola CEO Alex Yaseen, “Something we see all the time — and a term we use internally to define it — is that brands need to participate in their own rescue. If you’re constantly ‘too busy’ to evaluate the technology that could save you hours (or full team headcount), you’ll never escape the hamster wheel. The best operators find time to carve out space for those initiatives.”
*This survey was conducted by Parabola and distributed through Parabola’s marketing channels.
AI adoption reaches critical mass despite skepticism
0% of respondents think AI is overhyped
Our survey data reveals a complex picture of AI adoption in supply chain operations.
Are you currently using any AI-powered tools in your operations?
.png)
While the majority of brands are either using or planning to use AI, with 52% already implementing AI-powered tools and 35% planning to adopt them, there remains a notable minority (14%) with no plans to implement AI solutions.
Current implementation vs. future opportunities
Current AI implementation focuses primarily on customer-facing and operational functions.
In which areas are you currently implementing AI?
.png)
What’s particularly interesting is the contrast between where brands are investing in AI today versus where they see the biggest opportunities.
While customer service leads current adoption, brands identify AI/ML for demand forecasting (55%) and advanced supply chain visibility (53%) as their top technological opportunities for 2025. This suggests a significant shift in focus from customer-facing AI applications to core operational uses.
Understanding adoption barriers
The hesitation to embrace AI stems from several key concerns.
What are the biggest barriers to adopting AI in your operations?
.png)
The fear of AI getting it wrong in critical business processes creates significant hesitation.
“You can think of it as just like anything in prediction: a false positive versus false negative,” explains Bertin. “If the false positive here is very costly for brands, and they’re afraid of it, that can be a disastrous experience.”
Some industry leaders are finding creative ways to start small with AI adoption. As Hertz notes, “I’ve used Claude to pop in a 3PL agreement and said, ‘Can you identify any concerns in this agreement?’ And it spit out three or four things that I should challenge them on…and this is all free. Even for folks like myself who are not early adopters of new technology, there’s opportunities to use these very lightweight tools to get comfortable.”
And some are clearly seeing its value: “I think using it for any place where there is a repetitive service input has been huge,” explains Shah. “Even just identifying places that we should improve gives us a lot of ideas — if I can have the brain of 10,000 robots, we can get a lot more ideas coming through.”
Challenges aside, there’s no doubt that the future is built on AI
Despite these barriers, the data suggests a growing recognition that AI adoption isn’t optional. When asked about the role of AI in ecommerce operations over the next 3–5 years, not a single respondent dismissed it as overhyped.
How do you view the role of ecommerce operations in the next 3–5 years?
.png)
This overwhelming acknowledgment of AI’s importance, even among those currently hesitant to adopt, suggests that the question for most brands isn’t whether to implement AI, but how to do so effectively while navigating resource constraints and implementation challenges.
At the end of the day, though, operations can’t exist without its people.
“The human element will always be there,” says Frymark.
Supply chain visibility emerges as critical priority
When asked about the biggest opportunities for their companies in 2025, brands overwhelmingly pointed to two key areas: AI/ML for demand forecasting (55%) and advanced supply chain visibility tools (53%). This focus on visibility isn’t surprising given that “limited visibility or reporting capabilities” was cited by 51% of respondents as one of their top pain points with current tech stacks.
What new technologies do you see as the biggest opportunities for your company in 2025?
.png)
But what is supply chain visibility?
Probably a lot of things: knowing where your packages are; having insight into your inventory across all channels; knowing who you’re paying, when, and how much; the list goes on.
Visibility continues to be a huge gap for brands and 3PLs…the whole ecosystem. Planning is the hardest function of the ecommerce business. You look at what a planner goes through: these Bibles of Excel workbooks, and it's just a lot of guesses. It's a lot of forecasting."
Matt Hertz, CEO of Third Person
As one solution, brands are increasingly looking to AI-powered planning and visibility tools to help make sense of their data. "Why not use computers who are better than humans at gauging trends and forecasting?" suggests Hertz.
In terms of tooling, StartOps founder Charles Cushing says technology like Four Kites and Project 44 immediately come to mind as platforms that are paving the way for more supply chain visibility and management with AI.
However, the challenge remains finding tools that can provide comprehensive visibility without adding unnecessary complexity to already stretched operations.
See how your tech stack stacks up
If one thing is clear from the data we collected, it’s this: No two brands build their supply chain tech stack in exactly the same way.
The supply chain tech landscape is huge, and for every big player in the space, there are dozens of tools iterating on core capabilities; introducing AI into their offerings; and making challenges like scalability and integration easier to manage.
Between just 90 ops leaders, there were at least 10 distinct tools reflected in each category with 24 WMSs, 20 inventory and demand planning tools, and 17 PO management/shipping tools leading the pack for categories with the most competition.
There’s a lot to learn here. How are brands your size managing their returns? Are you ready for an ERP? Which tools play well with others?
Here’s what we found.
Key takeaways from tech stack data, by company size
Small companies ($1M–$10M)
Tech stack characteristics:
- ERP adoption: 66.7% → Some small companies adopt ERPs like NetSuite, but many still rely on manual processes, spreadsheets, or automation tools
- WMS usage: 75.0% → A high adoption rate, with solutions like Extensiv being more common in this segment
- Workflow automation: 100.0% → All small companies use automation tools (Zapier, Parabola, Make), as they often lack robust engineering resources
- Inventory planning: 66.7% → Over half use standalone inventory planning tools, rather than relying on an ERP
- Shipping software: 66.7% → Many use EasyPost or ShipStation instead of ERP-integrated logistics
Challenges:
- Cost sensitivity: Many cite high costs of tools (34.8%) as a challenge
- Scalability issues: 60% report difficulty scaling without an integrated ERP
- Integration frustration: 50% cite a lack of integration between their multiple systems
Mid-sized companies ($11M–$250M)
Tech stack characteristics:
- ERP adoption: 79.5% → Most companies have implemented ERPs (NetSuite is a common choice)
- WMS usage: 40.9% → Less reliance on WMS compared to smaller companies, possibly due to stronger ERP capabilities
- Workflow automation: 88.6% → Still heavily used, but slightly less than in small companies as ERPs begin taking over
- Inventory planning: 68.2% → Similar to small businesses, many mid-sized companies supplement ERPs with specialized inventory tools
- Shipping software: 72.7% → Widespread use of standalone shipping solutions, even with ERP integration
Challenges:
- Integration issues persist (42%), as ERPs do not always connect seamlessly with other tools
- Customization limitations (30%) emerge, as companies need more flexibility than what NetSuite and similar ERPs offer
- Costs remain a challenge (40%), with many citing high cost of tools
Large enterprises ($250M–$1B+)
Tech stack characteristics:
- ERP adoption: 75.0% → Most large companies use enterprise-level ERPs (e.g., Oracle, Microsoft Dynamics 365)
- WMS usage: 66.7% → Companies this size nearly always have a dedicated WMS like Oracle WMS Cloud or Blue Yonder
- Workflow automation: 83.3% → Automation is still used, but less than in smaller companies since ERP handles more integrations
- Inventory planning: 41.7% → Lower adoption of standalone inventory tools, since ERPs or WMS solutions handle these tasks
- Shipping software: 75.0% → Shipping software is still widely used, even at enterprise scale
Challenges:
- Customization limitations (50%) → Larger companies need tailored solutions, but ERP/WMS flexibility is often limited
- Implementation complexity (35%) → Rolling out ERP and WMS solutions across large teams is a major challenge
- High costs (48%) remain a common complaint, as enterprise-grade solutions are expensive
Which workflow automation tool do you use?
When it comes to workflow automation tools, the majority of respondents currently aren’t using one, despite the frustrations we found around integration and data visibility challenges.
The majority of respondents in our survey use Parabola*, with Make, Smartsheet, and Zapier following behind.
Some additional findings:
- The only company using Alteryx has a revenue of more than $1B.
- The majority of tools that don’t use a workflow automation platform are within the $50M–$250M in revenue range.
*This survey was conducted by Parabola and distributed through Parabola’s marketing channels.
Which ERP do you use?
.png)
The majority of respondents (36%) use NetSuite, and closely behind that at 29% are the group of respondents who don’t use an ERP.
Some additional findings:
- 40% of those who don’t use an ERP note that “difficulty in scaling as the business grows” is a challenge. Many of them are also using workflow automation tools like Parabola or Zapier, likely to combine and automate data from the various platforms they’re using in lieu of an ERP.
- 20% of those using NetSuite are “very satisfied” with their stacks, which is notably higher than companies that don’t use an ERP.
- 48% of NetSuite users report their tools are too expensive compared to 34.8% of the full pool.
Which WMS do you use?
.png)
The majority of respondents use Extensiv (18%), with ShipHero (14%) and solutions built in-house (7%) following.
This was by far the most wide-spanning group of tools we saw in the survey: 24 different tools were reflected in the data.
Some additional findings:
- Overall, WMS users tend to have higher tech satisfaction than those who don’t use a WMS (15% were “very satisfied” with their tech stack in general, compared to 7% of the full response pool).
- WMS users are more likely to adopt inventory planning tools (78% of those with a WMS also have an inventory planning tool vs. 65% of all respondents).
Which inventory and demand planning tools do you use?
.png)
While 57% of respondents do not use any inventory and demand planning tools, there was a wide range of technology reflected here. 5% of respondents report using Fuse Inventory, with 3% using Atomic, Fishbowl, Netstock, and Singuli.
Some additional findings:
- For small and mid-sized businesses, 67% and 68% of respondents respectively use demand planning tools of some kind.
- In comparison, only 42% of enterprise respondents use standalone inventory planning tools. This might suggest that enterprises rely more on ERP-based inventory solutions, as opposed to separate tools.
- Inventory tool users rely on WMS, post-purchase, and fraud management tools more often, suggesting that inventory tools are part of a broader operational tech stack.
Which post-purchasing software do you use?
.png)
The majority of respondents (29%) use Loop Returns, with Happy Returns following at 6%.
Some additional findings:
- 57.5% of post-purchasing tool users also have a WMS, compared to only 33% of non-users. This may indicate that companies with structured warehouse operations are more likely to invest in post-purchasing solutions.
- 71% of post-purchase users also have inventory planning tools, compared to only 11% of non-users. This reinforces the idea that post-purchasing software is part of a broader inventory and fulfillment tech stack.
- Post-purchasing tool users are 6.4x more likely to have a fraud management platform, highlighting a connection between post-purchase experience and fraud prevention strategies.
Which fraud management tool do you use?
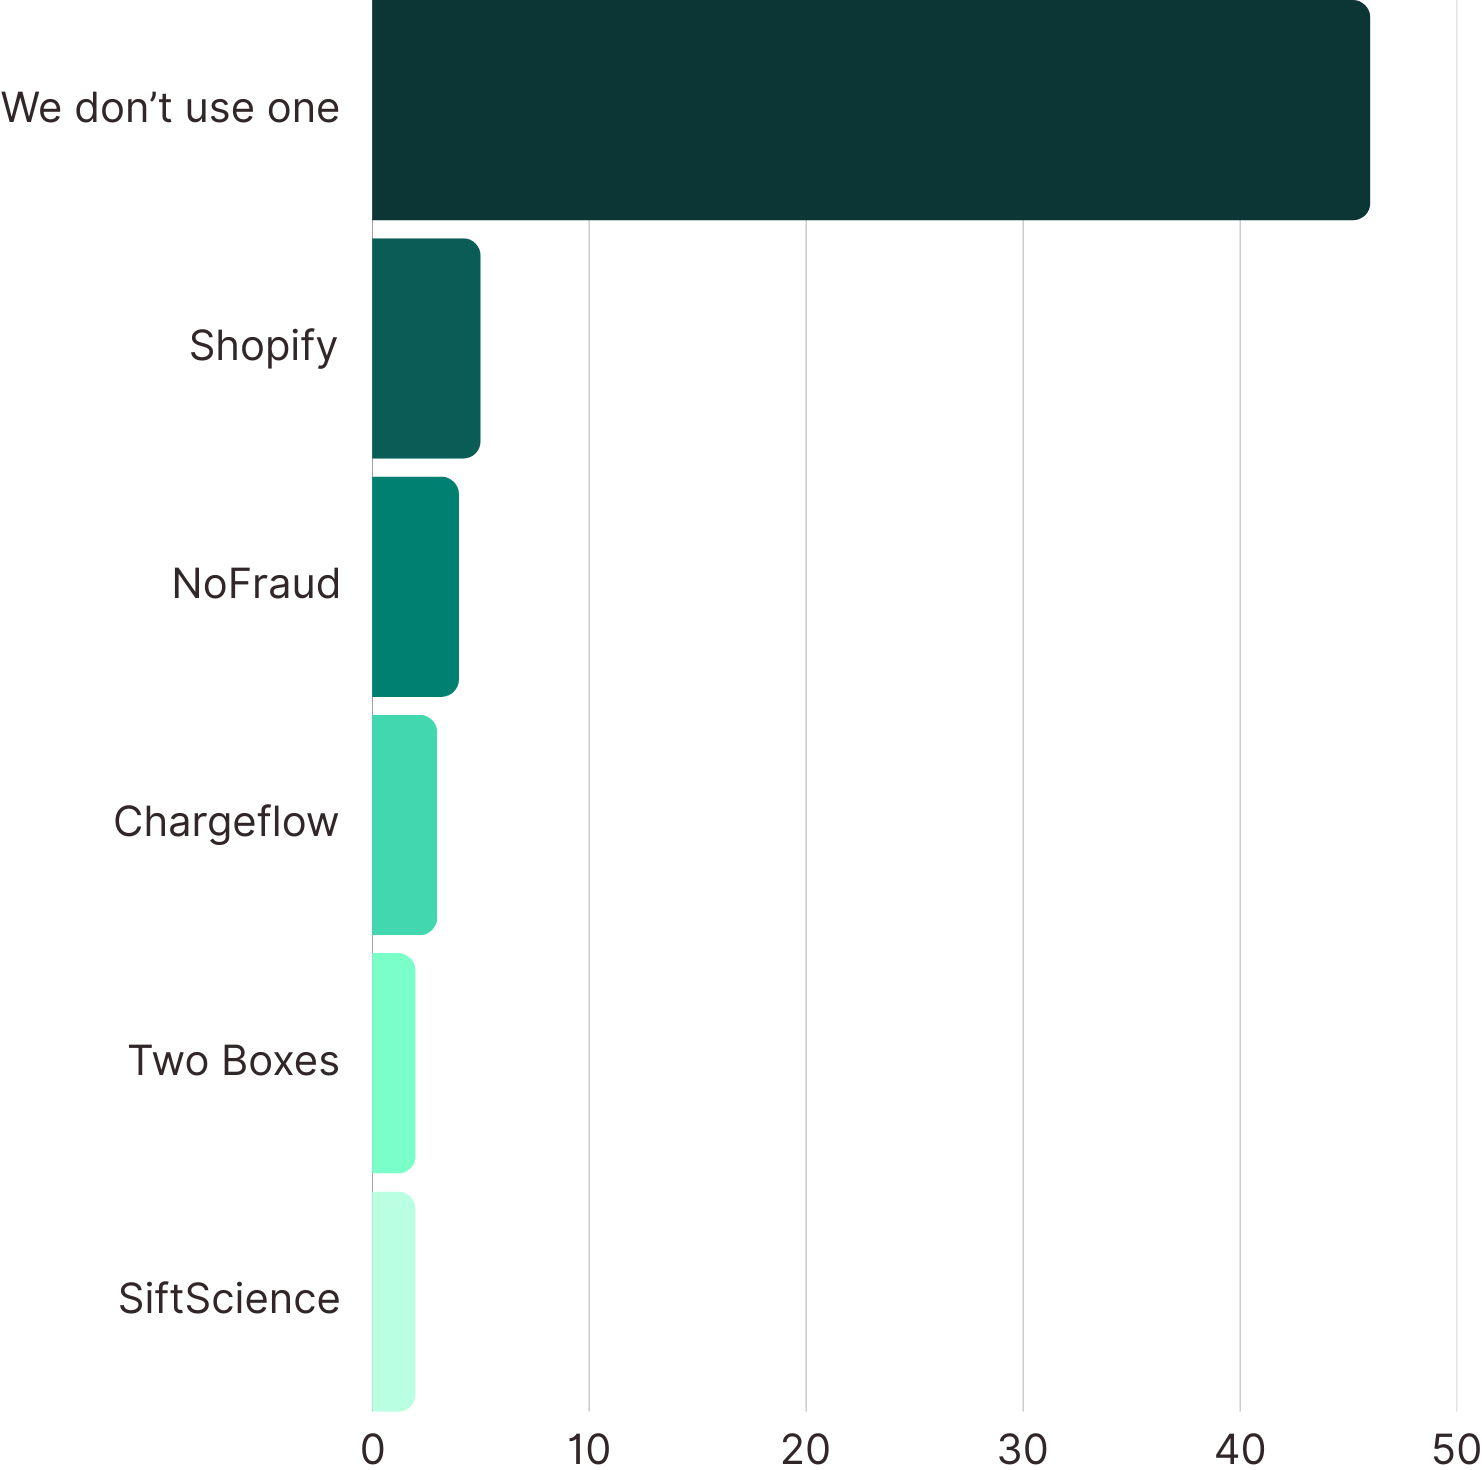
The majority of respondents (46%) report that they don’t use a fraud management tool. Among those that do, NoFraud and Chargeflow are the most commonly used platforms.
Some additional findings:
- Fraud prevention is a mid-market priority. 36% of fraud tool users fall within the $50M–$250M revenue range, while only 16% are small businesses.
- Fraud and inventory accuracy are closely linked. 74% of fraud software users also use inventory planning tools, compared to only 48% of non-fraud users.
- Post-purchase and fraud detection go hand in hand. 98% of fraud tool users also use post-purchasing solutions, vs. 74% of those without fraud management software.
Which shipping software do you use?
.png)
The majority of respondents use ShipStation (15%), followed by EasyPost (8%), ProShip (7%), and Shippo (7%).
Some additional findings:
- Shipping software users are more likely to rely on automation. 94% of shipping software users also use workflow automation, compared to 86% of non-users.
- Post-purchase software and shipping solutions are often paired together. 96% of shipping software users also use post-purchasing tools, compared to 73% of those without shipping software.
- Fraud prevention is more common among shipping software users. 73% also have a fraud management solution, while only 41% of non-users do.
Which PO management tool do you use?
.png)
While 55% of respondents don’t currently use a PO management tool, 11% use Anvyl and 8% use NetSuite.
Some additional findings:
- PO management software is a mid-market necessity. 31% of users fall within the $50M–$250M revenue range, suggesting that purchase order complexity and vendor management challenges intensify at this stage.
- PO management users are far more likely to integrate fraud prevention.76.4% of PO software users also have fraud management tools, compared to just 47.1% of non-users, indicating that businesses leveraging PO software are thinking beyond procurement and into risk mitigation.
Conclusion
The story that emerges from our survey data is clear: Brands are caught between the imperative to innovate and the reality of constrained resources. With only 7% of respondents “very satisfied” with their current tech stack, the status quo isn’t sustainable. Yet with 45% citing budget constraints as their primary barrier to adoption, the path forward isn't simple.
Three key principles will define successful tech stack strategies in 2025:
1. Embrace AI or fall behind
With 54% of respondents viewing AI as “essential” to future operations, the question isn’t whether to adopt AI, but how to do it strategically.
It’s one of those technologies that the later you start, the further behind you’re gonna be"
Paige Zachs, VP of Supply Chain, Ops, and Customer at Coterie
2. Prioritize integration and visibility
The data is emphatic: lack of integration (60%) and limited visibility (50%) are crippling current tech stacks. Brands that solve these challenges will have a significant competitive advantage.
3. Build for scale, not just for today
“You can find brands doing $100 million in revenue that basically have 20 people,” notes Shah. Tomorrow’s winners will be those who leverage technology to grow revenue without proportionally growing headcount.
The brands that succeed won’t necessarily be those with the biggest technology budgets. Instead, success will come to those who can:
- Make strategic bets on the right tools at the right time
- Focus relentlessly on integration and automation
- Measure and prove ROI to justify further investment
- Build internal expertise alongside their tech stack
The message for brands is clear: In a world where doing more with less is the new normal, your technology stack isn’t just a collection of tools — it’s the foundation of your competitive advantage.