A home for your data, in Parabola

Parabola Flows represent the living, functional, documentation of a team’s processes. Building a Flow both performs a specific set of tasks, and documents all of the components of that process. With recent updates like Card Templates and the new Flows page, that documentation has become more flexible and sharable.
In many cases, Parabola Flows power the automation of a process, but the final product lives elsewhere (such as, in a spreadsheet). This exacerbates the tool fragmentation that teams already experience, and can make it difficult to fully understand just what a Flow is doing, or how that final product was created.
Today, we’re excited to announce Parabola Tables: a home for the output of your Flows. Flows are already the repository for core processes and logic, and now they are also the repository for the final product – the result of all that work you automated.
See it all in action:
Fewer tools, simpler workflows
With the “Send to Parabola Table” step, you can publish reports that are easily shareable with your entire team. Instead of sending data from Parabola to another tool, which introduces yet another tool to manage and adds steps to your workflow, Parabola Tables keep the output of a Flow right next to the logic. One place to view, understand, and share the output of a Flow, embedded alongside the underlying process that was used to create it.

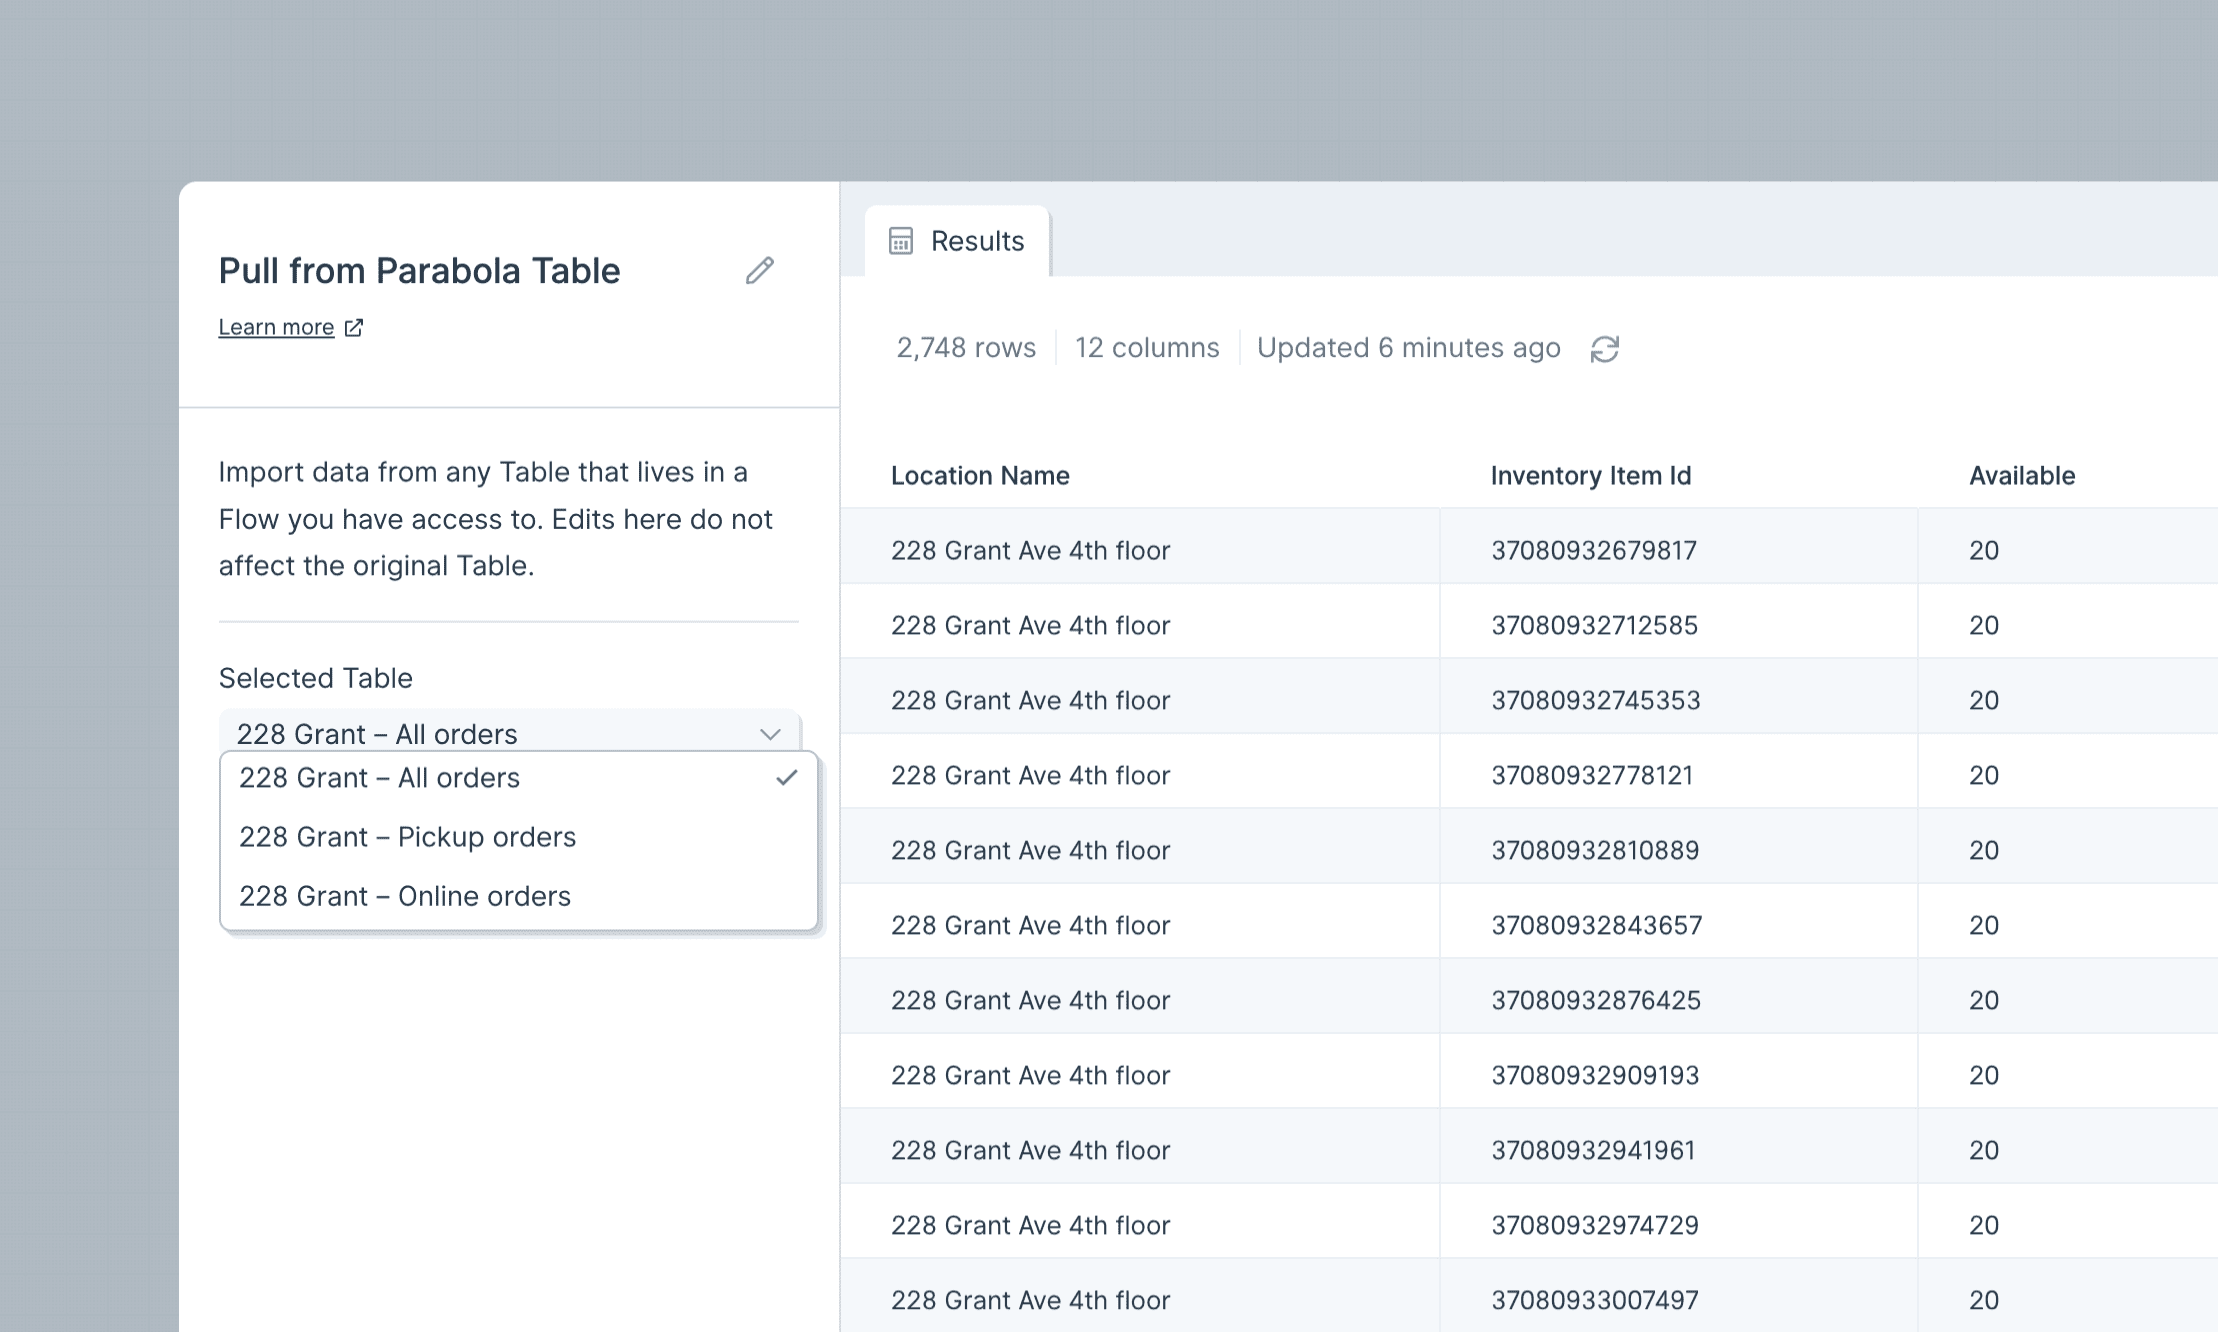
You can also use data from Parabola Tables in any of your other Flows with the “Pull from Parabola Table” step. One builder can create a Flow that pulls in raw data, cleans it, combines it, and prepares it for general use – effectively creating a custom data set!

Managing access to data is easier with Parabola Tables. Using Parabola Tables centralizes your team’s data access within Parabola, rather than across many tools. Each table can only be modified by the Flow that owns it, and anyone who has Viewer or Editor access to that Flow can use that table as a source dataset in another Flow. Easy as that!
Use cases
This is early days for Parabola Tables, but we’re confident that they can already help address some of the most common themes we have heard and seen from our customers. Here’s a deeper look into using Tables for:
- Reporting
- Custom data sets
- Managing Flow state data
What’s next for Parabola Tables
As we write this, we’re releasing our first version of Parabola Tables! We have many exciting capabilities planned for this feature. Some sneak peeks at what’s to come:
- Summarize data: create grand total rows and sub total rows by indicating which columns should show a sum, average, count, and more.
- Take action on tables: add filter rules, sorting rules, and even custom grouping logic to create the exact report that your team needs.
- Create views: save specific combinations of filters, groupings, and even color themes. Save and reference them later, or share with your teammates!
We can’t wait to see what you power with Parabola Tables, and we’re eager for your feedback!

