What is Google Analytics?
Google Analytics is a web analytics platform that helps businesses track and analyze website traffic, user behavior, and marketing performance. It provides insights into visitor demographics, engagement metrics, and conversion tracking, enabling businesses to optimize their online presence and marketing strategies. Google Analytics is widely used for data-driven decision-making in digital marketing and e-commerce.
Pull from Google Analytics 4
This step will only work with Google Analytics V4. If you have not yet migrated over to GA V4 and are using Google’s Universal Analytics, you will need to use the Pull from Google Analytics UA step to pull in your Google Analytics data. Google is deprecating Universal Analytics on July 1, 2023. Once you have moved your data over to Google Analytics 4, you will need to update your flows to use this Parabola step to continue accessing your Google Analytics data. Read more about how Google is updating this here.
Use the Pull from Google Analytics 4 step to bring all of your Google Analytics data into Parabola in a familiar format. Choose a date range and which metrics and dimensions to pull in to create a report just like you are used to doing in Google Analytics.
Connect your Google Analytics account
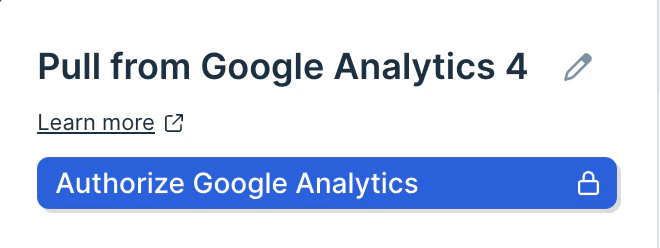
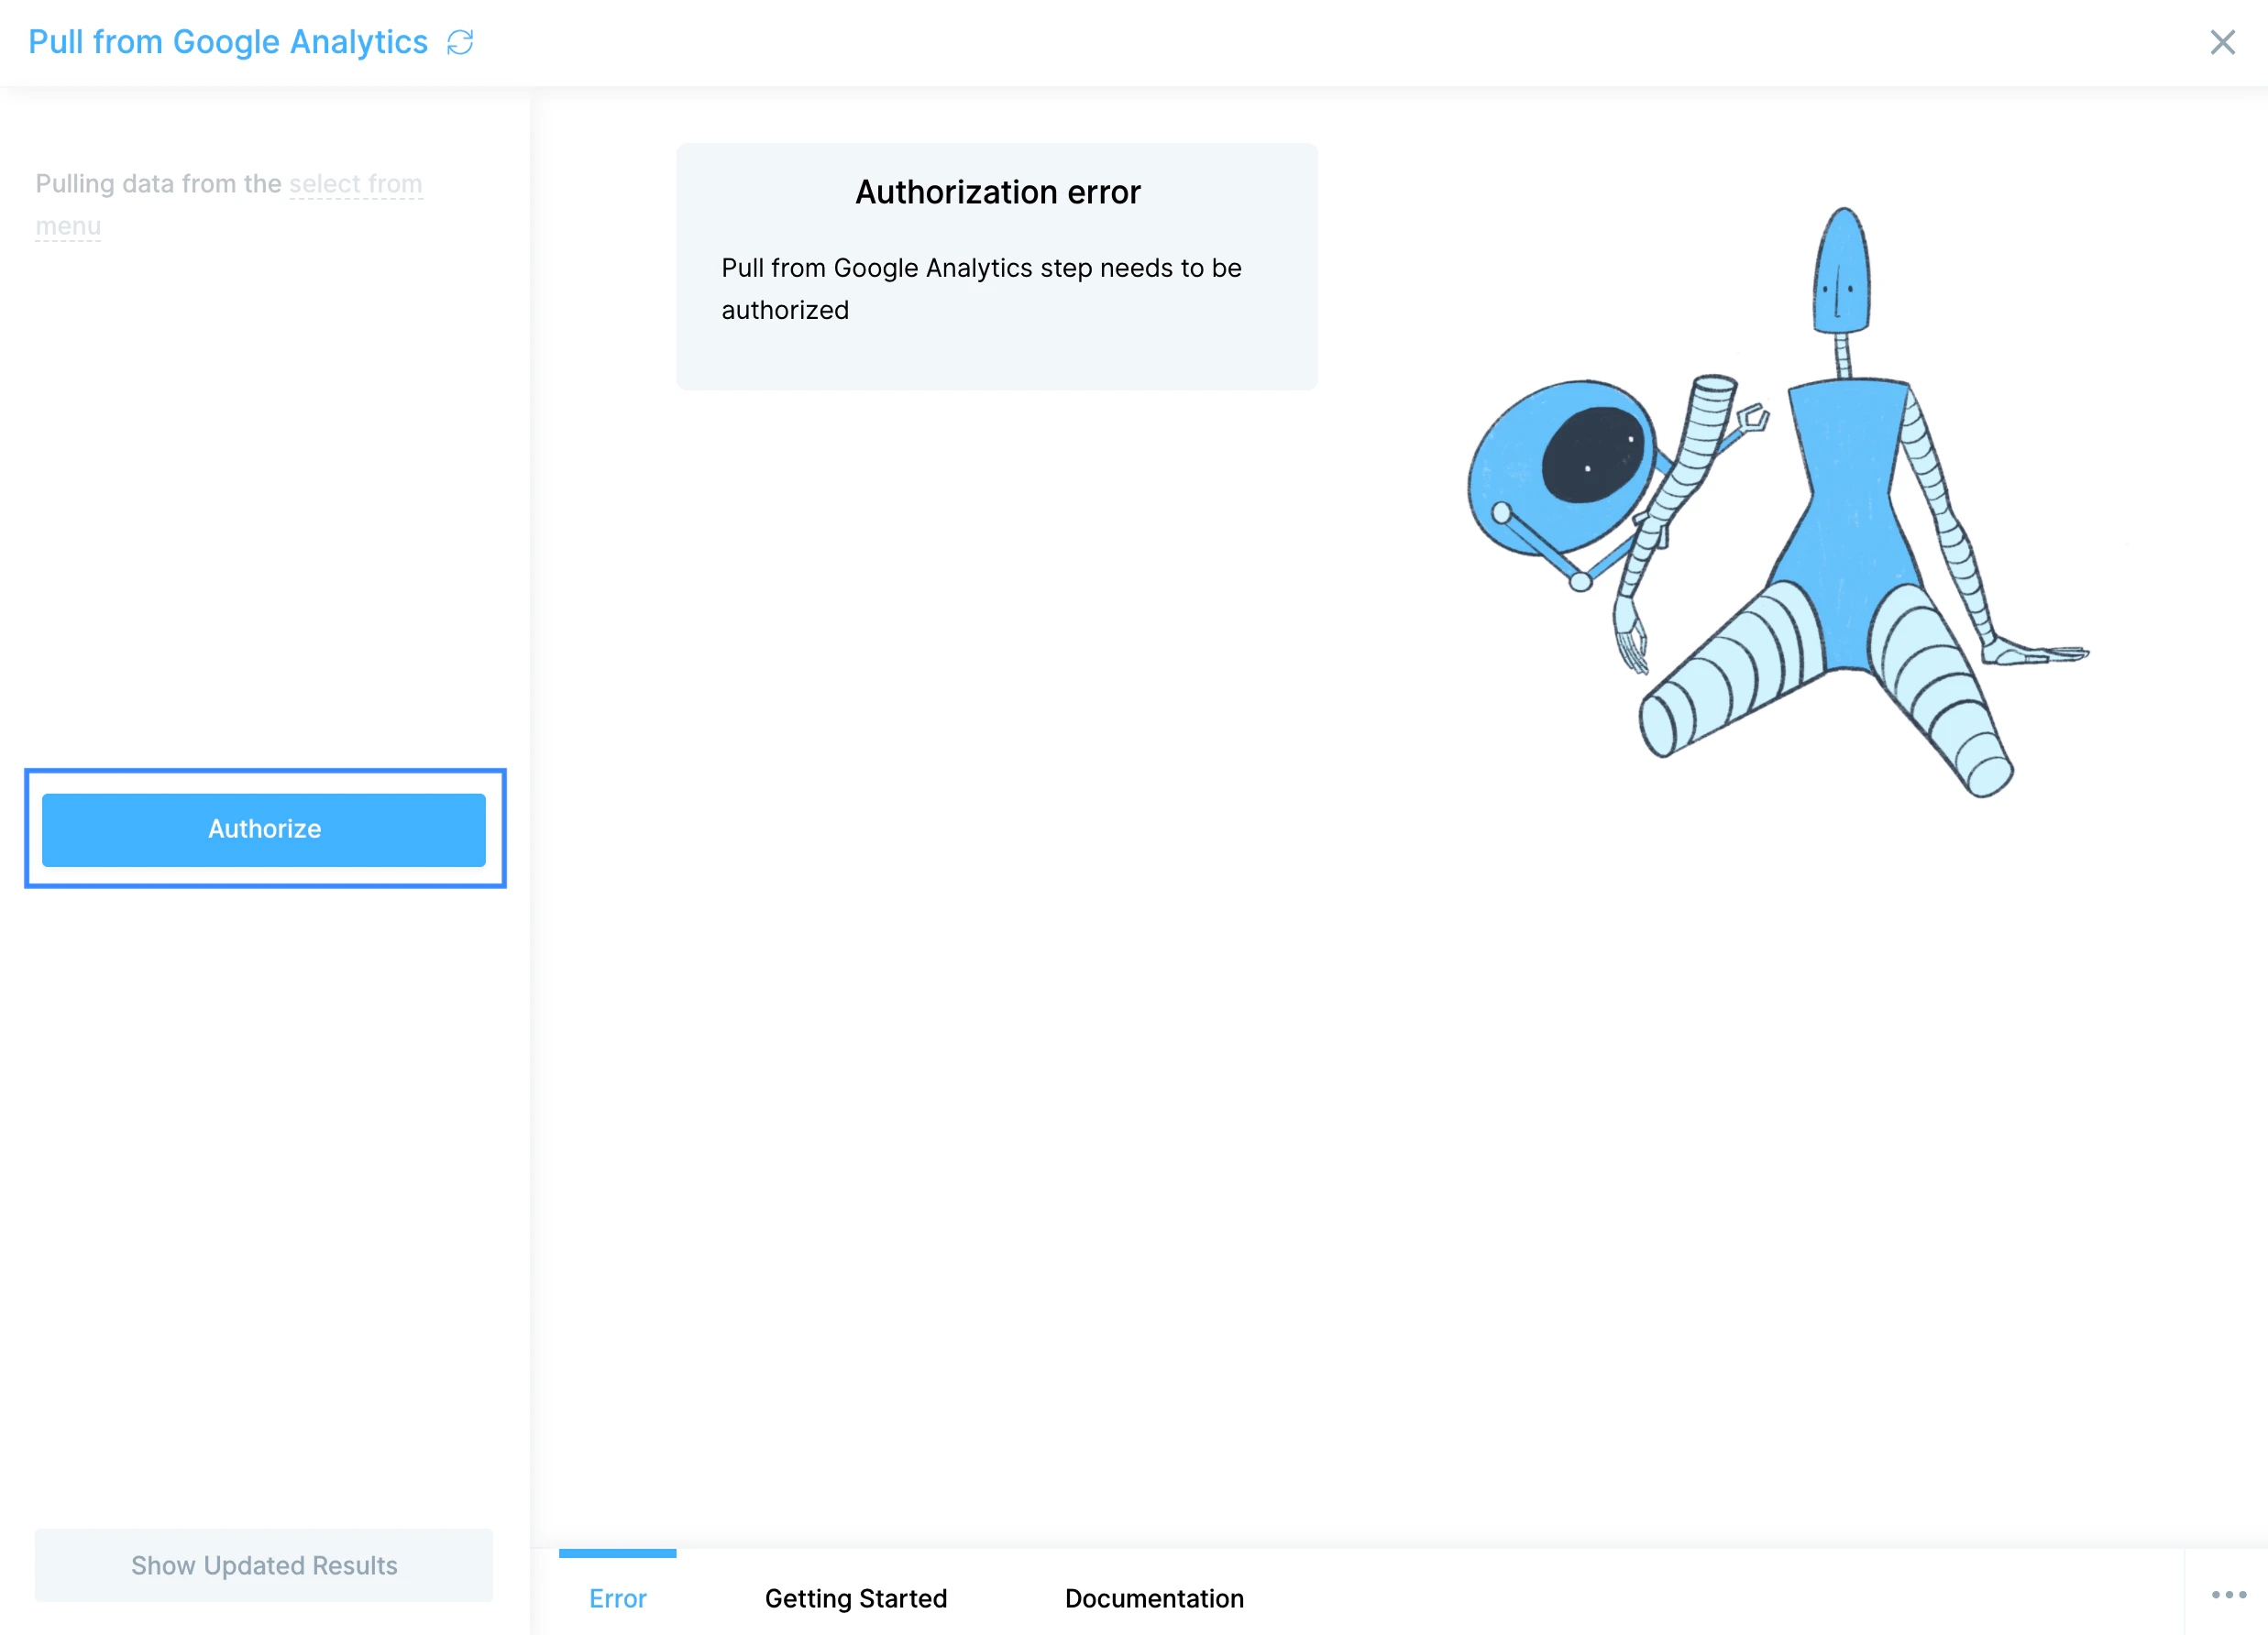
Begin by authenticating your Google Analytics account by clicking Authorize.
Choosing your settings
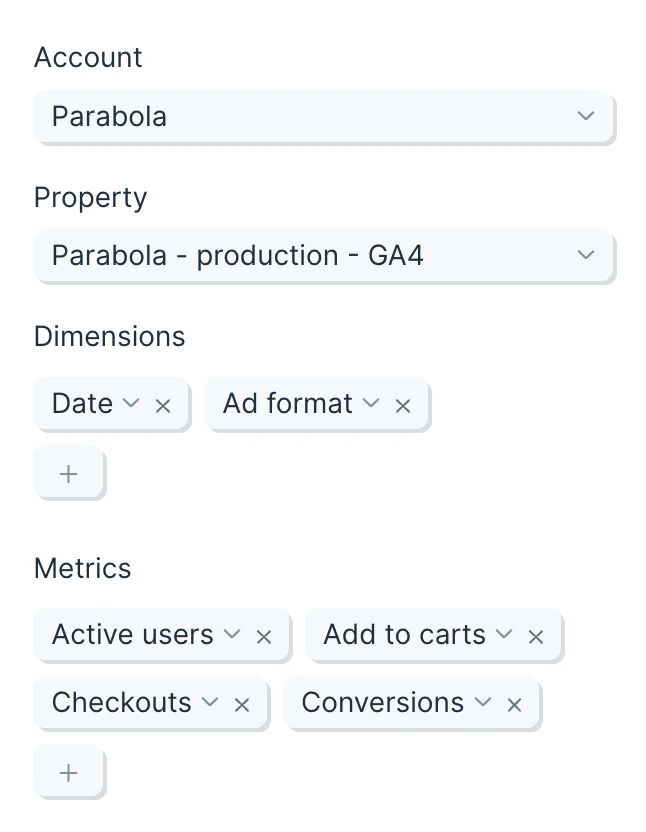
First, select the Account and Property that you would like to pull data from.
Then, select which metrics to pull in. These are same metrics that are available in Google analytics. Every metric that you add will result in a column being added to your report. You can select as many metrics as necessary for your report, including New Users, Bounces, Sessions, and many more.
Use dimensions to group your metrics and break them into more rows. Each dimension adds a column to the front of your table, and often will change any how many rows your report contains. Leaving the dimensions field blank will result in a single row of data.
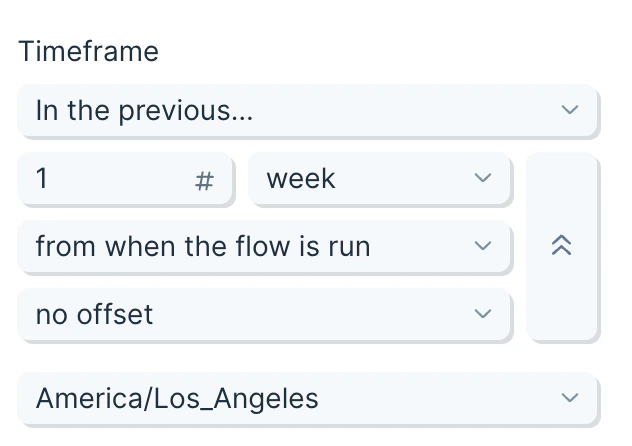
The time frame can be updated to let you pull data from:
- In the last 7 days
- The previous day
- In the month to date
- The previous X days/weeks/months/etc.
- The current X day/week/month/year to date.
- After a set date
- Between two dates
You can also adjust for when you’d like the timeframe calculation to run, giving you the ability to pick between when the flow is run or the most recently completed month/week/day/hour. The latter option is great for running a report for the last month, on the 1st of the following month, while excluding any data collected for far that day.
Lastly, if you choose, you can add offset for your date timeframe.
If you are looking to compare this data set to the same set, but from the previous period, a great way to do that is to pull in the two data sets, and the use the Combine tables step to combine them, using their dimensions in the matching rules.
Helpful tips
- This step is available starting at our Plus plan.
- The Pull from Google Analytics 4 step will only show you options for metrics and dimensions that are compatible (as defined by Google) with your current selection. You can explore valid combinations using this tool.
Migrating to the Google Analytics 4 step
Google is deprecating Universal Analytics on July 1, 2023. To continue accessing your Google Analytics data, you will need to update to Google Analytics 4 as outlined by Google here. Once you’ve migrated over to GA4, you will need to use this new Pull from Google Analytics 4 step to pull in your data.
In any existing flow that has a Pull from Google Analytics step, you will need to replace it with a new Pull from Google Analytics 4 step.
Setting your replacement steps up should be as easy as replicating the metrics and dimensions that you were pulling.
Keep in mind that combinations of metrics and dimensions that may have been valid in Google Analytics UA (the prior version) may no longer be valid in Google Analytics 4. Our new Pull from Google Analytics 4 step will only show you options for metrics and dimensions that are compatible (as defined by Google) with your current selection.
Pull from Google Analytics UA
Google is deprecating Universal Analytics on July 1, 2023. To continue accessing your Google Analytics data, you will need to update to Google Analytics V4 as outlined by Google here. Once you’ve migrated over to GA4, you will need to use our new “Pull from Google Analytics 4” step to pull in your data.
New data will continue to be pulled in by your existing Pull from Google Analytics steps until July 1, 2023. After that date, existing data will continue to be accessible in Parabola for at least 6 months, until Google no longer allows access to that historic data.
- New data will continue to be pulled in by your existing Pull from Google Analytics steps until July 1, 2023.
- After that date, existing data will continue to be accessible in Parabola for at least 6 months, until Google no longer allows access to that historic data.
If you have any questions, please reach out to help@parabola.io.
Connect your Google Analytics account
Begin by authenticating your Google Analytics account by clicking Authorize.
Default settings
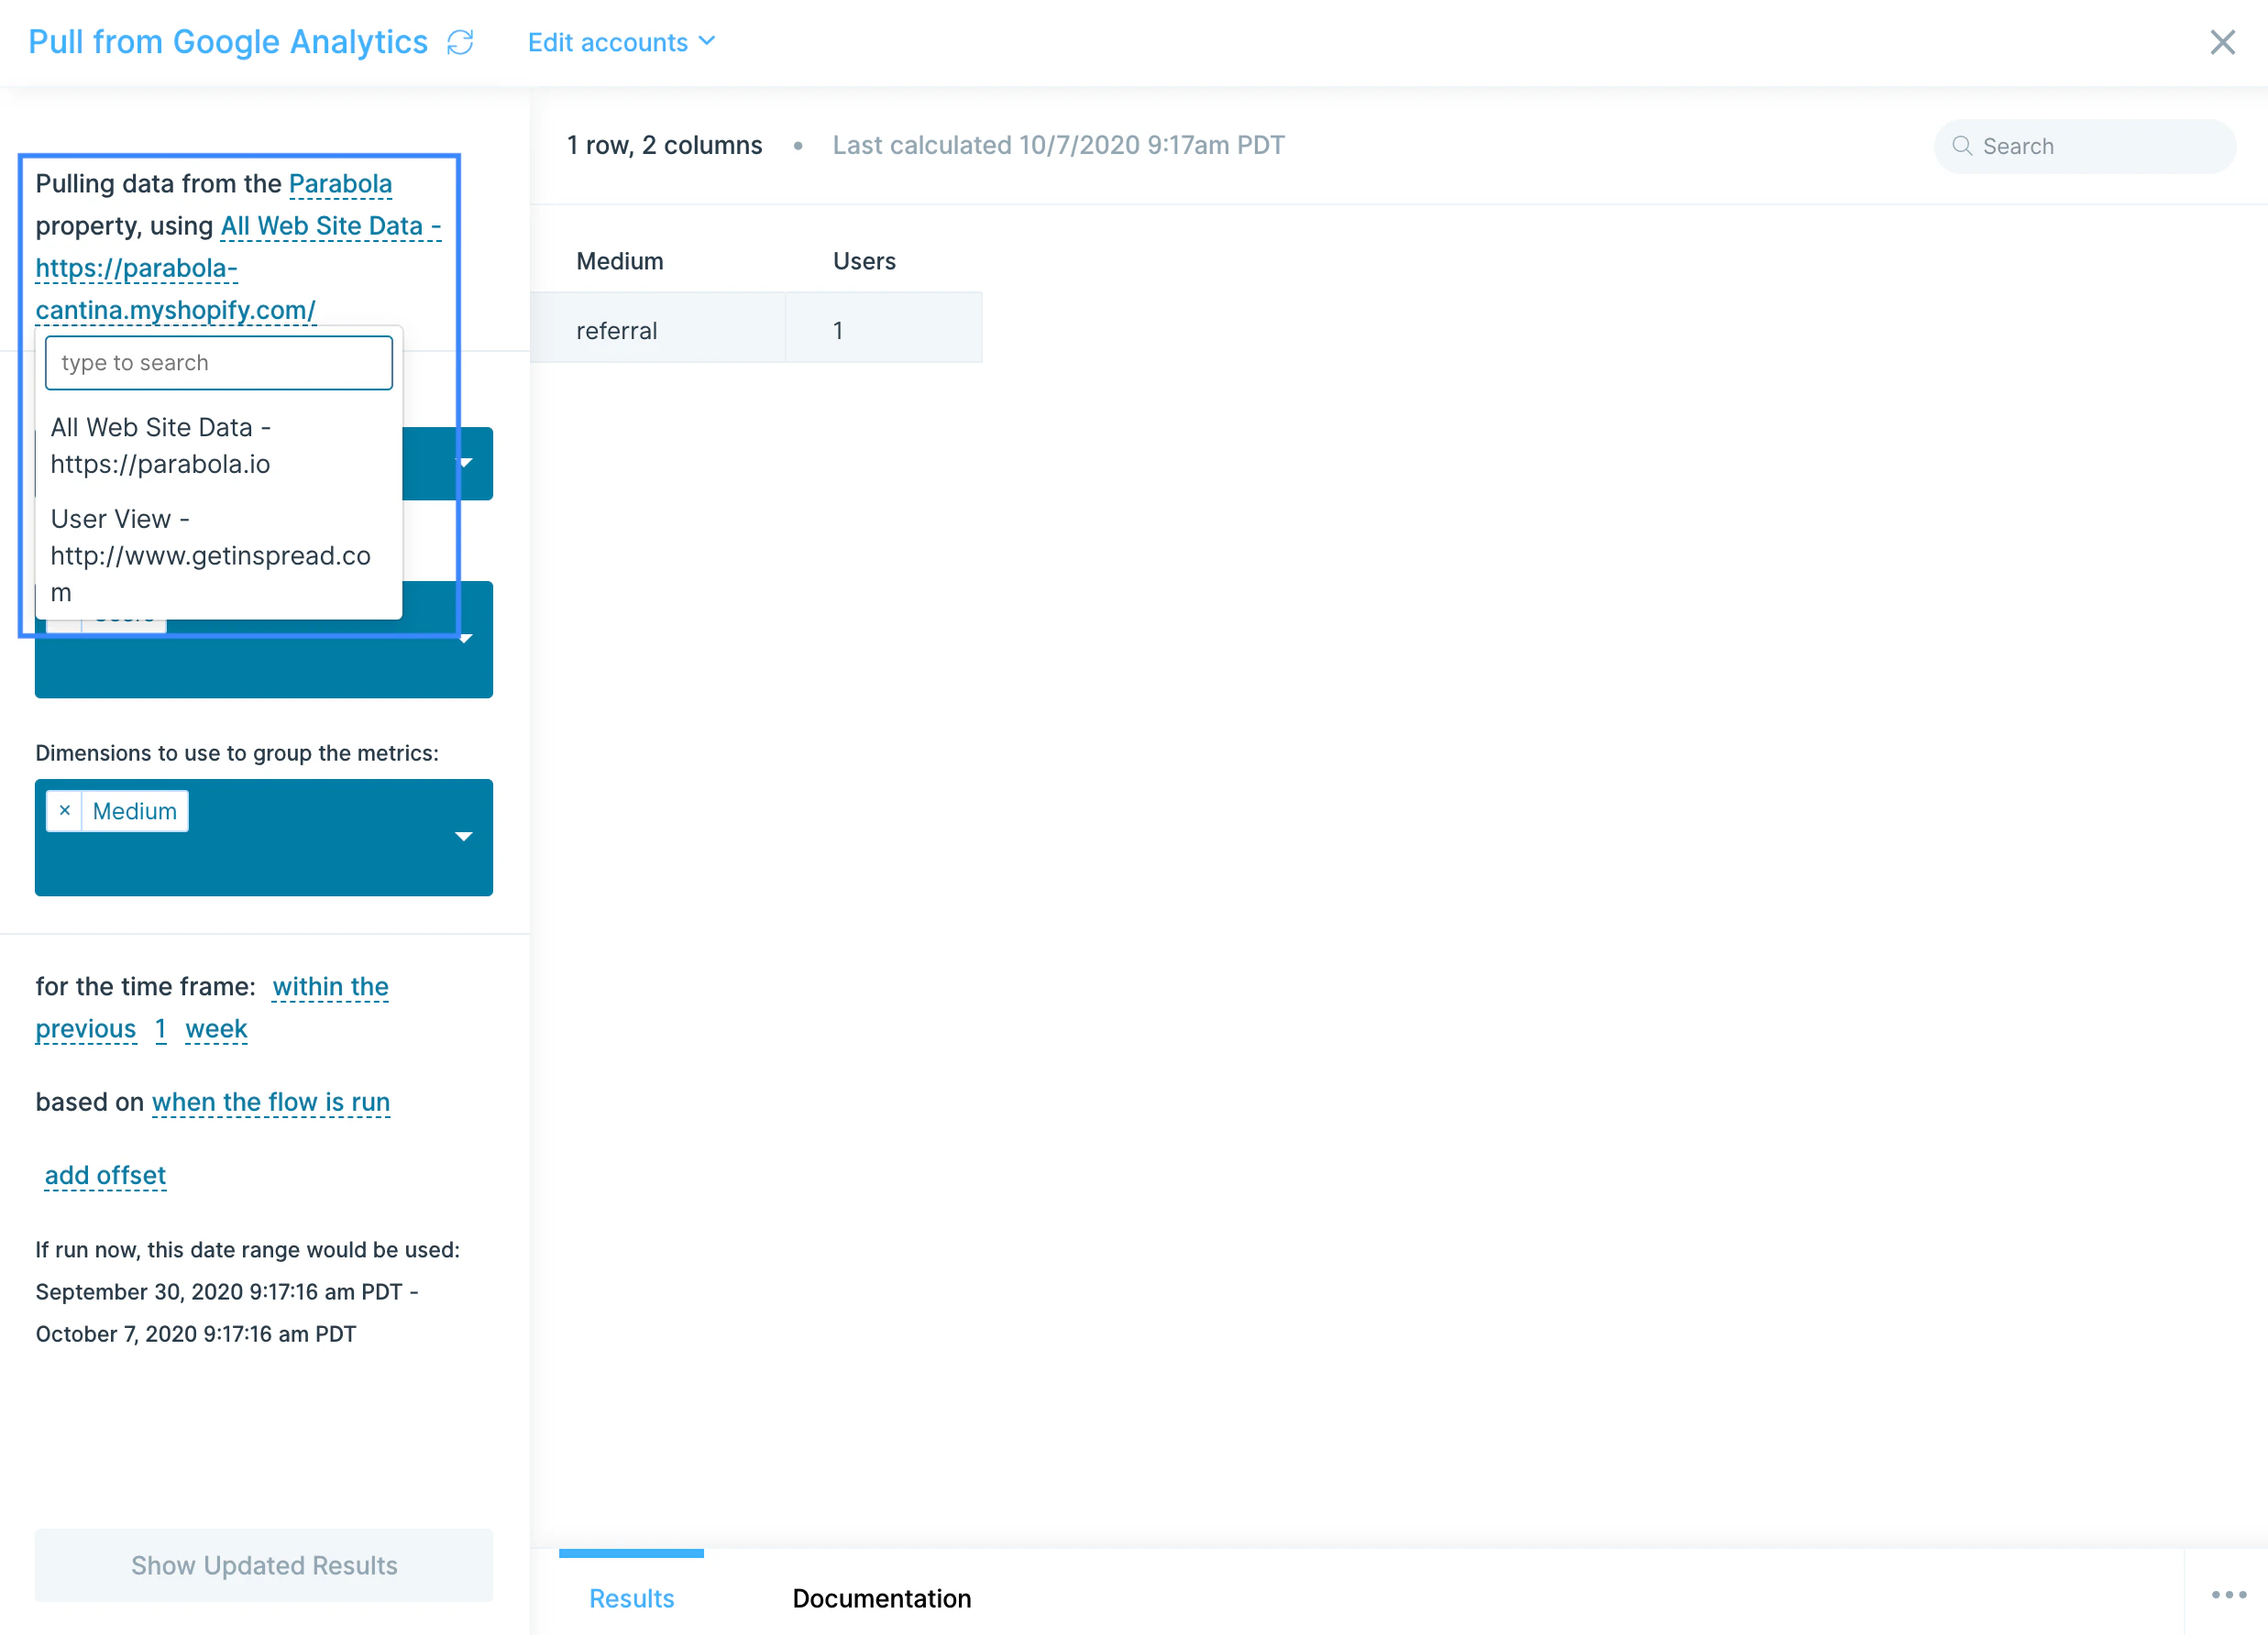
Make sure that you’re pulling data from the correct property and site.
You can adjust which property or site’s data is being pulled into Parabola by selecting from the dropdown.
By default, the Pull from Google Analytics step will bring in Users by Medium.
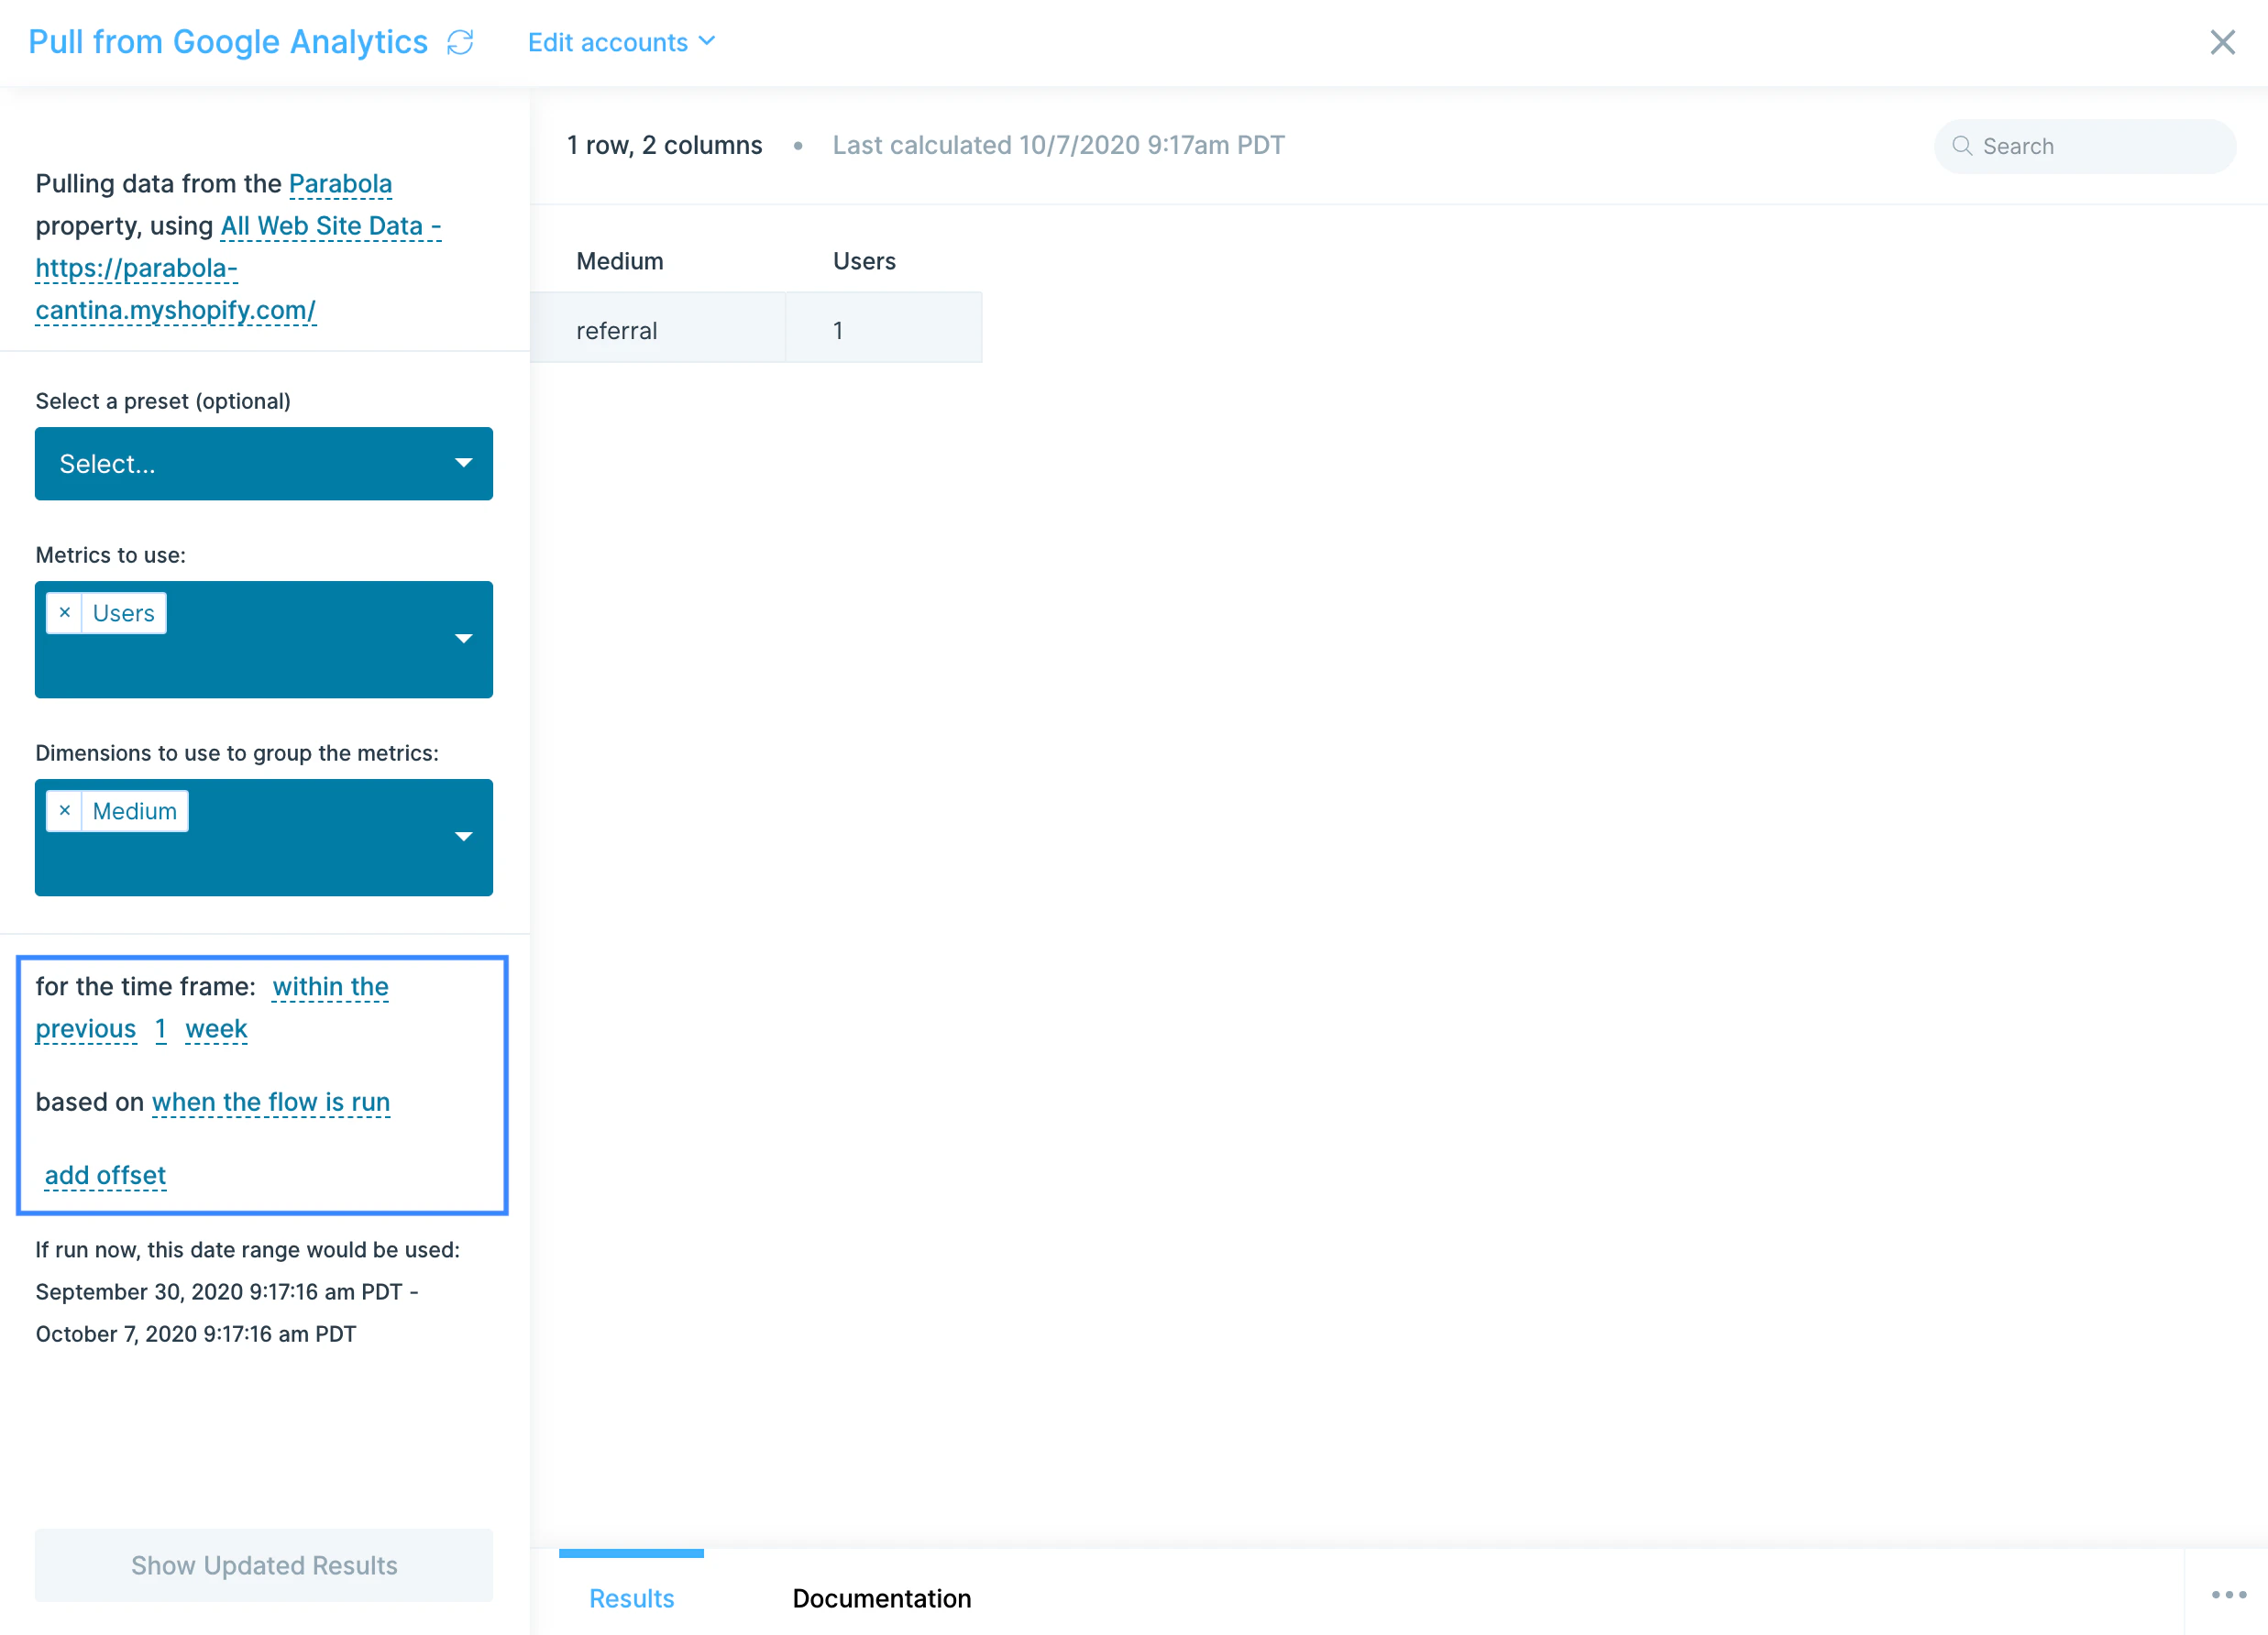
The timeframe is also set to within the previous 1 week based upon when the flow is run, without an offset of dates.
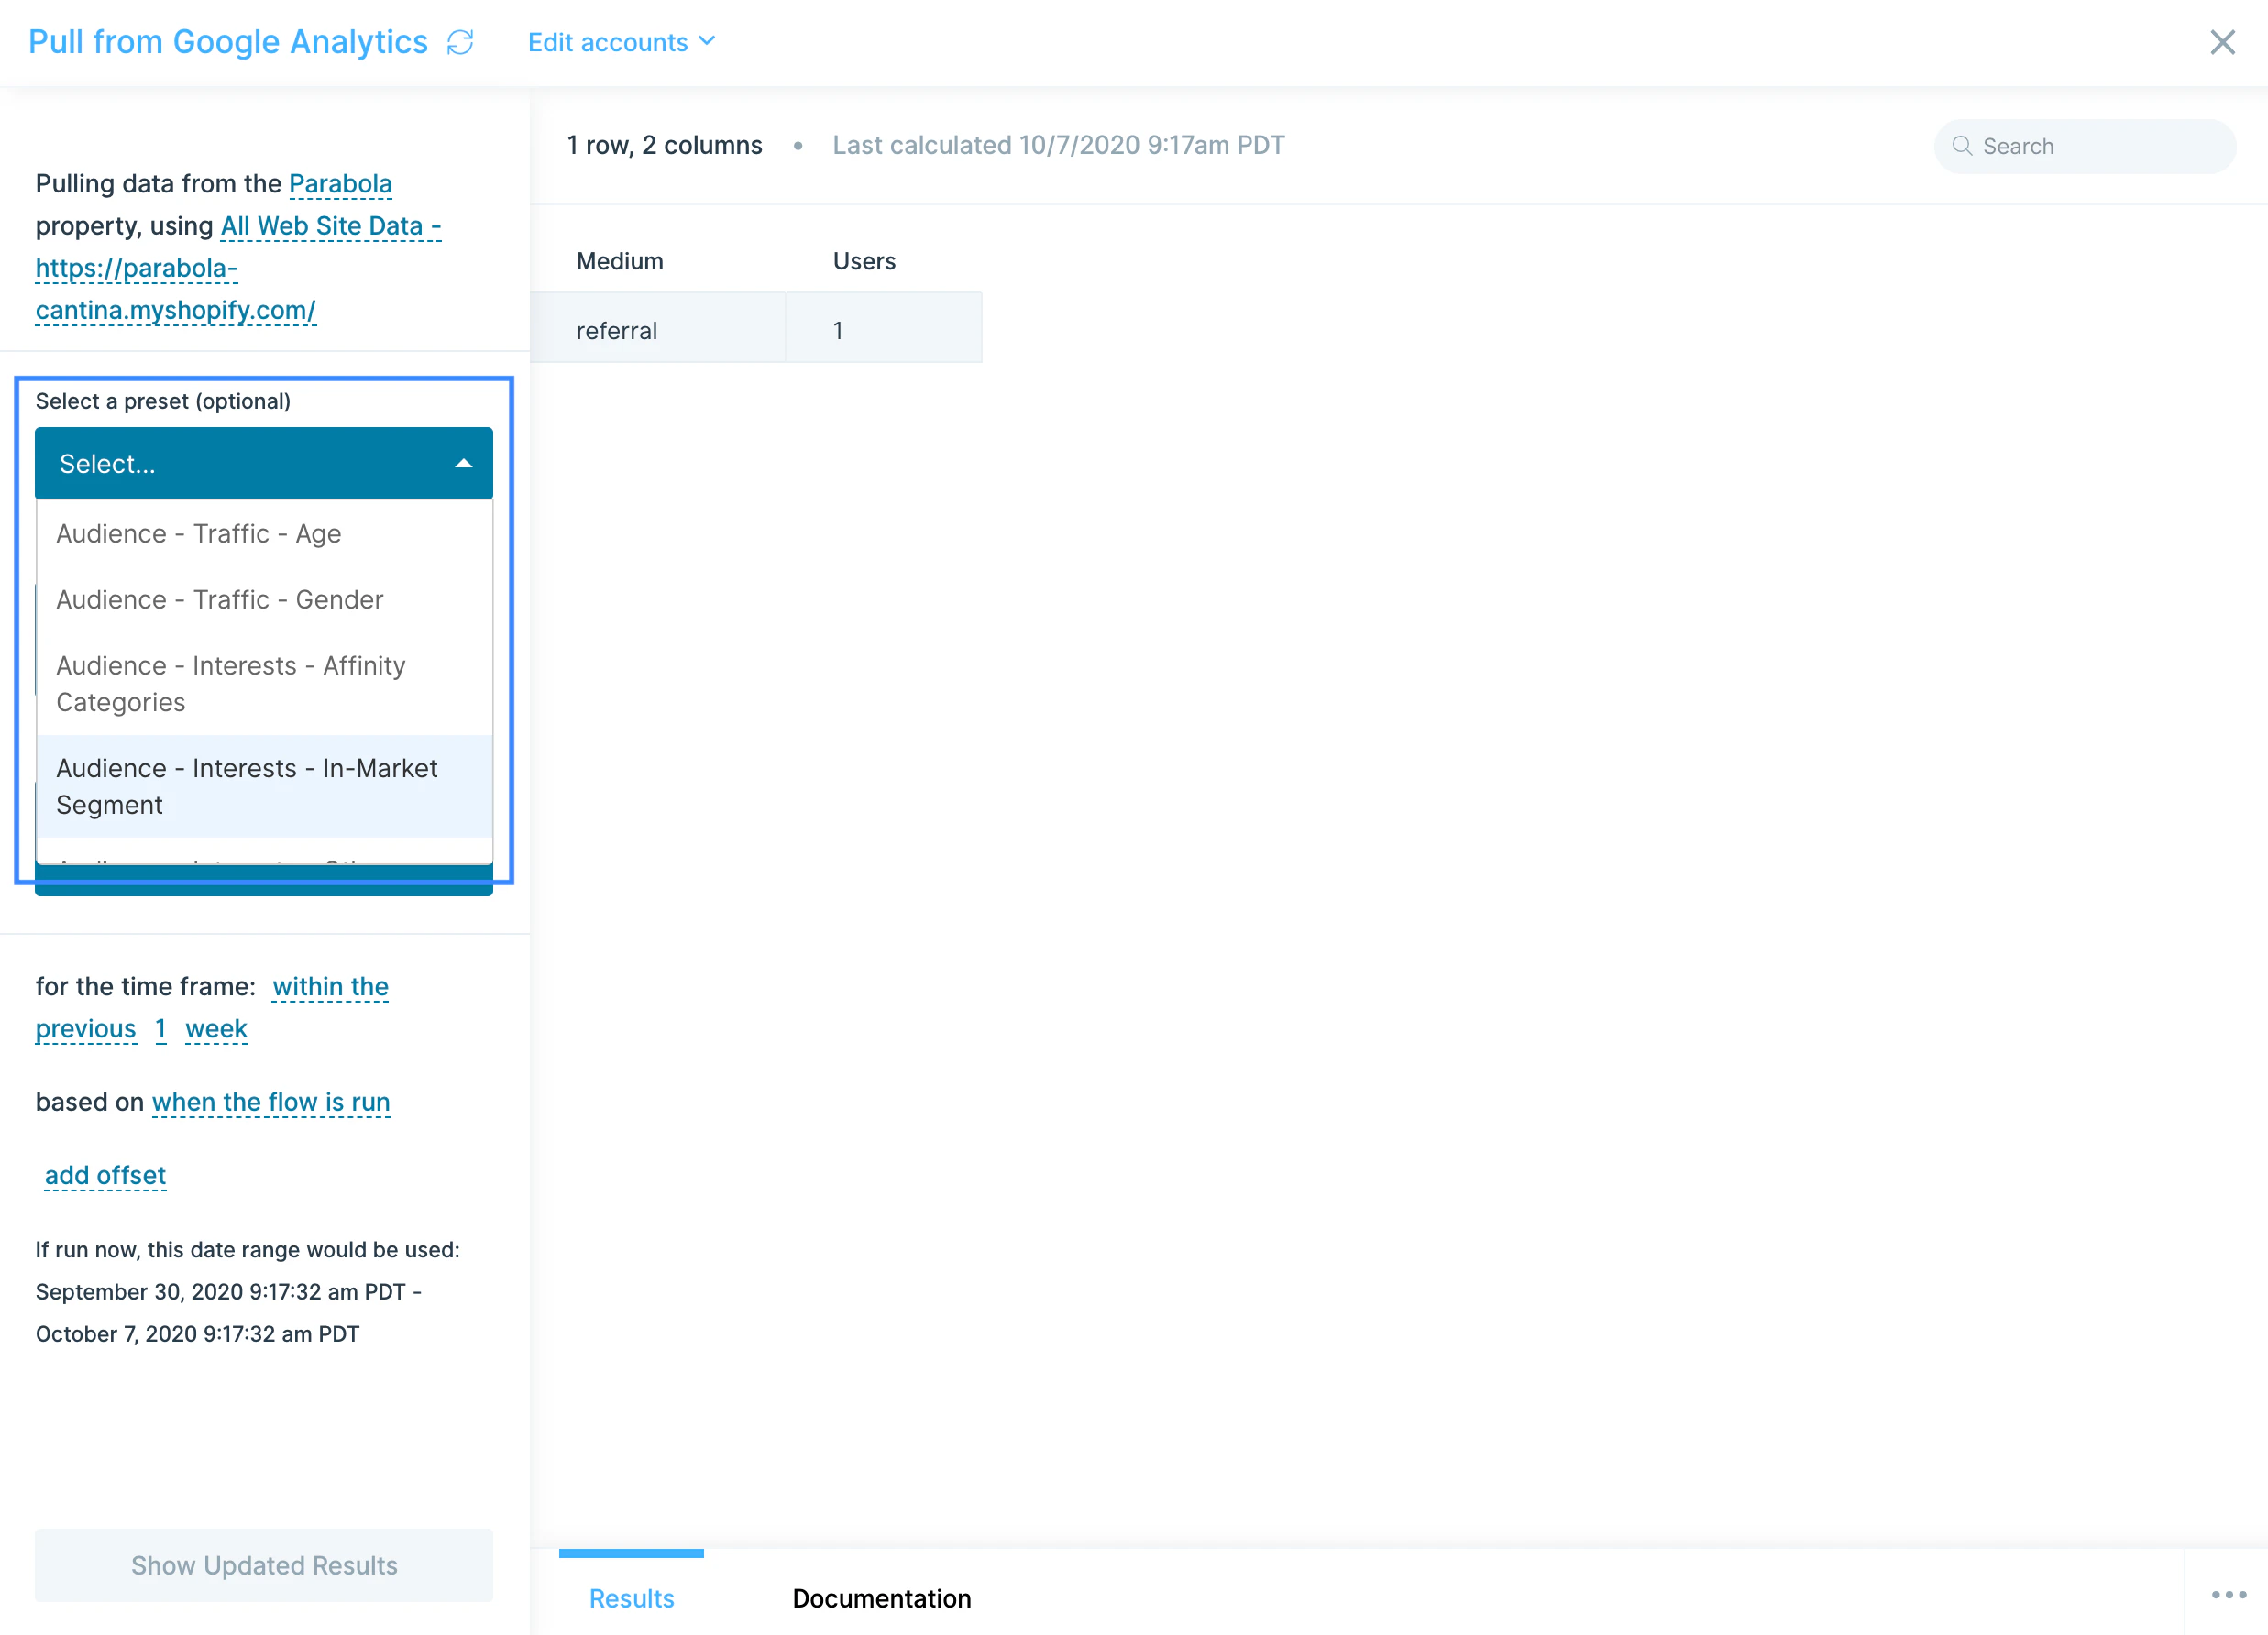
Presets
We offer a variety of preset reports that are the same as those in the Google Analytics sidebar. Selecting a preset report will update the columns in your Metrics to use and Dimensions to use to group the metrics selection fields.
Use these as-is, or as a base for building your own customized reports.
Custom settings
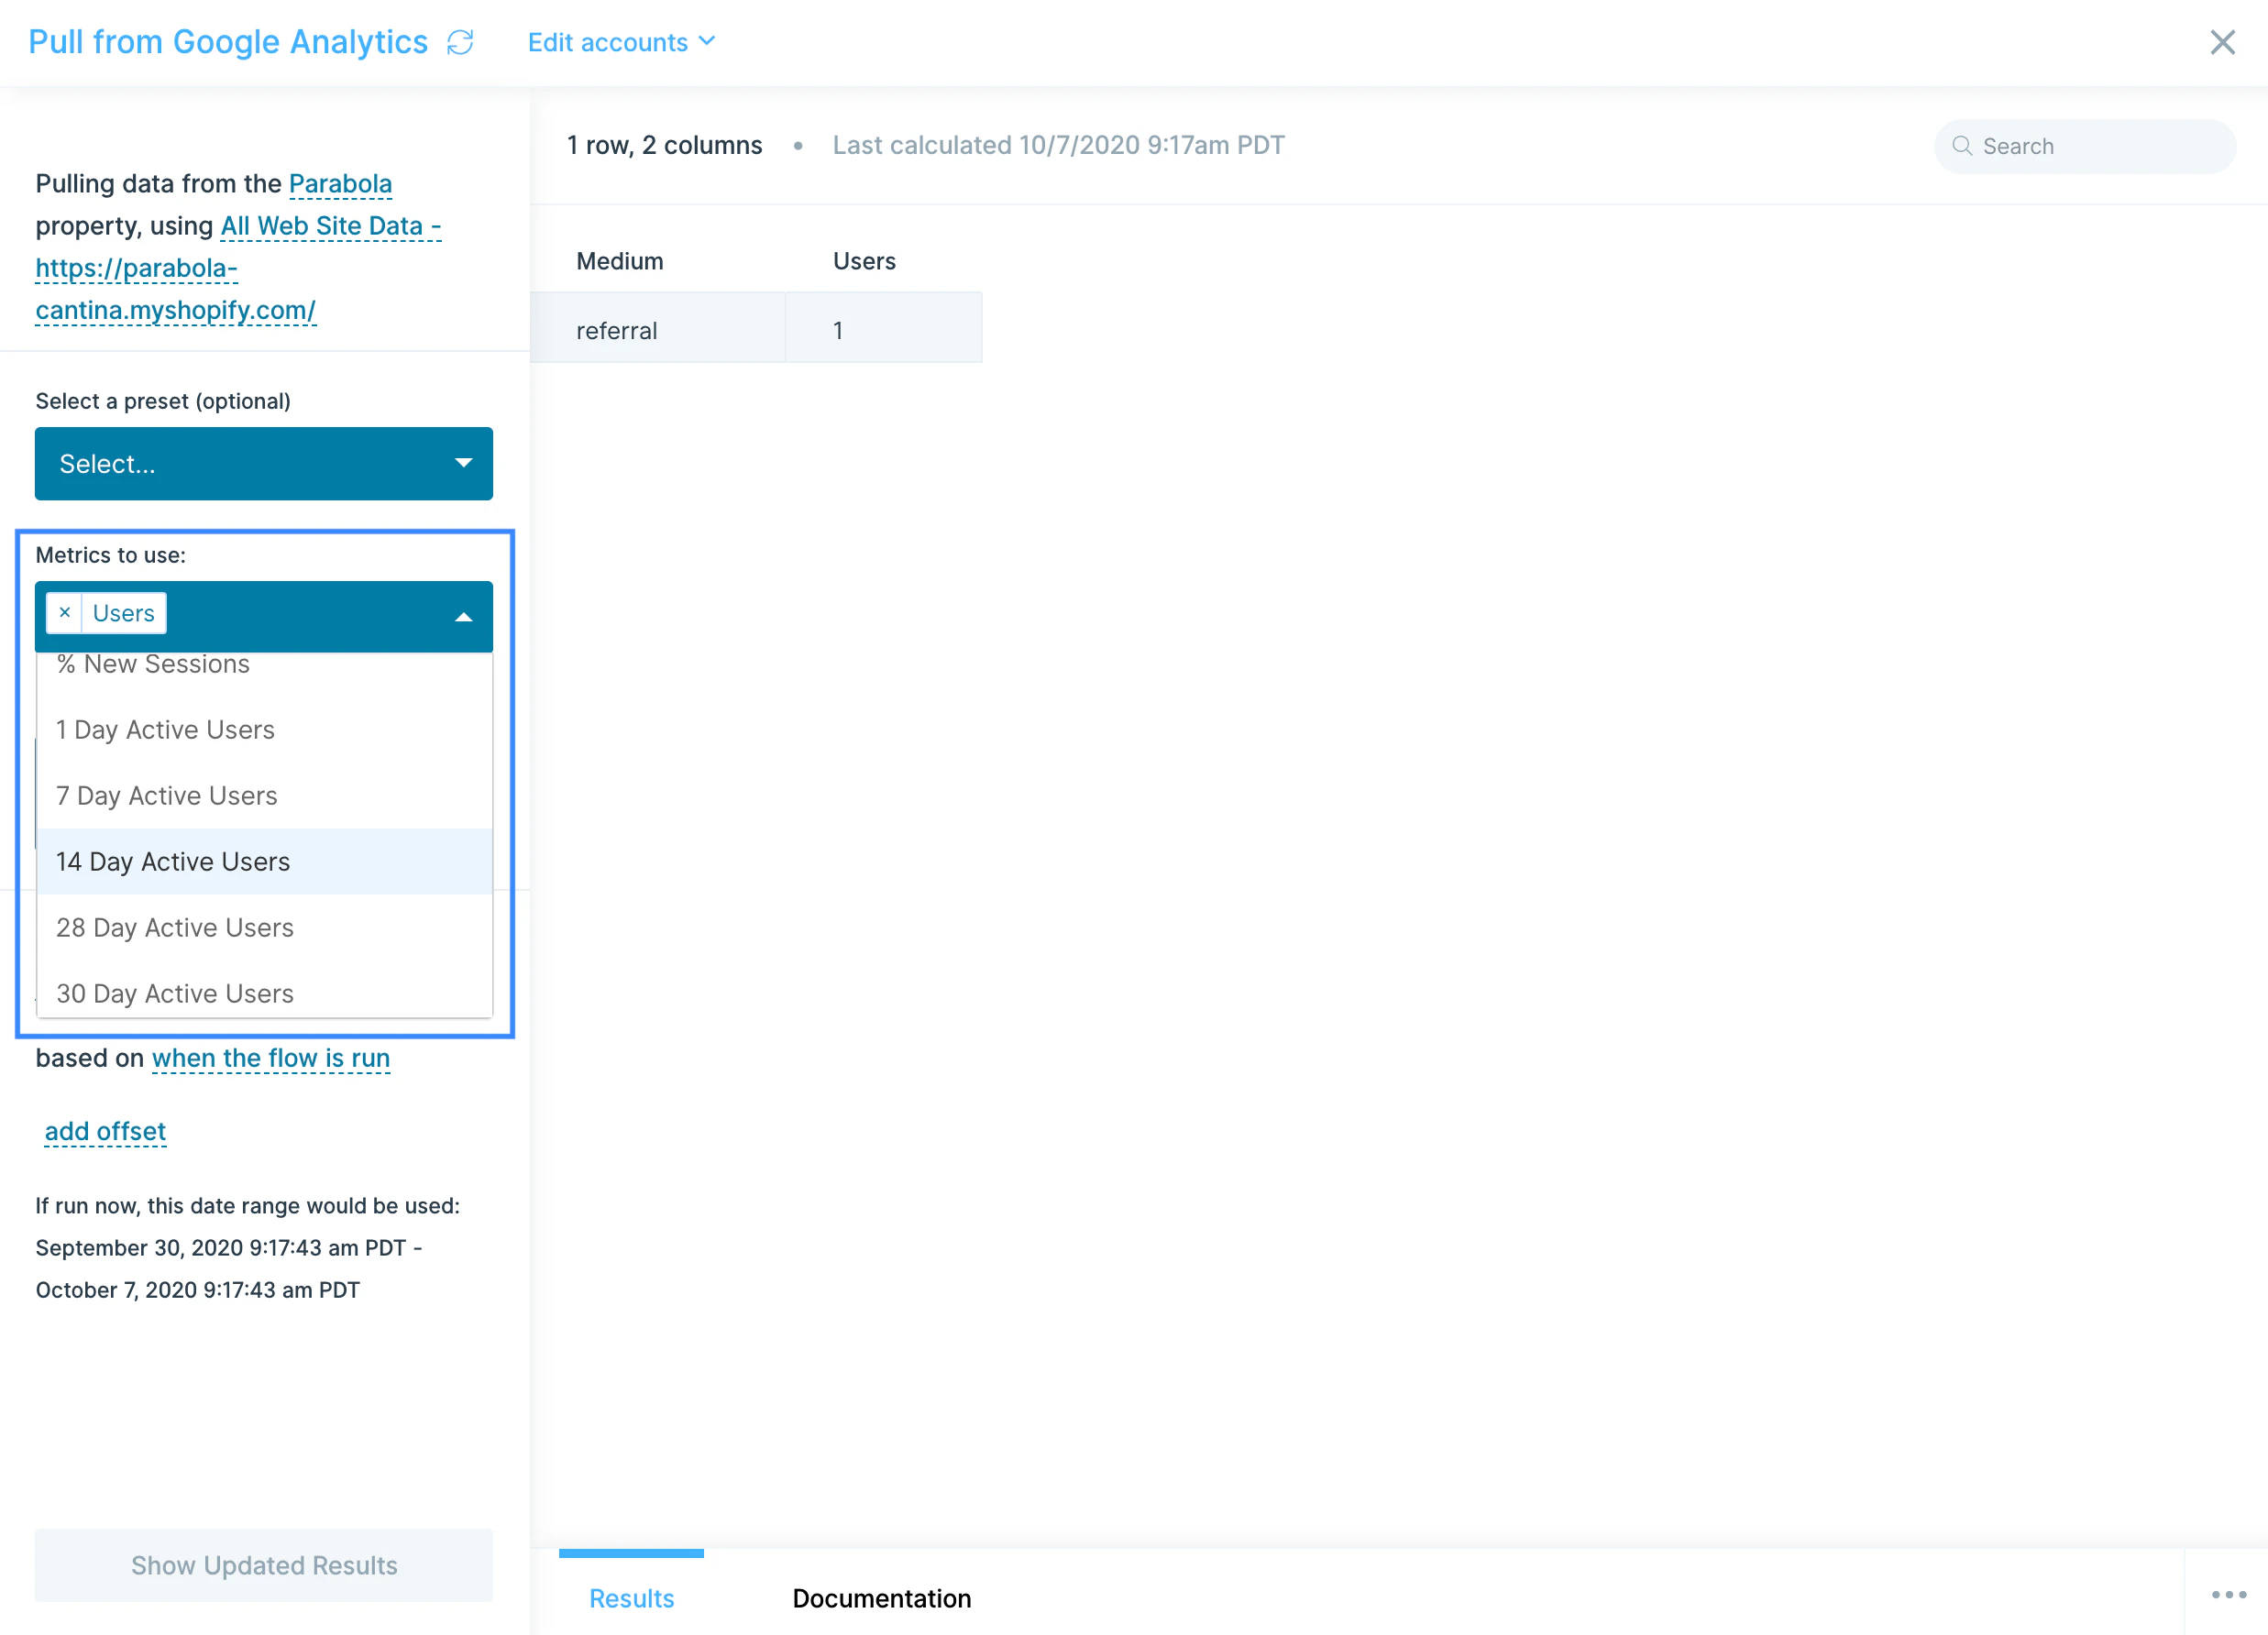
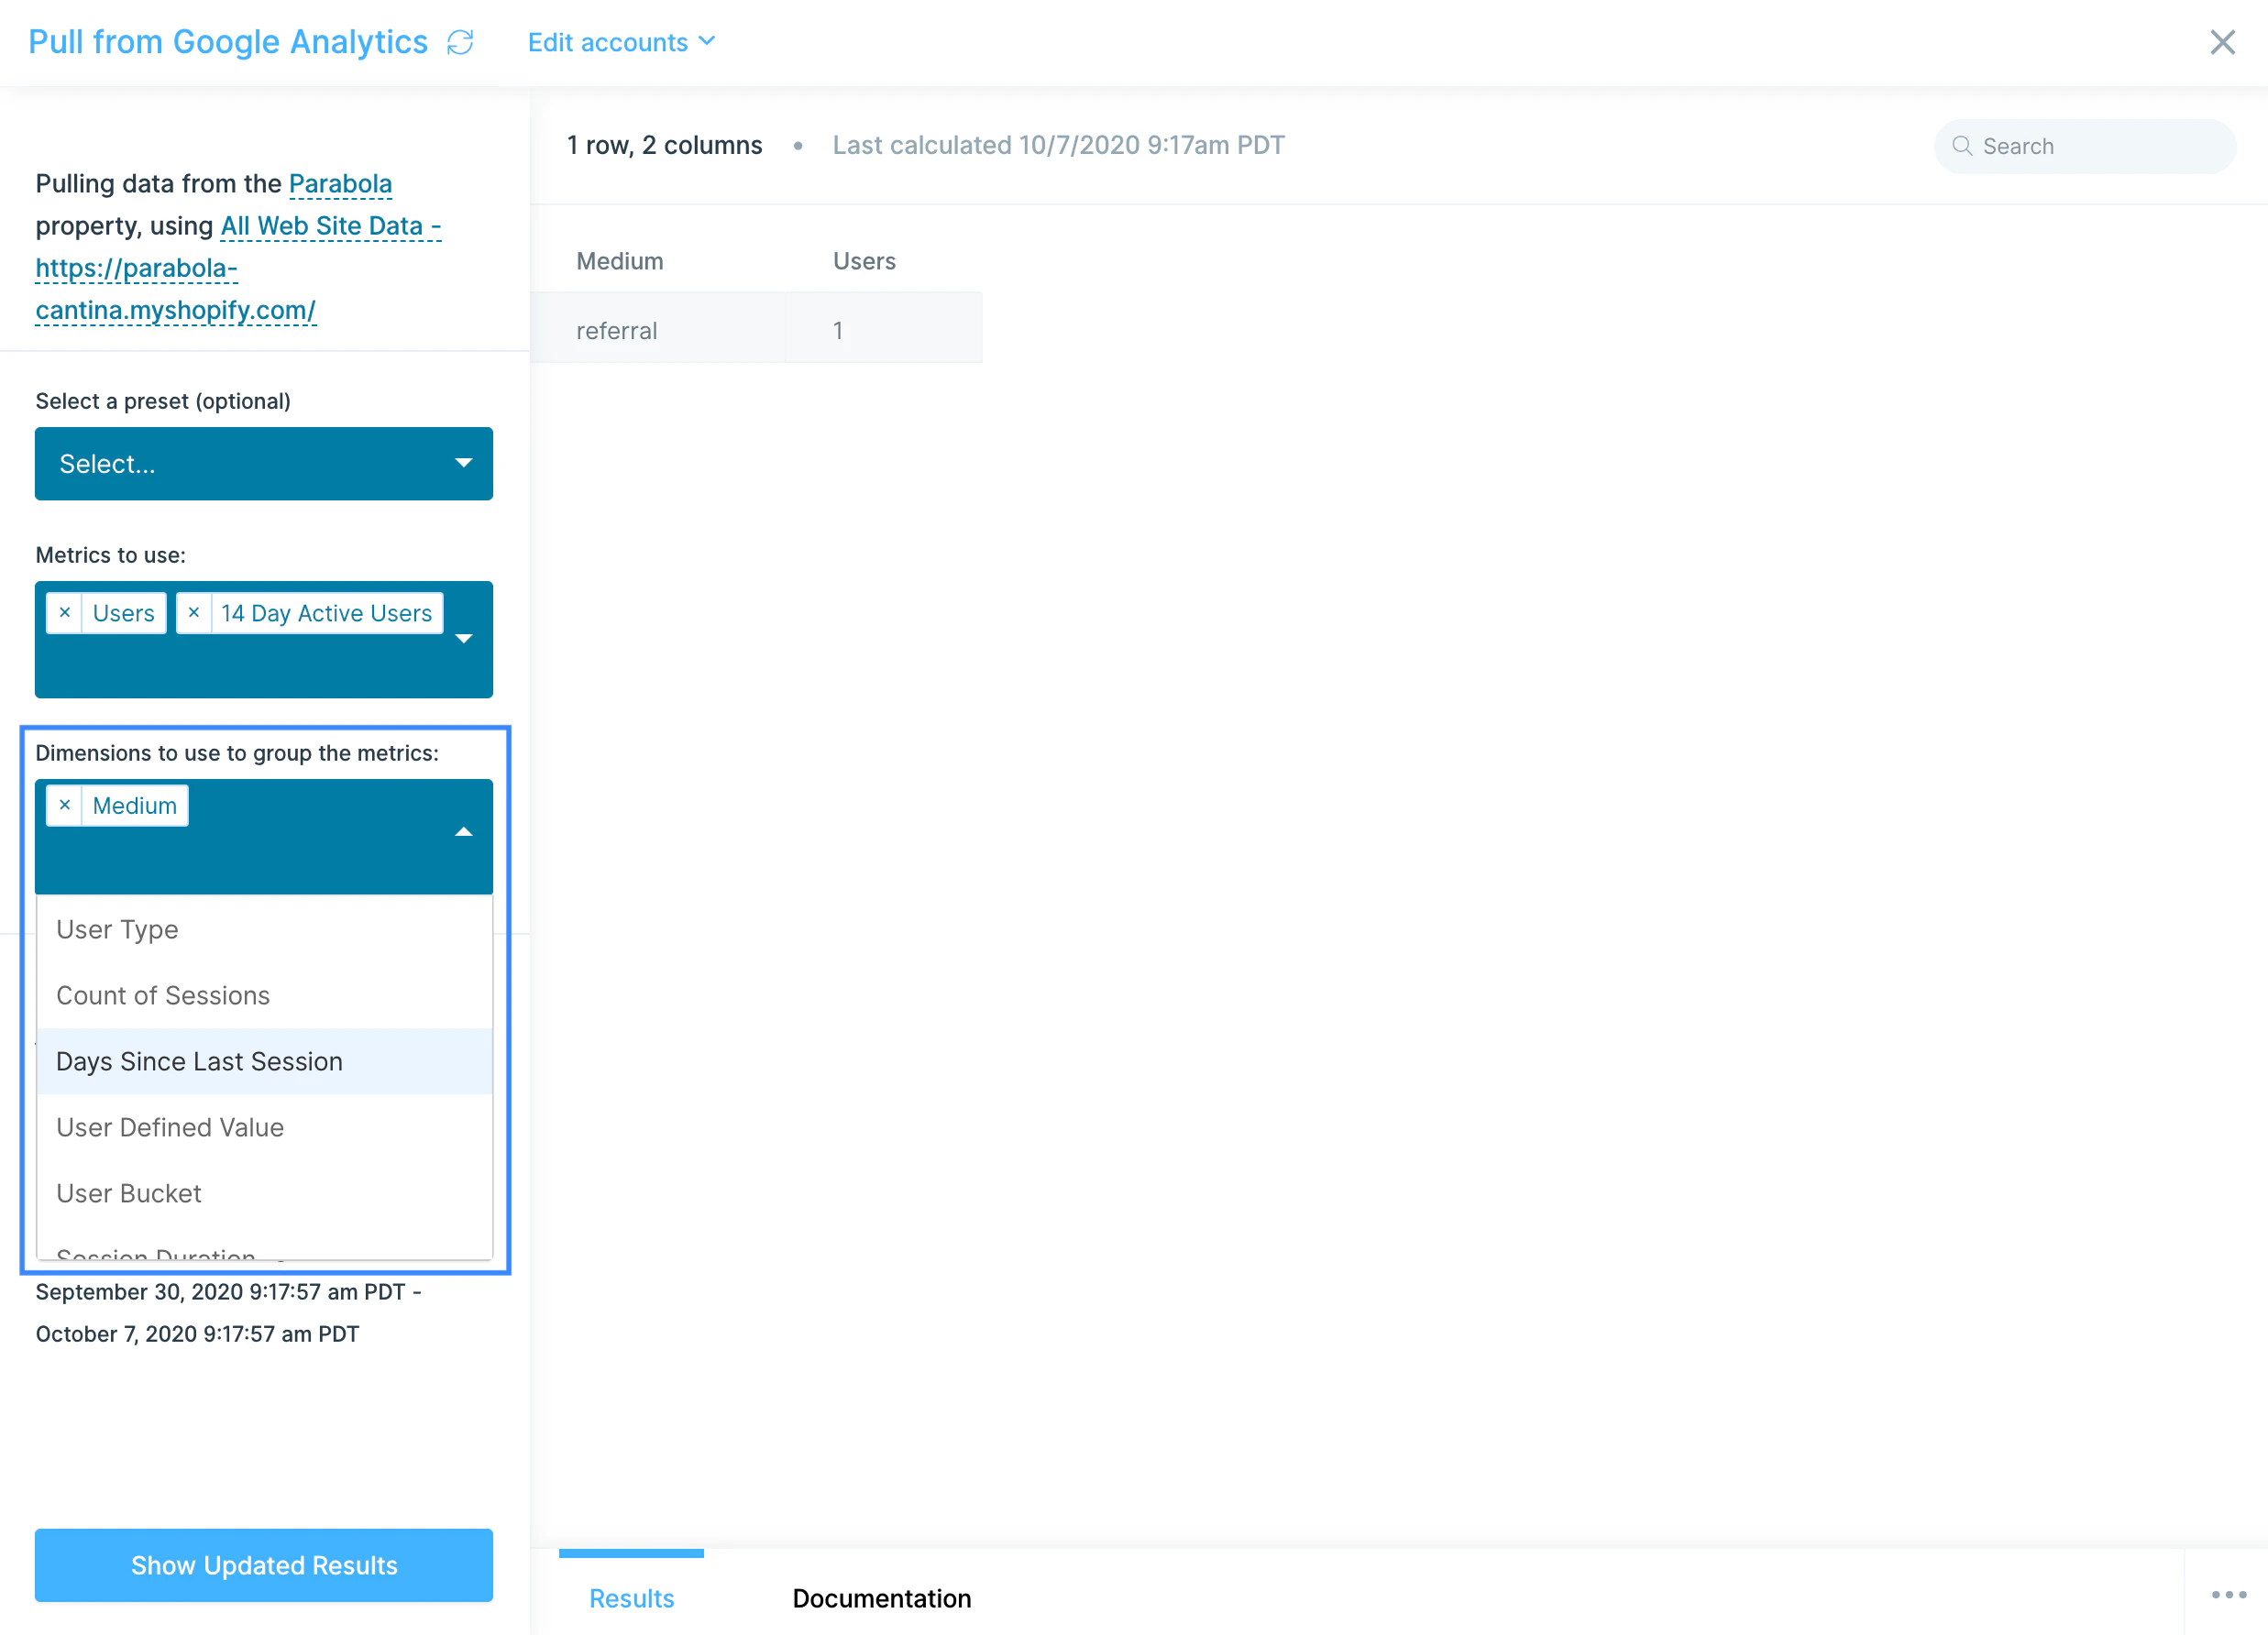
You will find the Metrics to use field shows the same metrics you’d see in Google Analytics. Every metric that you add will result in a column being added to your report. You can select as many metrics as necessary for your report, including New Users, Bounces, Sessions, and more.
You can use various Dimensions to use to group the metrics, including Medium, Source, Campaign, Social Media, and more. Each dimension also adds a column, usually to the front, and it also will change how many rows you see in your data. Leaving this field blank will result in a single row of data, which is not grouped by anything.
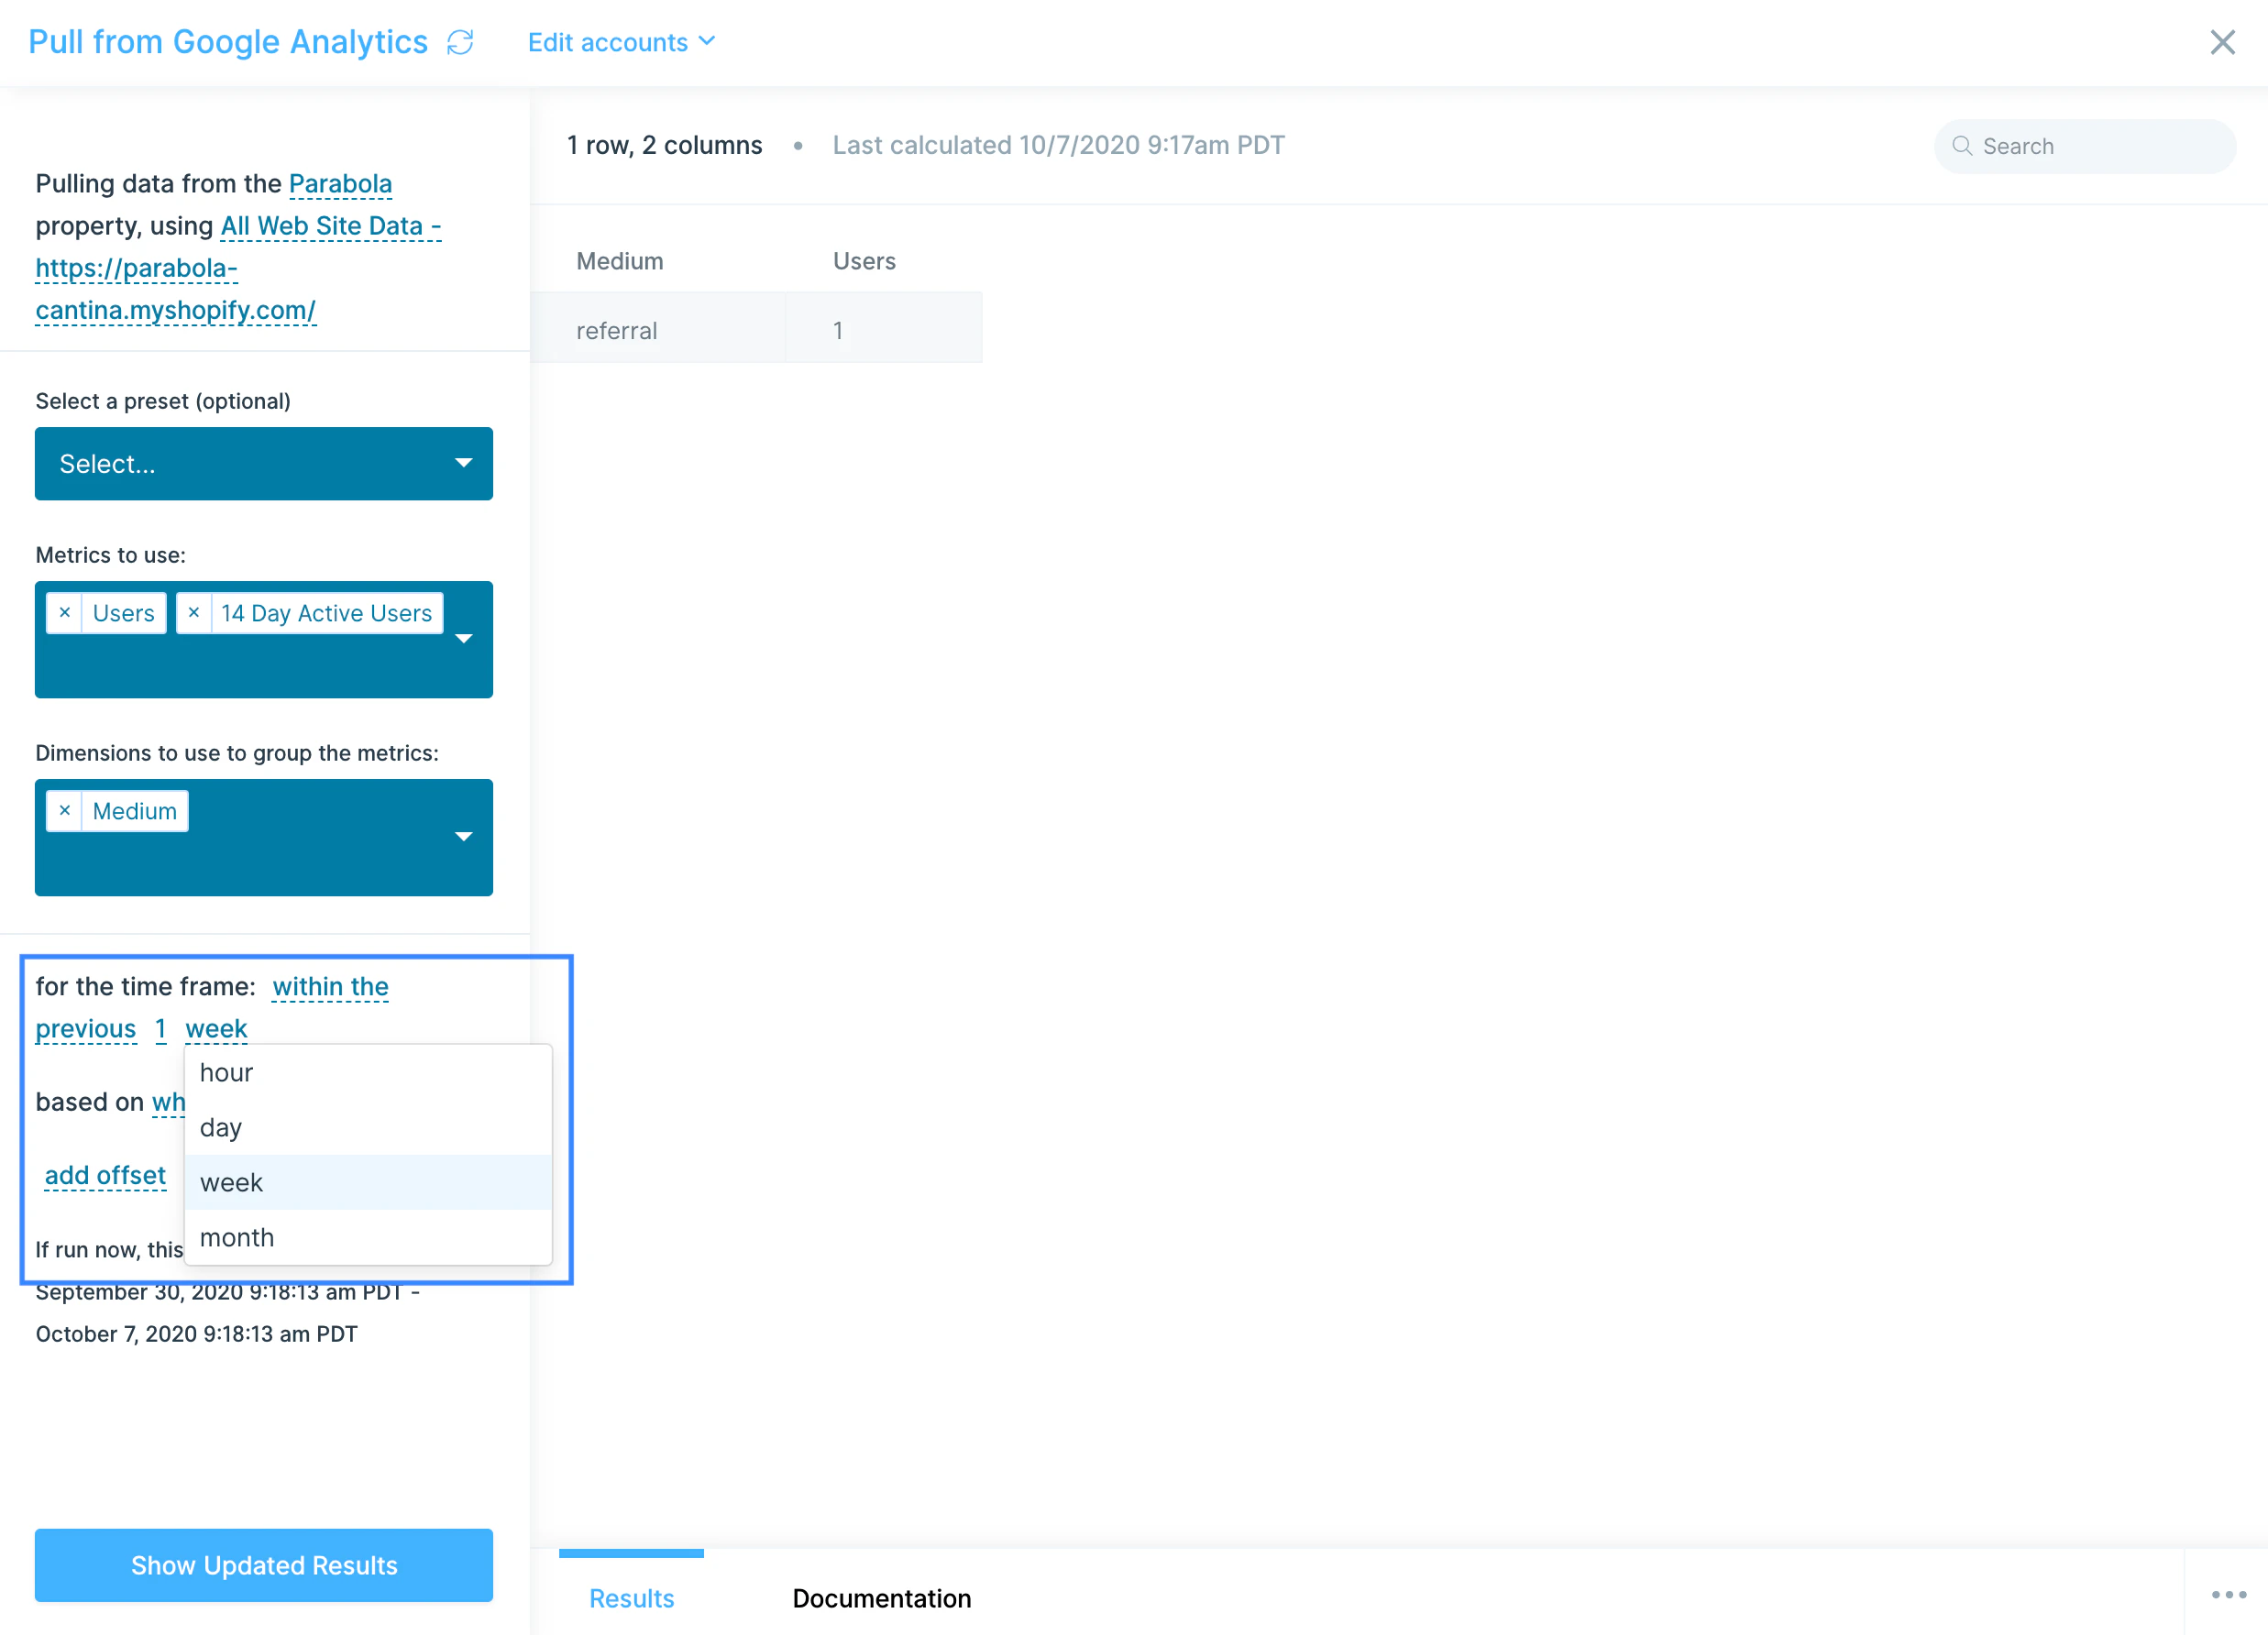
The time frame can be updated to let you pull data from:
-
Between two dates
-
Between a date and today
-
The previous X days/weeks/months/etc.
-
The current X day/week/month/year to date.
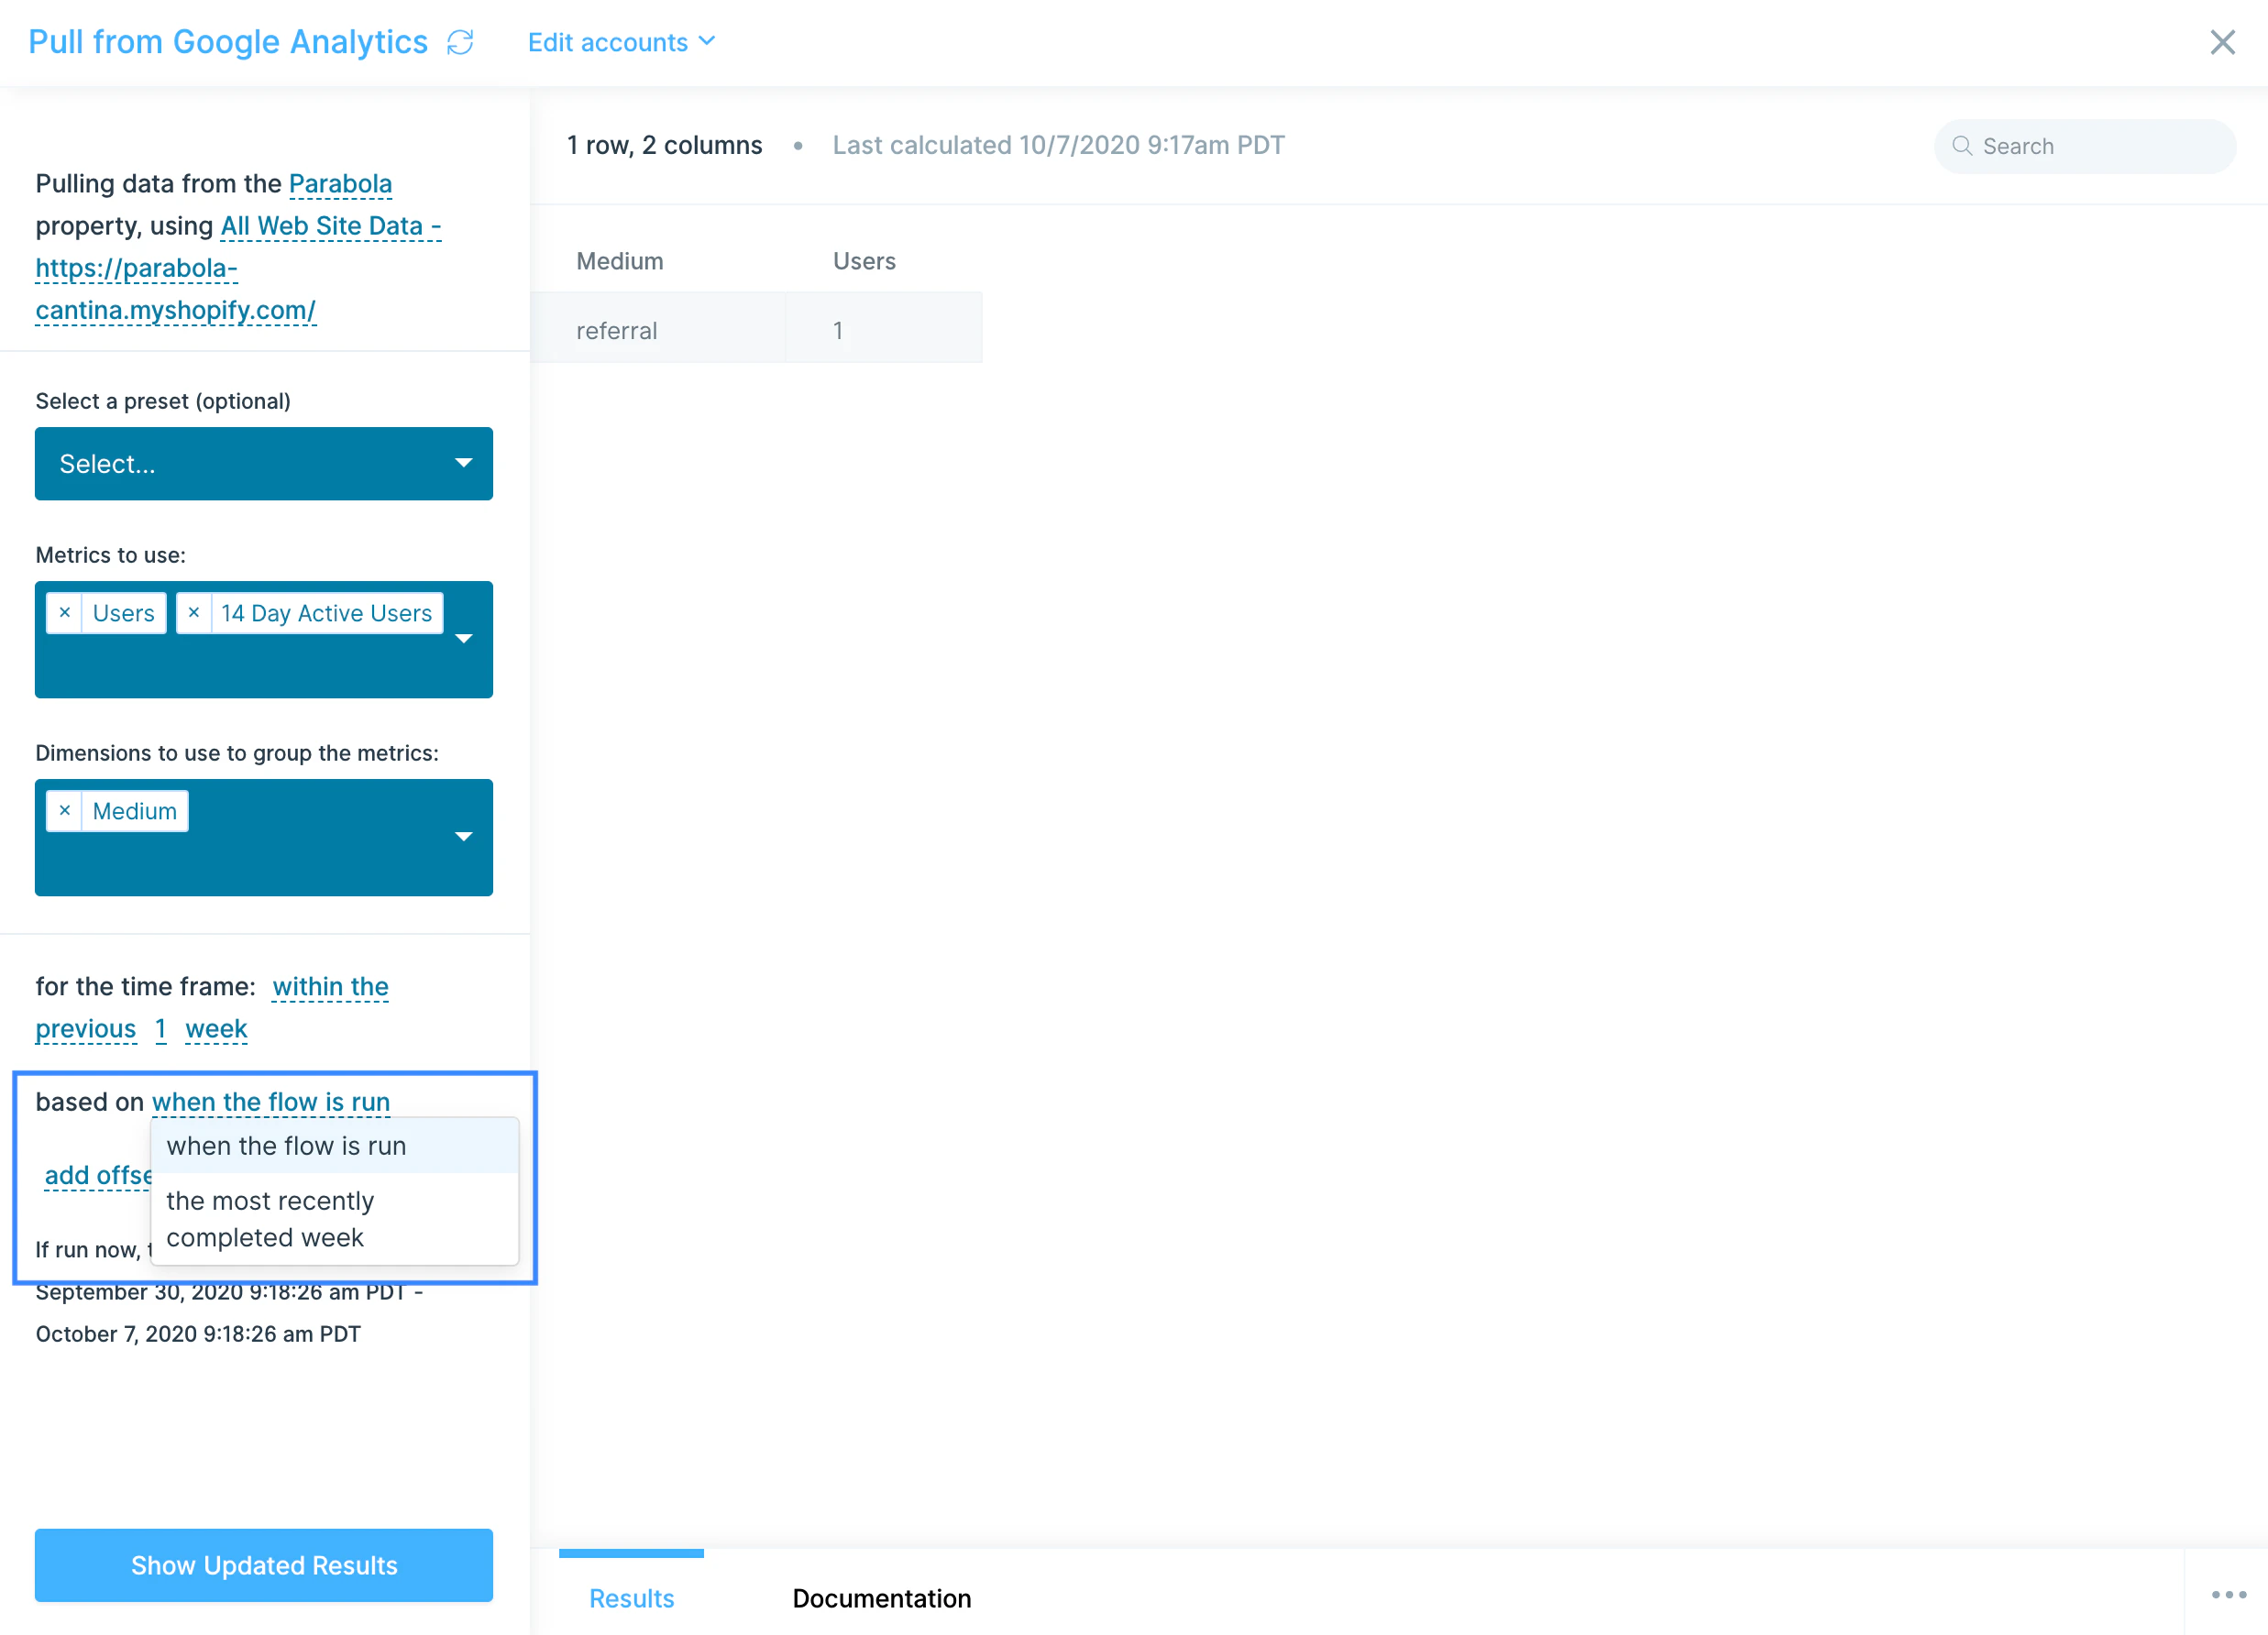
You can also adjust for when you’d like the timeframe calculation to run, giving you the ability to pick between when the flow is run or the most recently completed month/week/day/hour. The latter option is great for running a report for the last month, on the 1st of the following month, while excluding any data collected for far that day.
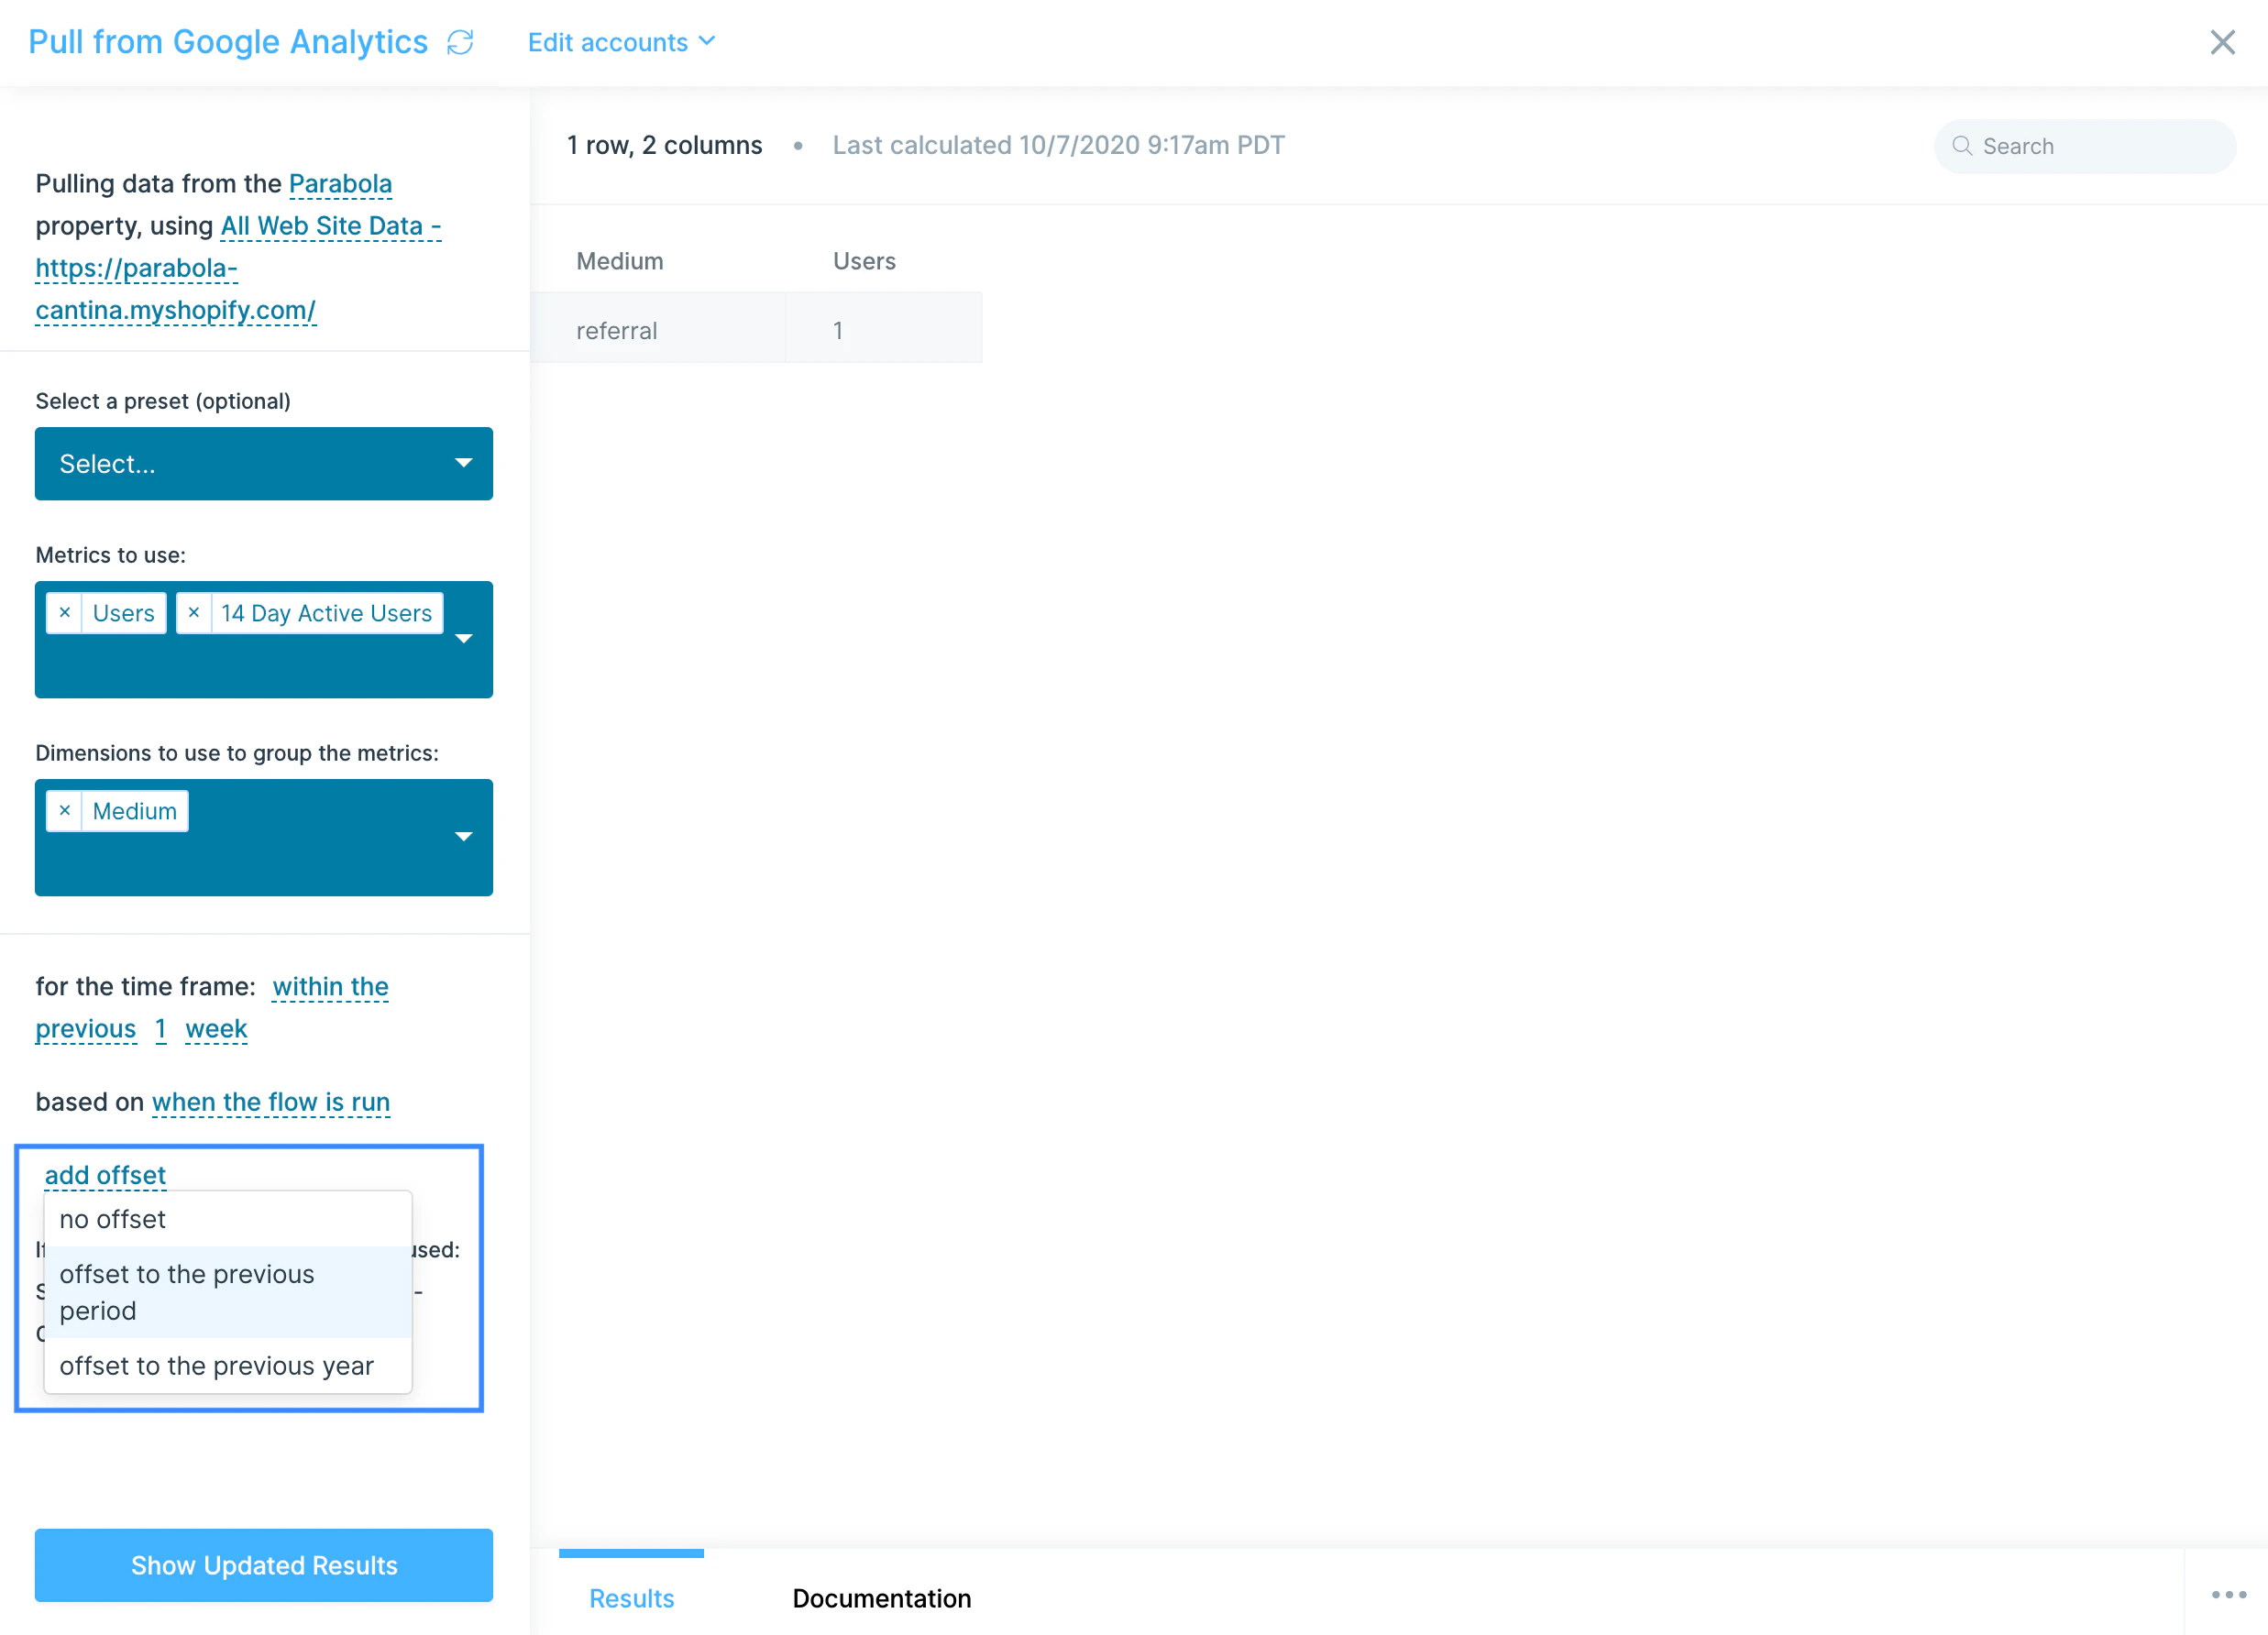
Lastly, if you choose, you can add offset for your date timeframe.
If you are looking to compare this data set to the same set, but from the previous period, a great way to do that is to pull in the two data sets, and the use the Combine tables step to combine them, using their dimensions in the matching rules.
Helpful tips
- This step is available starting at our Plus plan.
- Please note that Google Analytics Reporting API V4 (App + Web) is not yet supported in this step. Use the Pull from Google Analytics 4 step to pull in data from your GA V4 account.
Last modified on May 8, 2026