
1. Pull the forecast. From the FP&A model, the planning system, or the budget spreadsheet.
2. Pull the rate card. Storage rates by SKU class, location, or service tier.
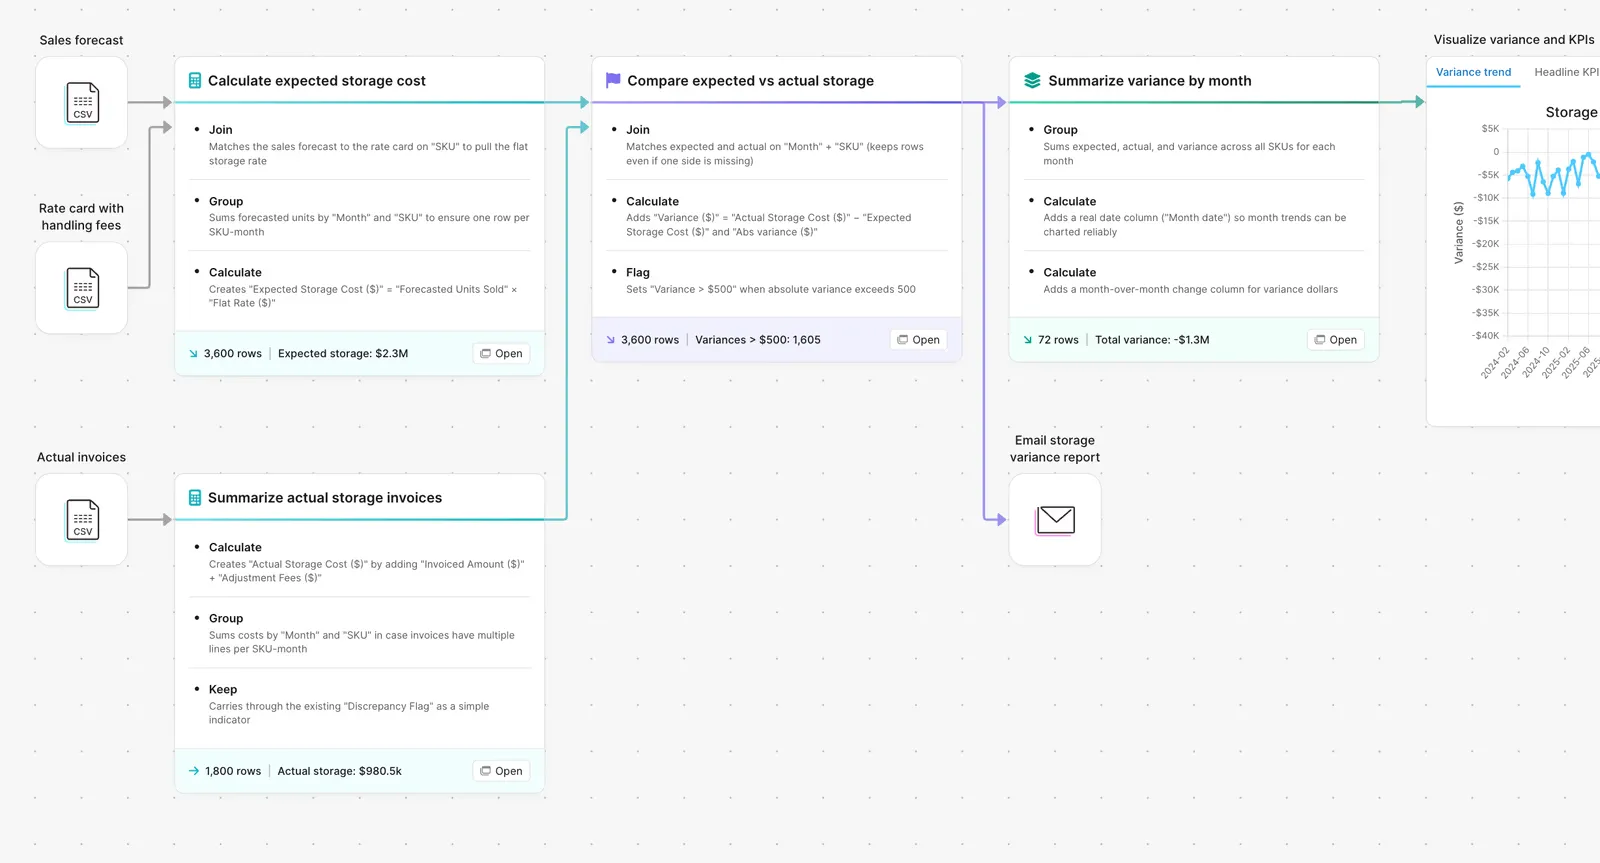
3. Calculate the expected cost. Apply the rate to the forecasted volume.
4. Pull the actuals. Invoiced costs from AP or the 3PL portal.
5. Compare line by line. Forecast vs actual, in dollars and percent, at the level of granularity finance cares about.
6. Flag the variances. Anything over your threshold (default $500) gets surfaced for explanation.