How I Built a Weekly Travel Newsletter in Parabola

Here at Parabola, we don’t think you should have to write code in order to build cool stuff with computers. This is the first article in a series called “Powered by Parabola,” where we’ll be taking a look at awesome Parabola apps people have built with absolutely no code.
Powered by Parabola: Travel Newsletter
When I joined Parabola in May I was eager to explore different use cases. Having just left Google’s hotel search team, travel was still top of mind.
I decided to build a weekly newsletter centered on an unusually cheap flight in the near future. In addition to the travel destination, I wanted my newsletter to have a few things: links for flight booking, hotel recommendations, things to do, restaurants, descriptions, and photos.
A good chunk of my time early on in this project was spent searching Google for high quality APIs that didn’t require too much paperwork to sign up.
Here is the set of services I ended up using:
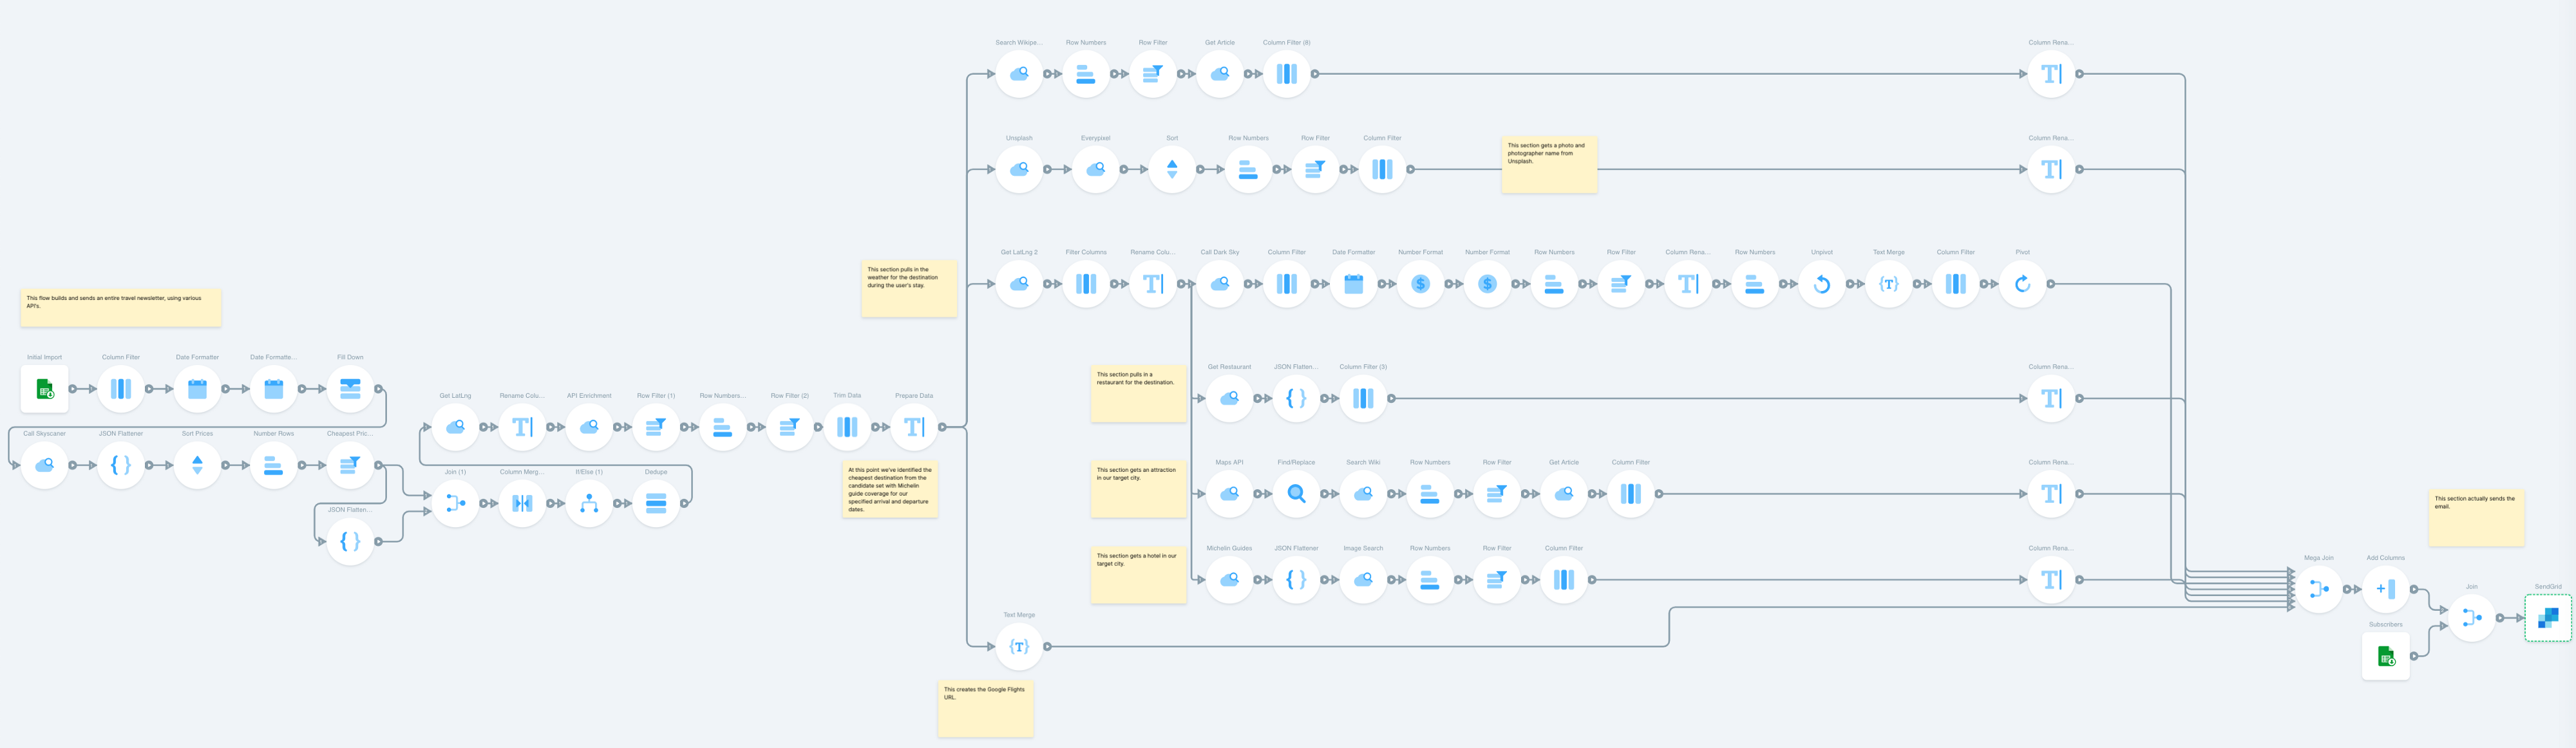
Using Parabola, I was able to blend data from all these sources into a useful, aesthetically pleasing newsletter.

As someone who can write code, but isn’t a software engineer, it was very gratifying to build this application in Parabola. I was able to focus on what was important for the project: the data sources, the content, etc., without having to fight with the kinds of technical roadblocks that would have normally waylaid me on a project like this.
You can find the final implementation here. Feel free to go check it out, and when you’re ready, you can read on for a detailed description of how I built it.
If you have feedback, questions, or want to see your program featured in this series, shoot me an email! I’m excited to see what you’ll build. 🤙
Deep Dive: Travel Newsletter
I started with a simple Google Spreadsheet that holds a few key pieces of information: the departure date (seven days from now), the return date (14 days from now), and a list of candidate countries for the program. Google Sheets keeps these dates updated automatically for me.
Calling Skyscanner
My first major task was to get flight prices from Skyscanner. I found an API that allowed me to search for flights between an origin airport (SFO in this case), and an entire country! I could input a query for flights from SFO to Japan and get back loads of prices for flights to all major airports in Japan.
To actually call the Skyscanner API, I used Parabola’s API Enrichment step.
The API Enrichment step enables connecting and getting data from just about any API by filling in a few form fields.
It makes a web request to the specified URL once for each row of input. It can also replace parts of the URL dynamically based on the input. In my case that part was essential: I needed to call Skyscanner a bunch of times for all the different SFO -> Country combinations.
If this sounds hard, it’s not! You’ll see below how easy it is to get this set up in Parabola.
The RapidApi endpoint I needed to access looks like this:
https://skyscanner-skyscanner-flight-search-v1.p.rapidapi.com/apiservices/browsequotes/v1.0/{country}/{currency}/{locale}/{originplace}/{destinationplace}/{outboundpartialdate}
You can see there are placeholders available to input a country, currency, location, origin, destination, and outbound/inbound dates. This is where the dynamic substitution comes in handy. I specified some of the values by hand (country, currency, locale, and originplace), and had Parabola fill in the rest dynamically.
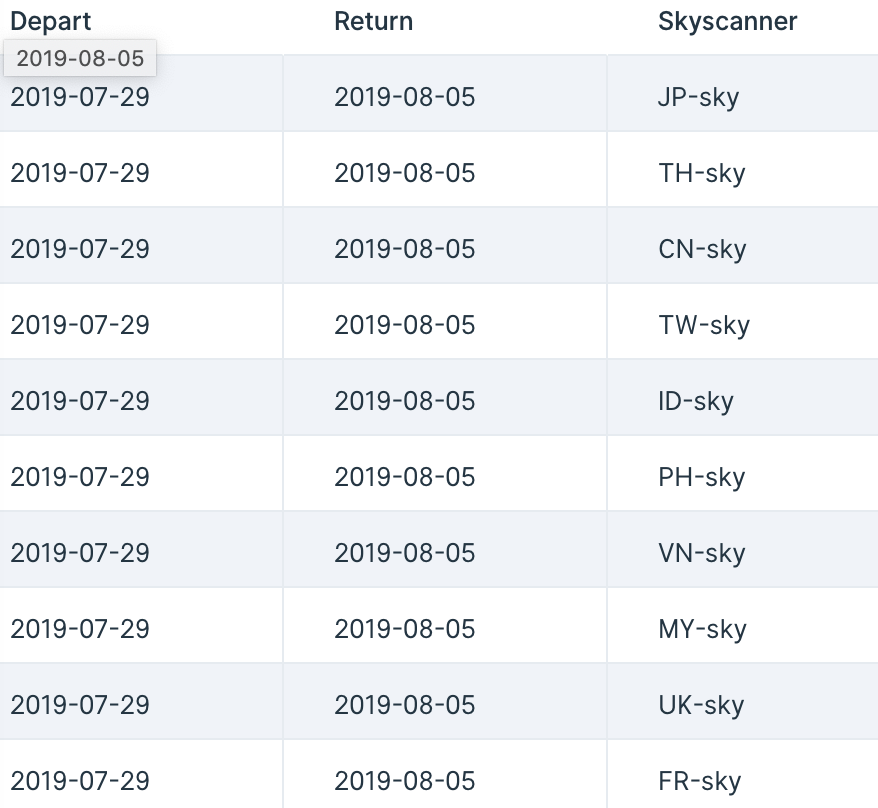
After processing the input values from my Google Sheet, I am able to pass them to my API Enrichment step in the format you see on the left.
I’ve got a list of destinations (formatted in the way Skyscanner likes) each with a depart/return date. Parabola will go through every line of this input and call the Skyscanner API.
As I mentioned above, the API Enrichment step also lets you use a special curly brace notation to swap out parts of the URL with values found in your input data. In my case this was super handy because I needed to call the Skyscanner API once for each of the potential travel destinations.
In Parabola, I configure the API Enrichment step so that the URL looks like this:
https://skyscanner-skyscanner-flight-search-v1.p.rapidapi.com/apiservices/browseroutes/v1.0/US/USD/en-US/SFO-sky/{Skyscanner}/{Depart}?inboundpartialdate={Return}
Parabola will replace {Skyscanner} with the value found in the column of that name — the destination. It replaces {Depart} and {Return} with the matching values from those columns.
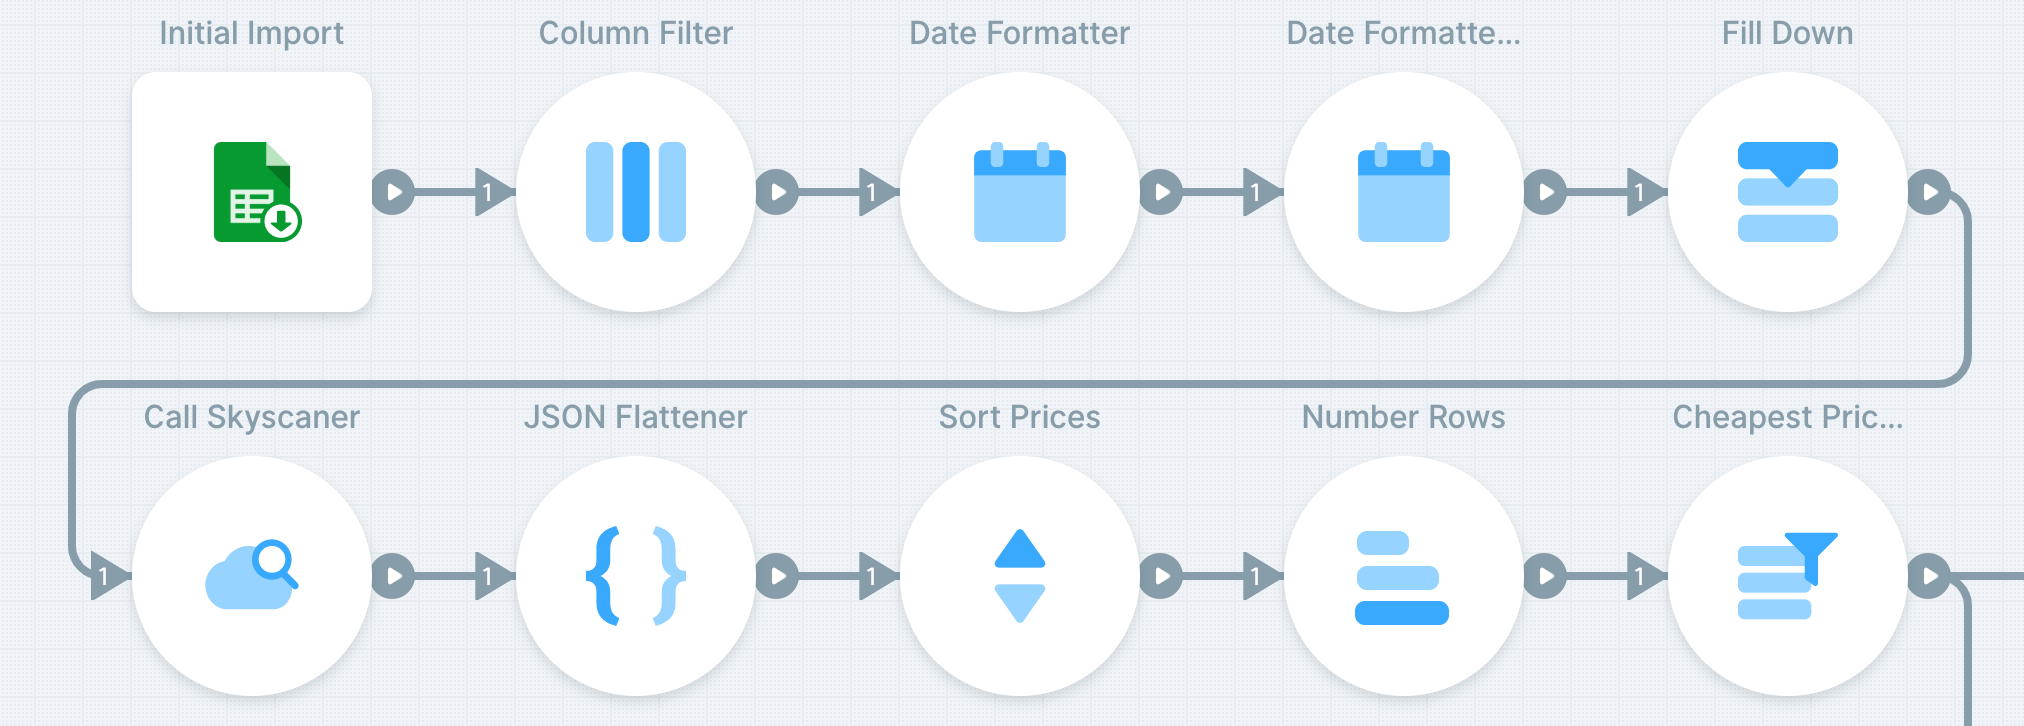
After a few seconds my program gets the response back from Skyscanner: a huge list of possible flights from SFO to destinations all around the world. Now I need to sort the results that came back from Skyscanner to find the cheapest prices.
Once I identified the destination, it was time to build a whole newsletter around it!
Calling Wikipedia
I use Wikipedia data twice in this program: it’s the source of both the city and the attraction descriptions. The steps are the same in both cases, though, so I’ll just explain it once here.
The best way I found to do it is:
In Parabola, that procedure looks like this:

First I searched for articles matching the cheap destination I had selected using API Enrichment. In Parabola, that ends up looking like this:
https://en.wikipedia.org/w/api.php?action=query&list=search&srsearch={Destination}&utf8=true&srlimit=1&format=json
Wikipedia returns the first article, then I make one more API Enrichment call to get a nice article summary:
https://en.wikipedia.org/api/rest_v1/page/summary/{api.title}
Easy, right?
Hotels & Restaurants
Originally the newsletter only pulled in restaurant data from Yelp, but when adding in hotels I needed to find another data source.
Most big travel companies do have APIs, unfortunately there was lots of paperwork involved to start using them. Turns out the Michelin Guide offers a fairly rich API, and actually has better international restaurant coverage than Yelp, so I ended up using it for both hotels and restaurants!
The procedure for fetching hotels and restaurants is similar; I’ll only be writing up the hotels section because it’s a bit more involved.
For this newsletter, I decided to request the most expensive five star hotel in the destination. Since the flights are so cheap, you can afford to splurge on the hotel, right?
I use the API Enrichment step again to fetch the top result from Michelin — that’s easy — but Michelin doesn’t include any images for their hotels (they do for restaurants).

For hotels, I needed to get images from elsewhere. I decided to fetch the images from Google Image Search using a Custom Search Engine. You can create a new CSE by following this link. Note that you’ll want to enable two key options for this to work as expected: [1] switch Image Search on, and [2] switch on Search the Entire Web.
Once you’ve set up your CSE, calling it in Parabola is straightforward. In my case, I just took the first image that came back and moved along.
https://www.googleapis.com/customsearch/v1?key=YOUR_KEY_HERE&q={api.datasheets.name}%20{CityName}%20rooms&searchType=image
Points of Interest
I decided to fetch points of interest from the Google Places API.
Specifically, I chose to call the Find Place API as I only really needed one, and based on some manual testing was reasonably happy with Google’s default ranking.
https://maps.googleapis.com/maps/api/place/findplacefromtext/json?key=XX&input=points%20of%20interest&inputtype=textquery&locationbias=circle:5000@{lat},{lng}&fields=name&language=en
The snippet above shows how I called the Google Places API from Parabola’s API enrichment step. I passed in a few things:
Once I get the attraction back from Google, I fetch its description from Wikipedia using the same procedure from before.
Destination Photos
What good is a travel inspiration email without beautiful imagery to accompany it?
I decided to use Unsplash as the source of my newsletter’s hero photo because (1) Unsplash photos are free and open source, and (2) they are often very beautiful.
By now you’re probably familiar with this part: we need to use API Enrichment to fetch Unsplash photos for the newsletter destination. Parabola will replace {Destination} with whatever [city, country] pair is featured in this week’s newsletter.
https://api.unsplash.com/search/photos?page=1&query={Destination}&client_id=X
Unsplash returns a bunch of metadata along with each image, but I had trouble identifying a heuristic among those attributes that reliably revealed the “best” image; I tried sorting by number of photo likes, number of user likes, etc.
Then I stumbled across a cool API for ranking stock photos. For a small fee, this API lets you pass in a set of images and have a machine learning model score each one on its aesthetic merit.
https://api.everypixel.com/v1/quality?url={api.urls.raw}
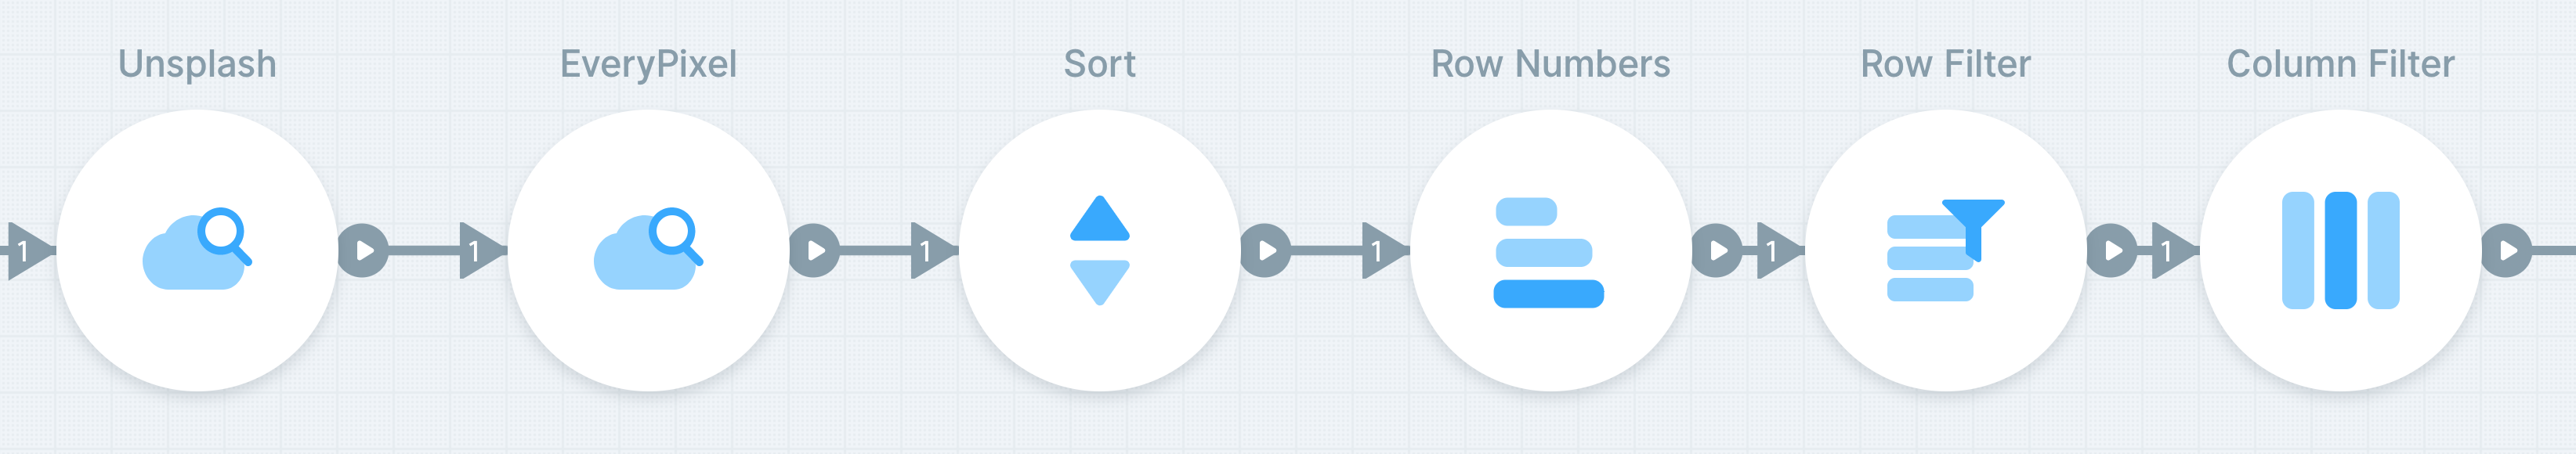
Once my program gets the scores back, it sorts them by score and filters down to the top result.
Weather
I also wanted to help readers get a sense for what the weather would be like in the newsletter destination. Since the trip doesn’t start for seven days after the email sends, though, the extended forecast probably won’t be very accurate. Instead, I chose to display the forecast for the next week. Although not the same dates a reader would be traveling, I thought this should give folks a sense of the weather in the region.
I fetched the weather forecast from DarkSky’s forecast endpoint. Again, I use API Enrichment to make the call, and use curly brace substitution to pass in the latitude and longitude of the intended destination. In the snippet below, you’d replace ‘XX’ with your API key.
https://api.darksky.net/forecast/XX/{lat},{lng}
Things got a little bit tricky here, though. As you’ve seen Parabola, can replace items inside curly braces with values from the corresponding column. In the email template I had created, I wanted to share four days worth of weather. So I had created a bunch of placeholders that look like: {High1}, {Date1}, {Summary1} and so on.
DarkSky was giving me back several rows of data, and I needed four columns of data.
To make this happen, I trimmed the results down to four rows and numbered them using the row numbers step. Then I used the unpivot step to duplicate what would eventually be my column names so that I had one cluster per original row of weather data.
Type | Value
----- -------
Date | Mon 24th Jun
Summary | Possible drizzle overnight.
High | 93
Low | 79... and so on
What would eventually become the curly brace names in my email were currently in the type column. Next, I merged that column with the row numbers I had created earlier so I end up with {Date1}, {High2}, etc. Finally, I pivot the data so the column names I created would actually be the columns in my data.
Date1 | Summary1 | High1 | Low1 | Date2
Mon 24th Jun | Possible drizzle overnight | 93 | 79 | Tue 25...

At this point I finally had the data I needed neatly bucketed in all the places it was supposed to go. I was ready to send my email!
Composing and Sending the Email
I decided to use a SendGrid campaign template as the starting point for my email, but you can use whatever email HTML editor you feel most comfortable with.
Here’s an approximation of what it looks like in the SendGrid builder. Parabola will take all the curly brace stuff and replace it with the corresponding values that I created in my data above.
{DestinationDescription}
{Date1} {Date2}
{High1} // {Low1} {High2} // {Low2}
{Summary1} {Summary2}
Those curly-brace substitutions are pretty powerful:
Bangkok is the capital and most populous city of Thailand. It is known in Thai as Krung Thep Maha Nakhon or simply Krung Thep. The city occupies 1,568.7 square kilometres (605.7 sq mi) in the Chao Phraya River delta in central Thailand, and has a population of over eight million, or 12.6 percent of the country's population.... Mon 24th Jun Tue 25th Jun
91 // 79 92 // 92
Possible drizzle... Possible light...
They work with any text, links, whatever. So after we download the HTML from SendGrid’s editor we update all the links to the appropriate curly-brace values, e.g., {DestinationImage}, {RestaurantImage}, etc. This lets Parabola substitute the image URLs with the images we fetched throughout this program.
<img src="{DestinationImage}">
Now it’s time to send the email! I did one big join to bring together all the difference pieces that had been built up to that point: things to do, restaurants, hotels, photos, descriptions, and flight booking info. Then I passed the output off to SendGrid for delivery.

Conclusion
I hope this write up was clear, fun and informative! Again, you can check out the complete program, play around with it, or use it as a starting point for your own work by heading to our examples page.
Some of the API documentation I linked to in this article can seem a bit overwhelming, but its actually not as complicated as it looks. Parabola does most of the heavy lifting, and if you get stuck there are a couple of resources we’ve put together to help you. Of course, you can also always reach out to us directly via email or the Intercom chat widget on our site.
If you enjoyed this, keep an eye out for part two in the series. I’ll be exploring a Parabola program I built that generates a weekly playlist full of songs from musicians performing in your local area.
