Parabola's Xeneta API enables businesses to automate their ocean freight rate benchmarking and analytics processes. This connection allows companies to streamline their rate analysis workflows and maintain comprehensive visibility across global shipping rates.
How do I connect via API?
- Connect your Xeneta account to Parabola by navigating to the integrations page and selecting Xeneta from the available options
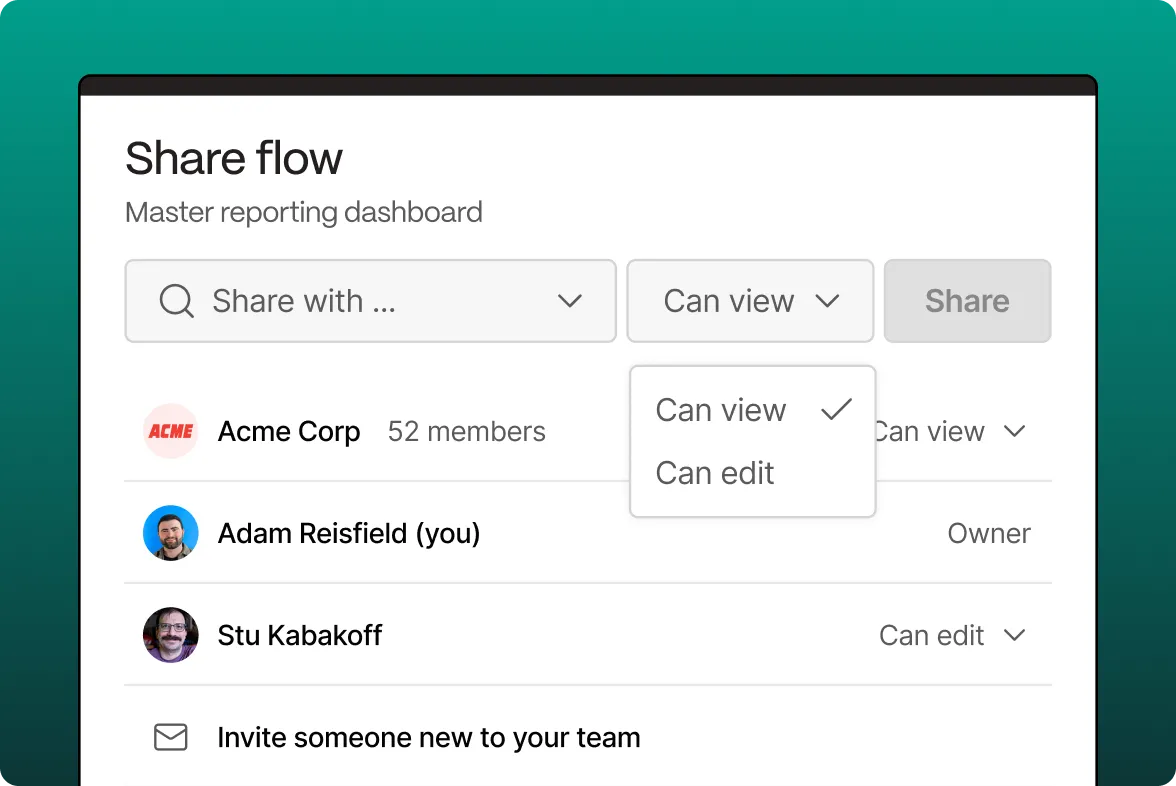
- Authenticate your account using your Xeneta credentials and grant necessary permissions
- Select the data you want to pull from Xeneta (rate data, market analytics, etc.)
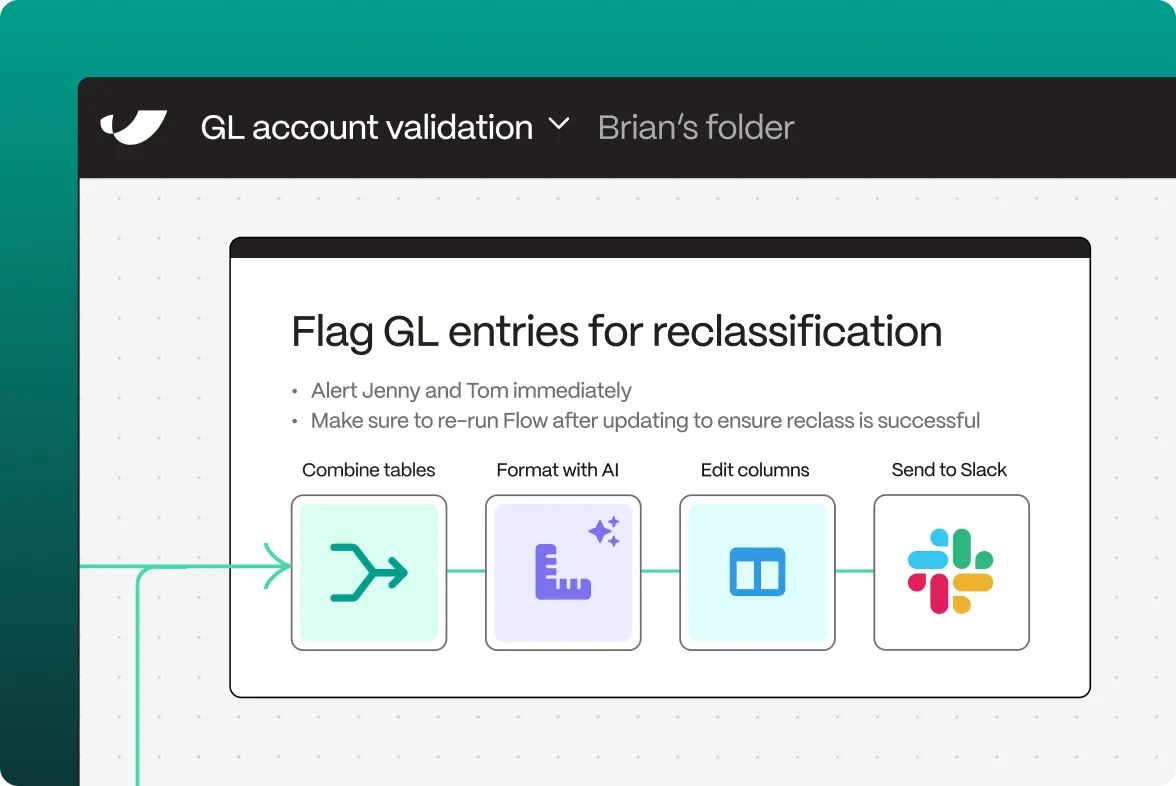
- Configure your flow in Parabola by adding transformation steps to process your shipping data
- Set up automated triggers to run your flow on a schedule or when new data is available
What is Xeneta?
Xeneta is a leading ocean and air freight rate benchmarking and market analytics platform. They provide real-time freight rate data and market intelligence for the container shipping industry.
What does Xeneta do?
Xeneta provides ocean and air freight rate benchmarking, market analytics, and freight procurement optimization tools. They aggregate shipping rate data from global shippers and freight forwarders to provide market intelligence and pricing transparency.
What can I do with the API connection?
Rate Benchmarking Automation
Create automated workflows to analyze shipping rates against market benchmarks.
Market Intelligence Reporting
Generate automated reports tracking market trends and rate movements across trade lanes.
Procurement Optimization
Automate the analysis of freight rates to optimize procurement decisions.