The best dashboards are live, connected, & easy to update.
But most reports are stale, incomplete, and take weeks for IT to fix. Retire manual reporting across siloed sources with live dashboards anyone can build.


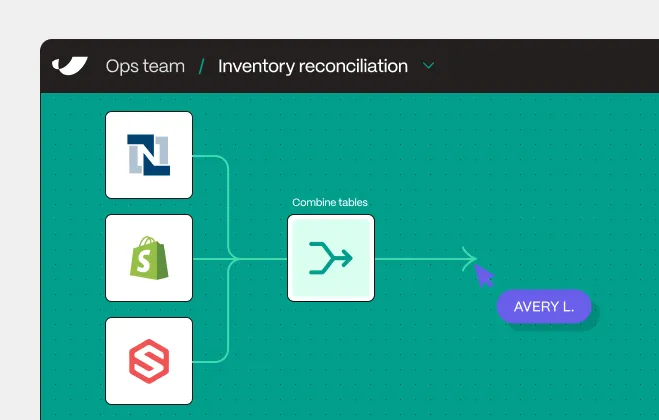
It usually takes more than one database or sales channel to tell the full story. Parabola sits on top of every system in your stack, serving as a universal reporting layer.
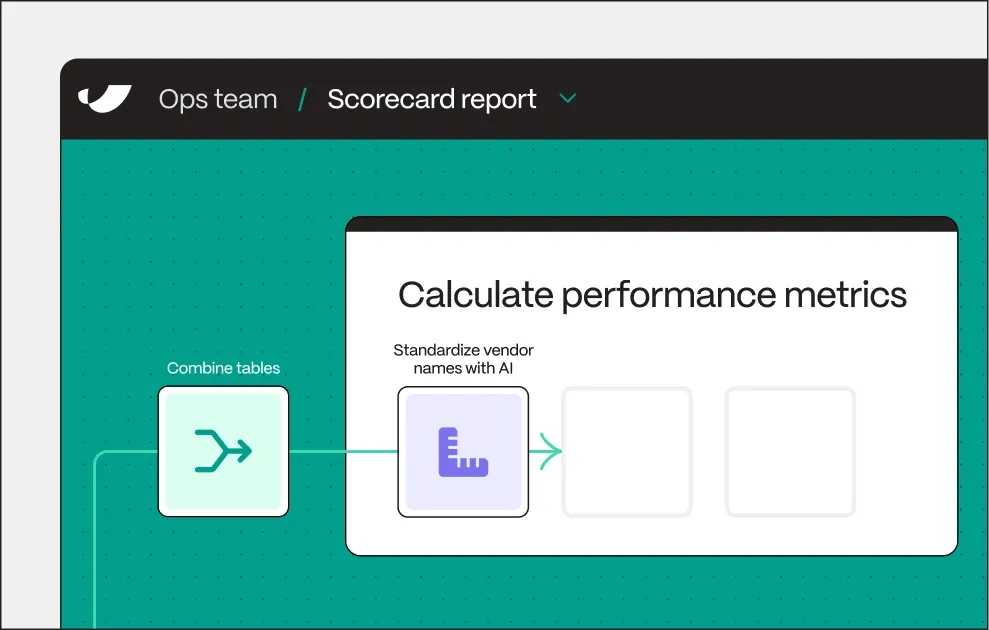
While most reporting tools rely on data being totally clean, Parabola knows that's rarely true. Automate all the data cleanup that slows down and complicates reporting with workflows that are easy to audit and understand.
Stop asking questions about how data was pulled. With Parabola, your dashboards are connected to the underlying logic so anyone can see how data was pulled and transformed.


The fastest path to reliable reporting. No code required.
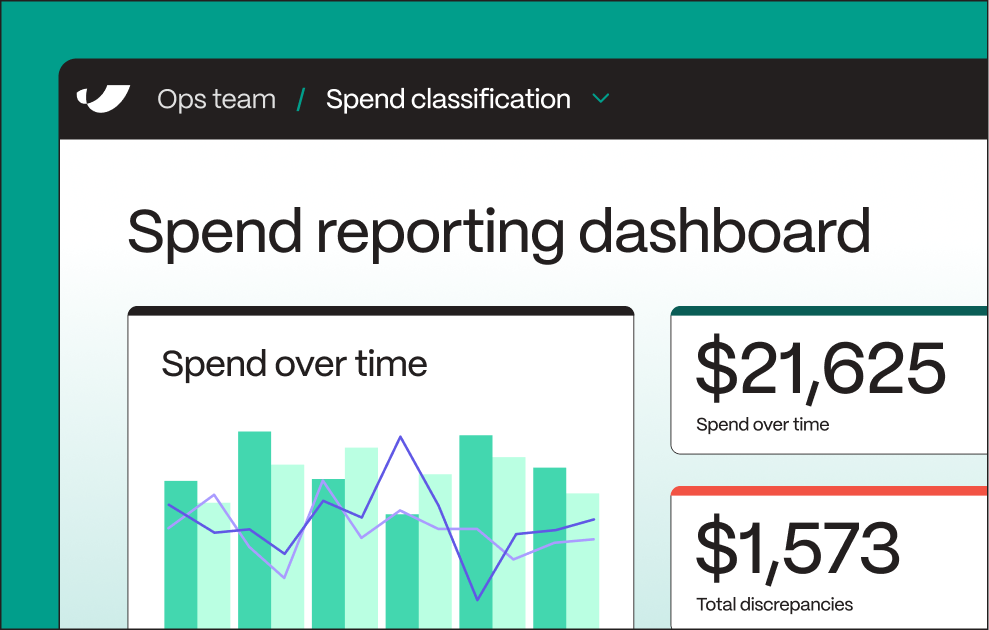
Create interactive dashboards that update in real-time, even if you're working with millions of records. Filter your views, control access, and make updates in seconds.
Connect channels like Shopify, Amazon, and SPS Commerce to get holistic, real-time visibility into omnichannel performance and SKU-level sales.
Aggregate cost, shipment, and performance data across carriers. Compare your carriers across metrics like on-time rate, cost per pound, and billing accuracy.
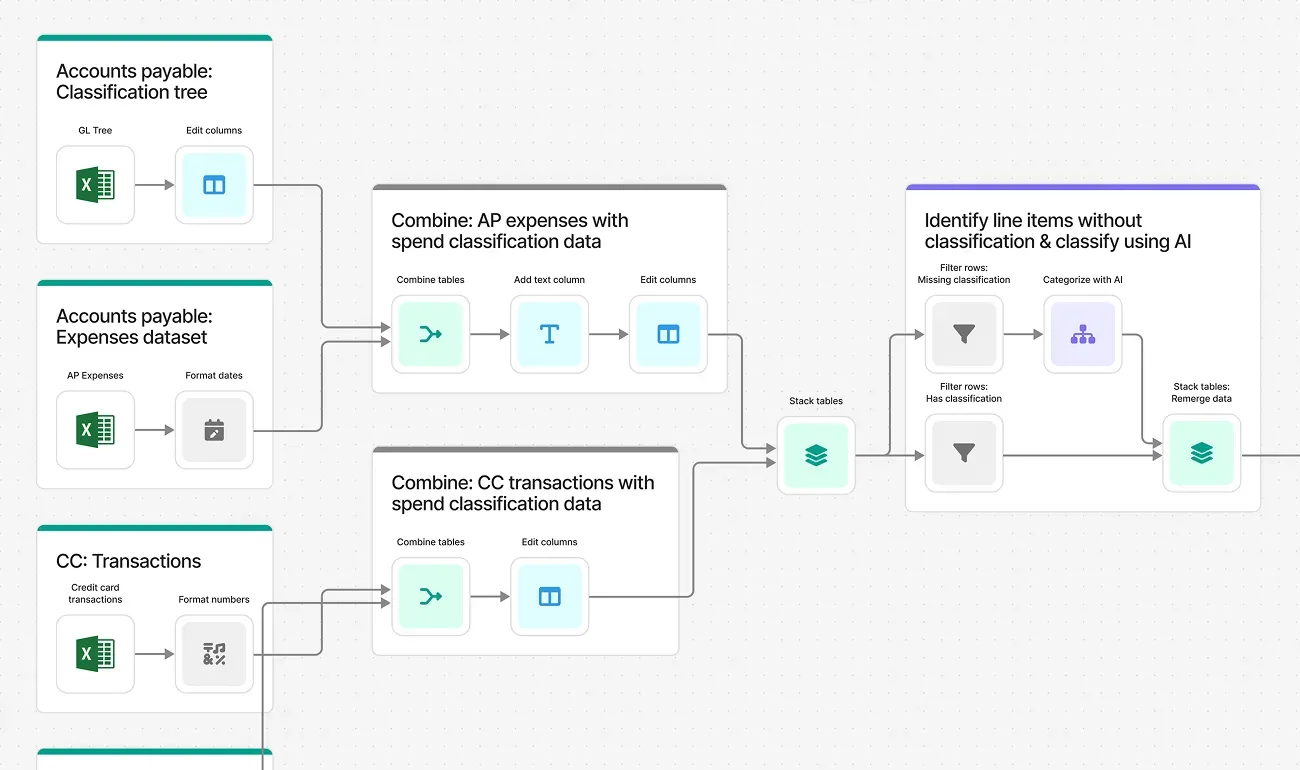
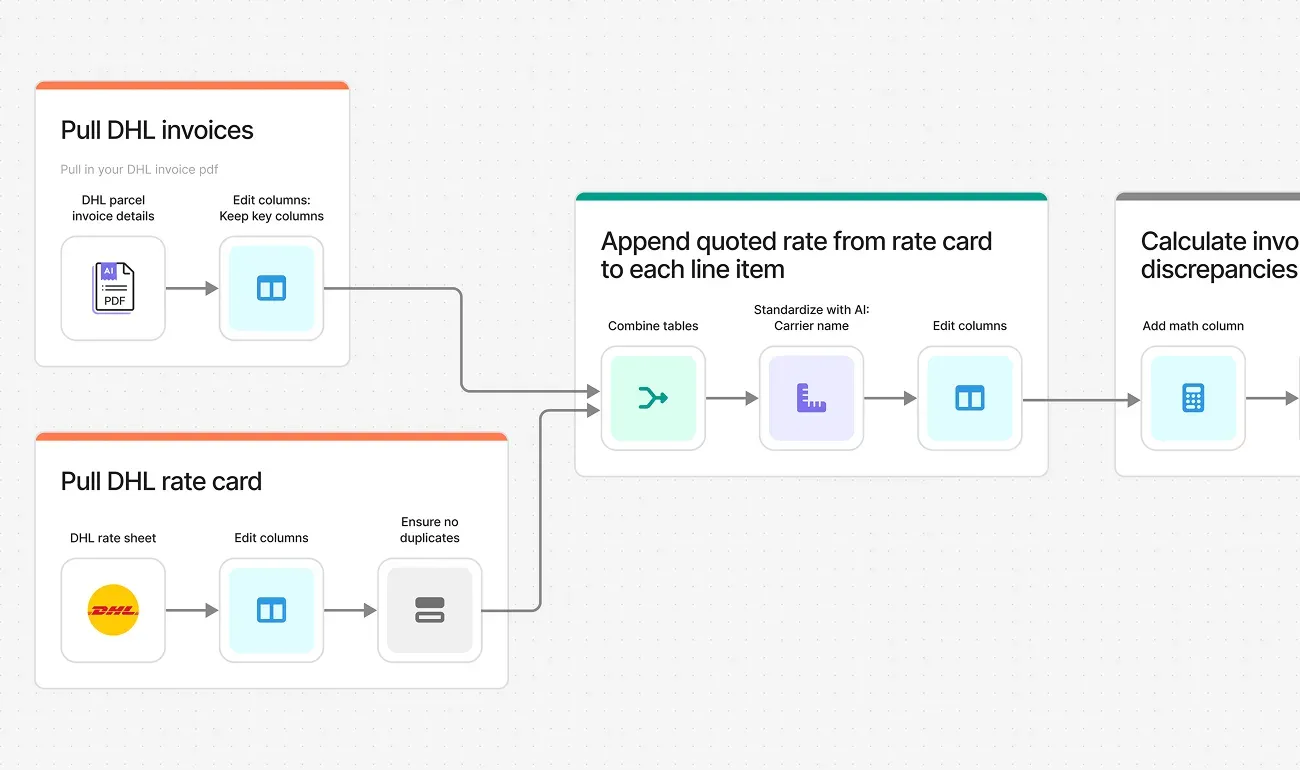
Track spend granularly, no matter the source. Pull line items from PDFs and categorize into spend buckets with AI, or aggregate COGS data across your stack.
Track on-time, in-full rates across wholesale channels. Measure performance by retailer, DC, or SKU to spot trends and resolve issues fast.

Earn back hundreds of hours.
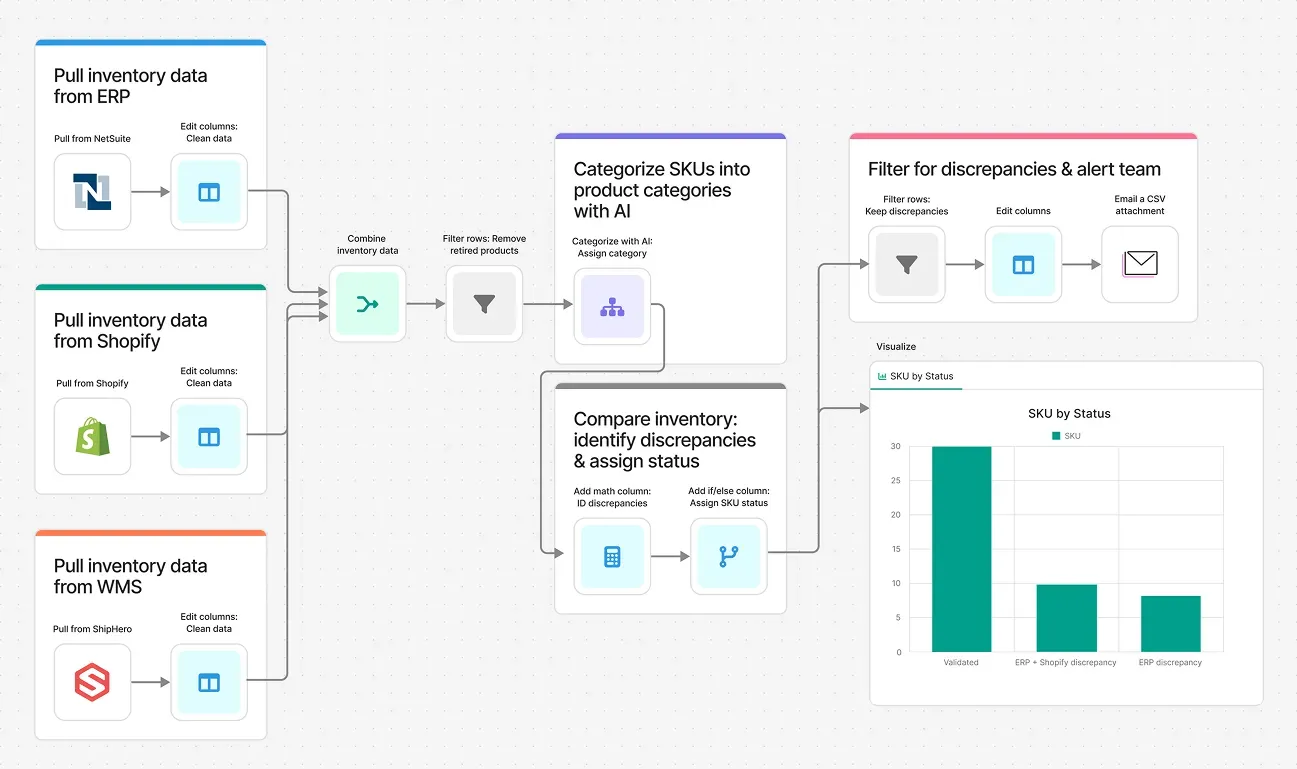
Manual processes eat up entire afternoons. Exporting files, cleaning data, reconciling counts, updating systems—and then doing it all again tomorrow. Parabola turns that into a single automated workflow you can build in minutes.


Prove ROI before you're invoiced.
Too many teams commit to software they never end up using. That's why we offer a 30-day proof of concept. Build something real with our team and only become a customer if there's value.
Connect any system, automate every workflow.

Customer stories
Real results from real teams
See how other ops and finance teams use Parabola.


Frequently asked questions
How does Parabola compare to advanced visualization tools like Tableau?
Most tools like Tableau help you visualize data—but not prepare it. Tableau users still rely on Excel to do the hard work of cleaning and shaping data before it ever reaches a dashboard. Parabola speeds up that entire process by letting spreadsheet users automate data consolidation and cleanup. No need to wait for IT to maintain pipelines or troubleshoot mismatched data—teams can own the full process themselves and even build dashboards and visualizations that match what they have in Tableau.
That said, Parabola does not offer some of the more advanced visualization capabilities offered by tools like Tableau—but most teams don't actually need something that complex and heavy. If all you need is real-time reporting and a variety of visualization and dashboarding options, Parabola's likely a good bet.
What does Parabola integrate with?
Parabola integrates with virtually any system. In addition to 50+ native integrations like NetSuite and Shopify, Parabola offers an API and the ability to integrate via email—making it easy to connect to WMS systems, carrier APIs, and more. You can also connect to thousands of tools and work with unstructured data like emails and PDFs.
What are common Parabola use cases?
The best Parabola use cases are recurring processes that involve complex logic and messy data coming from multiple data sources. For operations teams, this might look like an inventory reconciliation or order fulfillment audit. For finance, maybe a cash or subledger reconciliation. In short—if it happens in spreadsheets, emails, PDFs, and siloed systems, Parabola can likely help.
What teams most commonly use Parabola?
Parabola is most commonly deployed across operations, supply chain, finance, accounting, procurement, and data teams. Any team regularly working with data can see value from Parabola by working faster with improved visibility.
Can I try Parabola with sample data?
We offer two approaches to starting with sample data. After signing up for an account, you can ask Parabola, "Help me get started with sample data," and you'll be provided with a selection of 10+ sample datasets. Alternatively, use our secure anonymization tool to strip your data of sensitive information before uploading.
Who are some of Parabola's customers?
Finance and accounting teams across On Running, Cart.com, Brooklinen, Faherty, and Flexport use Parabola to automate the work they thought would always be manual. Explore more on our customer stories page.