List of Integrations
Integration:
AfterShip
How to connect your AfterShip account
AfterShip uses API Key authentication for secure access.
- Log in to your AfterShip account
- Navigate to Settings (located in the bottom-left corner of the dashboard)
- Click on API Keys in the settings menu
- Click Create API key and follow the instructions:
- Enter a descriptive name for your API key
- Select the appropriate API permissions for your use case (aftership:tracking:read for tracking)
- Click Save to generate your key
- Copy the API key immediately (it will only be displayed once) and store it securely
In Parabola:
- Add a Track with AfterShip step to your flow
- Click Authorize and paste your API key when prompted
- Once authenticated, select the AfterShip endpoint you want to access
💡 Tip: You can generate multiple API keys for different applications or team members. For security, consider rotating your API keys periodically and removing any unused keys.
What data can I pull using the AfterShip integration?
Right now, Parabola's supports AfterShip's Tracking API—allowing you to pull real-time tracking data about a shipment. Access data such as:
- Delivery status and tags: Shipment categorization by status (In Transit, Out for Delivery, Delivered, Exception, etc.) and custom tags for filtering and organization.
- Estimated delivery dates: AI-powered delivery date predictions based on carrier performance, route analysis, and historical data.
- Order information: Associated order numbers, customer details, shipping methods, and custom metadata linked to each tracking.
- Exception details: Delivery failure information, return-to-sender status, failed delivery attempts, and reason codes for exceptions.
- Trackings: Complete shipment tracking records including tracking numbers, carrier information, delivery status, origin and destination addresses, estimated delivery dates, transit times, and shipment tags.
- Checkpoints: Detailed scan history and location updates with timestamps, event descriptions, city/state/country information, and coordinates for each checkpoint along the delivery route.
- Courier information: Carrier details including courier names, slugs (identifiers), service types, required tracking fields, and courier-specific capabilities.
- Courier detection: Automatically identify the correct carrier based on tracking number format or additional shipment information.
- Last checkpoint: The most recent tracking update for a specific shipment, including status, location, and timestamp.
- Notifications: Customer notification settings and history, including email and SMS subscription details for shipment updates.
What use cases can I built with Parabola's AfterShip integration?
Brands turn to Parabola any time they're exporting CSVs, breaking into Excel, monitoring and reconciling systems, and doing work manually. Here are some common use cases from brands that leverage AfterShip:
- Centralized shipment tracking: Pull tracking data from AfterShip and combine it with order records from Shopify, NetSuite, or your WMS to create a single consolidated view of all outbound shipments across carriers and channels.
- Order-to-tracking reconciliation: Compare order data from your ERP or sales channels with AfterShip tracking feeds to identify missing tracking numbers, mismatched shipments, duplicates, or orders with no delivery updates.
- Delivery SLA and transit-time reporting: Monitor delivery speed, missed SLAs, and carrier transit-time performance by combining AfterShip timestamps with promised delivery dates from your ERP or OMS.
- Carrier performance scorecards: Analyze on-time rates, exception frequency, and regional performance by carrier using AfterShip status histories to generate internal performance dashboards and quarterly business review scorecards.
- Exception and delay monitoring: Create automated workflows that pull AfterShip exceptions—like failed delivery attempts, “Available for Pickup,” or “Exception”—and alert CX or ops teams for proactive customer outreach via Slack or email.
- Return shipment visibility: Track return parcels by pulling AfterShip reverse-logistics checkpoints and joining them with RMA or returns data in Shopify, ERP, or your returns platform to improve refund timing and accuracy.
Tips to find success
- Schedule your flow to run automatically: Set up hourly or daily refreshes to keep tracking data current and catch exceptions as they happen.
- Use Filters to identify at-risk shipments: Create rules to flag trackings that have been "In Transit" for longer than expected or haven't moved in several days.
- Combine with other systems: Join AfterShip tracking data with your order management system (Shopify, NetSuite, etc.) to create complete order-to-delivery reports and catch missing tracking numbers.
- Set up Alerts for exceptions: Configure automated Slack messages or email alerts when shipments move to "Exception" status or miss their estimated delivery dates.
- Normalize courier slugs early: AfterShip uses standardized courier identifiers (slugs) like "fedex" or "ups"—use these consistently when joining data from multiple sources.
- Archive historical data: Export completed shipments to Google Sheets or your data warehouse to analyze long-term trends in carrier performance and delivery times.
- Filter by destination region: Use checkpoint location data to analyze delivery performance by geography and identify regions with higher exception rates.
Integration:
Airtable
Use the Pull from Airtable step to pull in your data from your Airtable databases.
On August 1, 2023, Airtable will no longer allow users to generate new API keys. If you have a Pull from Airtable step that was authorized before July 27th, 2023 (using an API key for authentication), it will continue to pull in data until February 1, 2024. After that date, the step will no longer function. To migrate your step to the new authentication method, open the step, click "Choose Accounts" -> "Add new account". Once that authentication has been added to one step in your Flow, you can switch other Airtable steps to use it as well.
Connect your Airtable account
To connect to your Airtable account, click the blue Authorize button.
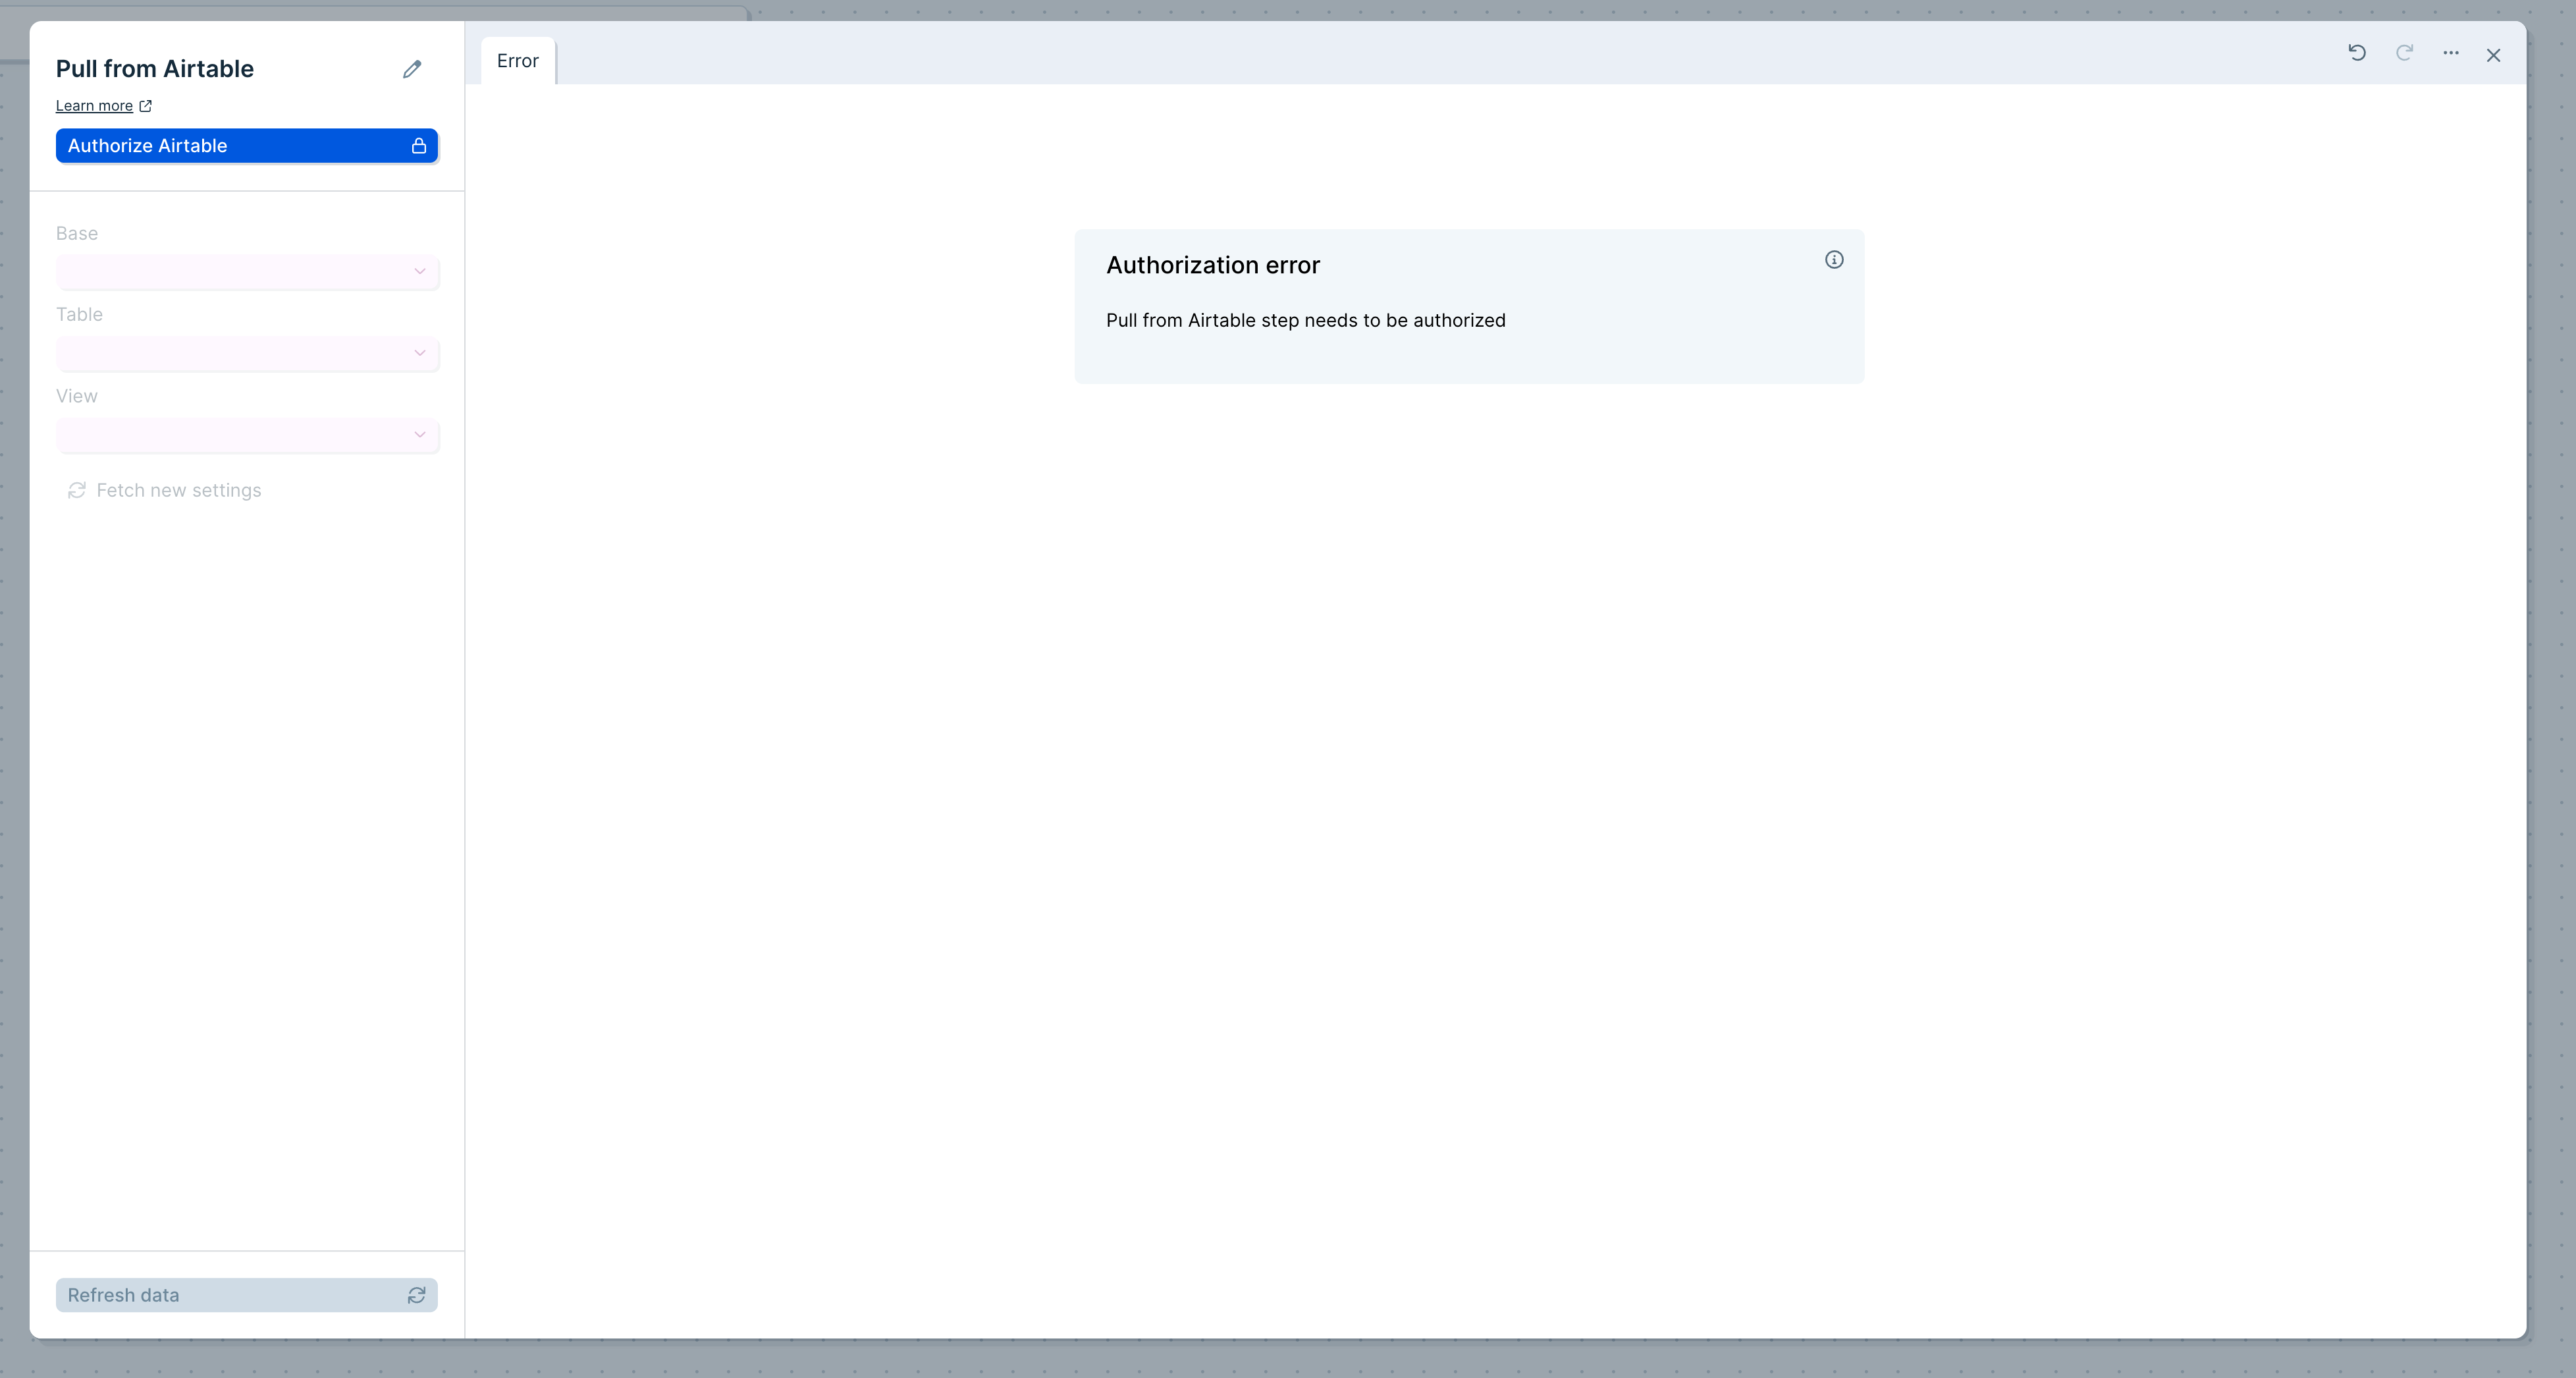
Clicking Authorize will launch a window where you can sign in to Airtable and confirm which bases you would like Parabola to have access to. Any base that you do not select from this menu will not be available to pull data from.
Custom settings
Once connected, you can select the Base, Table and View from your Airtable bases. In the example below, we are pulling data from our Shopify Orders base and our Orders table using the Grid view.
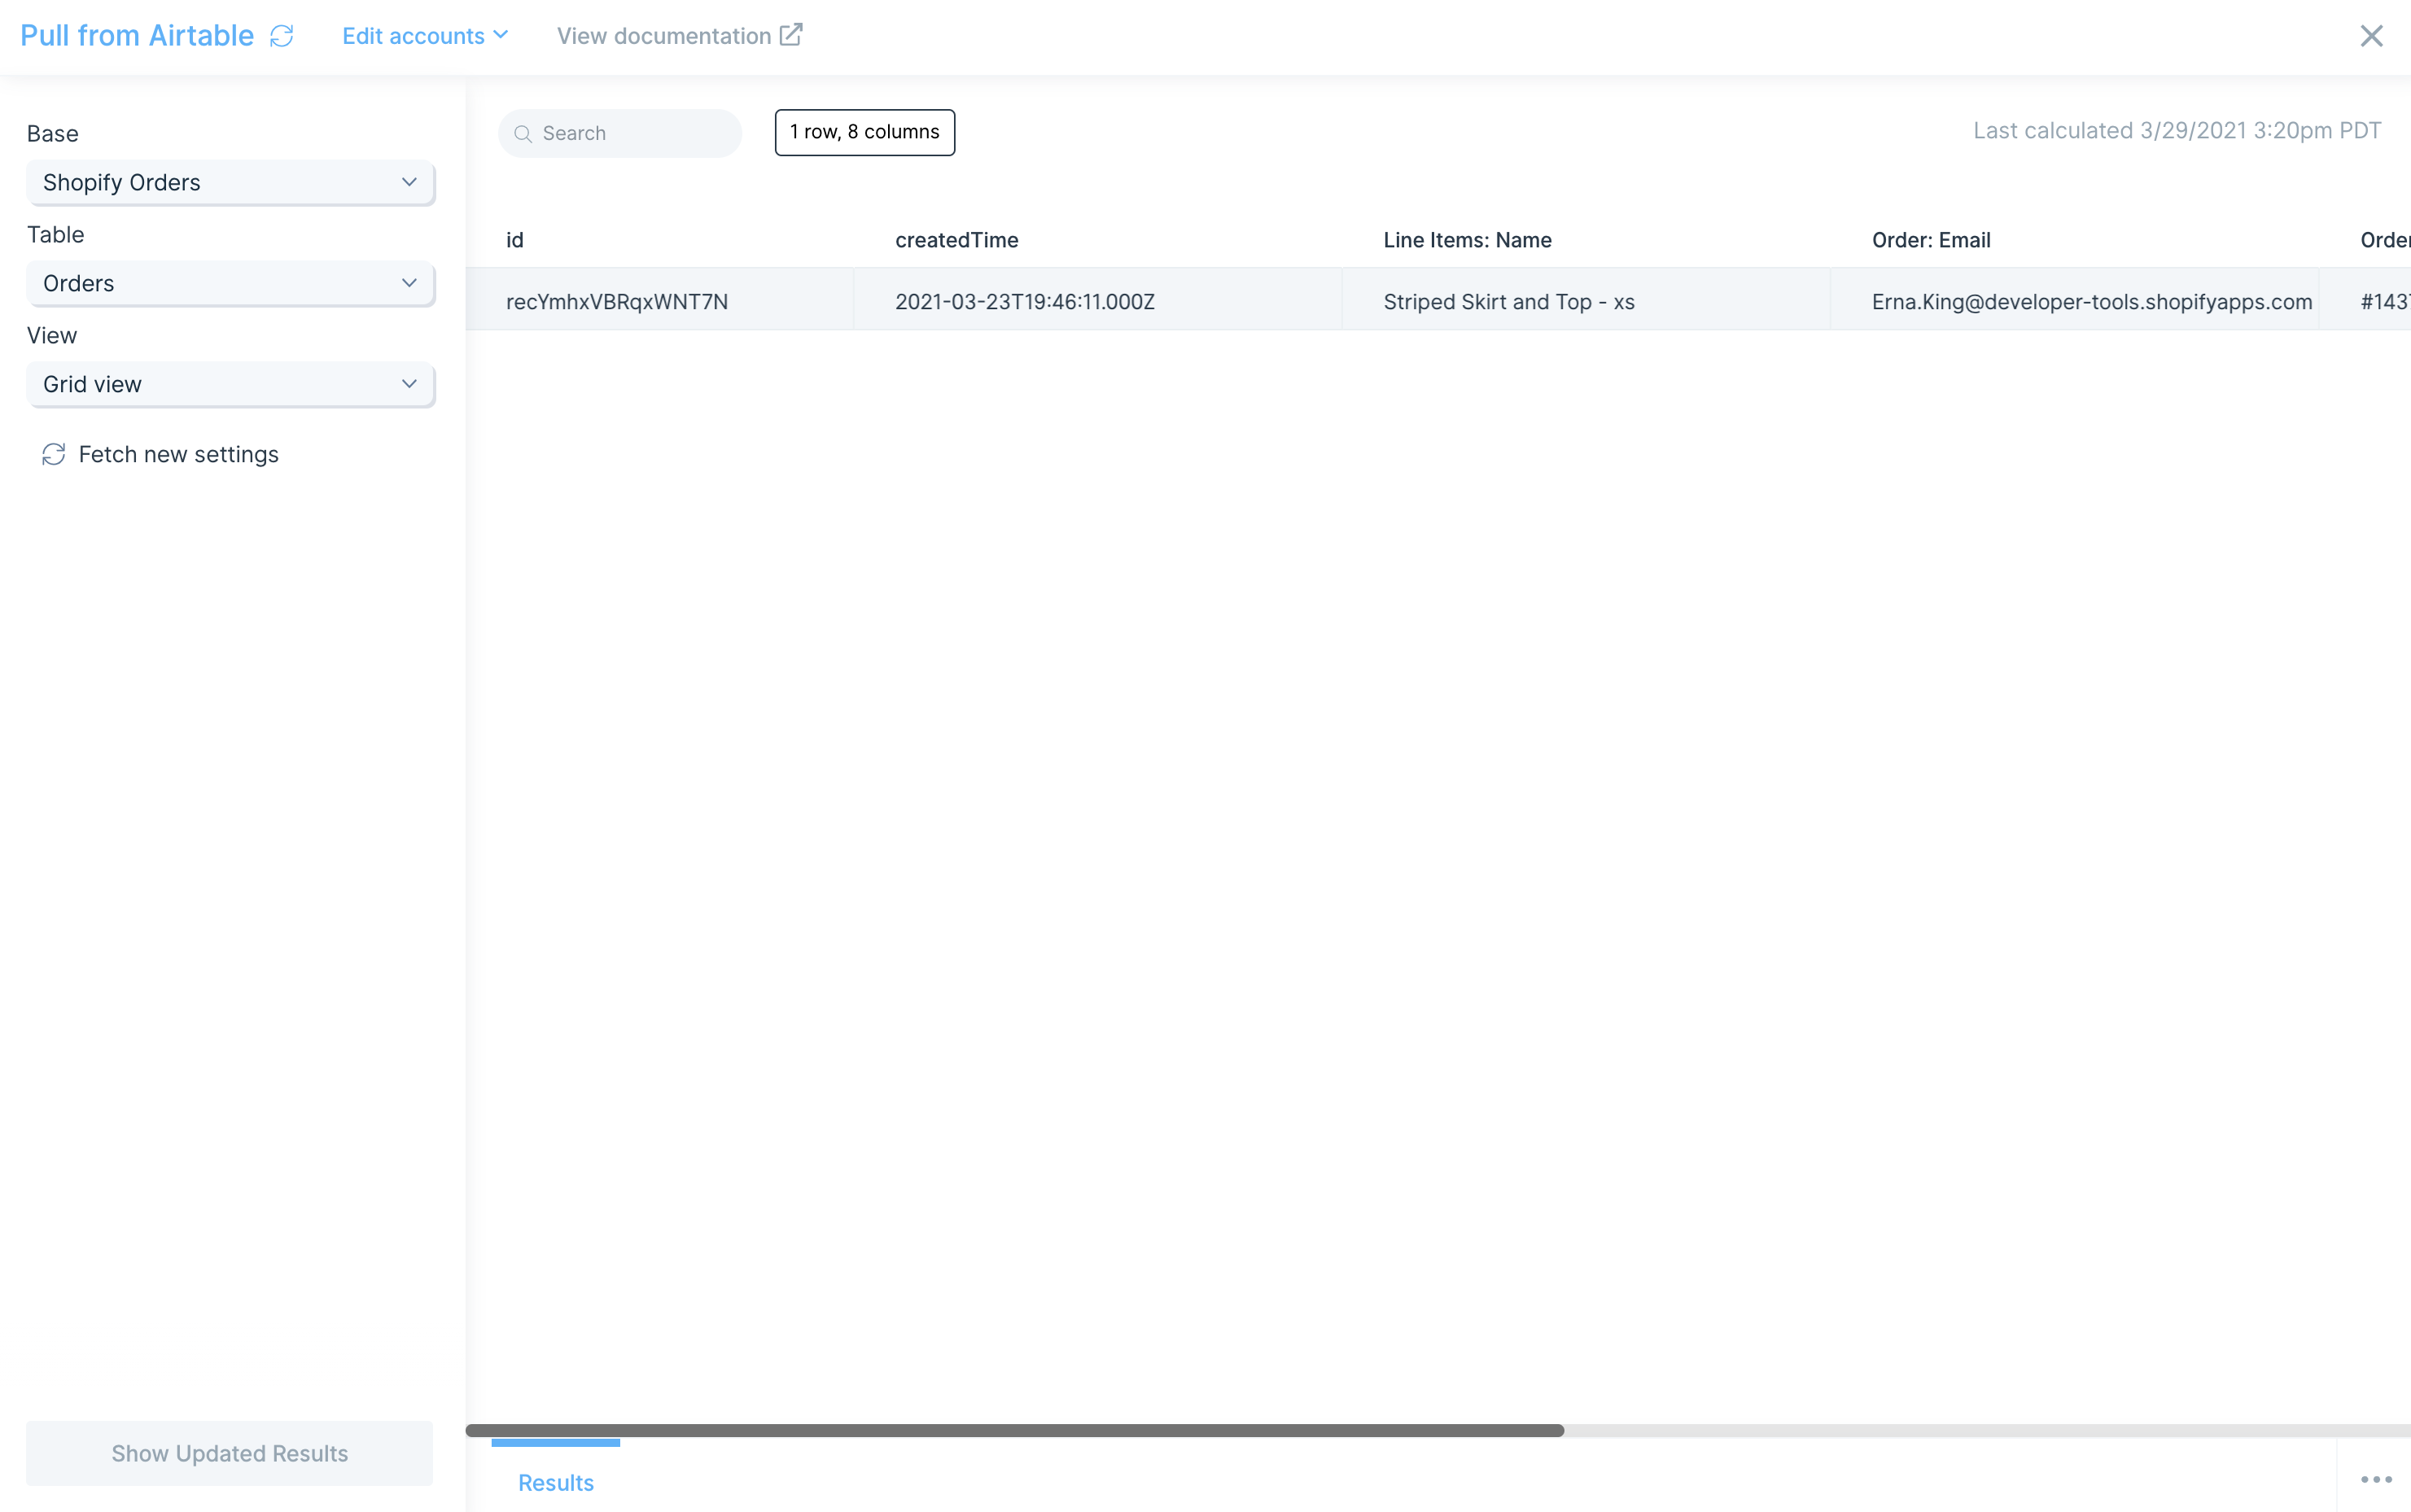
You can also click Fetch new settings to reload any bases, tables, or views since your data was last imported.
Helpful tips
Linked Records
If your base uses linked records to connect tables, those values will be pulled in as record ids. To get the complete data associated with those records, use another Pull from Airtable step to import the related table. Using the Combine tables step, you can merge the tables together based on a shared record id.
Good to know
If a column has no values in it, that column will not be imported. There must be at least one value present in a row for the column itself to come through.
If a column has a duration in an h:mm format, Airtable exports duration value in millisecond units, parses incoming duration value using minutes. For example, Airtable sends 0:01 as 60.
Use the Send to Airtable step to create, update, or delete records in your Airtable base. Just map the fields in your Airtable base to the related columns in Parabola.
On August 1, 2023, Airtable will no longer allow users to generate new API keys. If you have a Send to Airtable step that was authorized before July 27th, 2023 (using an API key for authentication), it will continue to pull in data until February 1, 2024. After that date, the step will no longer function. To migrate your step to the new authentication method, open the step, click "Choose Accounts" -> "Add new account". Once that authentication has been added to one step in your Flow, you can switch other Airtable steps to use it as well.
Connect your Airtable account
To connect to your Airtable account, click the blue Authorize button.
Clicking Authorize will launch a window where you can sign in to Airtable and confirm which bases you would like Parabola to have access to. Any base that you do not select from this menu will not be available to pull data from.
Custom settings
Once connected, you can chose to create records, update records, or delete records from the base and table of your choosing.
Creating records
In the example below, we are adding order #2001 to our Orders table within our Shopify Orders base.
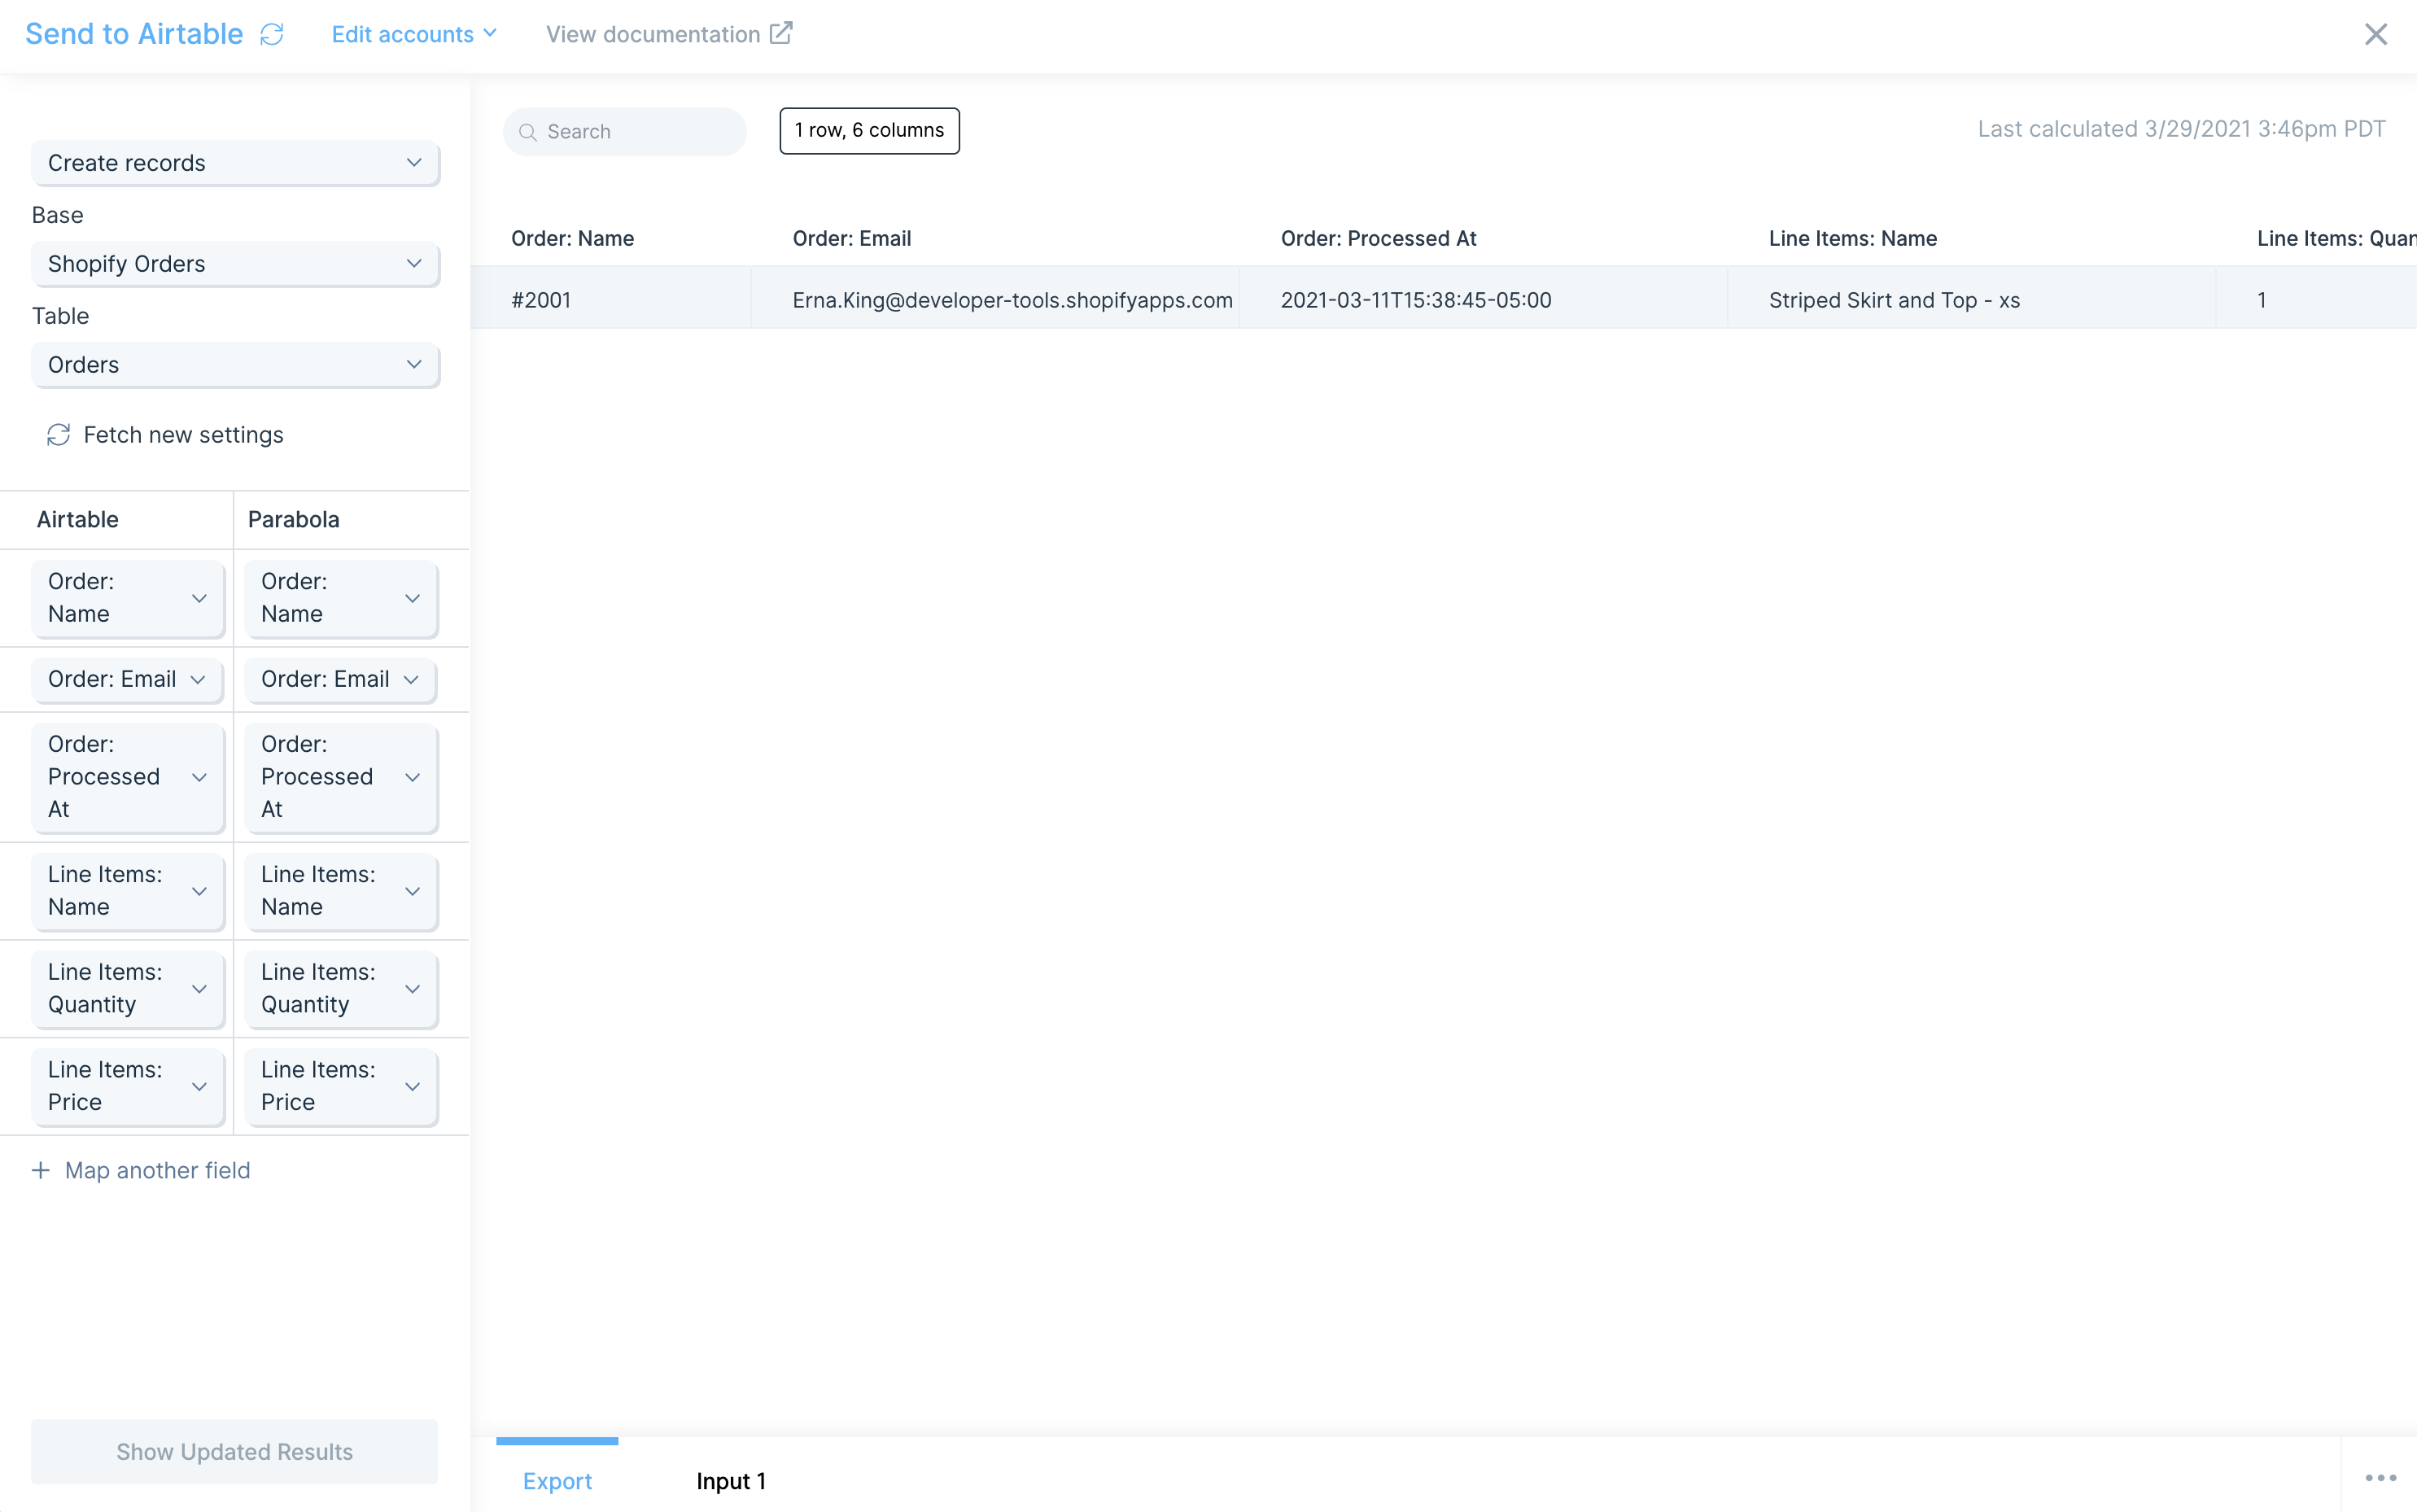
Note how the Airtable fields are displayed on the left-hand side. Each of the columns from your Airtable base appears. On the right-hand side, map the values from our Parabola data to be added into those fields.
Updating records
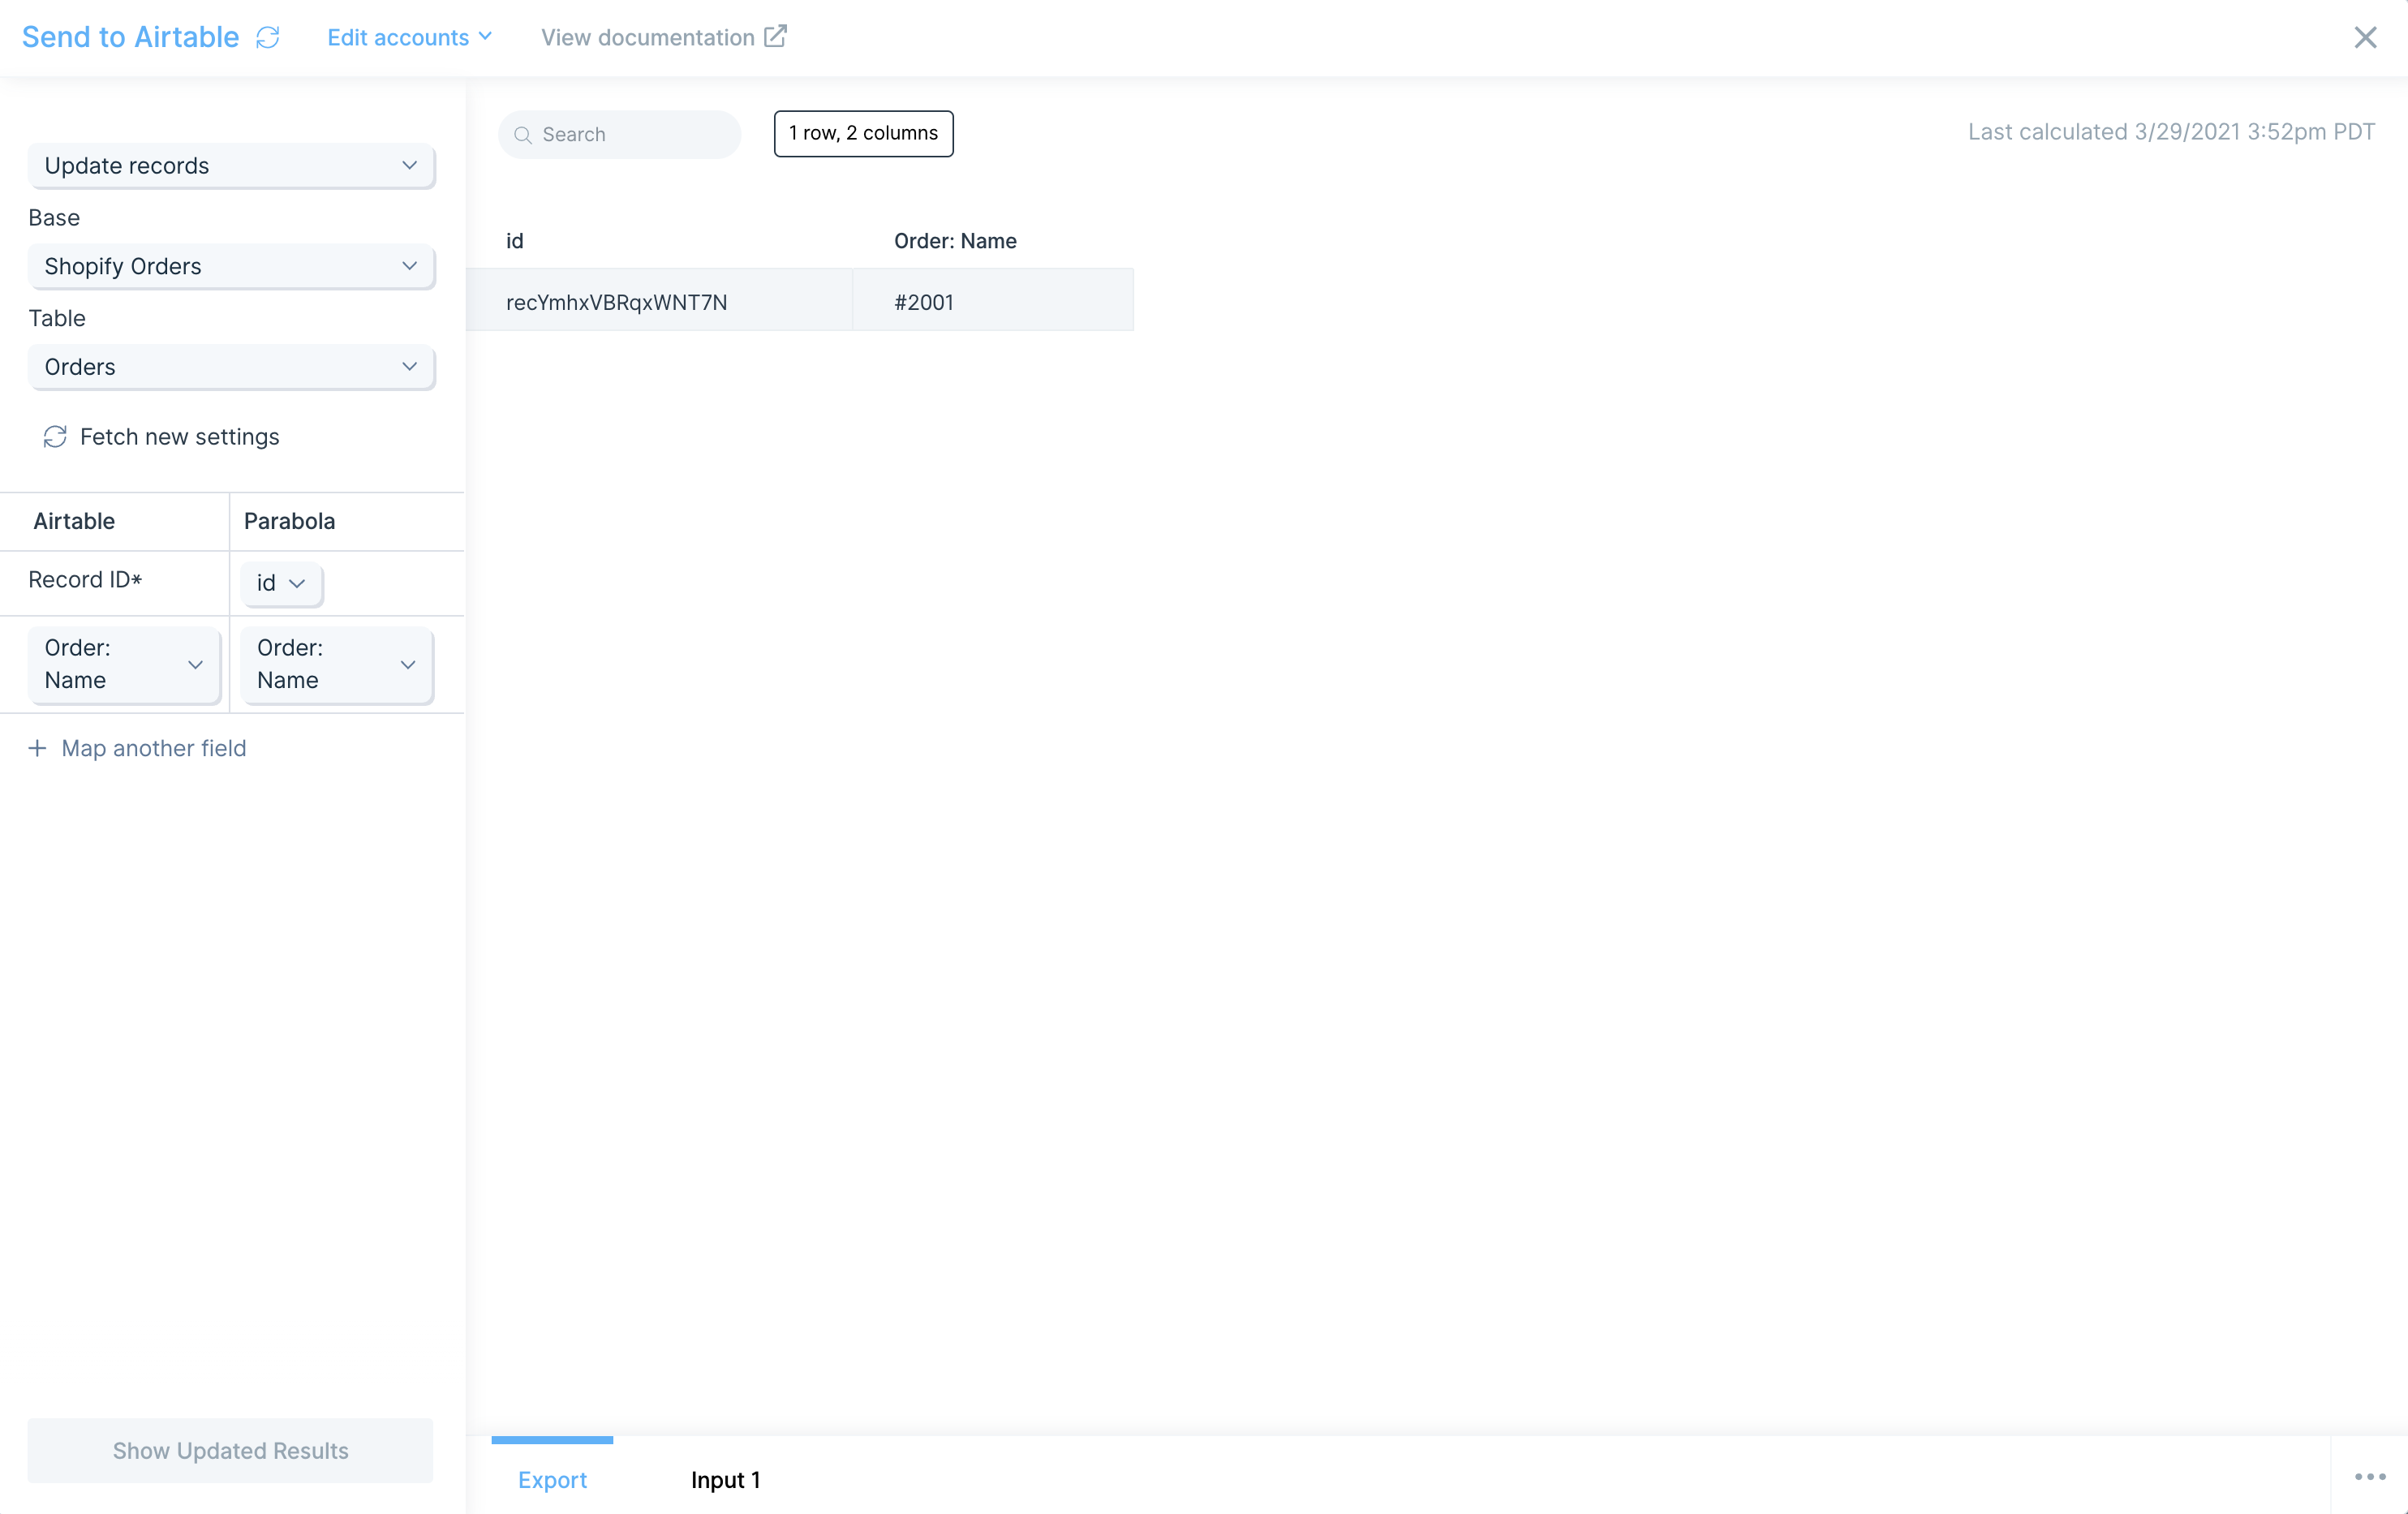
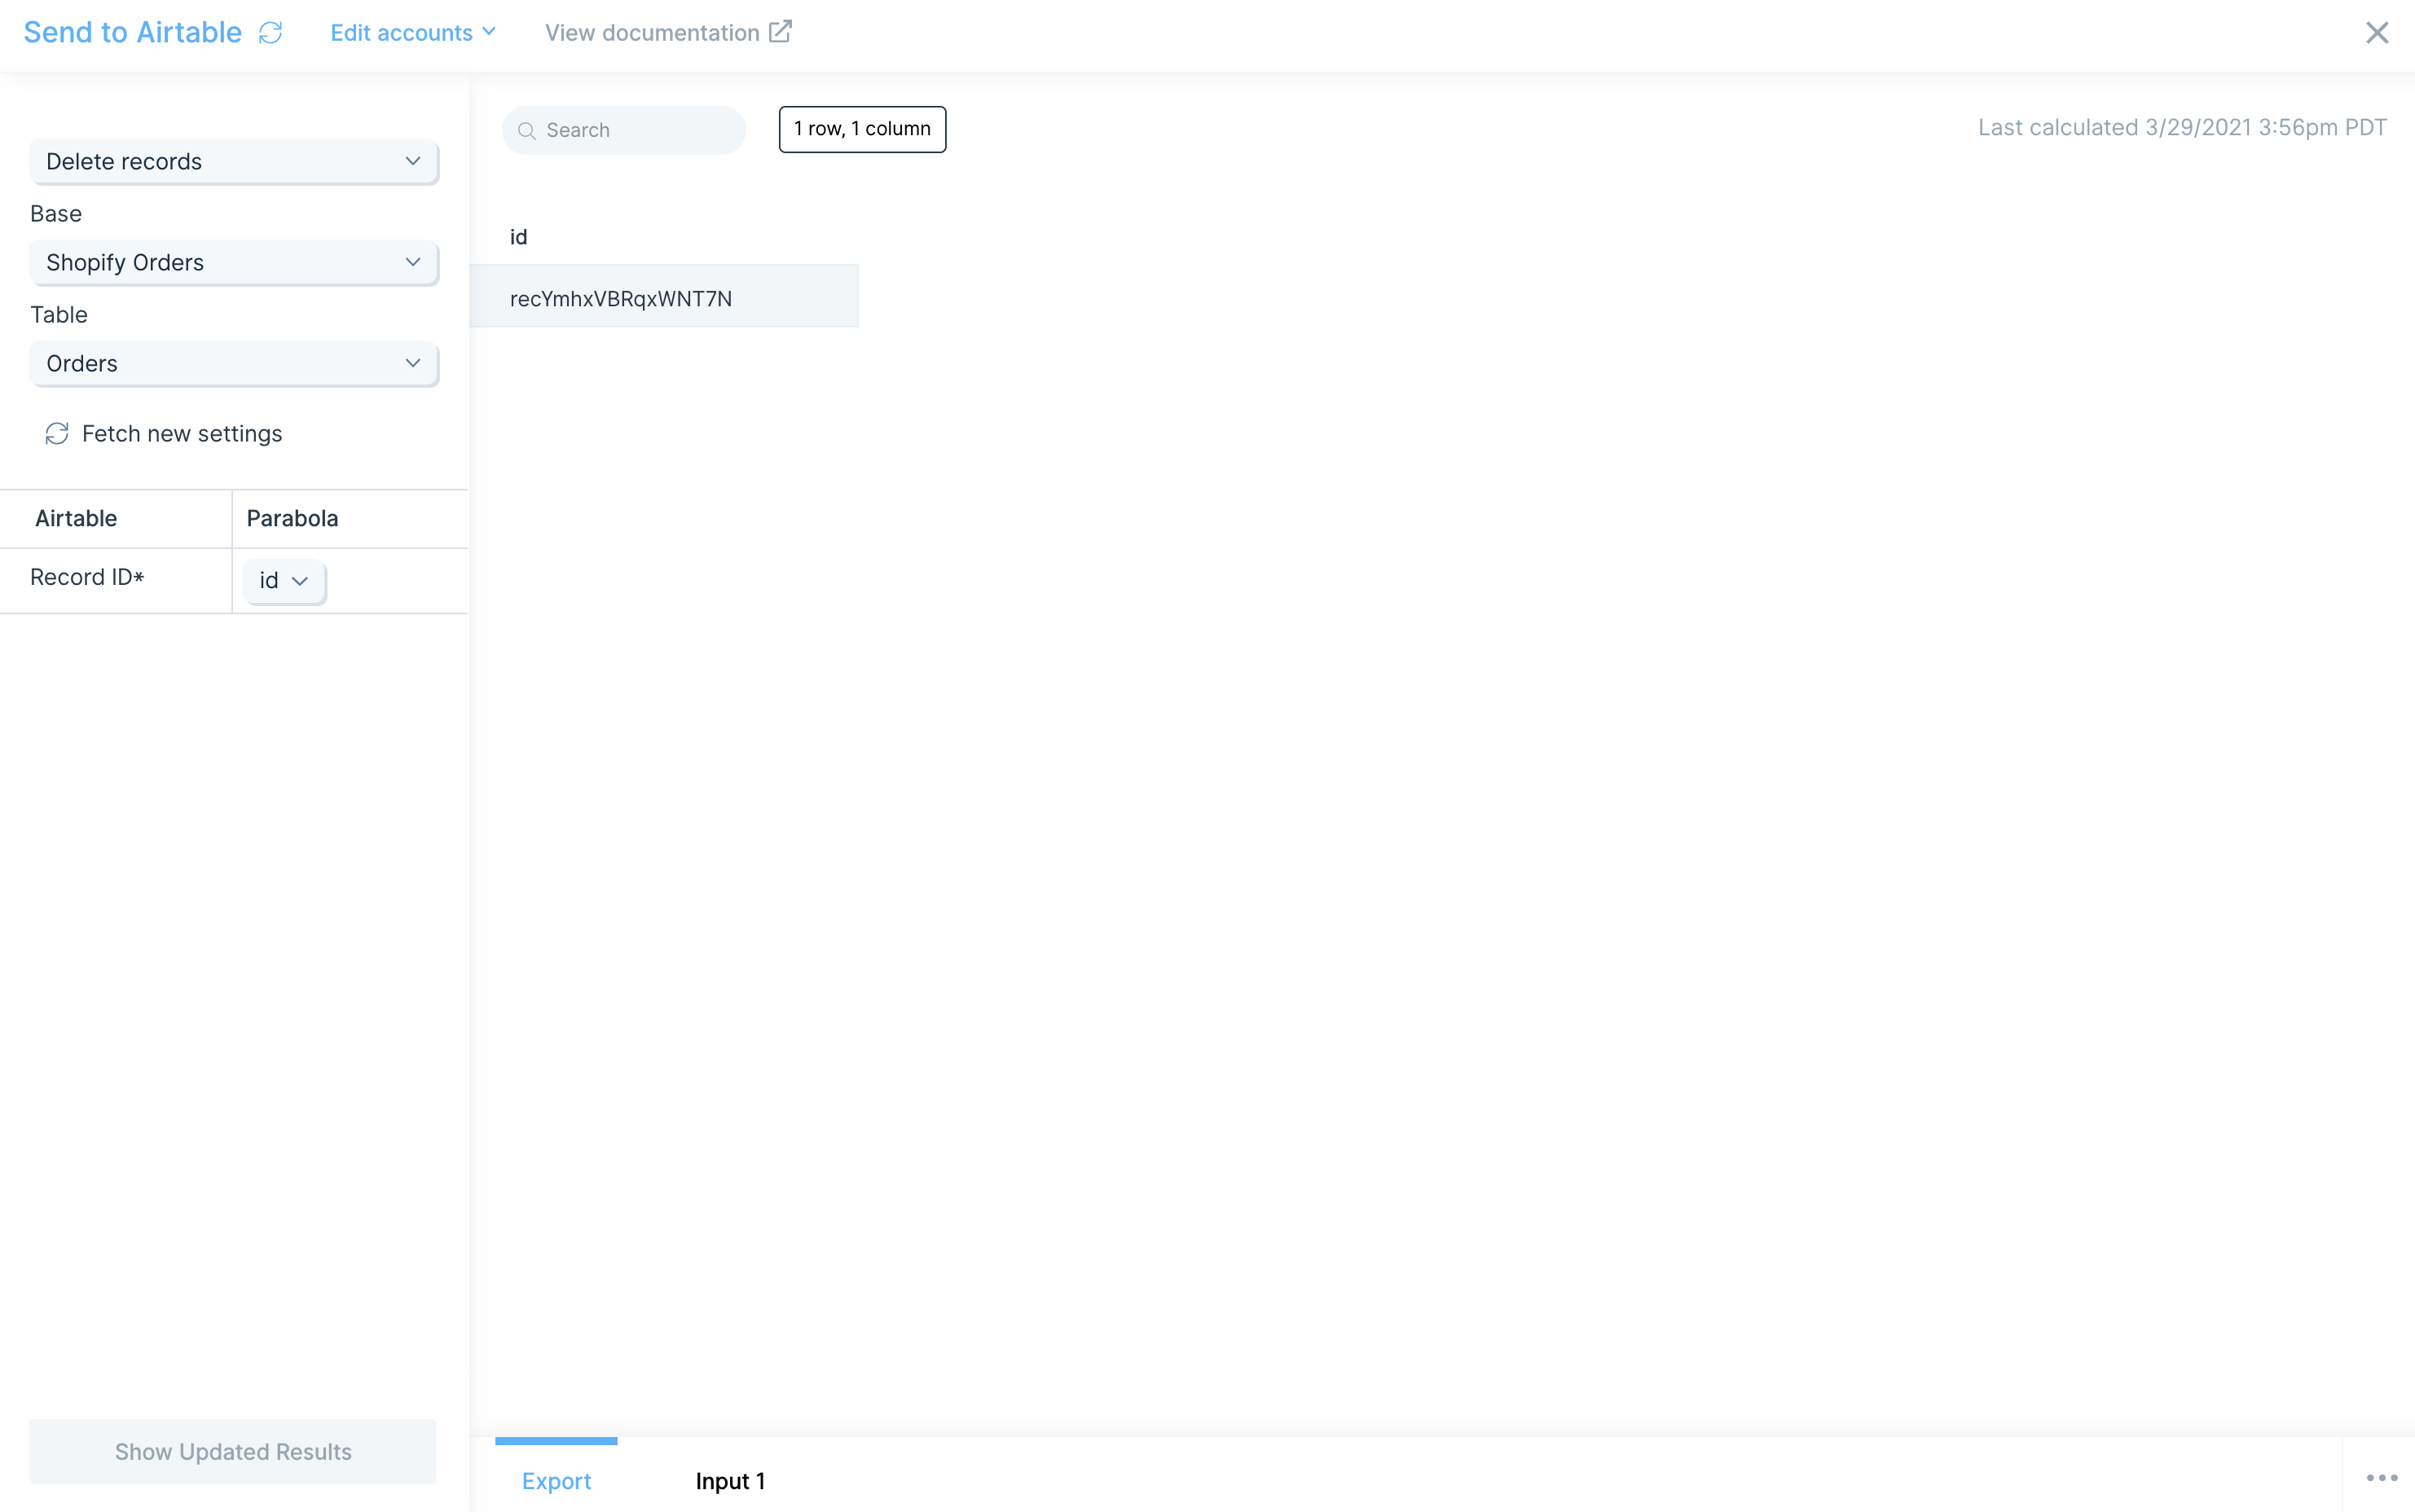
You can also target a specific record to be updated. Map the Record ID* to the id column in Parabola that contains that data. You can also chose the specific fields you want to update.
In this example, we are updating the Order: Name of record recYmhxVBRqxWNT7N.
Deleting records
To delete a record, simply map the Record ID* to the id column in Parabola. In this example, we are deleting record recYmhxVBRqxWNT7N.
Helpful tips
Percentages
Convert your percentages to decimal values using before sending data to Airtable. For example, if your data contains 0.51%, convert that to 0.0051 and adjust your precision values in Airtable. By default, Airtable may interpret that as 0.01%.
Single select/Multi select
You can automatically pass the values of your select options to set those values in your Airtable base. If you enter a select option that does not exist, Airtable will automatically create new select option for that value.
Duration using h:mm format
Airtable parses incoming duration value using minutes. For example, if your duration is 60 milliseconds, Airtable will parse that value as 1:00.
Checkboxes
Set a value of true to toggle a checkbox in your table. Set a value of false to un-toggle a checkbox in your table.
Collaborators
When updating Airtable column with field type collaborator, you can pass in an id or email value. Passing a name value will return an error of "Cannot parse value".
Integration:
Amazon Seller Central
Use the Pull from Amazon Seller Central step to import Amazon reports into your flow.
Set up the step
- Drag the Pull from Amazon Seller Central step onto the canvas.
- Click "Authorize Amazon Seller".
- In the pop-up that appears, log in to your Amazon Seller Central account to connect it to Parabola.

Configure your settings
.png)
Troubleshooting "fatal error" response from Amazon
Potential reasons for fatal errors from Amazon
- No data is available for the date range specified.
- The date range doesn’t follow Amazon’s specifications. Some report types have minimum and maximum date range limits. Check the description of your selected report type for details.
- The connected seller account doesn’t sell in the marketplace(s) specified in the request.
- You’ve made the same exact report request too many times in a row. In rare cases, this can result in a fatal error response from Amazon.
Potential solutions
- Try adjusting your date range to a smaller or different window.
- Manually confirm in Amazon Seller Central that data exists for the date range you’re requesting.
- While this behavior isn’t confirmed in Amazon’s official documentation, several users have observed it. Try spacing out repeated report requests (try again in 24 hours) if you suspect that this might be the cause of the fatal errors.
Helpful tips
- This step pulls from Amazon’s Reporting API. If you need data from the Orders or Customers APIs, look for reports that already contain that information.
- At this time, we are unable to pull reports from the Easy Ship and Orders report categories. (Last update: October 7, 2025)
- There are two types of inventory reports: Inventory and Fulfillment by Amazon (FBA) Inventory. Check both if you’re unsure where your dataset lives. Inventory reports cover products you fulfill directly, while FBA Inventory reports cover products Amazon fulfills on your behalf.
- Amazon’s API can take up to an hour to return report results. Limit the timeframe or data size when possible to reduce wait times.
- The default timezone matches your browser. You can adjust this if needed. Parabola converts your timeframe and timezone to UTC when requesting the report.
- If a report exists in Amazon Seller Central but isn’t available in Parabola, contact us at help@parabola.io.
Integration:
API
The first time interacting with an API can feel daunting. Each API is unique and requires different settings, but is generally standardized to make understanding and connecting to an API accessible.
To learn how to best use APIs in Parabola, check out our video guides.
Types of APIs
Parabola works best with two types of APIs. The most common API type to connect to is a REST API. Another API type rising in popularity is a GraphQL API. Parabola may be able to connect to a SOAP API, but it is unlikely due to how they are structured.
To evaluate if Parabola can connect with an API, reference this flow chart.
REST API
A REST API is an API that can return data by making a request to a specific URL. Each request is sent to a specific resource of an API using a unique Endpoint URL. A resource is an object that contains the data being requested. Common examples of a resource include Orders, Customers, Transactions, and Events.
To receive a list of orders in Squarespace, the Pull from an API step will make a request to the Squarespace's Orders resource using an Endpoint URL:
https://api.squarespace.com/{api-version}/commerce/orders
GraphQL API
GraphQL is a new type of API that allows Parabola to specify the exact data it needs from an API resource through a request syntax known as a GraphQL query. To get started with this type of API call in Parabola, set the request type to "POST" in any API step, then select "GraphQL" as the Protocol of the request body.
Once your request type is set, you can enter your query directly into the request body. When forming your query, it can be helpful to use a formatting tool to ensure correct syntax.
Our GraphQL implementation current supports Offset Limit pagination, using variables inserted directly into the query. Variables can be created by inserting any single word between the brackets '<%%>'. Once created, variables will appear in the dropdown list in the "Pagination" section. One of these variables should correspond to your "limit", and the other should correspond to "offset."
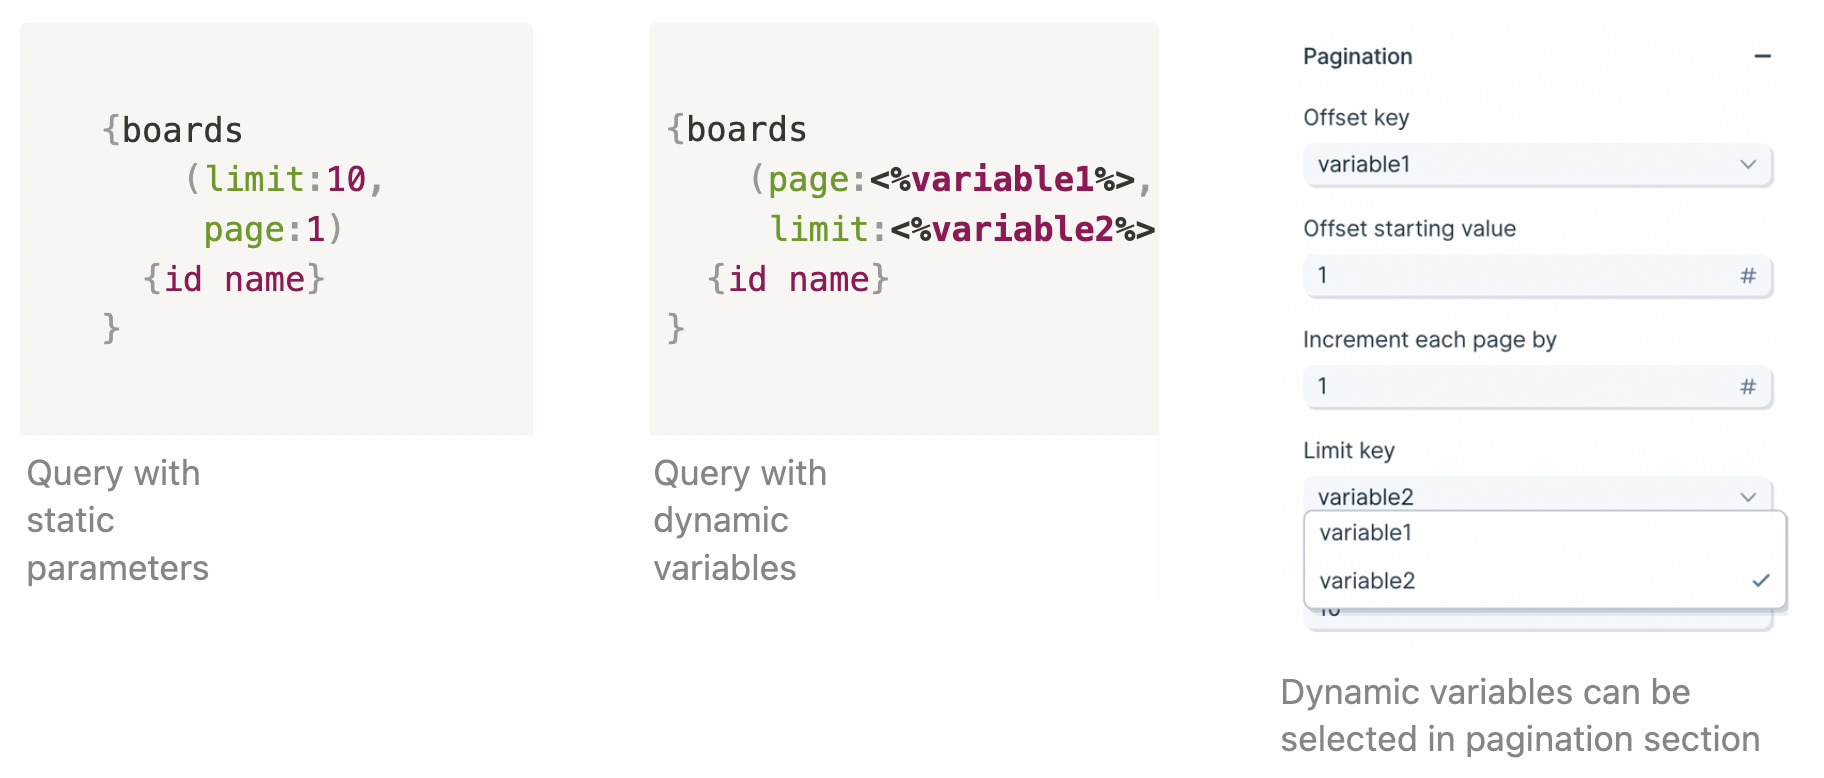
The limit field is static; it represents the number of results returned in each API request. The offset field is incremented in each subsequent request based on the "Increment each page by" value. The exact implementation will be specific to your API docs.
After configuring your pagination settings, also be sure to adjust the "Maximum pages to fetch" setting in the "Rate Limiting" section as well to retrieve more or less results.
GraphQL can be used for data mutations in addition to queries, as specified by the operation type at the start of your request body. For additional information on Graph queries and mutations, please reference GraphQL's official documentation.
Reading API Documentation
The first step to connect to an API is to read the documentation that the service provides. Oftentimes, the documentation is commonly referred to as the API Reference, or something similar. These pages tend to feature URL and code block content.
The API Reference, always provides at least two points of instruction. The first point outlines how to Authenticate a request to give a user or application permission to access the data. The second point outlines the API resources and Endpoint URLs, or where a request can be sent.

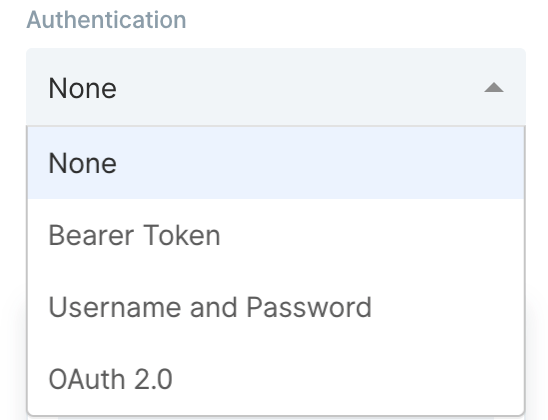
Authentication
Most APIs require authentication to access their data. This is likely the first part of their documentation. Try searching for the word "Authentication" in their documentation.

The most common types of authentication are Bearer Tokens, Username/Password (also referred to as Basic), and OAuth2.0.
Bearer Token
This method requires you to send your API Key or API Token as a bearer token. Take a look at this example below:
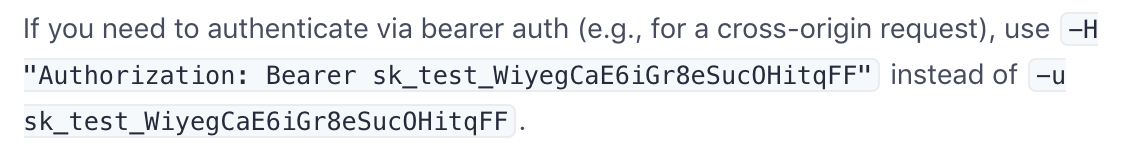
The part that indicates it is a bearer token is this:
-H "Authorization: Bearer sk_test_WiyegCaE6iGr8eSucOHitqFF"
Username/Password (Basic)
This method is also referred to as Basic Authorization or simply Basic. Most often, the username and password used to sign into the service can be entered here.
However, some APIs require an API key to be used as a username, password, or both. If that's the case, insert the API key into the respective field noted in the documentation.
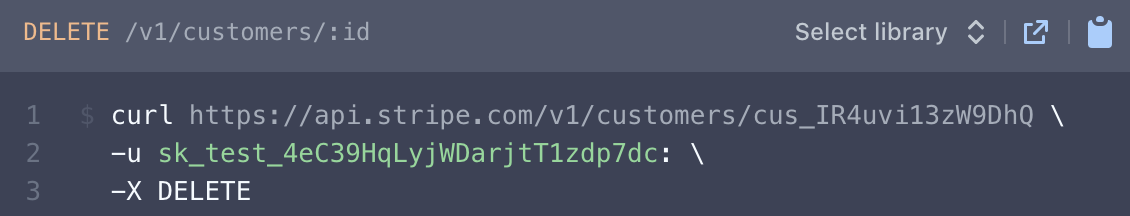
The example below demonstrates how to connect to Stripe's API using the Basic Authorization method.
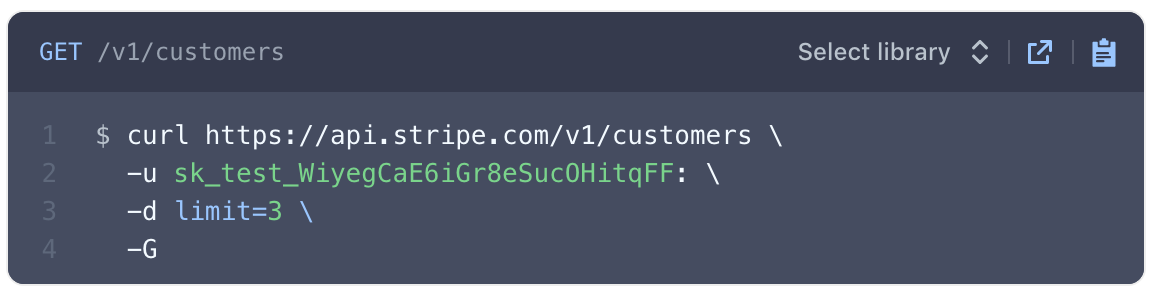
The Endpoint URL shows a request being made to a resource called "customers". The authorization type can be identified as Basic for two reasons:
- The -u indicates Basic Authorization.
- Most APIs reference the username and password formatted as username:password. There is a colon : . This indicates that only a username is required for authentication.
OAuth2.0
This method is an authorization protocol that allows users to sign into a platform using a third-party account. OAuth2.0 allows a user to selectively grant access for various applications they may want to use.
Authenticating via OAuth2.0 does require more time to configure. For more details on how to authorize using this method, read our guide Using OAuth2.0 in Parabola.
Expiring Access Token
Some APIs will require users to generate access tokens that have short expirations. Generally, any token that expires in less than 1 day is considered to be "short-lived" and may be using this type of authentication. This type of authentication in Parabola serves a grouping of related authentication styles that generally follow the same pattern.
One very specific type of authentication that is served by this option in Parabola is called OAuth2.0 Client Credentials. This differs from our standard OAuth2.0 support, which is built specifically for OAuth2.0 Authorization Code. Both Client Credentials and Authorization Code are part of the OAuth2.0 spec, but represent different Grant Types.
Authenticating with the Expiring Access Token option is more complex than options like Bearer Token, but less complex than OAuth2.0. For more details on how to use this option, read our guide Using Expiring Access Tokens in Parabola.
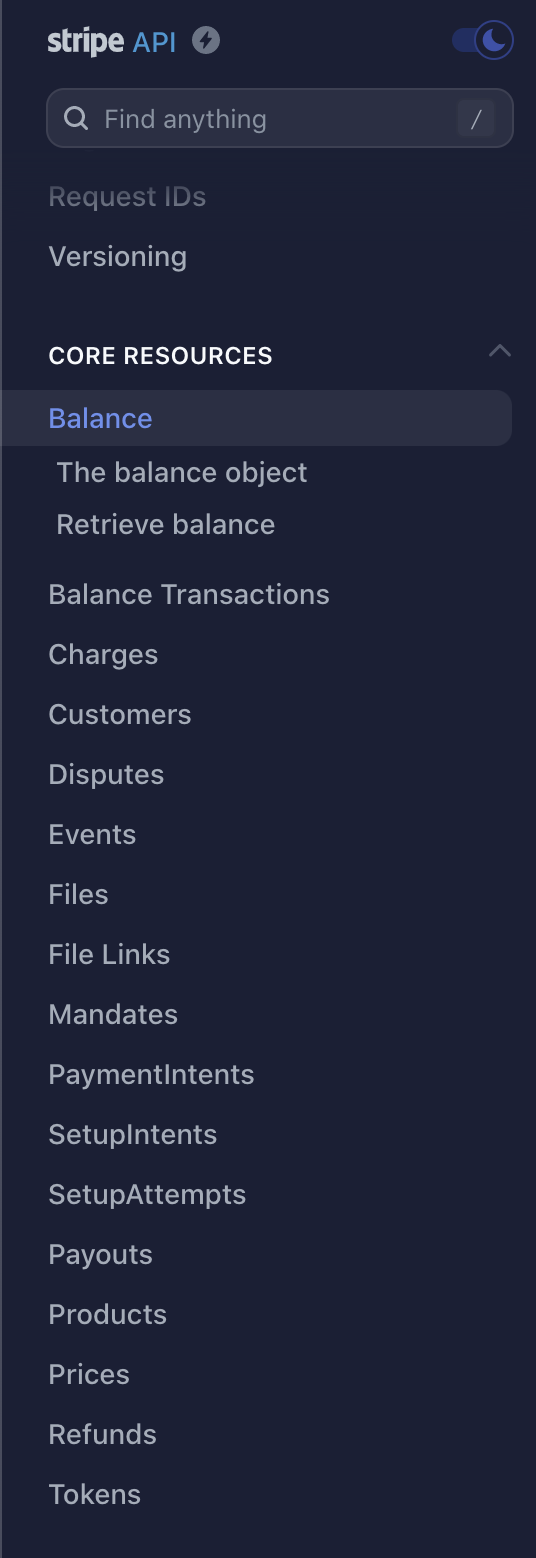
Resources
A resource is a specific category or type of data that can be queried using a unique Endpoint URL. For example, to get a list of customers, you might use the Customer resource. To add emails to a campaign, use the Campaign resource.
Each resource has a variety of Endpoint URLs that instruct you how to structure a URL to make a request to a resource. Stripe has a list of resources including "Balance", "Charges", "Events", "Payouts", and "Refunds".
HTTP Methods
HTTP methods, or verbs, are a specific type of action to make when sending a request to a resource. The primary verbs are GET, POST, PUT, PATCH, and DELETE.
- The GET verb is used to receive data.
- The POST verb is used to create new data.
- The PUT verb is used to update existing data.
- The PATCH verb is used to modify a specific portion of the data.
- The DELETE verb is used to delete data.
Custom Headers
A header is a piece of additional information to be sent with the request to an API. If an API requires additional headers, it is commonly noted in their documentation as -H.
Remember the authentication methods above? Some APIs list the authentication type to be sent as a header. Since Parabola has specific fields for authentication, those headers can typically be ignored.
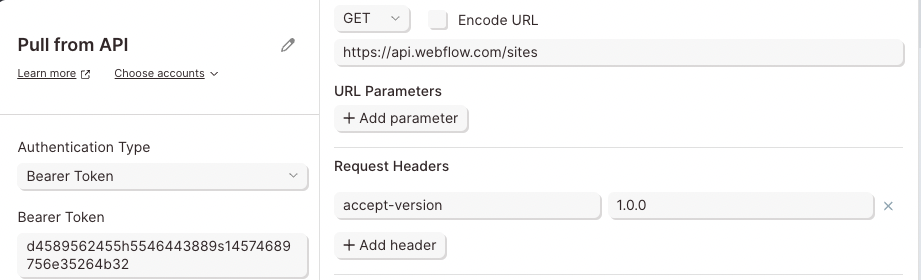
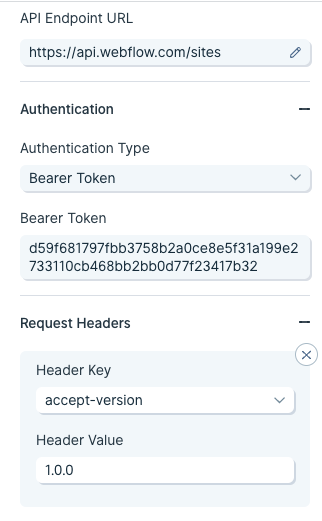
Taking a look at Webflow's API, they show two headers are required:

The first -H header is linked to a key called Authorization. Parabola takes care of that. It does not need to be added as a header. The second -H header is linked to a key called accept-version. The value of the header is 1.0.0. This likely indicates which version of Webflow's API will be used.
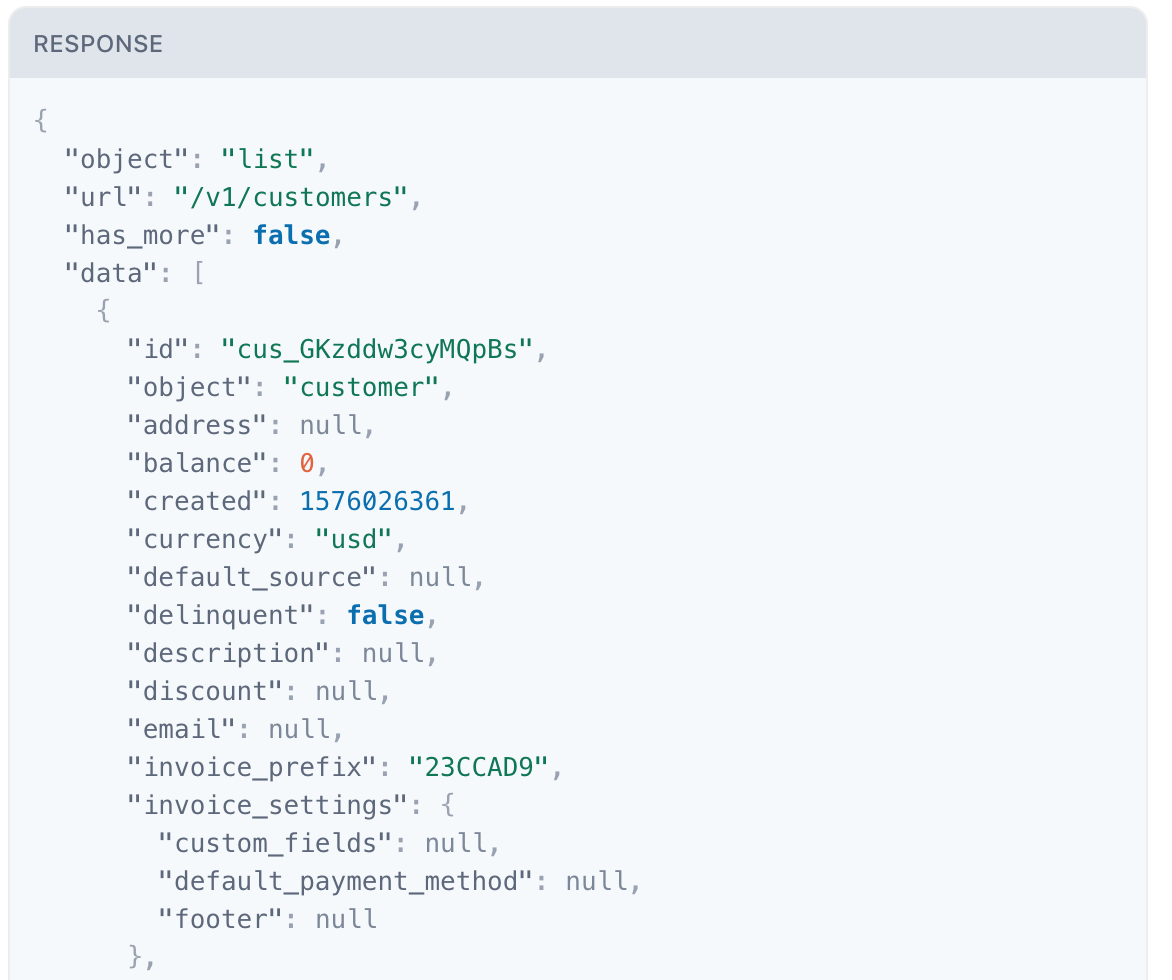
JSON
JavaScript Object Notation, or more commonly JSON, is a way for an API to exchange data between you and a third-party. JSON is follows a specific set of syntax rules.
An object is set of key:value pairs and is wrapped in curly brackets {}. An array is a list of values linked to a single key or a list of keys linked to a single object.
JSON in API documentation may look like this:
Interpreting cURL
Most documentation will use cURL to demonstrate how to make a request using an API.
Let's take a look at this cURL example referenced in Spotify's API:
curl -X GET "[<https://api.spotify.com/v1/artists?ids=0oSGxfWSnnOXhD2fKuz2Gy>](<https://api.spotify.com/v1/artists?ids=0oSGxfWSnnOXhD2fKuz2Gy,3dBVyJ7JuOMt4GE9607Qin>)"
-H "Authorization: Bearer {your access token}"
We can extract the following information:
- Method: GET
- Resource: artists
- Endpoint URL:
https://api.spotify.com/v1/artists?ids=0oSGxfWSnnOXhD2fKuz2Gy
- Authorization: Bearer token
- Headers: "Authorization: Bearer {your access token}"
Because Parabola handles Authorization separately, the bearer token does not need to be passed as a header.
Here's another example of a cURL request in Squarespace:
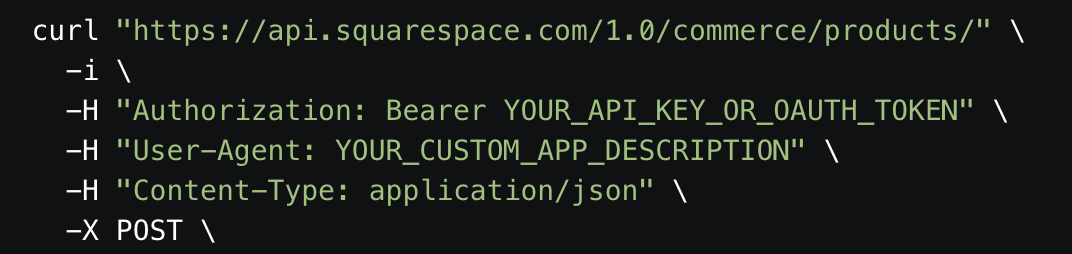
This is what we can extract:
- Method: POST
- Resource: products
- Endpoint URL:
https://api.squarespace.com/1.0/commerce/products/
- Authorization: Bearer token
- Headers:
"Authorization: Bearer YOUR_API_KEY_OR_OAUTH_TOKEN", "User-Agent: YOUR_CUSTOM_APP_DESCRIPTION"
- Content-Type: application/json
Parabola also passes Content-Type: application/json as a header automatically. That does not need to be added.
Error Codes
Check out this guide to learn more troubleshooting common API errors.
The Pull from an API step sends a request to an API to return specific data. In order for Parabola to receive this data, it must be returned in a CSV, JSON, or XML format. This step allows Parabola to connect to a third-party to import data from another service, platform, or account.
You might wonder when it is best to use the Pull from API step vs Enrich with API step. If you need to take existing data and pass it through an API, we recommend you use Enrich with API in the middle of the Flow. Enrich with API makes requests row by row. If you just need to fetch data and join it into the middle of a Flow, you could use the “Pull from API” step and then a join step.
Basic Settings
To use the Pull from an API step, the "Request Type" and "API Endpoint URL" fields are required.

Request Type
There are two ways to request data from an API: using a GET request or using a POST request. These are also referred to as verbs, and are standardized throughout REST APIs.
The most common request for this step is a GET request. A GET request is a simple way to ask for existing data from an API.
"Hey API, can you GET me data from the server?"
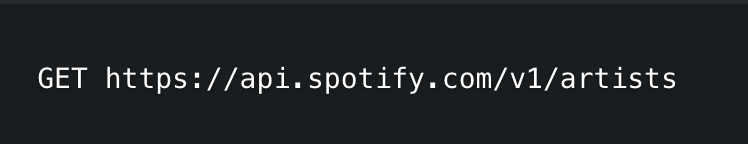
To receive all artists from Spotify, their documentation outlines using GET request to Artist resource using this Endpoint URL:
Some APIs will require a POST request to import data, however it is uncommon. A POST request is a simple way to make changes to existing data such as adding a new user to a table.
The request information is sent to the API in theJSON body of the request. The JSON body is a block that outlines the data that will be added.
Hey API, can you POST my new data to the server? The new data is in the JSON body.
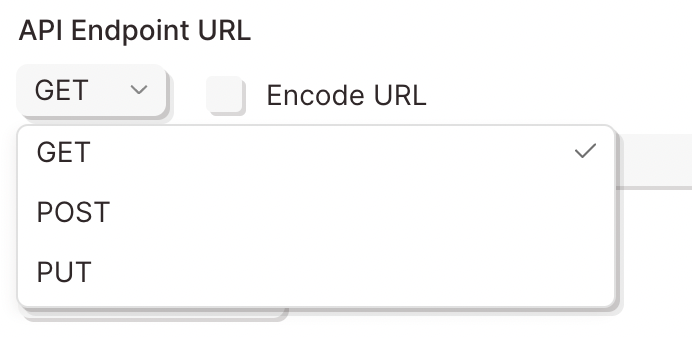
API Endpoint URL
Similar to typical websites, APIs use URLs to request or modify data. More specifically, an API Endpoint URL is used to determine where to request data from or where to send new data to. Below is an example of an API Endpoint URL.
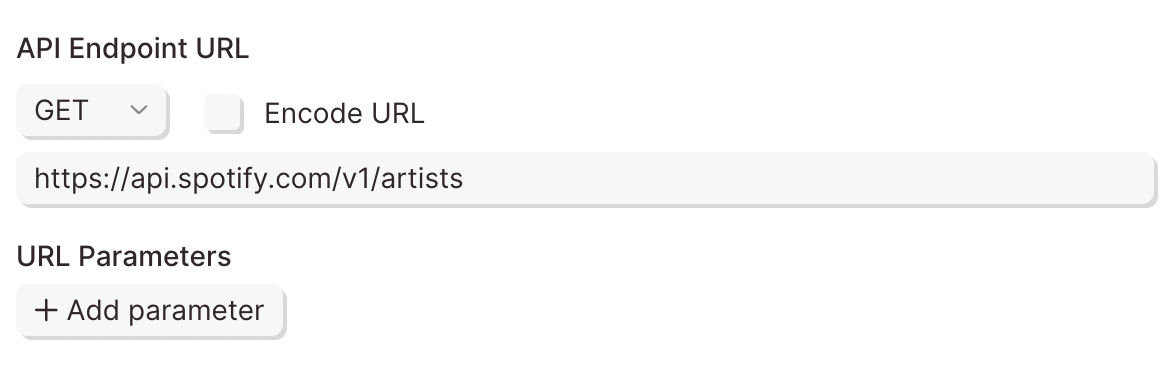
To add your API Endpoint URL, click the API Endpoint URL field to open the editor. You can add URL parameters by clicking the +Add icon under the "URL Parameters" text in that editor. The endpoint dynamically changes based on the key/value pairs entered into this field.
Authentication
Most APIs require authentication to access their data. This is likely the first part of their documentation. Try searching for the word Authentication in their documentation.
Here are the Authentication types available in Parabola:
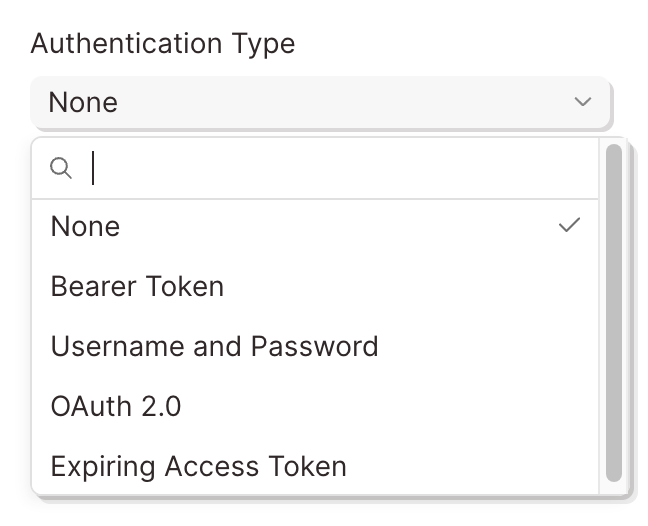
The most common types of authentication are Bearer Tokens, Username/Password (also referred to as Basic), and OAuth2.0. Parabola has integrated these authentication types directly into this step.
Bearer Token
This method requires you to send your API Key or API Token as a Bearer Token. Take a look at this example below:
The part that indicates it is a bearer token is this:
-H "Authorization: Bearer sk_test_WiyegCaE6iGr8eSucOHitqFF"
To add this specific token in Parabola, select Bearer Token from the Authorization menu and add "sk_test_WiyegCaE6iGr8eSucOHitqFF" as the value.
Username/Password (Basic)
This method is also referred to as Basic Authorization or simply Basic. Most often, the username and password used to sign into the service can be entered here.
However, some APIs require an API key to be used as a username, password, or both. If that's the case, Insert the API key into the respective field noted in the documentation.
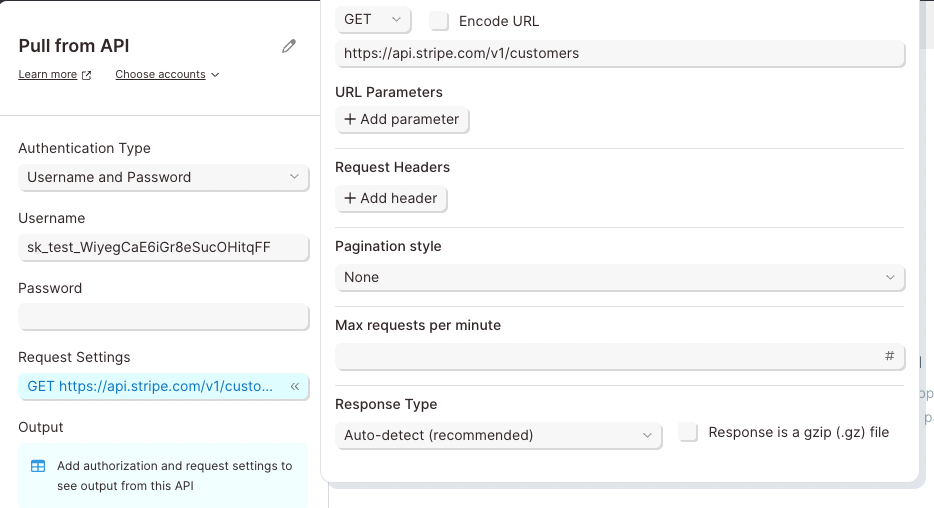
The example below demonstrates how to connect to Stripe's API using the Basic Authorization method.
The Endpoint URL shows a request being made to a resource called customers. The authorization type can be identified as Basic for two reasons:
- The -u indicates Basic Authorization username.
- Most APIs reference the username and password formatted as username:password. There is a colon, which indicates that only a username is required for authentication.
To authorize this API in Parabola, fill in the fields below:
OAuth2.0
This method is an authorization protocol that allows users to sign into a platform using a third-party account. OAuth2.0 allows a user to selectively grant access for various applications they may want to use.
Authenticating via OAuth2.0 does require more time to configure. For more details on how to authorize using this method, read our guide Using OAuth2.0 in Parabola.
Expiring Access Token
Some APIs will require users to generate access tokens that have short expirations. Generally, any token that expires in less than 1 day is considered to be "short-lived" and may be using this type of authentication. This type of authentication in Parabola serves a grouping of related authentication styles that generally follow the same pattern.
One very specific type of authentication that is served by this option in Parabola is called OAuth2.0 Client Credentials. This differs from our standard OAuth2.0 support, which is built specifically for OAuth2.0 Authorization Code. Both Client Credentials and Authorization Code are part of the OAuth2.0 spec, but represent different Grant Types.
Authenticating with the Expiring Access Token option is more complex than options like Bearer Token, but less complex than OAuth2.0. For more details on how to use this option, read our guide Using Expiring Access Tokens in Parabola.
Request Headers
A header is a piece of additional information to be sent with the request to an API. If an API requires additional headers, it is commonly noted in their documentation as -H.
Remember the authentication methods above? Some APIs list the authentication type to be sent as a header. Since Parabola has specific fields for authentication, those headers can typically be ignored.
Taking a look at Webflow's API, they show two headers are required.
The first -H header is linked to a key called Authorization. Parabola takes care of that. It does not need to be added as a header. The second -H header is linked to a key called accept-version. The value of the header is 1.0.0. This likely indicates which version of Webflow's API will be used.
Response JSON
APIs typically to structure data as a nested objects. This means data can exist inside data. To extract that data into separate columns and rows, use the Output section to select a top-level column.
For example, a character can exist as a data object. Inside the result object, additional data is included such as their name, date of birth, and location.
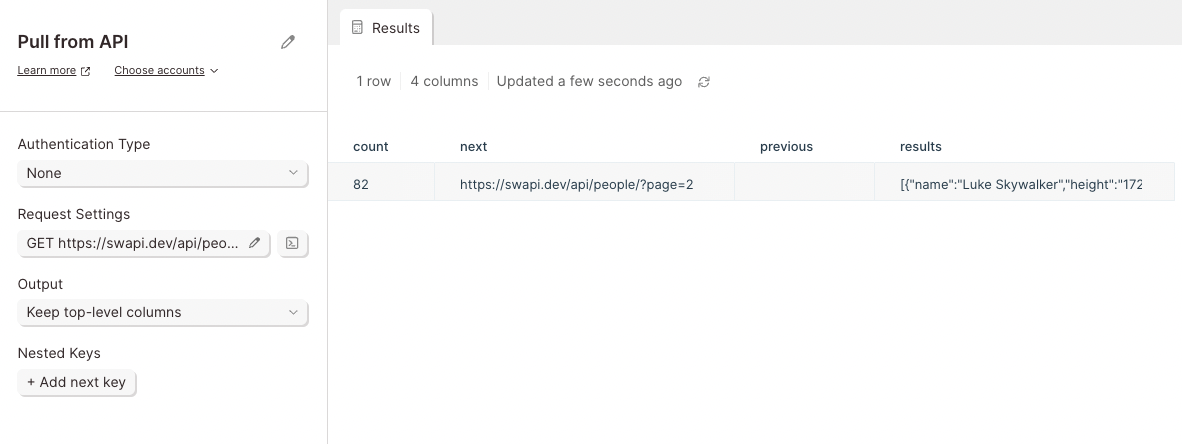
This API shows a data column linked result. To expand all of the data in the results object into neatly displayed columns, select results as the top-level column in the Output section.
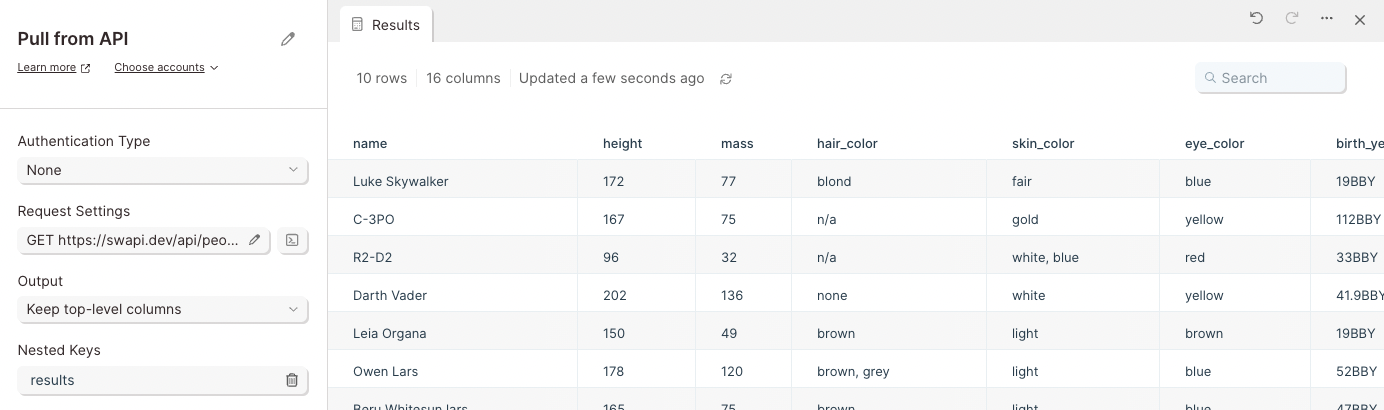
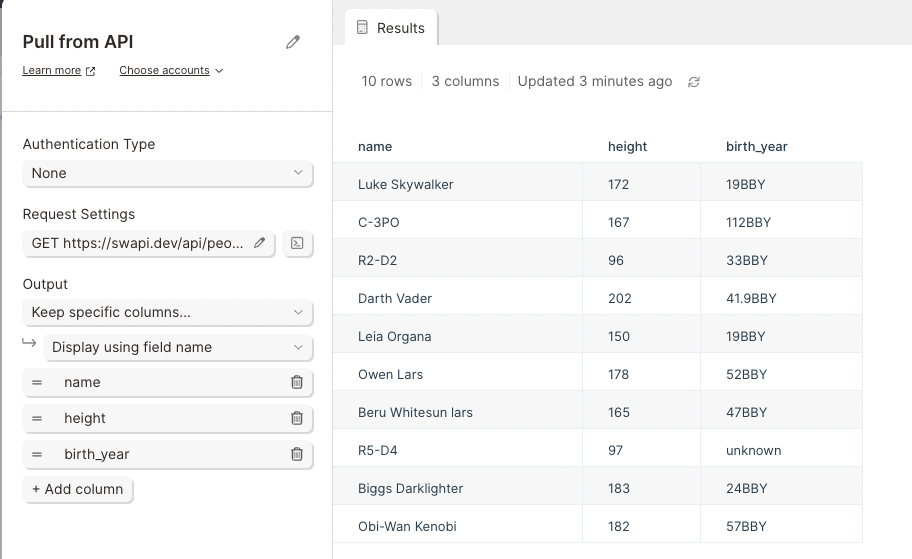
If you only want to expand some of the columns, choose to keep specific columns and select the columns that you want to expand from the dropdown list.
Pagination
APIs return data in pages. This might not be noticeable for small requests, but larger request will not show all results. APIs return 1 page of results. To view the other pages, pagination settings must configured
Each API has different Pagination settings which can be searched in their documentation. The three main types of pagination are Page, Offset and Limit, and Cursor based pagination.
Page Based Pagination
APIs that use Page based pagination make it easy to request more pages. Documentation will refer to a specific parameter key for each request to return additional pages.
Intercom uses this style of pagination. Notice they reference the specific parameter key of page:
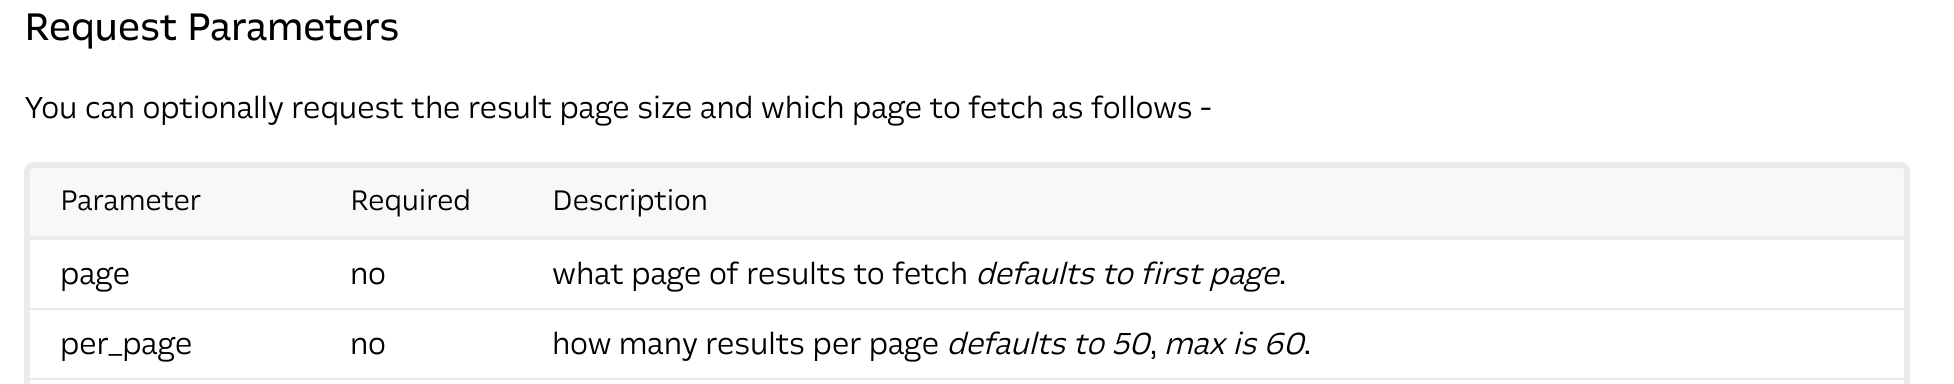
Parabola refers to this parameter as the Pagination Key. To request additional pages from Intercom's API, set the Pagination Key to page.
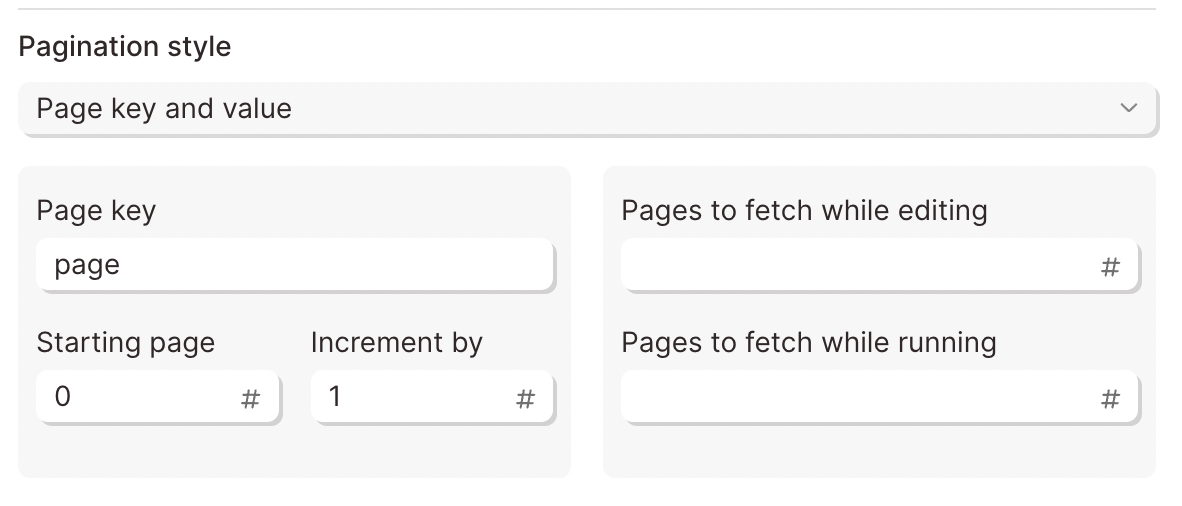
The Starting page is the first page to be requested. Most often, that value will be set to 0. For most pagination settings, 0 is the first page. The Increment by value is the number of pages to advance to. A value of 1 will fetch the next page. A value of 10 will fetch every tenth page.
Offset and Limit Based Pagination
APIs that use Offset and Limit based pagination require each request to limit the amount of items per page. Once that limit is reached, an offset is used to cycle through those pages.
Spotify refers to this type of pagination in their documentation:
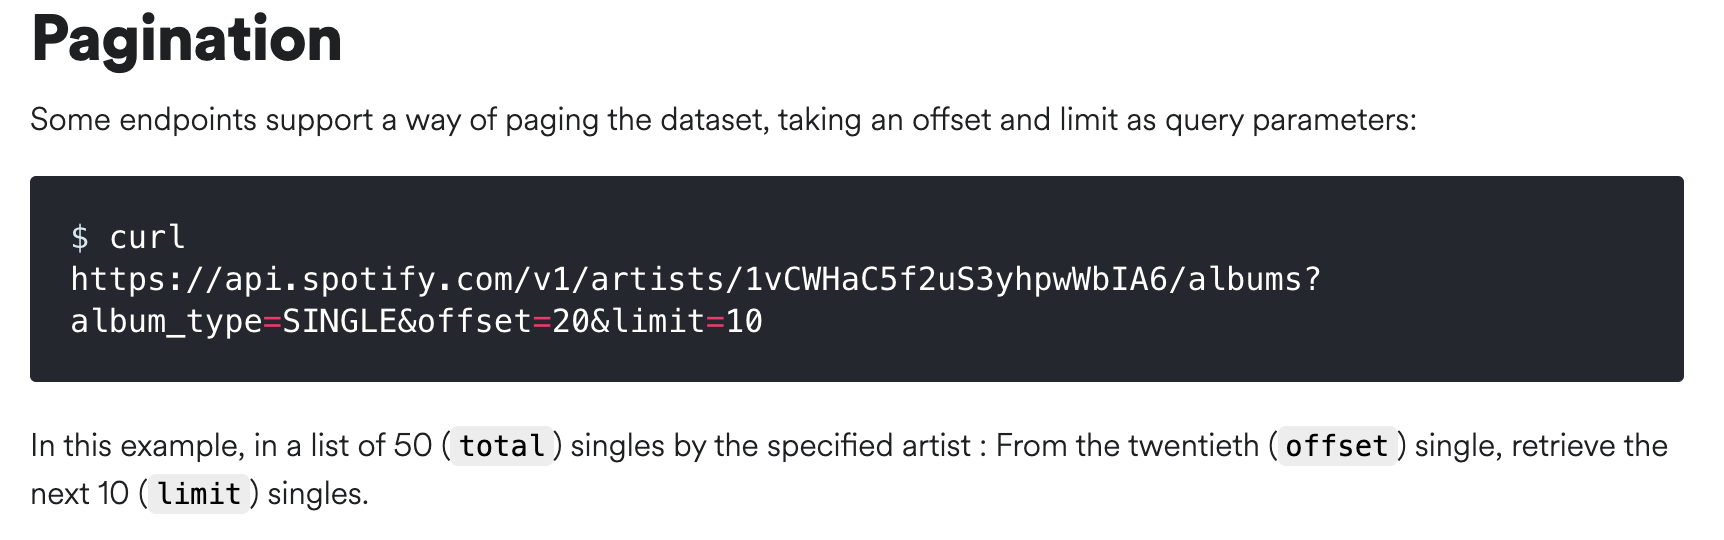
To configure these pagination settings in Parabola, set the Pagination style to offset and limit.
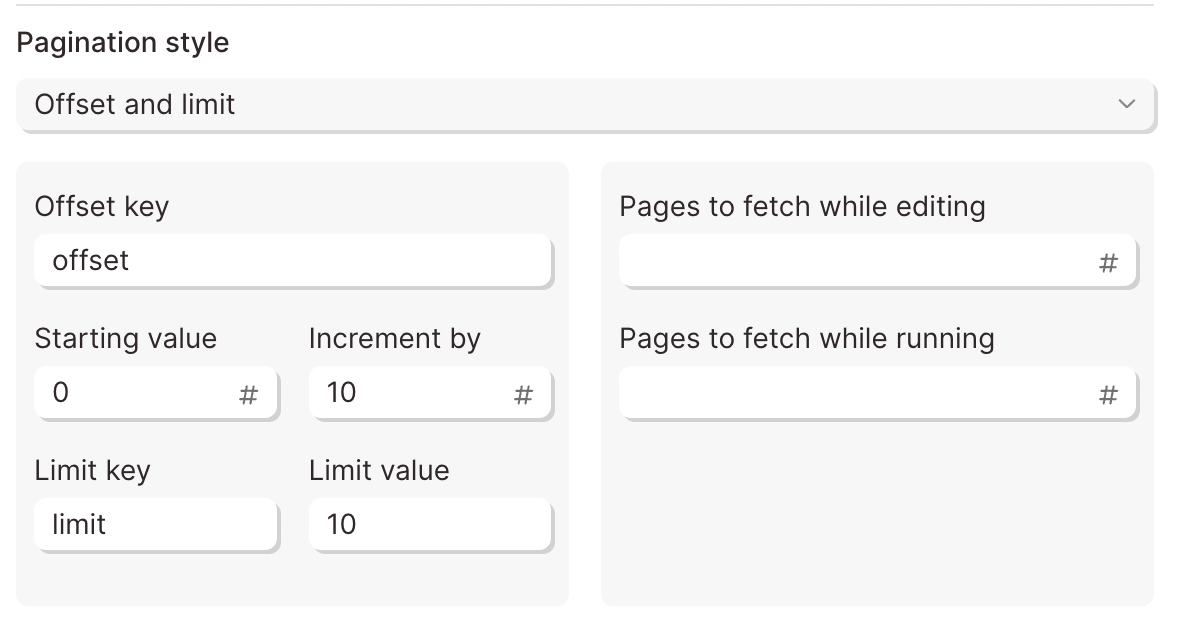
The Starting Value is set to 0 to request the first page. The Increment by value is set to 10. The request will first return page 0 and skip to page 10 .
The Limit Key is set to limit to tell the API to limit the amount of items. The Limit Value is set to 10 to define the number of items to return.
Cursor Based Pagination
Otherwise known as the bookmark of APIs, Cursor based pagination will mark a specific item with a cursor. To return additional pages, the API looks for a specific Cursor Key linked to a unique value or URL.
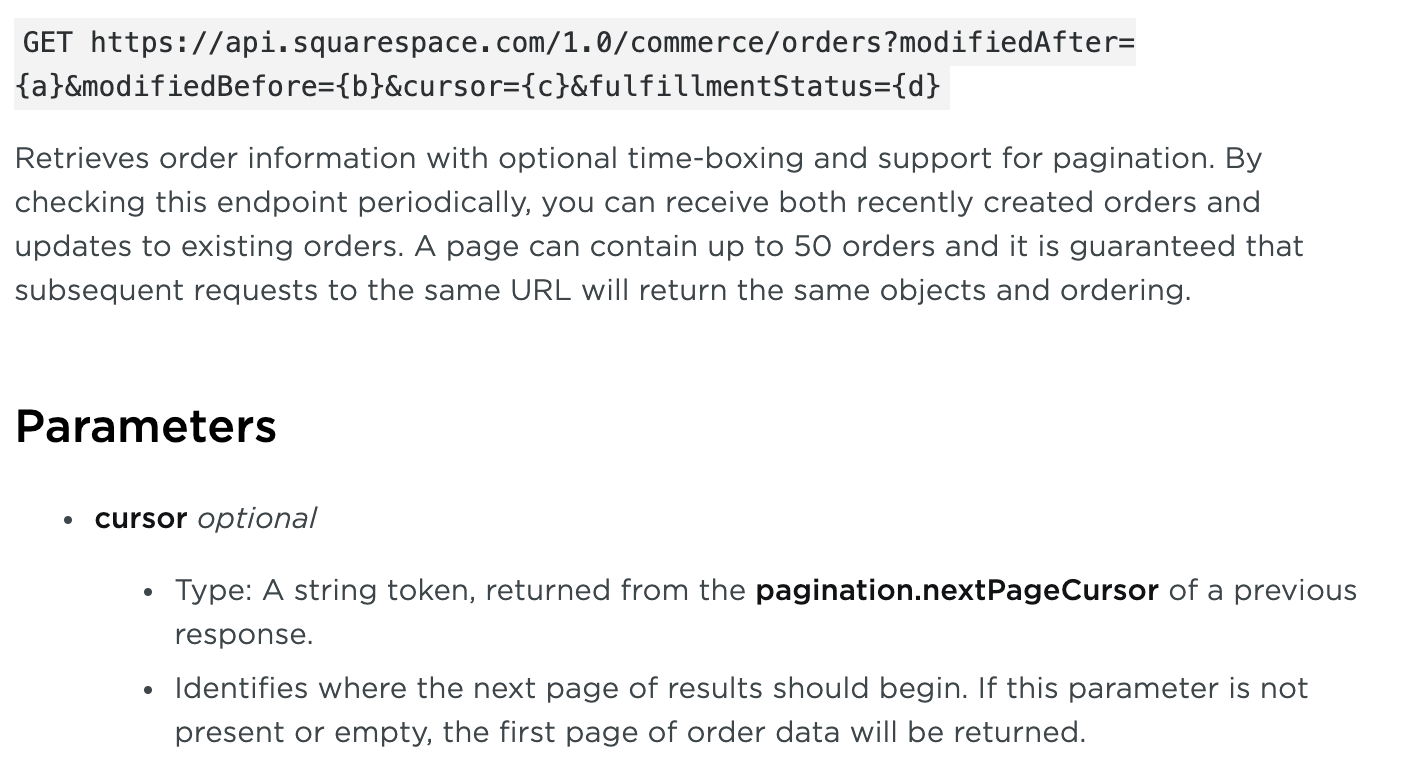
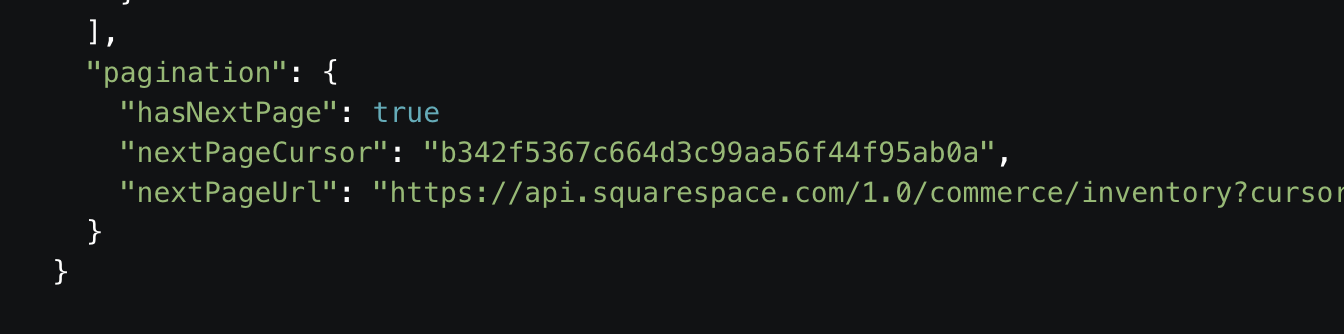
Squarespace uses cursor based pagination. Their documentation states that two Cursor Keys can be used. The first one is called nextPageCursor and has a unique value:
"nextPageCursor": "b342f5367c664d3c99aa56f44f95ab0a"
The second one is called nextPageUrl and has a URL value:
"nextPageUrl": "<https://api.squarespace.com/1.0/commerce/inventory?cursor=b342f5367c664d3c99aa56f44f95ab0a>"
To configure cursor based pagination using Squarespace, use these values in Parabola:

Replace the Cursor path in response with pagination.nextPageURL to use the URL as a value. The API should return the same results.
Rate Limiting
Imagine someone asking thousands of questions all at once. Before the first question can be answered thousands of new questions are coming in. That can become overwhelming.
Servers are no different. Making paginated API calls requires a separate request for each page. To avoid this, APIs have rate limiting rules to protect their servers from being overwhelmed with requests. Parabola can adjust the Max Requests per Minute to avoid rate limiting.
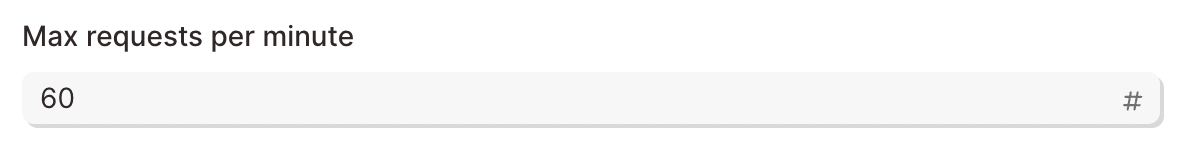
By default, this value is set to 60 requests per minute. That's 1 request per second. The Max Requests per Minute does not set how many requests are made per minute. Instead, it ensures that Parabola will not ask too many questions.
Lowering the requests will avoid rate limiting but will calculate data much slower. Parabola will stop calculating a flow after 60 minutes.
Max Pages to Fetch
To limit the amount of pages to fetch use this field to set the value. Lower values will return data much faster. Higher values will take longer return data.

The default value in Parabola is 5 pages. Just note, this value needs be larger than the expected number of pages to be returned. This prevents any data from being omitted.
If you are pulling a large amount of data and want to limit how much is being pulled in while building, you can set the step to pull a lower number of pages while editing the Flow than while running the Flow.
Note, there is a 1000 page limit when building vs. running flows.
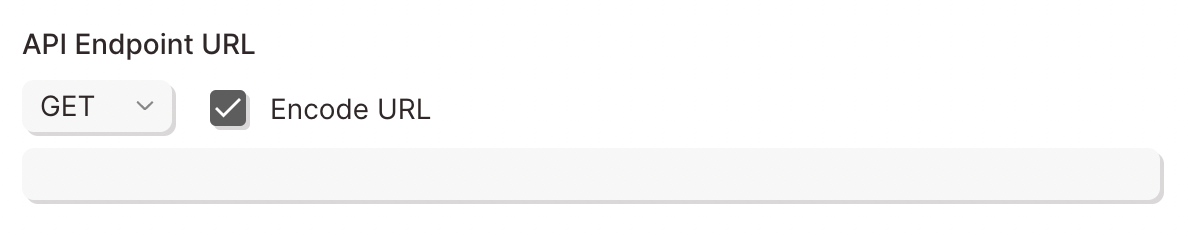
Encode URLs
URLs tend to break when there are special characters like spaces, accented characters, or even other URLs. Most often, this occurs when using {text merge} values to dynamically insert data into a URL.
Check the "Encode URLs" box to prevent the URL from breaking if special characters need to be passed.
Response type
By default, this step will parse the data sent back to Parabola from the API in the format indicated by the content-type header received. Sometimes, APIs will send a content-type that Parabola does not know how to parse. In these cases, adjust this setting from auto-detect to a different setting, to force the step to parse the data in a specific way.
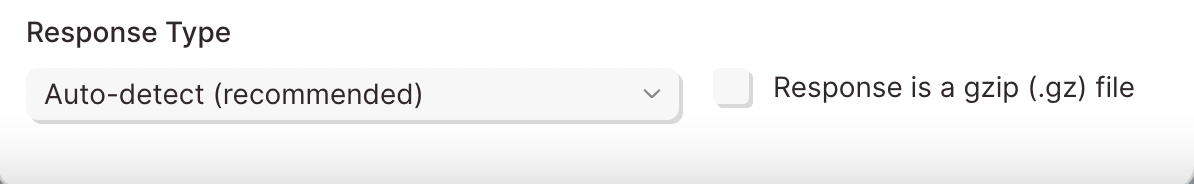
Use the gzip option when the data is returned in a gzip format, but can be unzipped into csv, xml, or JSON data. If you enable gzip parsing, you must also specify a response type option.
Tips and troubleshooting
- Please note that the Pull from API step cannot extract dynamic ranges, such as date. We suggest taking existing data—even just a Start with date & time step—and using an Enrich with API step to create a Flow whose parameters update on each Flow run.
- Parabola will never limit API calls according to a user’s plan—rate limiting is at the discretion of the user, and may be restricted natively by the API.
- We recommend using an API key that is unique to Parabola. This is not strictly necessary, but it helps with troubleshooting and debugging!
Something not right? Check out this guide to learn more troubleshooting common API errors.
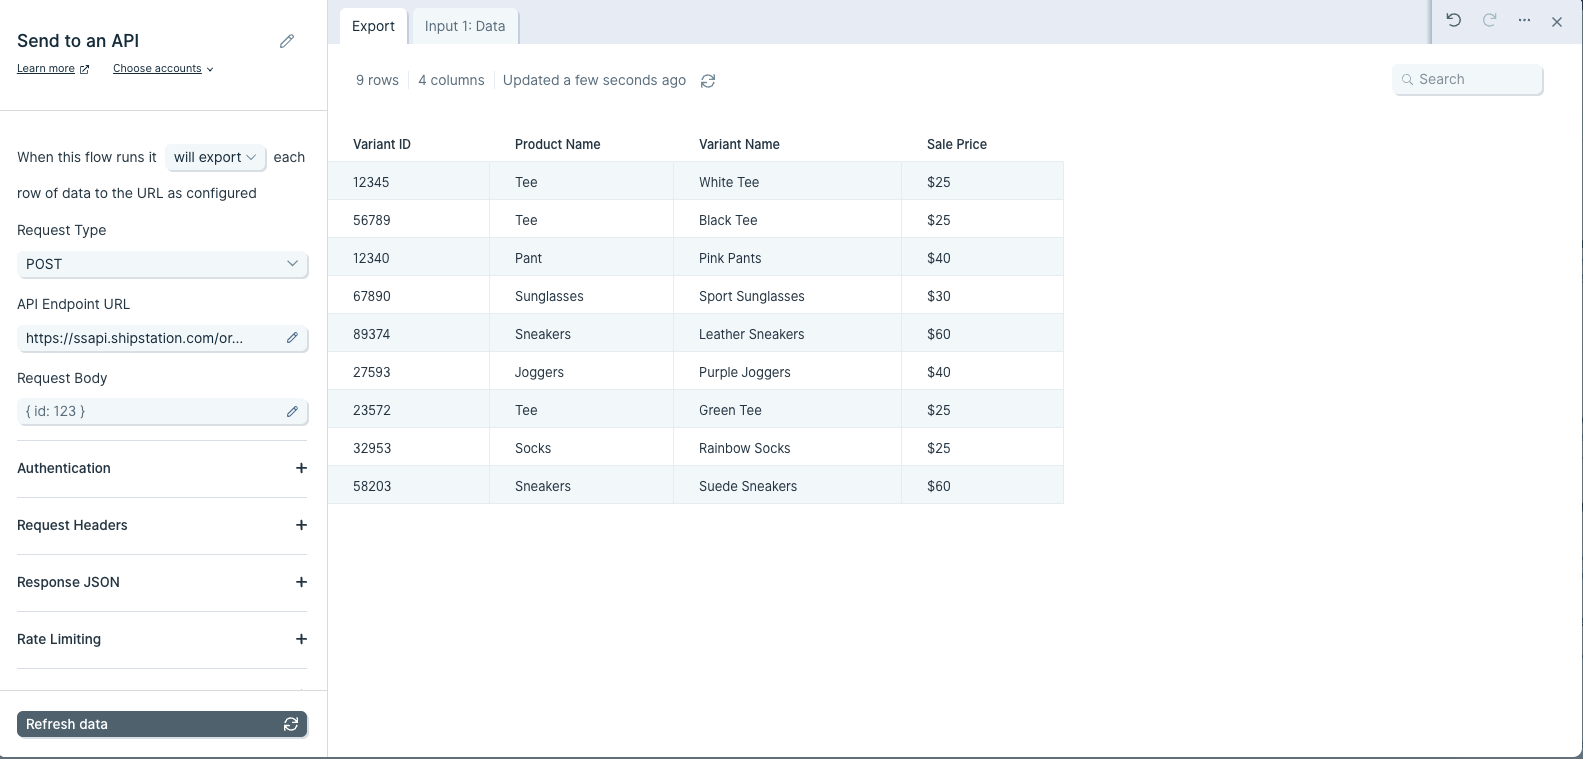
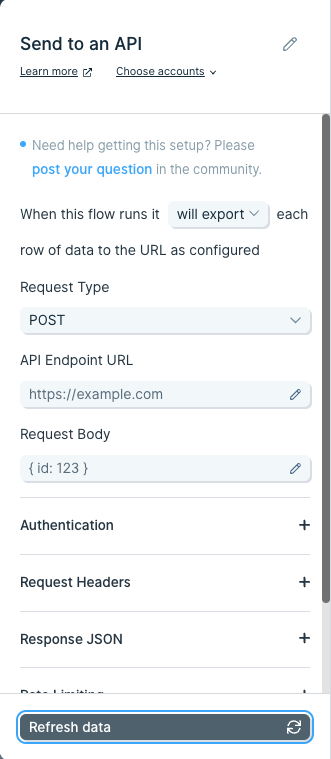
The Send to an API step sends a request to an API to export specific data. Data must be sent through the API using JSON formatted in the body of the request. This step can send data only when a flow is published.
Input
This table shows the product information for new products to be added to a store. It shows common columns like "My Product Title", "My Product Description", "My Product Vendor", "My Product Tags".
These values can be used to create products in bulk via the Send to an API step.
Basic Settings
To use the Send to an API step, a Request Type, API Endpoint URL, and Authentication are required. Some APIs require Custom Headers while other APIs nest their data into a single cell that requires a Top Level Key to format into rows and columns.
Request Type
There are four ways to send data with an API using POST, PUT, PATCH, and DELETE requests. These methods are also known as verbs.

The POST verb is used to create new data. The DELETE verb is used to delete data. The PUT verb is used to update exiting data, and the PATCH verb is used to modify a specific portion of the data.
Hey API, can you POST new data to the server? The new data is in the JSON body.
API Endpoint URL
The API Endpoint URL is the specific location where data will be sent. Each API Endpoint URL belongs to a specific resource. A resource is the broader category to be targeted when sending data.
To create a new product in Shopify, use their Products resource. Their documentation specifies making a POST request to that resource using this Endpoint URL:

Your Shopify store domain will need to prepended to each Endpoint URL:
https://your-shop-name.myshopify.com/admin/api/2020-10/products.json
The request information is sent to the API in the JSON body of the request. The JSON body is a block that outlines the data that will be added.
Body
The body of each request is where data that will be sent through the API is added. The body must be in raw JSON format using key:value pairs. The JSON below shows common attributes of a Shopify product.
{
"product": {
"title": "Baseball Hat",
"body_html": "<strong>Awesome hat!</strong>",
"vendor": "Parabola Cantina",
"product_type": "Hat",
"tags": [
"Unisex",
"Salsa",
"Hat"
]
}
}
Notice the title, body_html, vendor, product_type, and tags can be generated when sending this data to an API.
Since each product exists per row, {text merge} values can be used to dynamically pass the data in the JSON body.
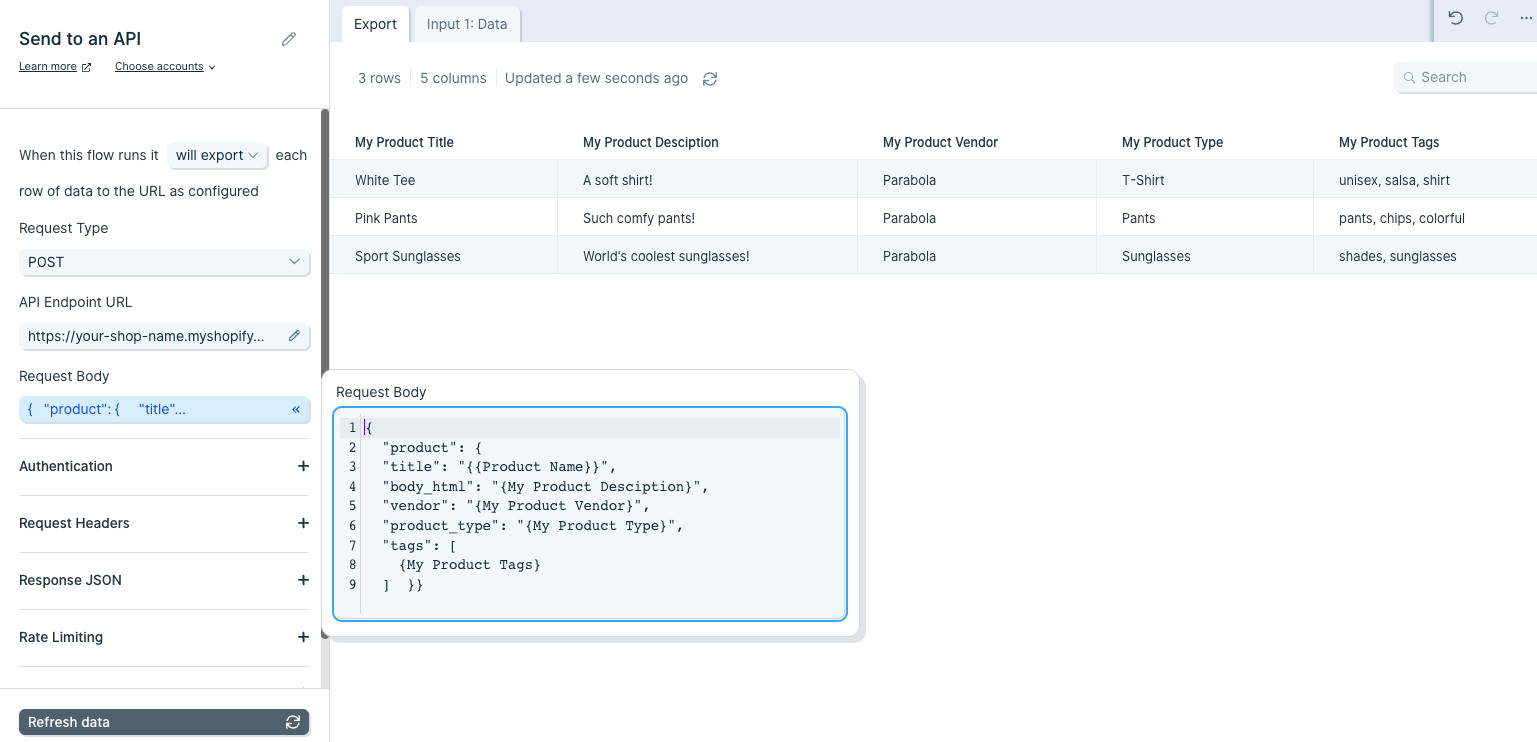
This will create 3 products: White Tee, Pink Pants, and Sport Sunglasses with their respective product attributes.
Authentication
Most APIs require authentication to access their data. This is likely the first part of their documentation. Try searching for the word Authentication in their documentation. Below are the authentication types supported on Parabola:
The most common types of authentication are Bearer Tokens, Username/Password (also referred to as Basic), and OAuth 2.0. Parabola has integrated these authentication types directly into this step.
Bearer Token
This method requires you to send your API Key or API Token as a bearer token. Take a look at this example below:
The part that indicates it is a bearer token is this:
-H "Authorization: Bearer sk_test_WiyegCaE6iGr8eSucOHitqFF"
To add this specific token in Parabola, select Bearer Token from the Authorization menu and add sk_test_WiyegCaE6iGr8eSucOHitqFF as the value.
Username/Password (Basic)
This method is also referred to as Basic Authorization or simply Basic. Most often, the username and password used to sign into the service can be entered here.
However, some APIs require an API key to be used as a username, password, or both. If that's the case, Insert the API key into the respective field noted in the documentation.
The example below demonstrates how to connect to Stripe's API using the Basic Authorization method.
The Endpoint URL shows a DELETE request being made to a resource called customers. The authorization type can be identified as Basic for two reasons:
- The -u indicates Basic Authorizationusername.
- Most APIs reference the username and password formatted as username:password. There is a colon : . This indicates that only a username is required for authentication.
To delete this customer using Parabola, fill in the fields below:

OAuth2.0
This method is an authorization protocol that allows users to sign into a platform using a third-party account. OAuth2.0 allows a user to selectively grant access for various applications they may want to use.
Authenticating via OAuth2.0 does require more time to configure. For more details on how to authorize using this method, read our guide Using OAuth2.0 in Parabola.
Expiring Access Token
Some APIs will require users to generate access tokens that have short expirations. Generally, any token that expires in less than 1 day is considered to be "short-lived" and may be using this type of authentication. This type of authentication in Parabola serves a grouping of related authentication styles that generally follow the same pattern.
One very specific type of authentication that is served by this option in Parabola is called OAuth2.0 Client Credentials. This differs from our standard OAuth2.0 support, which is built specifically for OAuth2.0 Authorization Code. Both Client Credentials and Authorization Code are part of the OAuth2.0 spec, but represent different Grant Types.
Authenticating with the Expiring Access Token option is more complex than options like Bearer Token, but less complex than OAuth2.0. For more details on how to use this option, read our guide Using Expiring Access Tokens in Parabola.
Custom Headers
A header is a piece of additional information to be sent with the request to an API. If an API requires additional headers, it is commonly noted in their documentation as -H.
Remember the authentication methods above? Some APIs list the authentication type to be sent as a header. Since Parabola has specific fields for authentication, those headers can typically be ignored.
Taking a look at Webflow's API, they show two headers are required.
The first -H header is linked to a key called Authorization. Parabola takes care of that. It does not need to be added as a header. The second -H header is linked to a key called accept-version. The value of the header is 1.0.0. This likely indicates which version of Webflow's API will be used.
Advanced Settings
Encode URLs
URLs tend to break when there are special characters like spaces, accented characters, or even other URLs. Most often, this occurs when using {text merge} values to dynamically insert data into a URL.
Check the "Encode URLs" box to prevent the URL from breaking if special characters need to be passed.

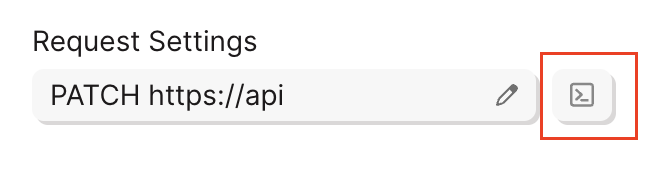
See sent request
If you woud like to see the request that was sent to the API during the Flow run, you can dothis from the API step. To do this, click the square button next to the Request Settings section in the step to see more detailed information.
Reading API Errors
Check out this guide to learn more troubleshooting common API errors.
Use the Enrich with API step to make API requests using a list of data, enriching each row with data from an external API endpoint.
Input/output
Our input data has two columns: "data.id" and "data.employee_name".
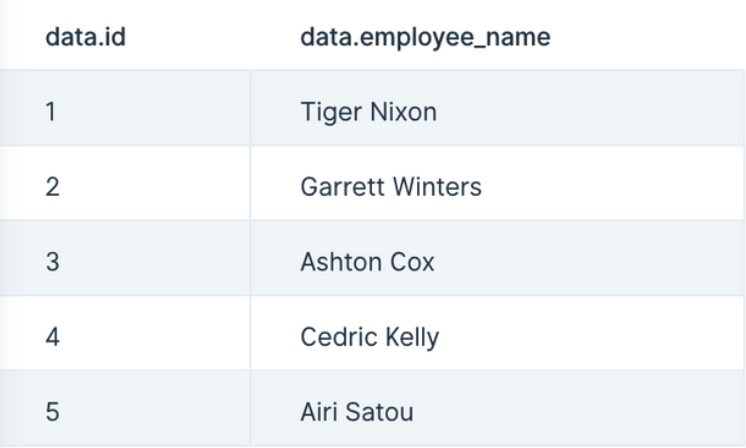
Our output data, after using this step, has three new columns appended to it: "api.status", "api.data.id", and "api.data.employee_name". This data was appended to each row that made the call to the API.

Custom settings
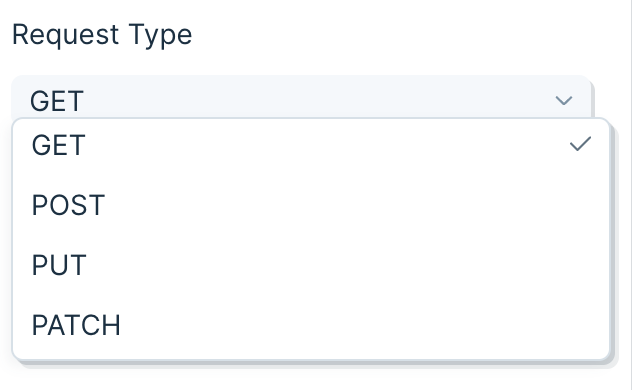
First, decide if your data needs a GET or POST operation, or the less common PUT or PATCH, and select it in the Type dropdown. A GET operation is the most common way to request data from an API. A POST is another way to request data, though it is more commonly used to make changes, like adding a new user to a table. PUT and PATCH make updates to data, and sometimes return a new value that can be useful.
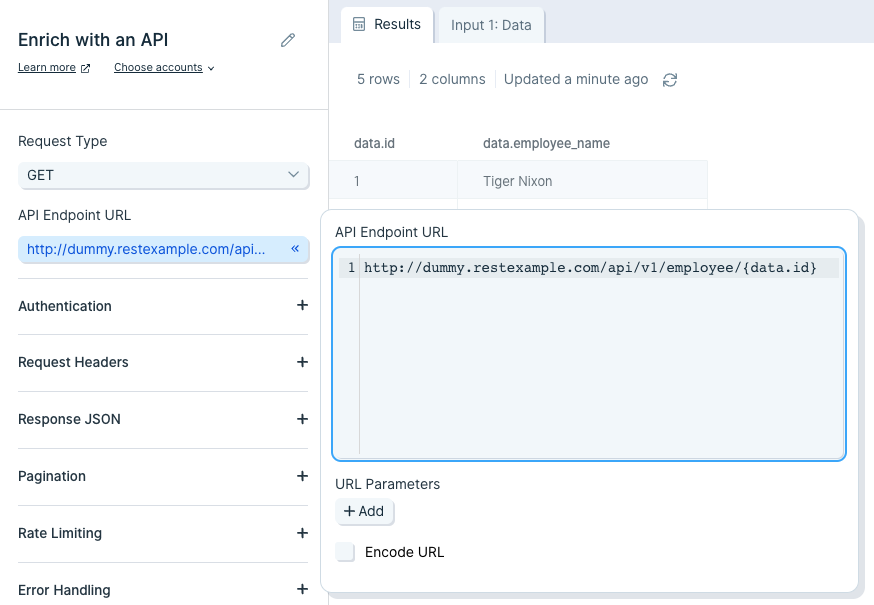
Insert your API endpoint URL in the text field.
Sending a body in your API request
- A GET cannot send a body in its request. A POST can send a Body in its request. In Parabola, the Body of the request will always be sent in JSON.
- Simple JSON looks like this:
{ "key1":"value1", "key2":"value2", "key3":"value3" }
Using merge tags
- Merge tags can be added to the API Endpoint URL or the Body of a request. For example, if you have a column named "data.id", you could use it in the API Endpoint URL by including {data.id} in it. Your URL would look like this:
http://third-party-api-goes-here.com/users/{data.id}
- Similarly, you can add merge tags to the body.
{
"key1": "{data.id}",
"key2": "{data.employee_name}",
"key3": "{Type}"
}
- For this GET example, your API endpoint URL will require an ID or some sort of unique identifier required by the API to match your data request with the data available. Append that ID column to your API endpoint URL. In this case, we use {data.id}.
- Important Note: If the column referenced in the API endpoint URL is named "api", the enrichment step will remove the column after the calculation. Use the Edit Columns step to change the column name to anything besides "api", such as "api.id".
Authentication
Most APIs require authentication to access their data. This is likely the first part of their documentation. Try searching for the word "authentication" in their documentation.
Here are the authentication types available in Parabola:
The most common types of authentication are 'Bearer Token', 'Username/Password' (also referred to as Basic), and 'OAuth2.0'. Parabola has integrated these authentication types directly into this step.
Bearer Token
This method requires you to send your API key or API token as a bearer token. Take a look at this example below:
The part that indicates it is a bearer token is this:
-H "Authorization: Bearer sk_test_WiyegCaE6iGr8eSucOHitqFF"
To add this specific token in Parabola, select 'Bearer Token' from the 'Authorization' menu and add "sk_test_WiyegCaE6iGr8eSucOHitqFF" as the value.
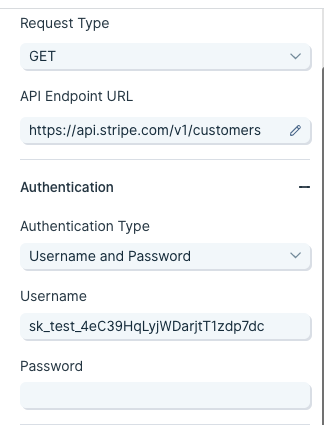
Username and Password (Basic)
This method is also referred to as "basic authorization" or simply "basic". Most often, the username and password used to sign into the service can be entered here.
However, some APIs require an API key to be used as a username, password, or both. If that's the case, insert the API key into the respective field noted in the documentation.
The example below demonstrates how to connect to Stripe's API using the basic authorization method.
The endpoint URL shows a request being made to a resource called customers. The authorization type can be identified as basic for two reasons:
- The -u indicates a username.
- Most APIs reference the username and password formatted as username:password. Here, there is a colon with no string following, indicating that only a username is required for authentication.
To authorize this API in Parabola, fill in the fields below:
OAuth2.0
This method is an authorization protocol that allows users to sign into a platform using a third-party account. OAuth2.0 allows a user to selectively grant access for various applications they may want to use.
Authenticating via OAuth2.0 does require more time to configure. For more details on how to authorize using this method, read our guide Using OAuth2.0 in Parabola.
Expiring Access Token
Some APIs will require users to generate access tokens that have short expirations. Generally, any token that expires in less than 1 day is considered to be "short-lived" and may be using this type of authentication. This type of authentication in Parabola serves a grouping of related authentication styles that generally follow the same pattern.
One very specific type of authentication that is served by this option in Parabola is called "OAuth2.0 Client Credentials". This differs from our standard OAuth2.0 support, which is built specifically for "OAuth2.0 Authorization Code". Both methods are part of the OAuth2.0 spec, but represent different grant types.
Authenticating with an expiring access token is more complex than using a bearer token, but less complex than OAuth2.0. For more details on how to use this option, read our guide Using Expiring Access Tokens in Parabola.
How to work with errors when you expect them in your API calls
Enabling Error Handling
In the Enrich with an API step and the Send to an API step, enable Error Handling to allow your API steps to pass through data even if one or more API requests fail. Modifying this setting will add new error handling columns to your dataset reporting on the status of those API calls
By default, this section will show that the step will stop running when 1 row fails. This has always been the standard behavior of our API steps. Remember, each row of data is a separate API call. With this default setting enabled, you will never see any error handling columns.

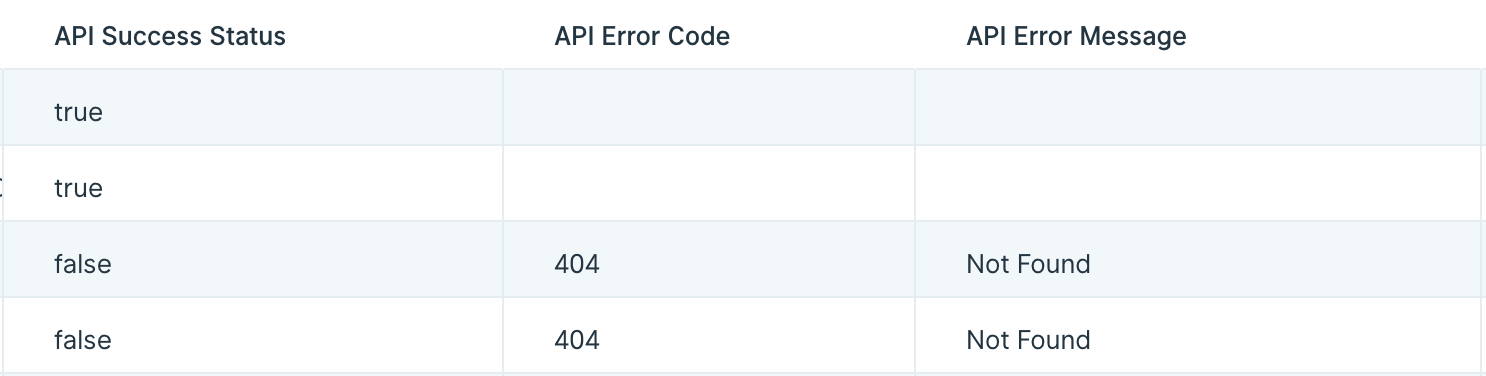
Update that setting, and you will see that new columns are set to be added to your data. These new columns are:
- API Success Status
- API Error Code
- API Error Message
API Success Status will print out a true or false value to show if that row's API call succeeded or failed.
API Error Code will have an error code for that row if the API call failed, and will be blank if the API call succeeded.
API Error Message will display the error message associated with any API call that failed, if the API did in fact send us back a message.
With the exception of the default settings, these columns will still be included even if every row succeeded. In that case, you will see the API Success Status column with all true values, and the other two columns as all blank values.
Using the error handling settings
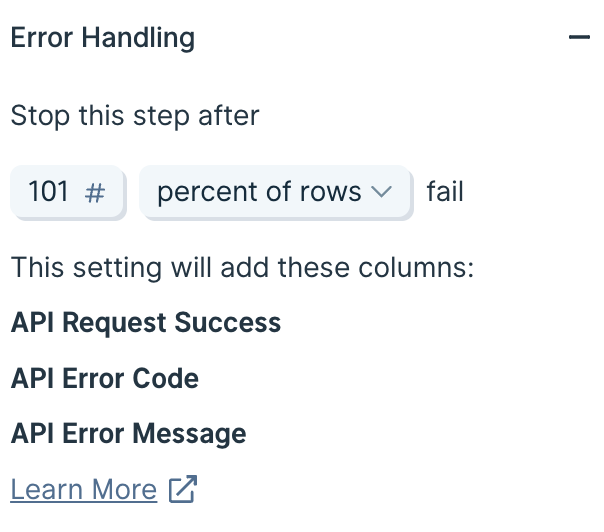
It is smart to set a threshold where the step will still fail if enough rows have failed. Usually, if enough rows fail to make successful API calls, there may be a problem with your step settings, the data you are merging into those calls, or the API itself. In these cases, it is a good idea to ensure that the step can fully stop without needing to run through every row.
Choose to stop running this step if either a static number of rows fail, or if a percentage of rows fail.
You must choose a number greater than 0.
When using a percentage, Parabola will always round up to the next row if the percentage of the current set of rows results in a partial row.
Prevent the step from ever stopping
In rare cases, you may want to ensure that your step never stops running, even if every row results in a failed API call. In that case, set your error handling threshold to any number greater than 100%, such as 101% or 200%.
What to do with these new error handling columns
Once you have enabled this setting, use these new columns to create a branch to deal with errors. The most common use case will be to use a Filter Rows step to filter down to just the rows that have failed, and then send those to a Google Sheet for someone to check on and make adjustments accordingly.
Error handling in the Live flow Run logs
If you have a flow that is utilizing these error handling columns, the run logs on the live view of the flow will not indicate if any rows were recorded as failed. The run logs will only show a failure if the step was forced to stop by exceeding the threshold of acceptable errors. It is highly advisable that you set up your flow to create a CSV or a Google Sheet of these errors so that you have a record of them from each run.
Integration:
BigQuery
How to authenticate
BigQuery uses Google authentication to authorize the connection.
- In your Parabola flow, add a Pull from BigQuery step.
- Open one of the Pull from BigQuery steps and click Authorize and sign in to your Google account, giving Parabola the requested permissions.
- Each Pull from BigQuery step can re-use your authentication; make sure each step is configured to use your credentials.
Parabola will securely store your credentials and use them to authenticate each request to BigQuery.
Required IAM Permissions in Google
projects.list:
- bigquery.projects.list (or resourcemanager.projects.list)
- Allows listing projects the user can access
jobs.query:
- bigquery.jobs.create — create/run query jobs
- bigquery.tables.getData — read data from the tables referenced in the query
- Note: Users need table-level access for each table they query
jobs.getQueryResults:
- bigquery.jobs.get — retrieve query job results
Recommended IAM Roles
- roles/bigquery.user — includes bigquery.jobs.create and bigquery.jobs.get
- roles/bigquery.jobUser — includes bigquery.jobs.create and bigquery.jobs.get (more limited than bigquery.user)
- roles/viewer or roles/browser — includes resourcemanager.projects.list (for listing projects)
Plus dataset/table access:
- roles/bigquery.dataViewer — read access to specific datasets/tables
- Or grant bigquery.tables.getData on the specific tables/datasets they need to query
Minimum setup: Assign roles/bigquery.user (or roles/bigquery.jobUser) plus roles/viewer (for project listing), and ensure users have read access to the datasets/tables they query (via roles/bigquery.dataViewer or dataset-level permissions).
Available data
Using the BigQuery integration in Parabola, you can run custom SQL queries against any dataset and table in your BigQuery projects. Write Standard SQL queries to filter, aggregate, join, and transform data from your BigQuery tables—try using the chat interface on the left-hand side of your canvas to help write your SQL queries.
Here’s how to use the available connections to run a SQL query:
- Use the List Projects step if you need to find a BigQuery project ID. Increase the "Total pages limit" value if you need to see more projects.
- Use the Send Query (Run a SQL query) and Pull results from BigQuery (Poll for query results) steps to submit a query and get all results. The Custom transform will create a table of results from your query results.
The integration supports full SQL query capabilities, allowing you to leverage BigQuery's powerful analytics engine to prepare data exactly as needed before pulling it into Parabola.
Common use cases
- Automate recurring reports daily or weekly, then export results to Google Sheets, email them to stakeholders, or push them to other systems.
- Combine BigQuery analytics data with operational data from systems like Shopify, NetSuite, or your warehouse management system to create unified views and spot discrepancies.
- Query BigQuery tables on a schedule to check for data freshness, validate row counts, and flag anomalies—then send alerts via Slack or email when issues are detected.
- Pull summarized data from BigQuery and combine it with real-time metrics from other sources to create comprehensive dashboards that update automatically.
- Run complex analytical queries in BigQuery, pull the results into Parabola, and use them to trigger downstream workflows like updating inventory systems or sending targeted communications.
Tips for using Parabola with BigQuery
- Schedule your flows strategically to run on the cadence your team needs: hourly for real-time dashboards, daily for standard reporting, or weekly for executive summaries.
- Write efficient SQL queries to filter, aggregate, and transform data in your SQL query before pulling it into Parabola. This reduces data transfer, speeds up your flow, and optimizes BigQuery costs.
- Leverage parameterized queries: When building dynamic queries based on dates or other variables, use BigQuery's parameterized query features for better performance and security.
- Handle pagination for large results: For queries returning many rows, use the pagination settings in Parabola to efficiently retrieve all results without timeout issues.
- Validate your BigQuery data with steps in Parabola that flag unexpected values, missing data, or anomalies before the data flows to downstream systems.
- Document your SQL logic with cards in Parabola to explain what each query does and why specific filters or transformations are applied, making it easier for teammates to maintain your flows.
By connecting BigQuery with Parabola, you transform your data warehouse into an active part of your operational workflows—automating reports, reconciliations, and data-driven decisions without manual exports or custom code.
Integration:
Box
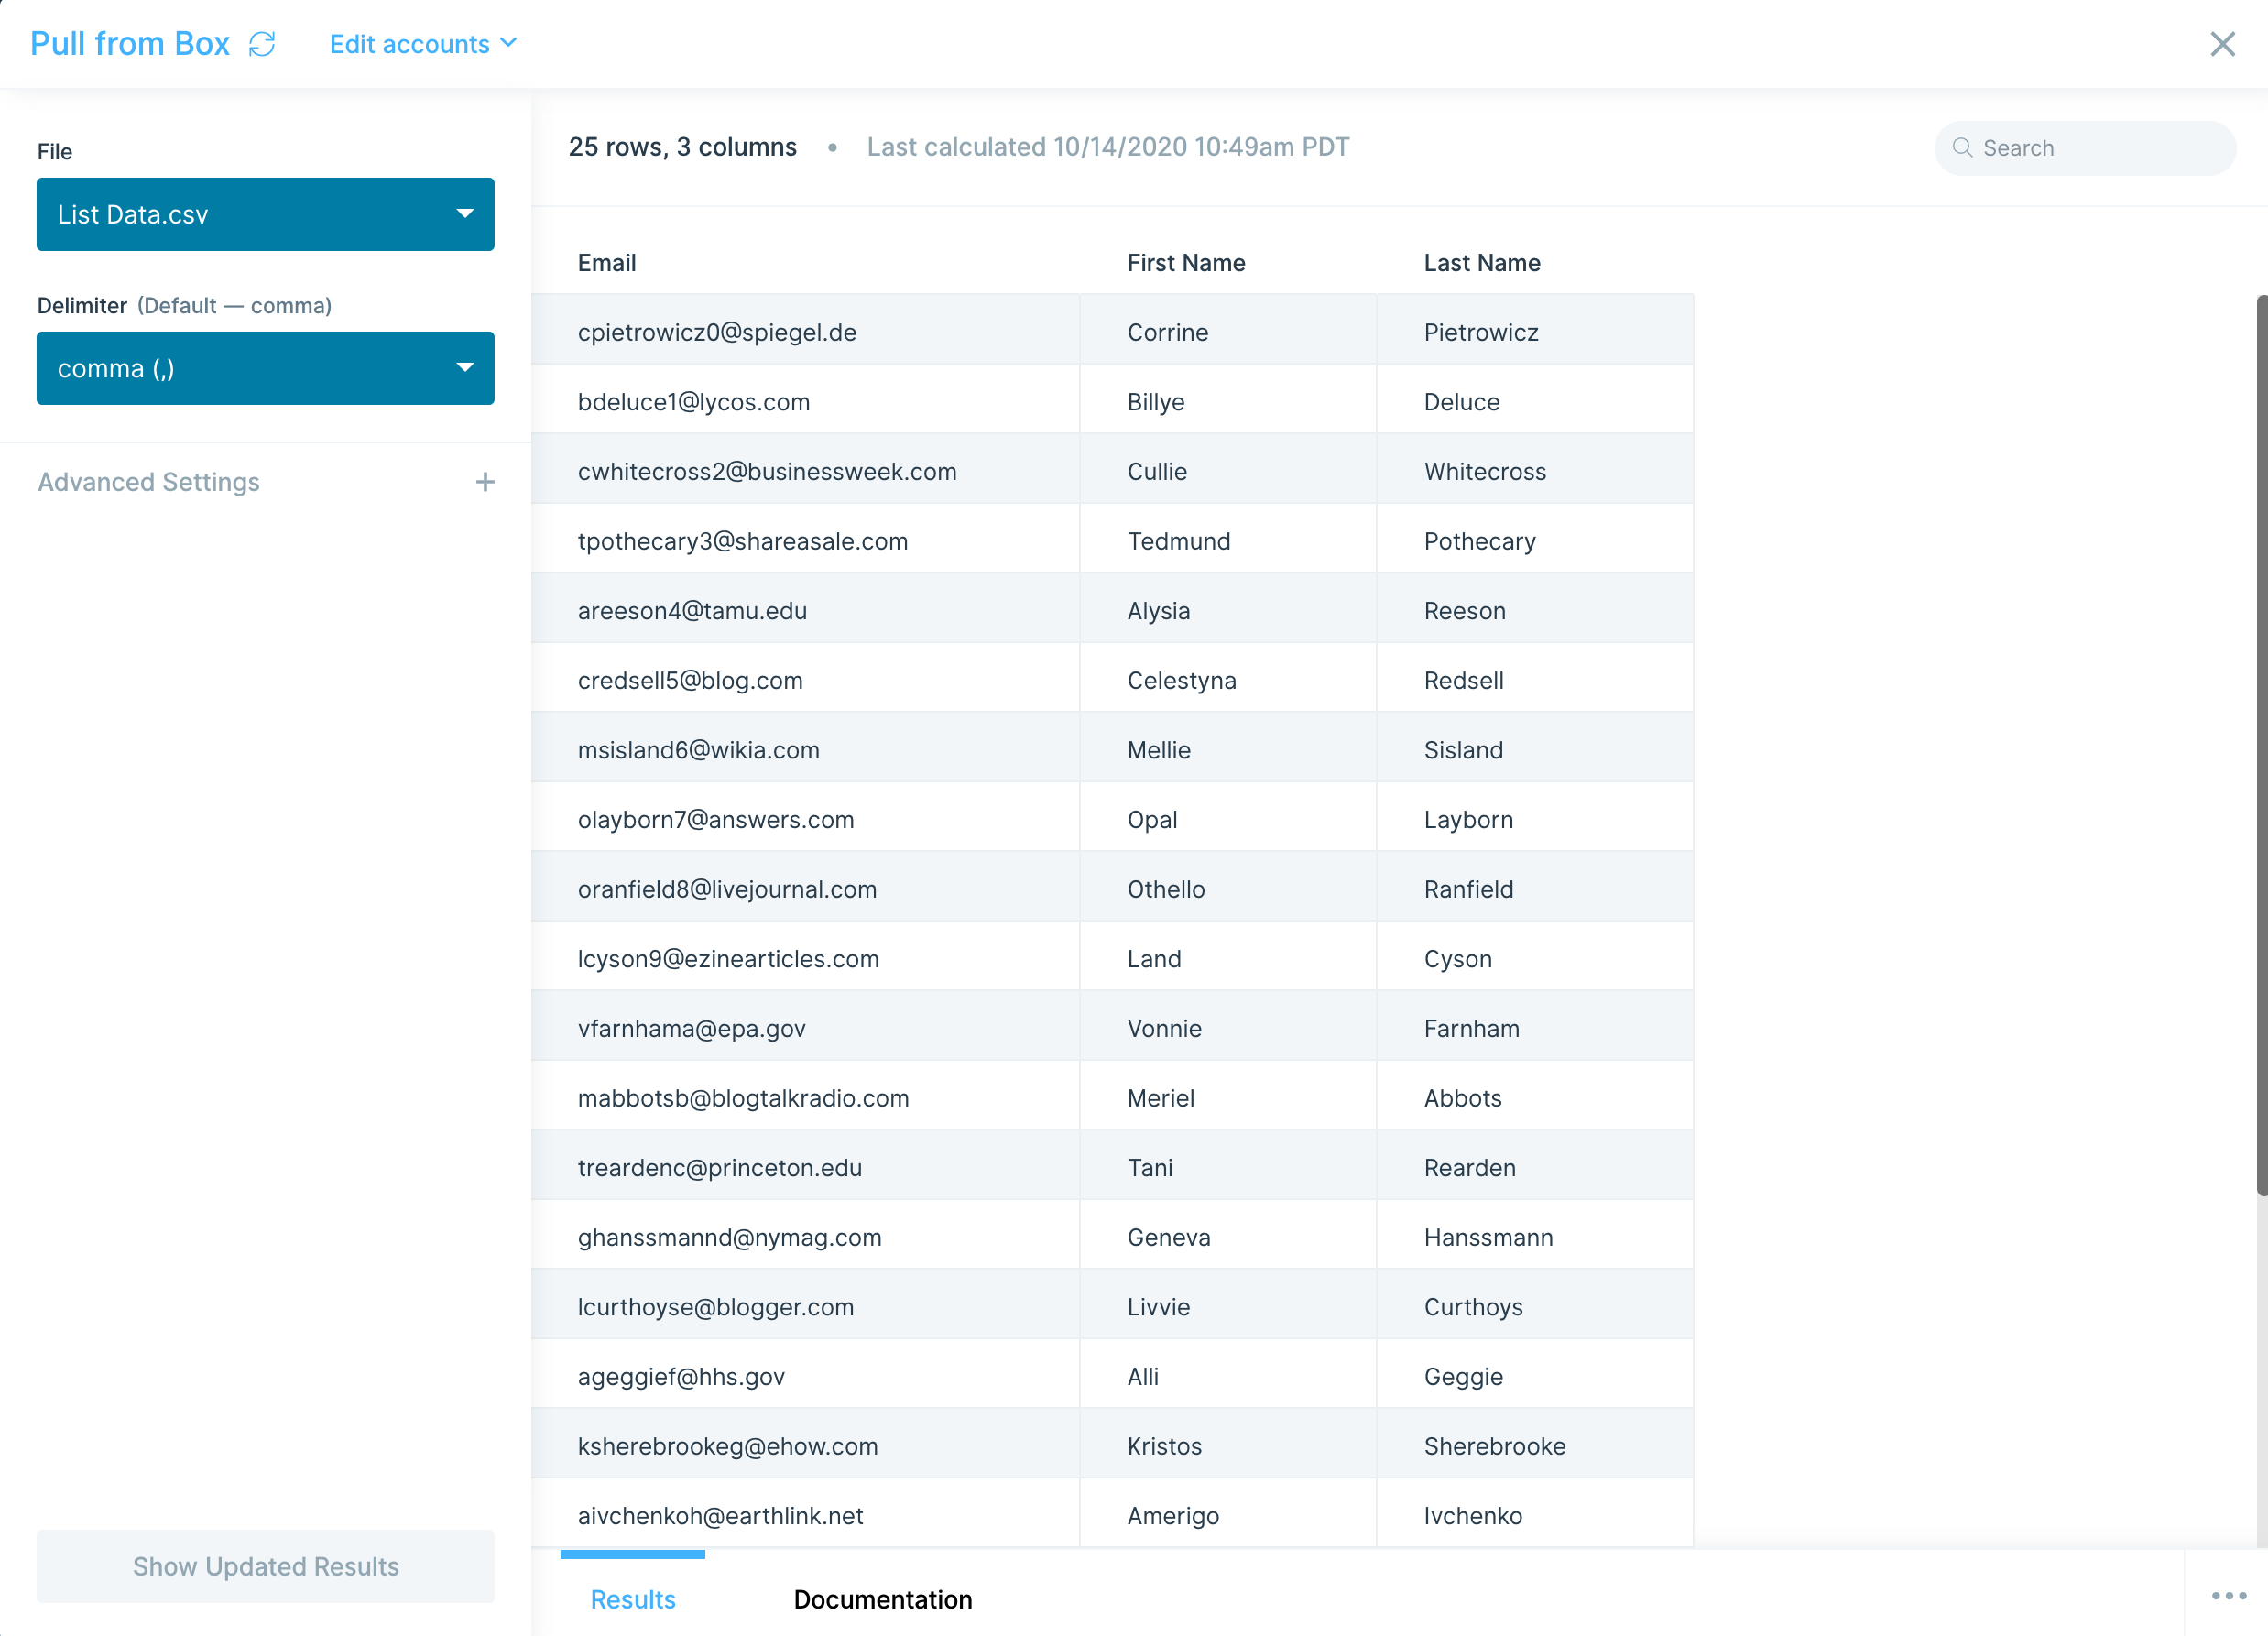
The Pull from Box step gives you the ability to pull a CSV or Excel file from your Box account.
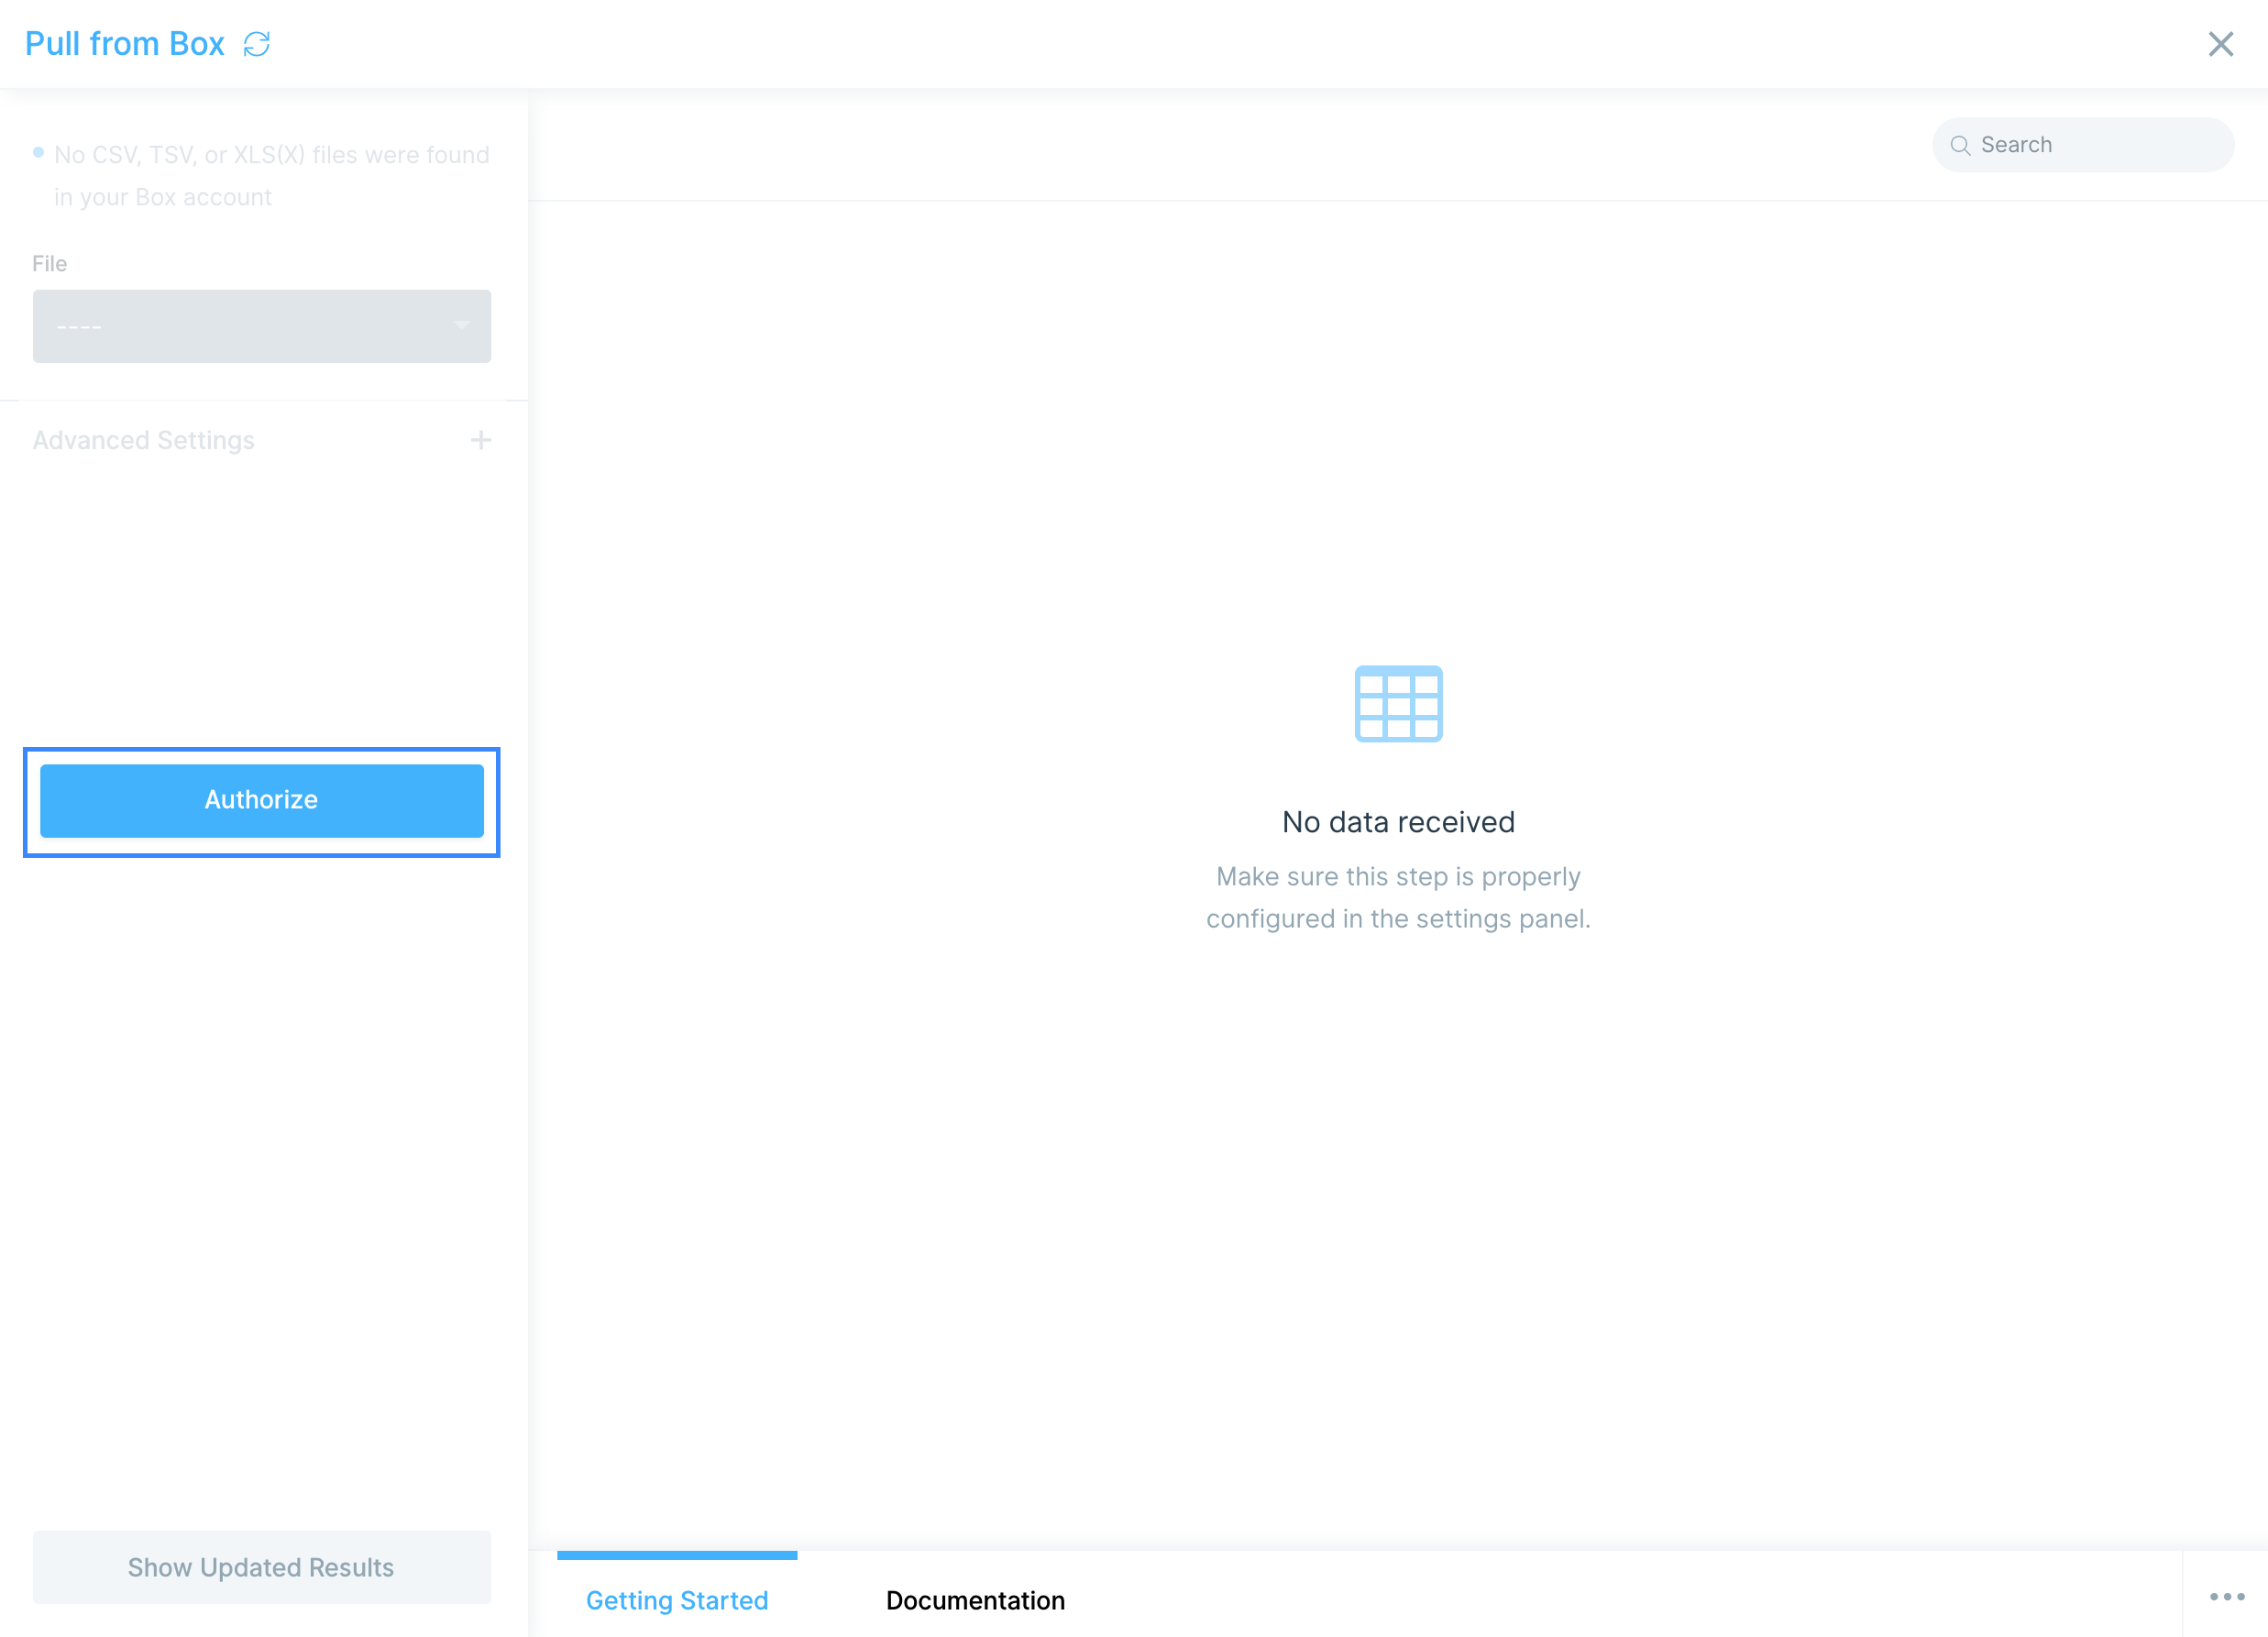
Connect your Box account
To connect your Box account to Parabola, select Authorize and follow the prompt to grant Parabola access to your Box files.
Custom settings
Once you have authorized your Box account, select your file in the File dropdown.
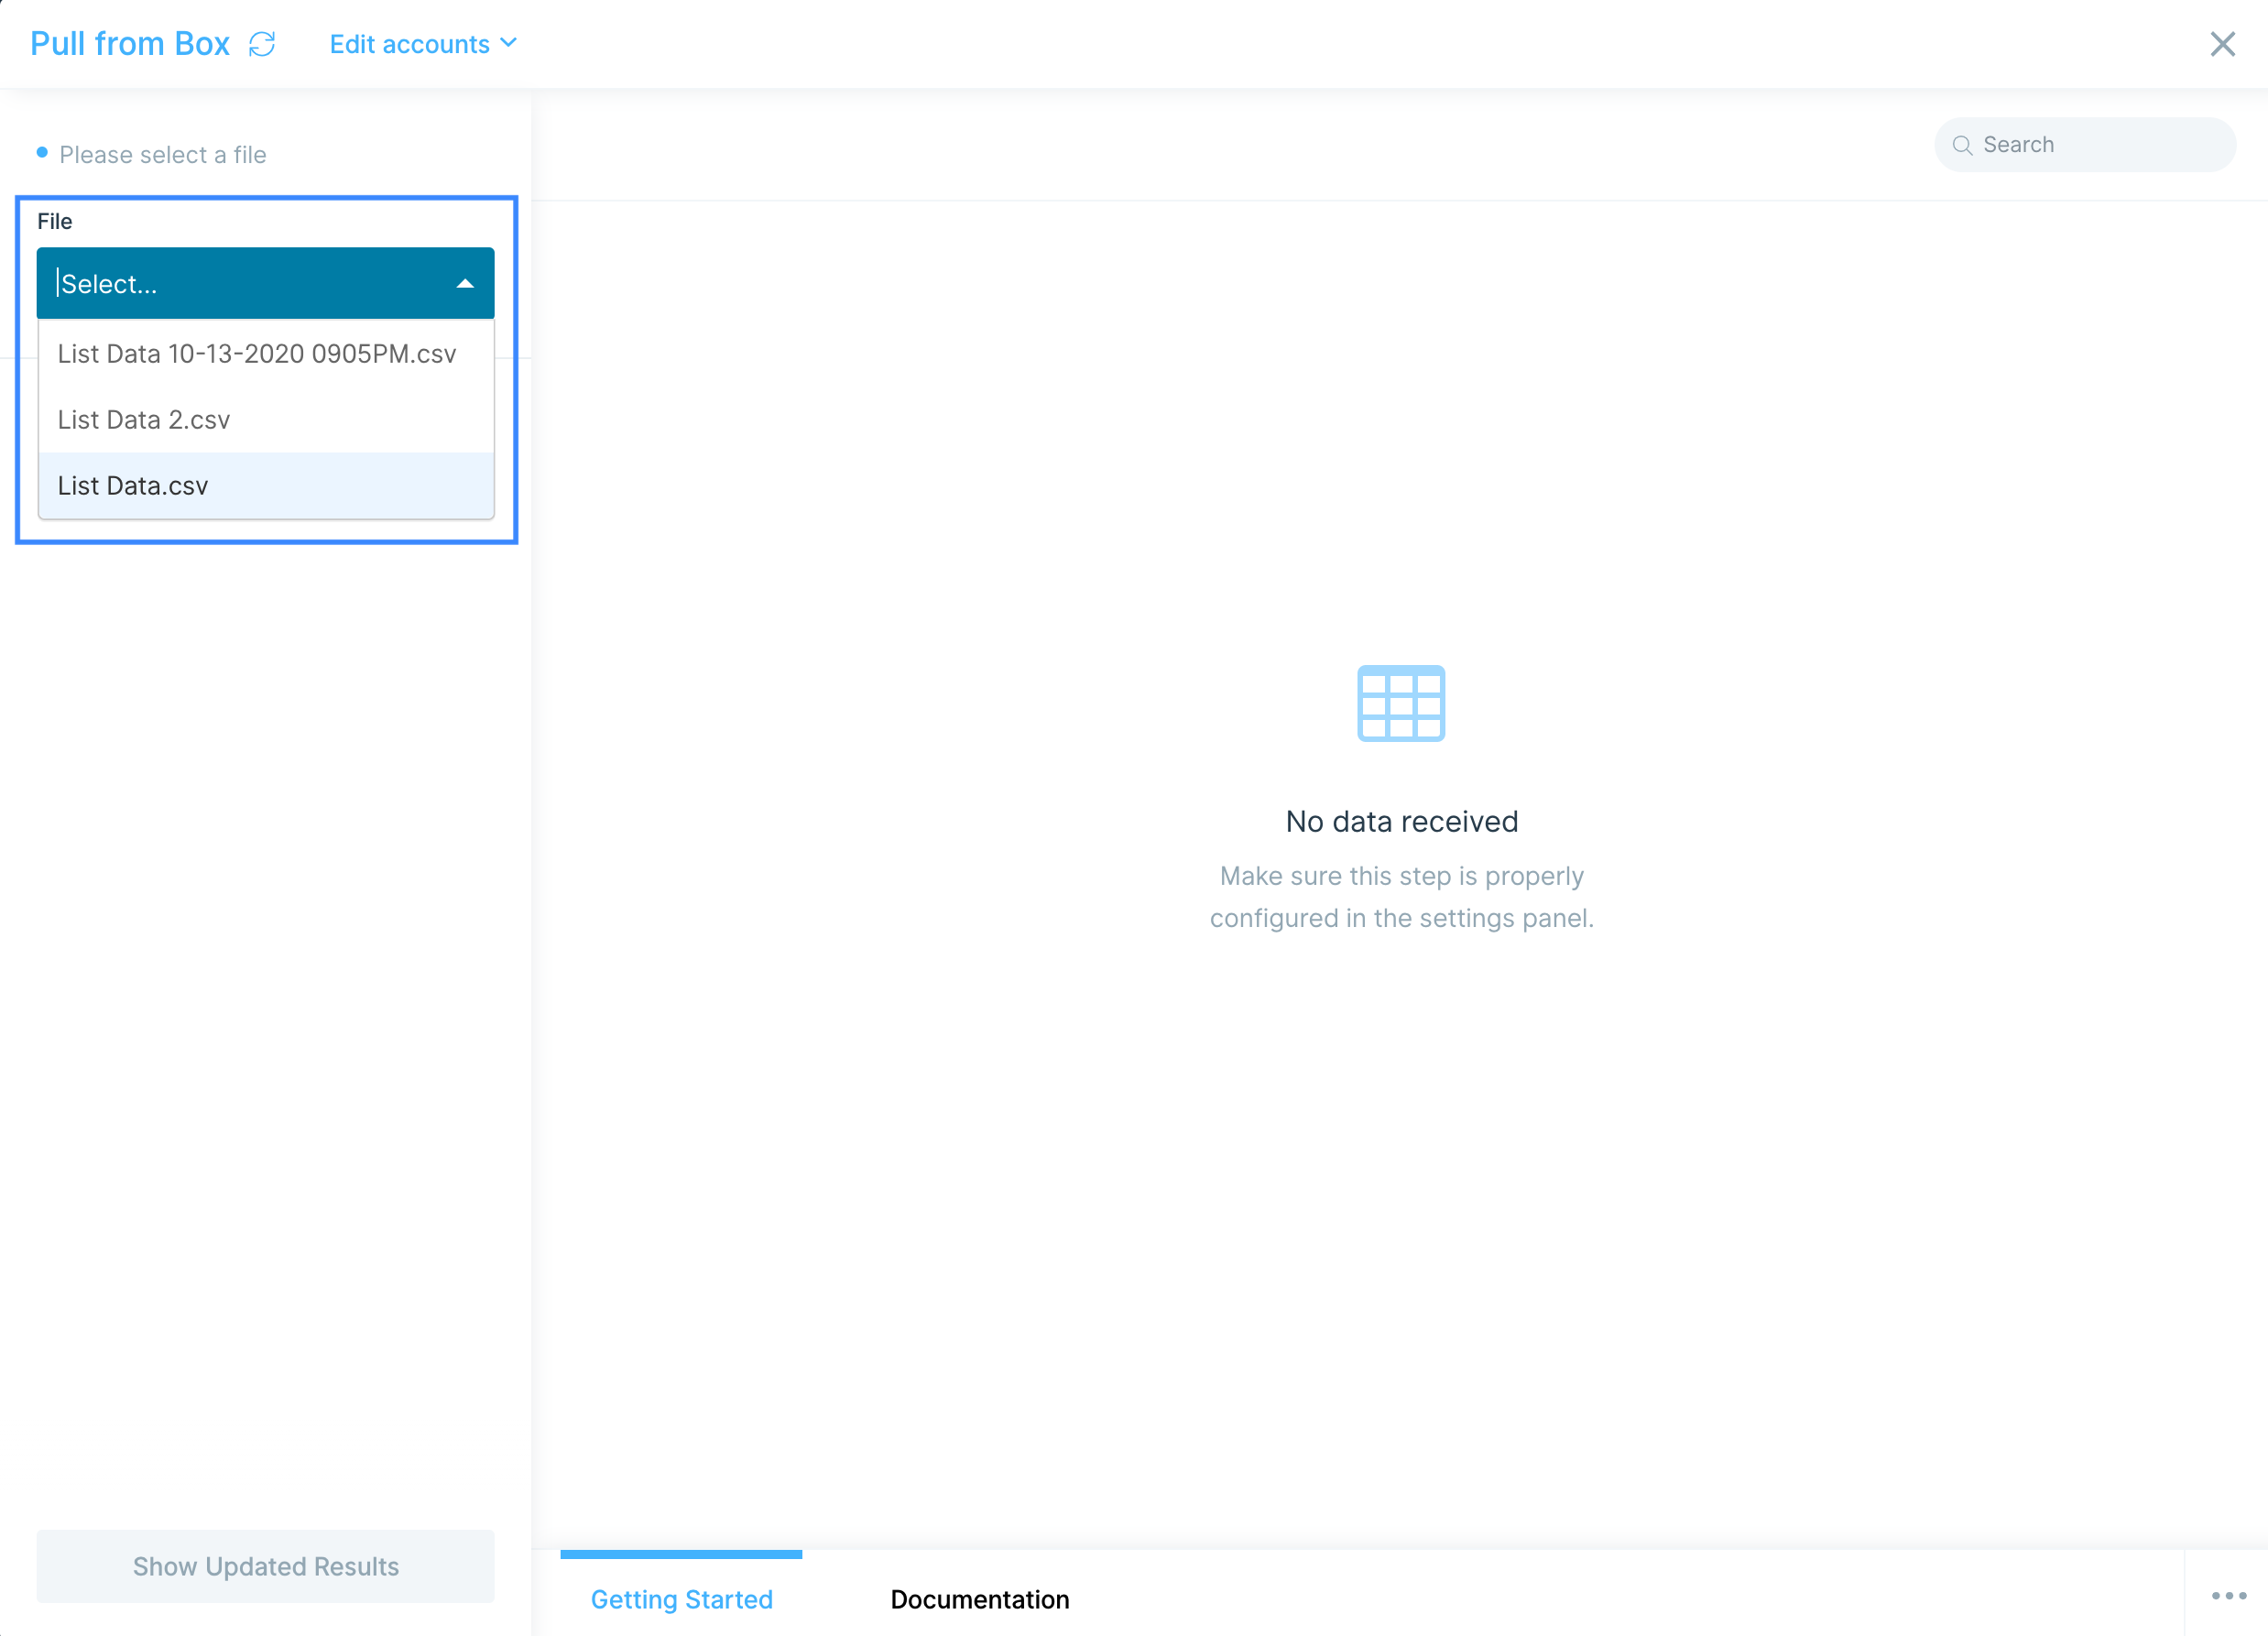
Additionally, you can tell Parabola if you're using a different delimiter, such as tab (\t) or semicolon (;), by selecting in the Delimiter dropdown. By default, Parabola will use the standard comma (,) delimiter.

Helpful tips
- Any changes made to the selected Box file will be automatically synced with Parabola the next time you open or run your flow.
- Box's API runs on a 10 minute delay for newly created files. If your newly added Box file does not immediately appear in the File dropdown, check back in a few minutes.
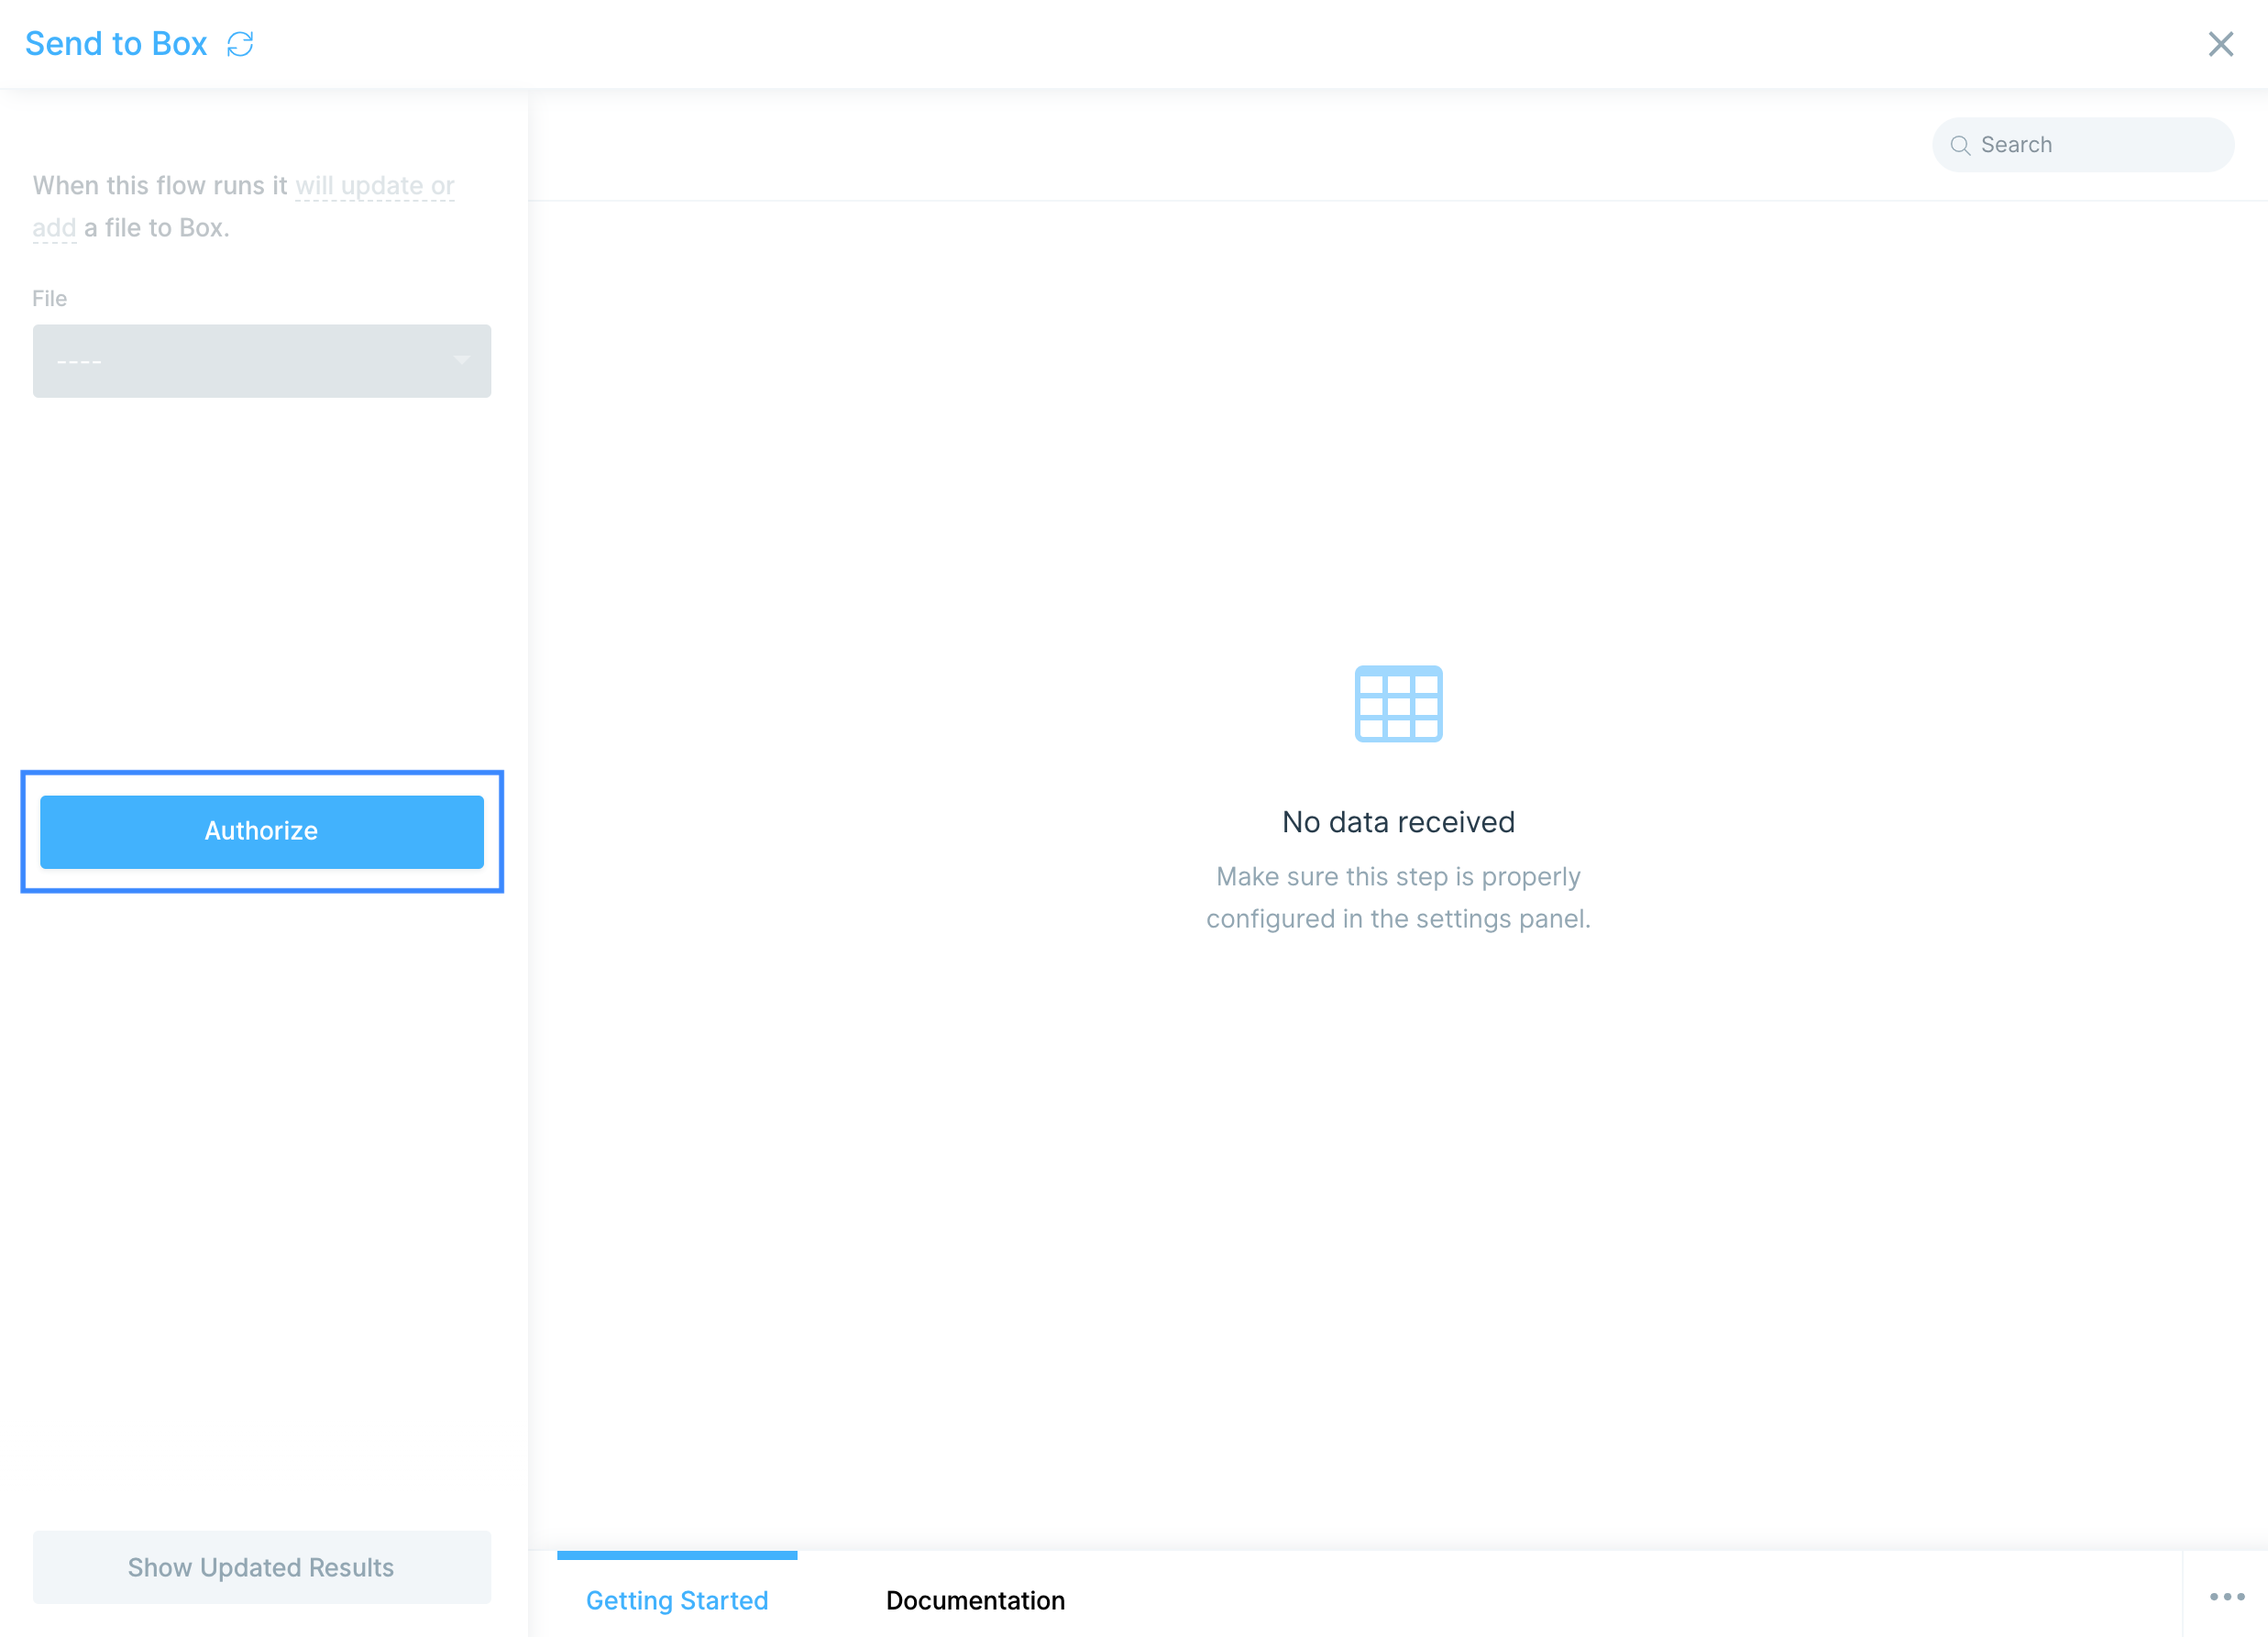
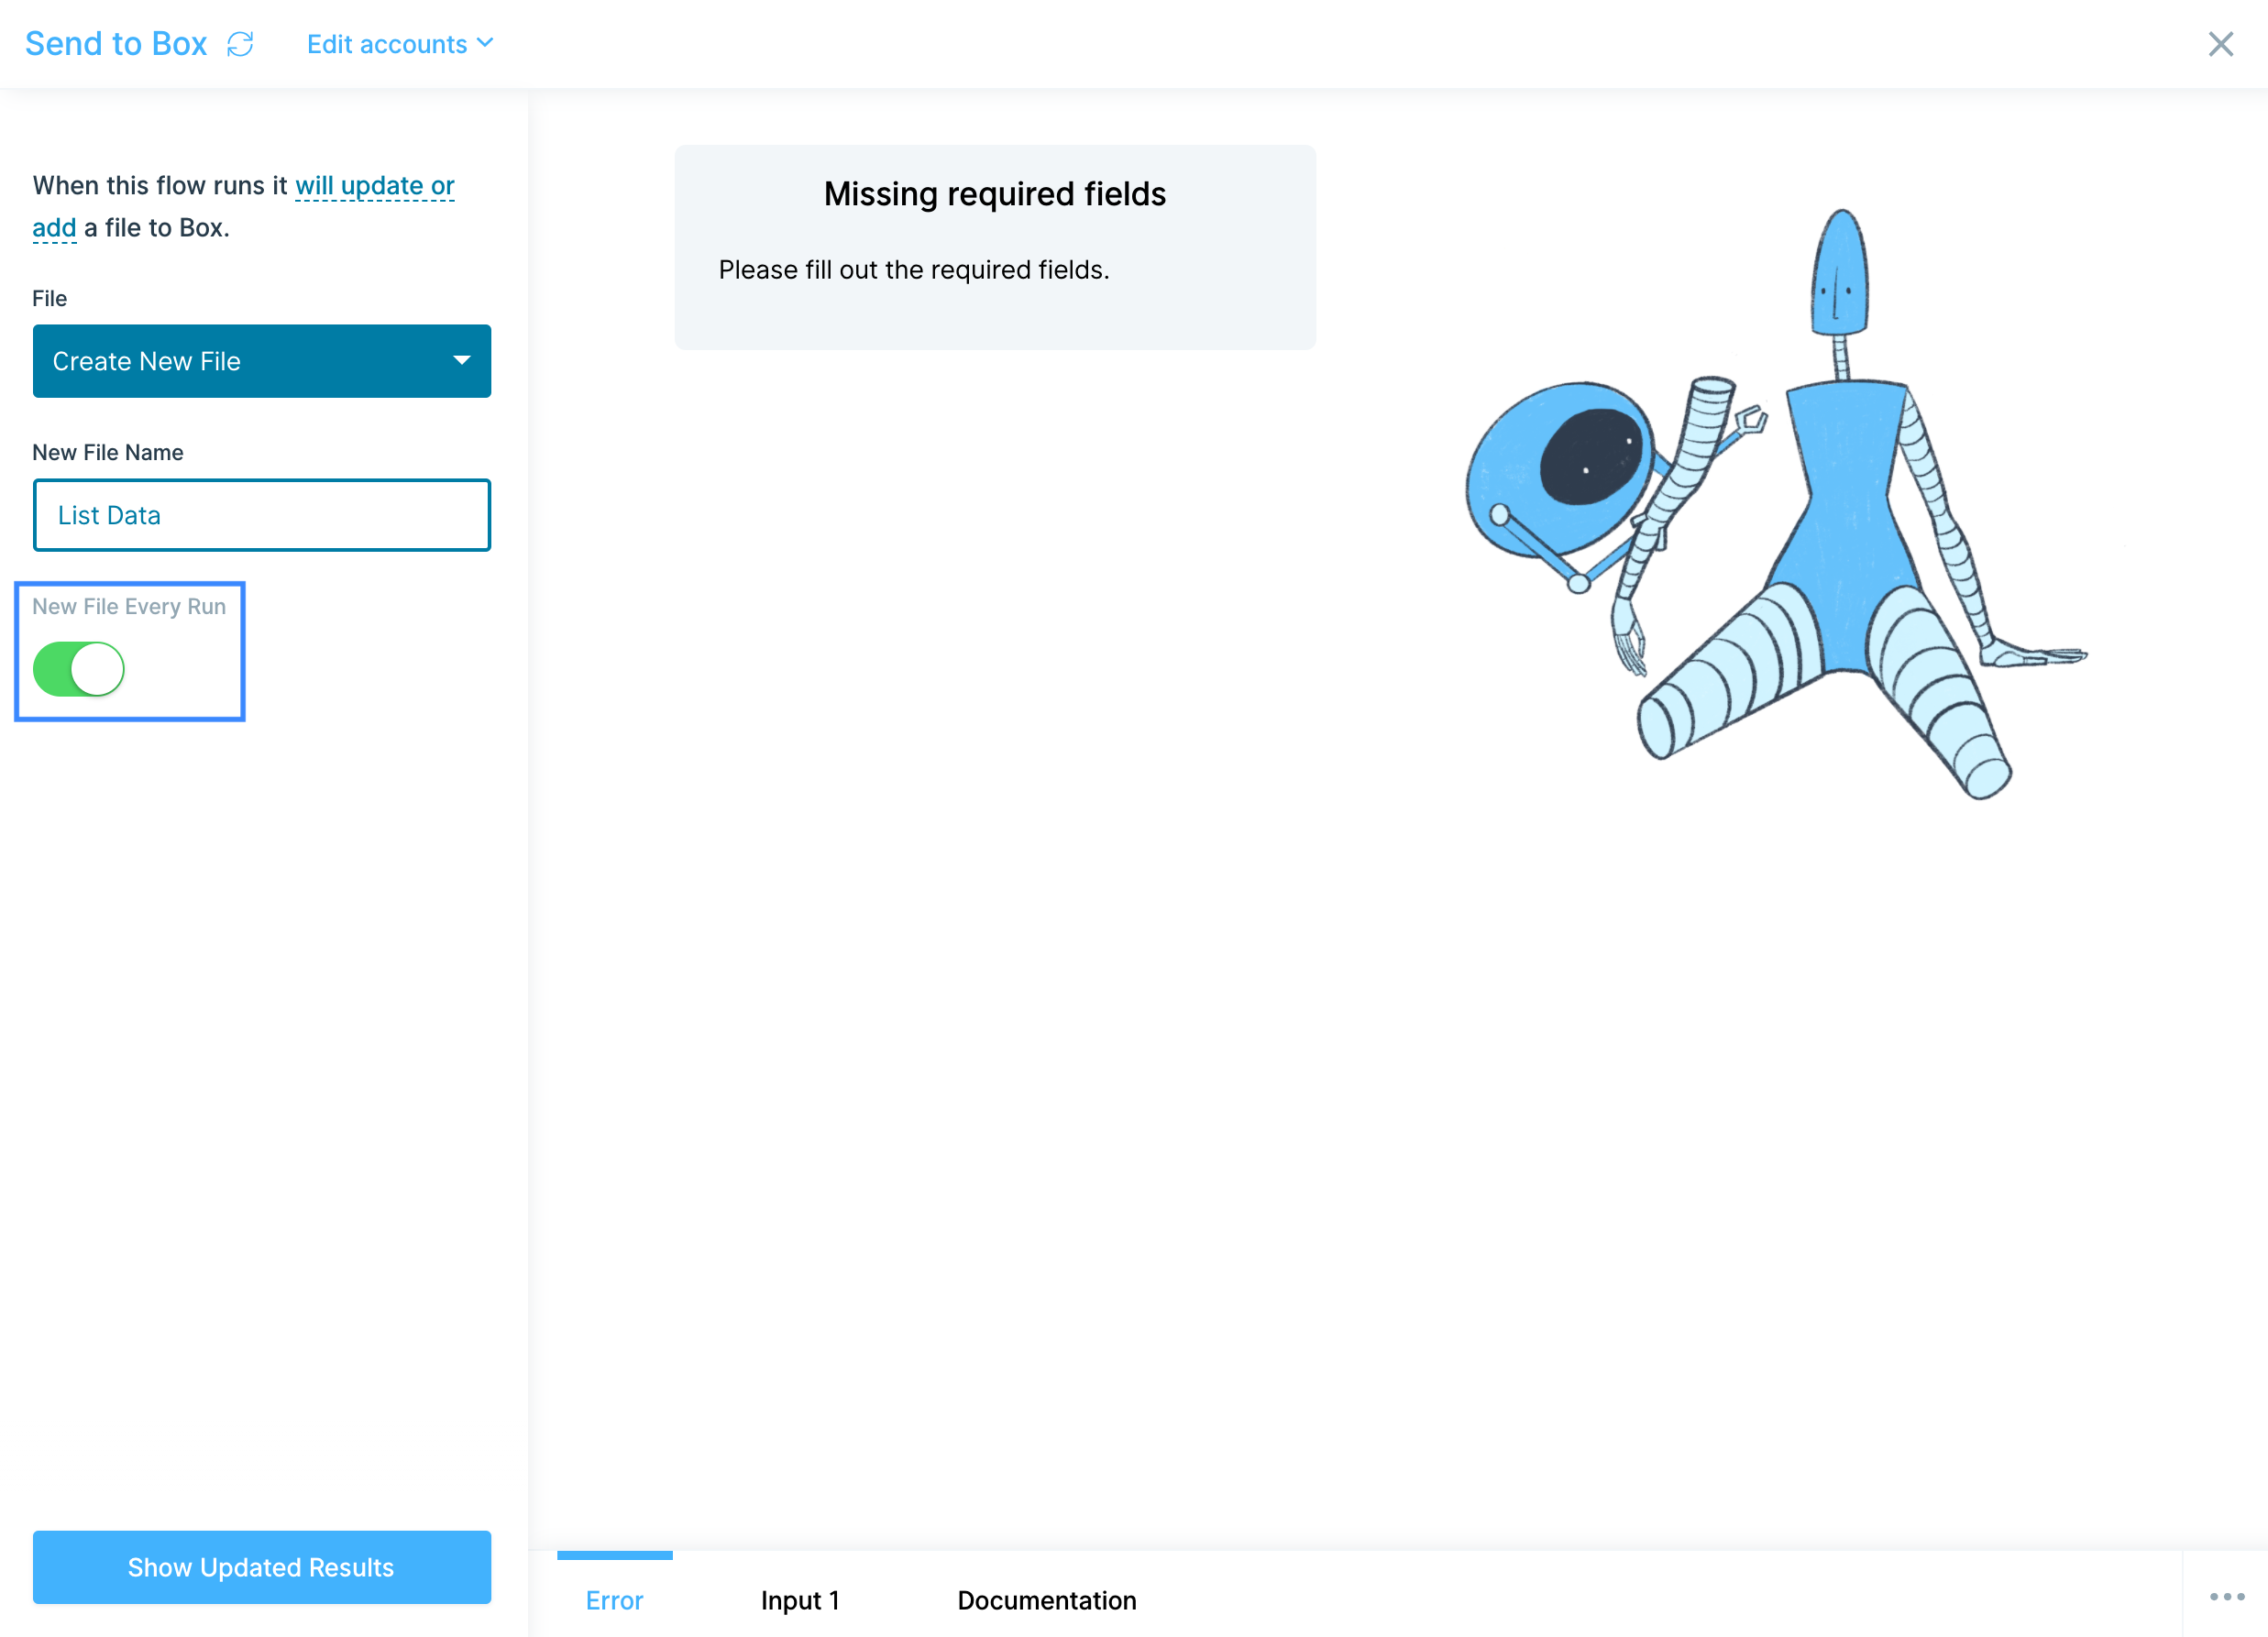
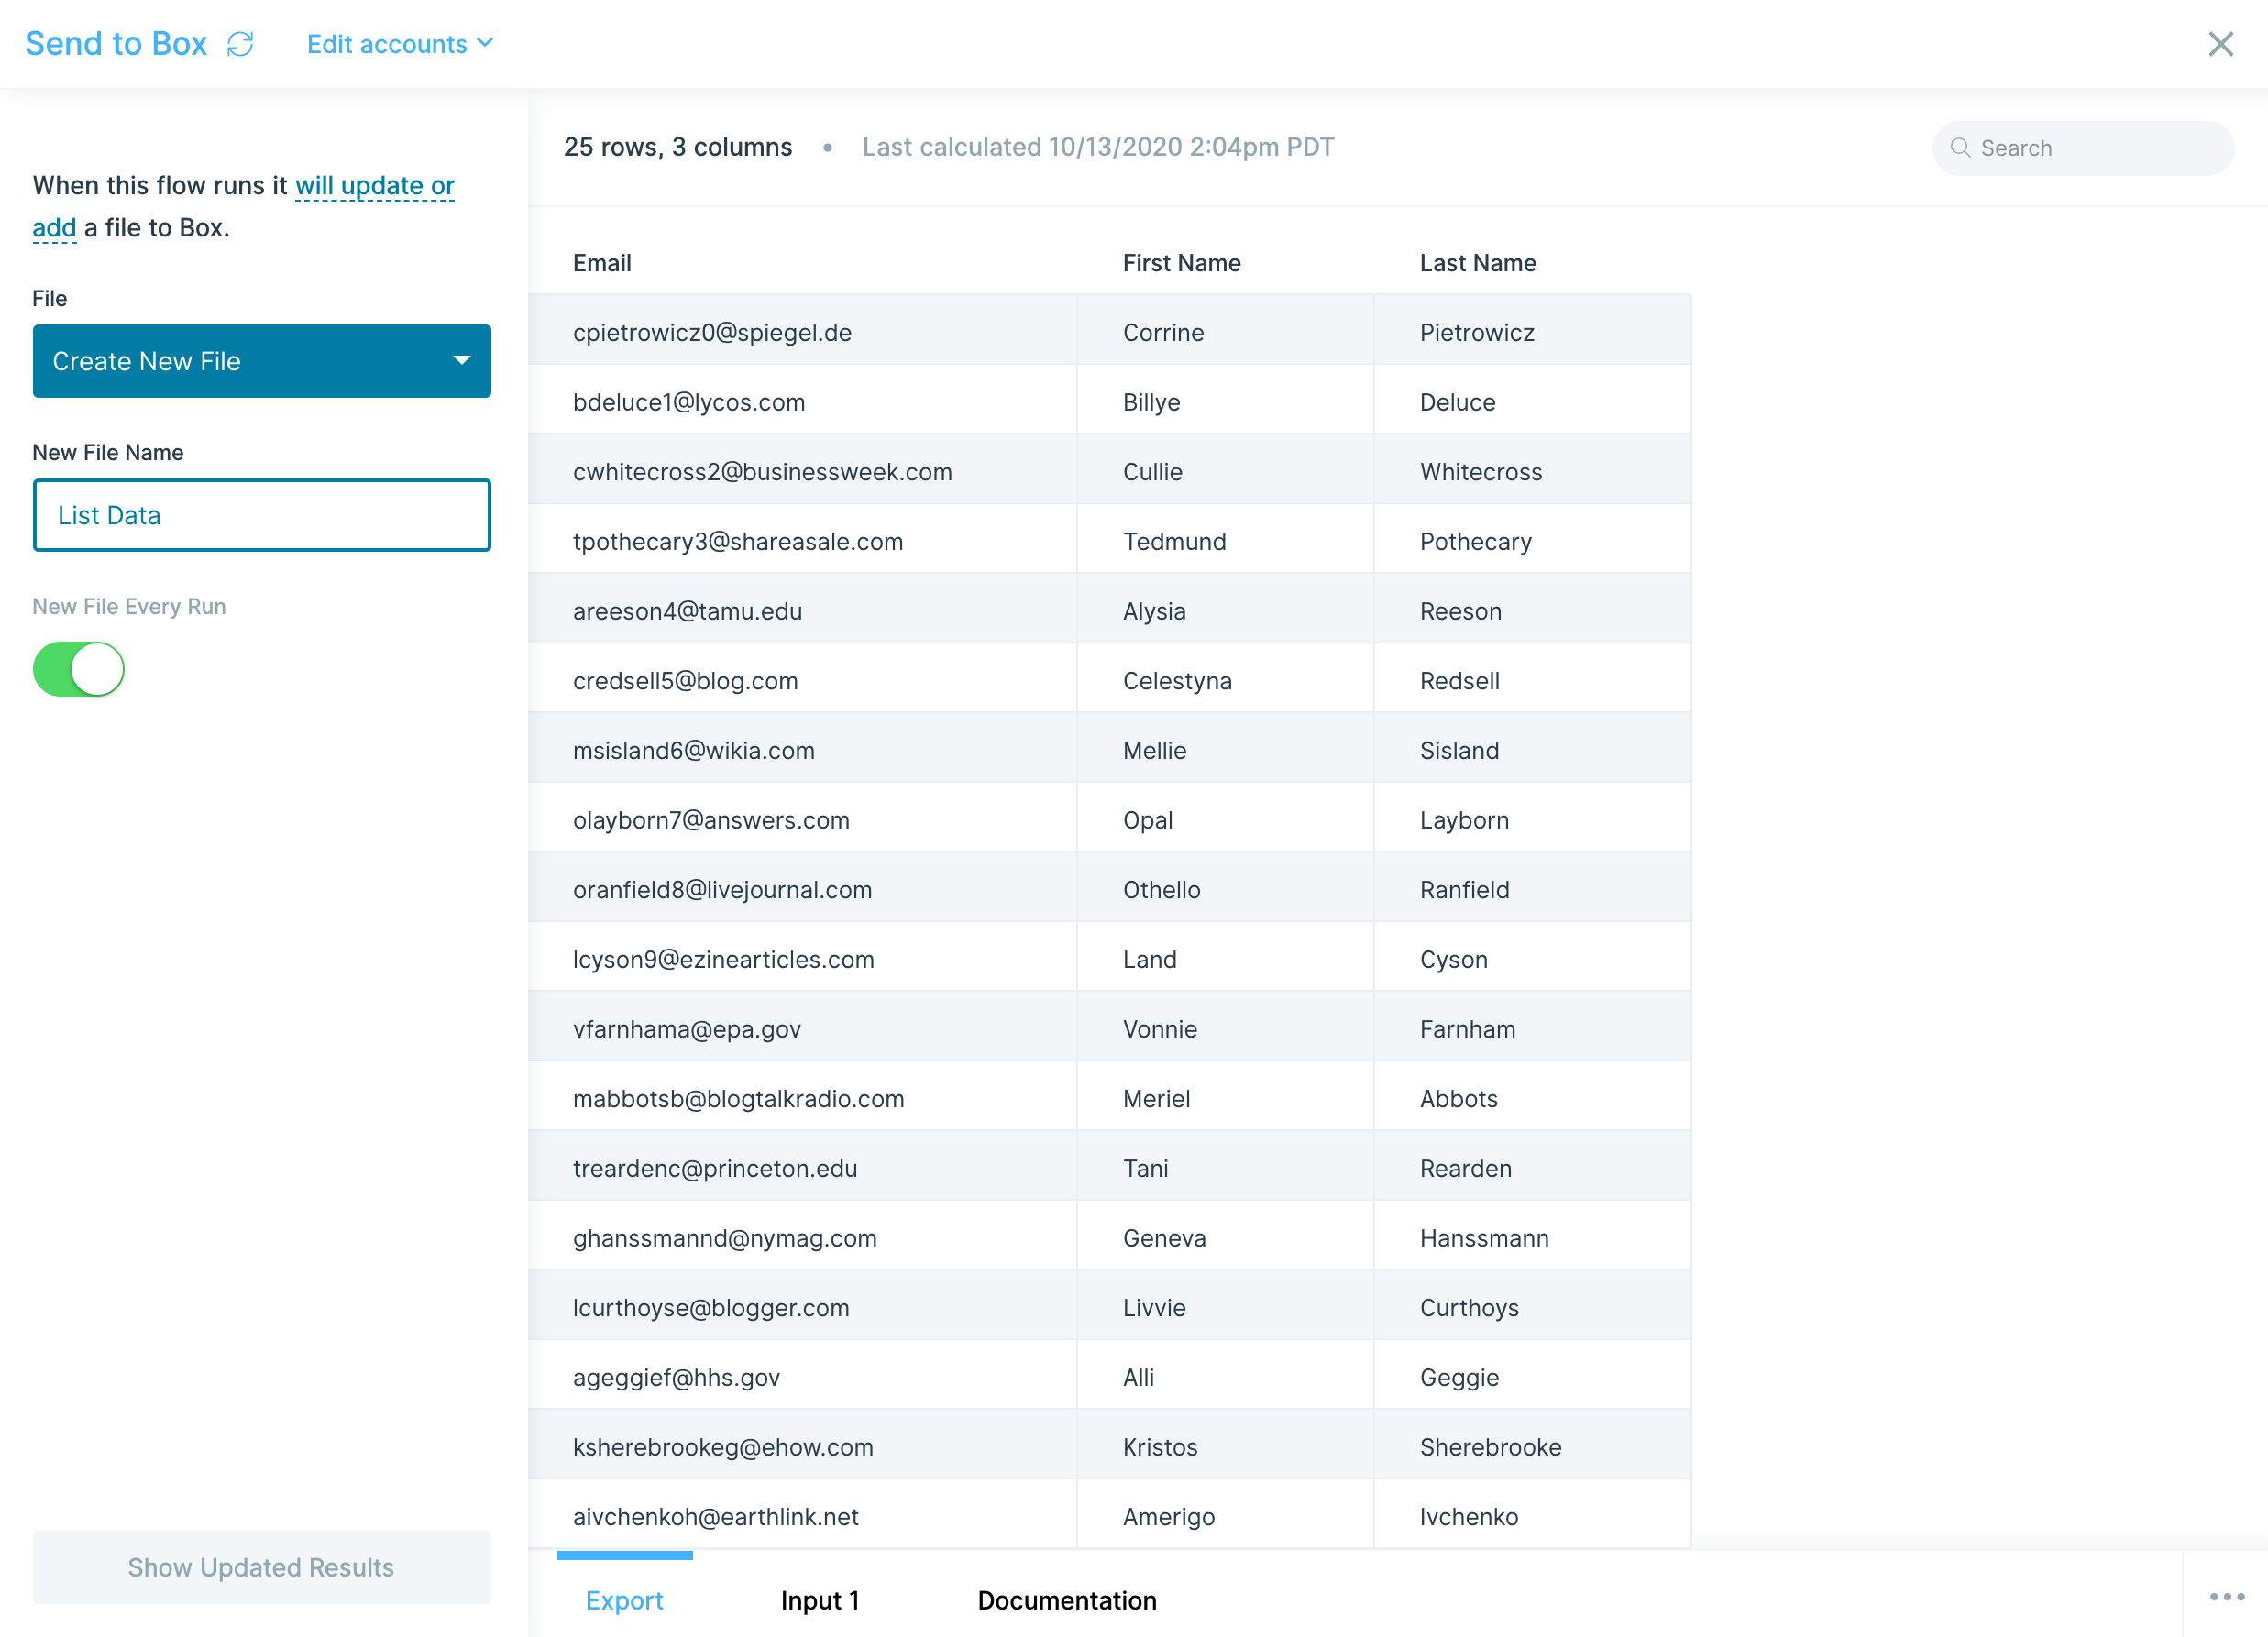
The Send to Box step gives you the ability to create a new or update an existing file in your Box account.
Connect your Box account
To connect your Box account to Parabola, select Authorize and follow the prompt to grant Parabola access to your Box files.
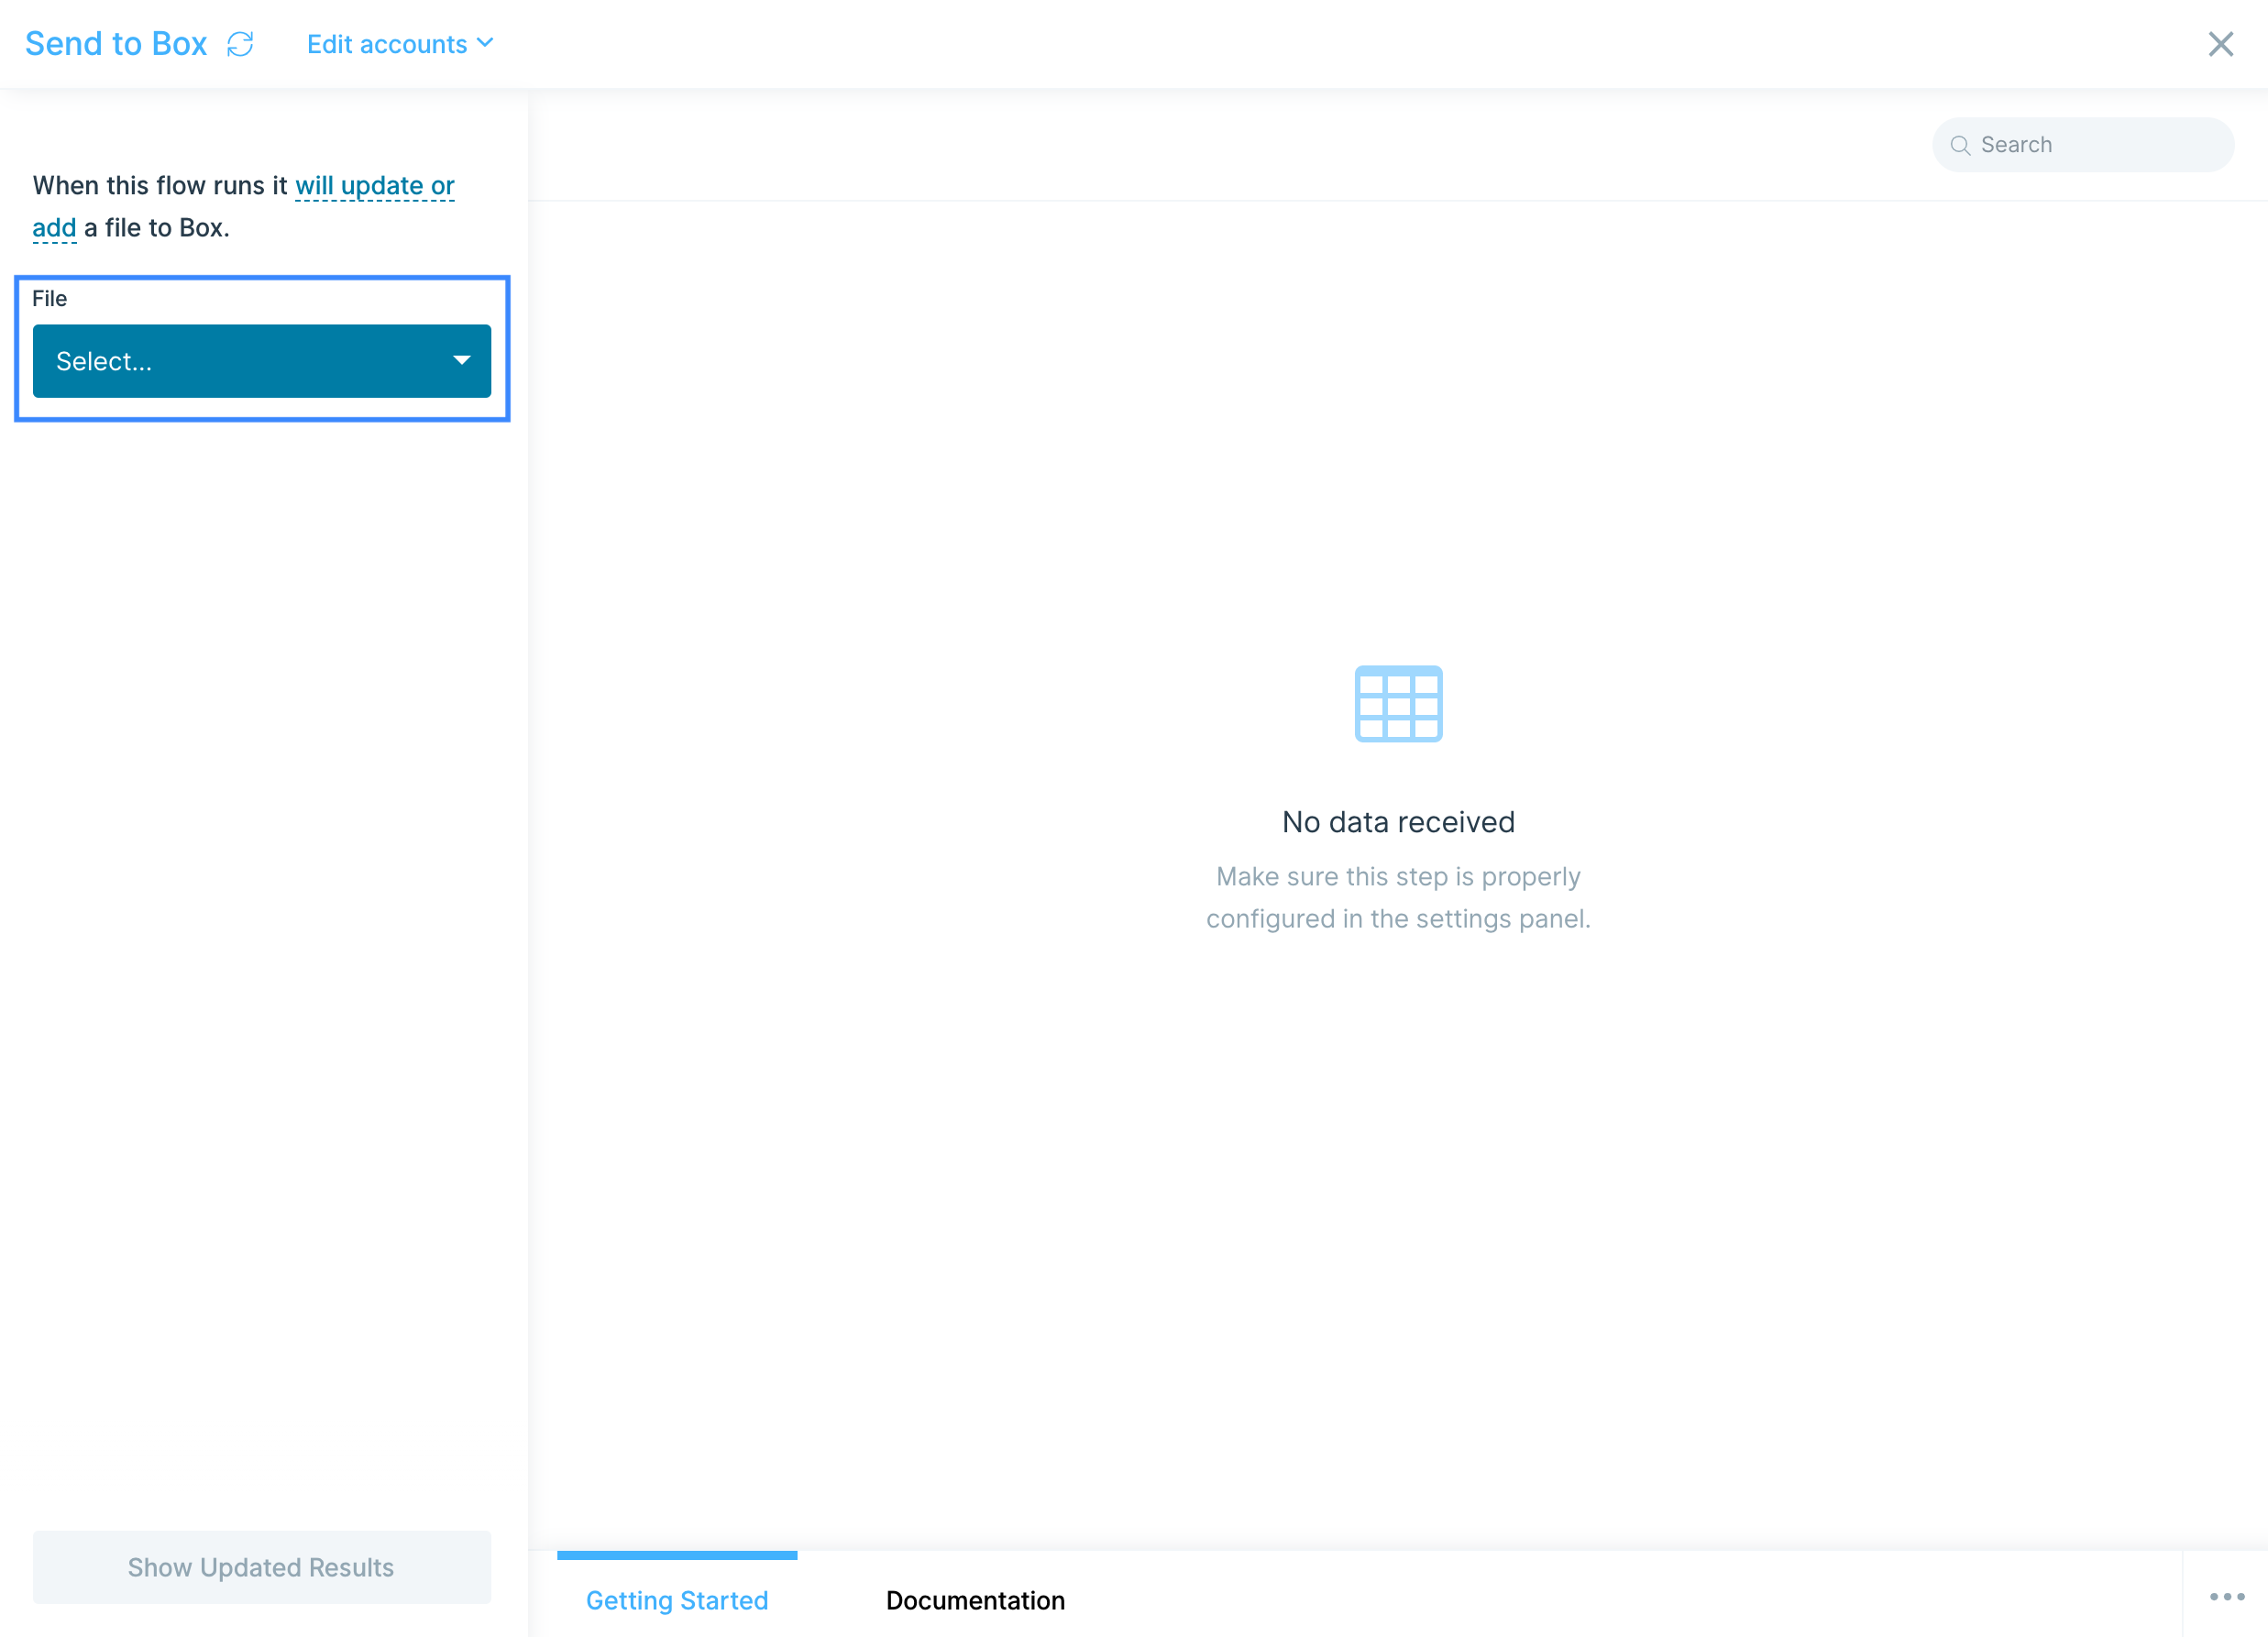
Custom settings
Select the File dropdown to choose if you want to overwrite an existing file or create a new file.
If creating a new file, give the file a name in the New File Name field.
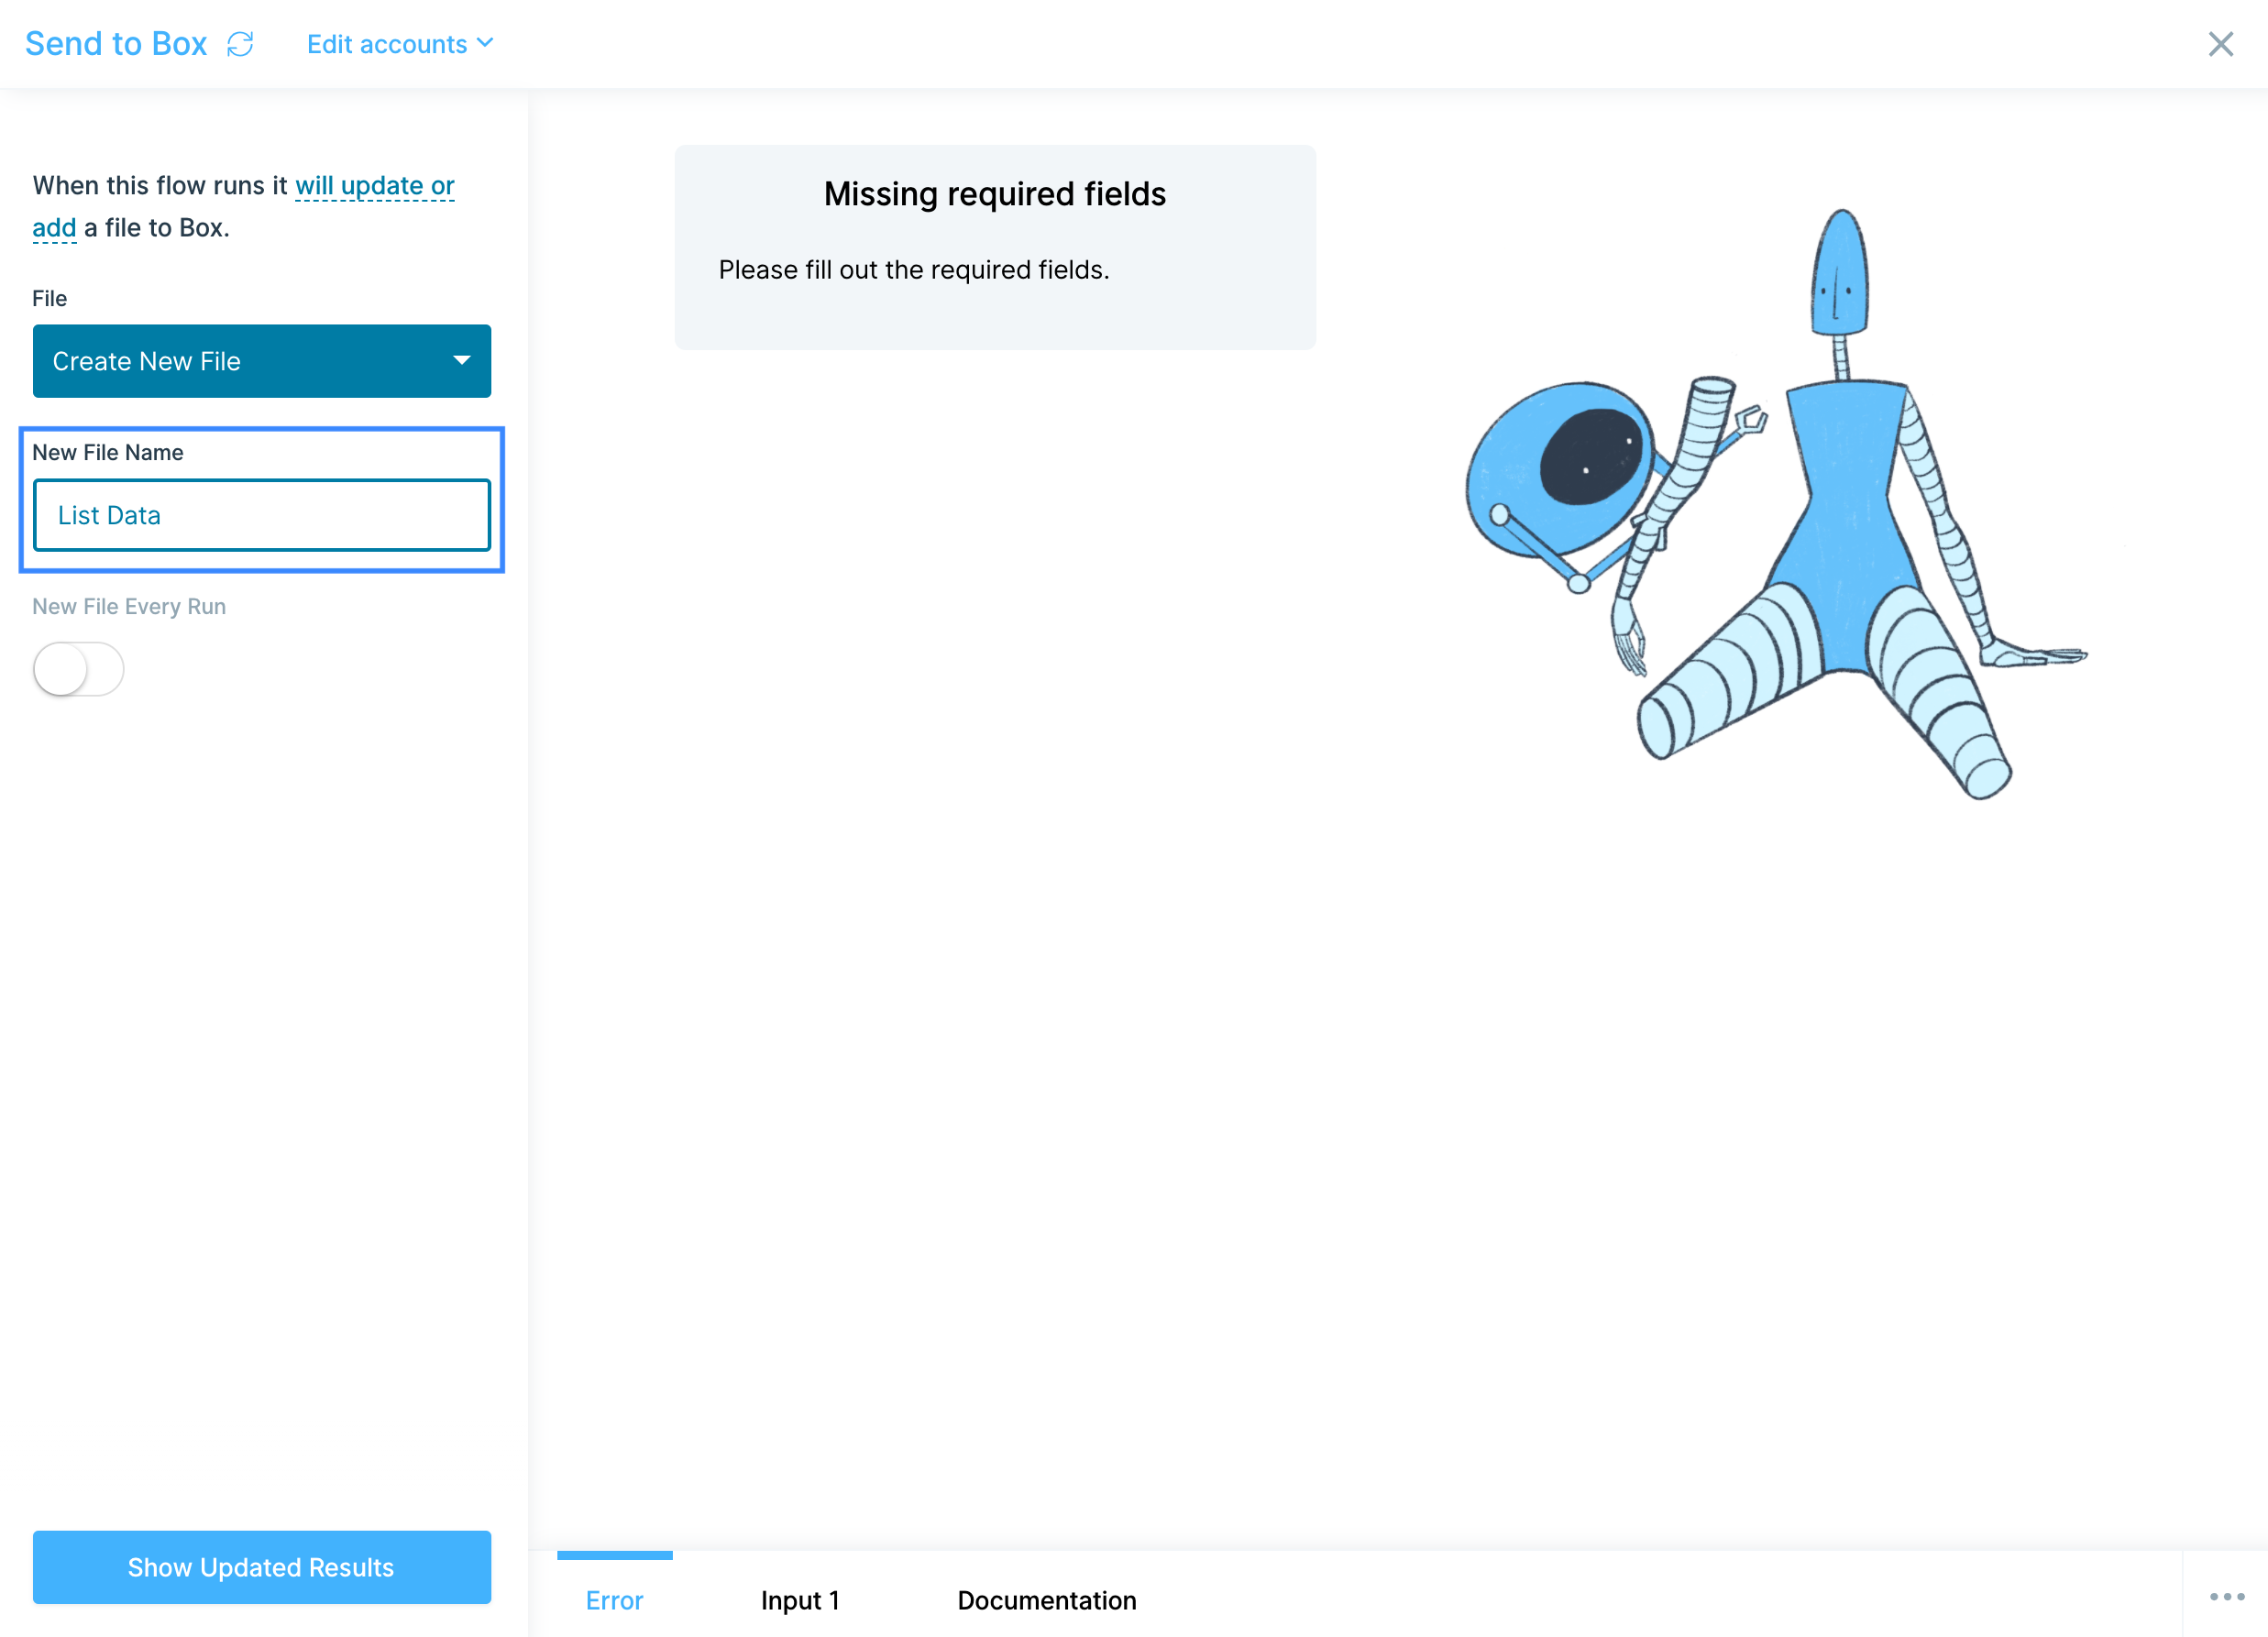
You can also decide if this is a one-off creation, or if you'd like to create a new file every time your flow runs. If you choose to create a "New File Every Run", each new file will have a timestamp appended to the file name in Box.
Helpful tips
- Anyone with access to an existing file will be able to see and use the changed data.
- Box's API runs on a 10 minute delay for newly created files. If your newly added Box file does not immediately appear in the File dropdown, check back in a few minutes.
- Upload size using our Box step is limited to ~50MB. If you are at or nearing this file size limit, we recommend splitting the file to prevent errors!
- As of today, users cannot specify the destination folder for the Send to Box step.
Integration:
Cin7
How to authenticate
Cin7 Core uses API Key authentication with two required credentials: an Account ID and an API Application Key.
Creating API credentials in Cin7 Core
- Log in to your Cin7 Core account at https://inventory.dearsystems.com
- Navigate to Settings, then go to Integrations & API > Cin7 Core API (or go directly to https://inventory.dearsystems.com/ExternalAPI)
- Click the plus icon or Add API Connection button to create a new application
- Give your application a descriptive name (e.g., "Parabola Integration")
- Once created, you'll see two credentials:
- Account ID (also called api-auth-accountid)
- API Application Key (also called api-auth-applicationkey)
- Copy both values and store them securely
Tip: Each company you have access to in Cin7 Core will have a different Account ID. You can create multiple API Applications for the same account, which is useful for tracking usage across different integrations.
Note: Your Account ID and API Application Key are equivalent to a login and password. Keep them secret and never share them publicly.
Connecting in Parabola
- In your Parabola flow, add a Pull from Cin7 step and select the “Core” service.
- Click Authorize and you'll be prompted to enter:
- Give your connection a memorable name (e.g., "Production Cin7 Core Account")
- API Account ID - Your Cin7 Core Account ID
- API Application Key - Your API Application Key
Once connected, you can select from Cin7 Core's available endpoints to bring live data into your flow.
Available data
Using the Cin7 Core integration in Parabola, you can pull in a wide range of operational data:
- Products: Product master data including SKUs, names, descriptions, pricing, categories, suppliers, inventory attributes, and product families. Access product availability across locations and markup pricing details.
- Sales and Orders: Complete sales order information including customer details, line items, quantities, pricing, order status, fulfillment details, shipments, invoices, credit notes, and payments.
- Purchases: Purchase order data with supplier information, line items, costs, receiving status, quantities, invoices, credit notes, and payment records.
- Customers: Customer records with contact information, addresses, payment terms, tax rules, price tiers, credit limits, tags, and custom attributes.
- Suppliers: Supplier details including contact information, addresses, payment terms, currencies, and related purchase history.
- Locations: Warehouse and location data including addresses, active status, and location-specific inventory settings.
Common use cases
- Reconcile inventory levels from Cin7 Core, Shopify, Amazon, and other sales channels into a single source of truth. Automatically flag discrepancies, low stock levels, or oversell risks across locations.
- Track purchase order status from creation through receiving and invoicing. Analyze supplier lead times, identify delayed shipments, and automate supplier follow-ups when orders fall behind schedule.
- Monitor sales orders from placement through picking, packing, and shipment. Calculate fulfillment times, flag orders at risk of missing delivery SLAs, and generate real-time fulfillment dashboards for operations teams.
- Reconcile purchase orders, receipts (stock received), and supplier invoices to catch pricing discrepancies, quantity variances, and billing errors before payment.
- Combine inventory data with financial transactions to calculate inventory value by location, track cost of goods sold (COGS), and generate automated reports for finance teams and accounting systems.
Tips for using Parabola with Cin7 Core
- Schedule your flow based on business needs: Set up daily or hourly runs for inventory reconciliation and order tracking. For financial reporting and purchase order monitoring, weekly schedules may be sufficient.
- Join related data for complete visibility: Combine data from multiple endpoints to create comprehensive reports. For example, join Sales Orders with Shipments and Invoices to track the complete order lifecycle, or merge Products with Inventory Availability across multiple locations.
- Combine with other systems for end-to-end automation: Integrate Cin7 Core data with your accounting software (Xero, QuickBooks), 3PLs, carrier tracking systems, and BI tools to build comprehensive operational dashboards and automated reconciliation workflows.
- Document your logic with cards: Add cards to your Parabola flow to explain business rules, calculations, and data transformations. This makes it easier for your team to maintain and audit flows over time.
- Export results back to systems or create dashboards: Push processed data to Google Sheets for team visibility, update records in your ERP, or create custom dashboards that refresh automatically with the latest Cin7 Core data.
By connecting Cin7 Core with Parabola, you transform your inventory and order management data into powerful automation—enabling real-time visibility, faster reconciliations, and smarter operations across your entire supply chain.
How to authenticate
Cin7 Omni uses Basic Authentication with a username and API key. You'll need to generate an API key from your Cin7 Omni account to connect.
Creating an API key in Cin7 Omni
- Log in to Cin7 Omni as an administrator
- From the user menu in the navigation, open Settings
- Under Integrations & API, select API v1
- Here you'll see your API Username
- Select Add New API Connection
- If you receive an error about connection limits, contact Cin7 Omni support to add your connection
- Give your connection a descriptive App Name (we suggest including "Parabola" to identify this connection) and configure the permissions for this connection based on what data you want Parabola to access
- Once created, copy your Connection Key (API Key) and store it somewhere secure
Connecting in Parabola
- In your Parabola flow, add a Pull from Cin7 step and select the “Omni” service.
- Click Authorize and enter your credentials when prompted:
- Username: Your API Username from Cin7 Omni
- Password: Your Connection Key (API Key)
Once authenticated, select the resource you want to pull (Orders, Products, Inventory, etc.)
Available data
Using the Cin7 Omni integration in Parabola, you can pull the following operational data:
- Branch Transfers: Inter-warehouse transfer records showing inventory movements between locations, including line items, quantities transferred, dispatch dates, and approval status. Perfect for tracking stock redistribution across your fulfillment network.
- Products: Complete product catalog including SKUs, names, descriptions, pricing, dimensions, weights, and cost information. Pull product attributes, categorization, and custom fields to maintain synchronized product data across systems.
- Product Options: Product variant data including size, color, and other option combinations. Retrieve pricing tiers, SKU variants, and inventory levels for each product option to manage complex product catalogs.
- Purchase Orders: Inbound purchase order data with supplier information, order details, line items, quantities, expected costs, and receiving status. Track what's been ordered, what's in transit, and what's been received.
- Quotes: Sales quote records including customer information, quoted products, pricing, terms, and quote status. Monitor quotes from creation through approval and conversion to sales orders.
- Sales Orders: Outbound order information with customer details, order lines, fulfillment status, shipping information, payment status, and order totals. Track orders from placement through fulfillment and delivery.
Common use cases
- Reconcile Cin7 inventory data with 3PL systems, Shopify, or Amazon to identify stock discrepancies, flag negative inventory, and maintain accuracy across all warehouses and sales channels.
- Track purchase orders against received quantities and expected costs to catch receiving discrepancies, supplier delays, or pricing variances before they impact your operations.
- Pull sales orders, branch transfers, and product data to create real-time dashboards showing fulfillment velocity, order status distribution, pending shipments, and warehouse utilization by location.
- Monitor inventory levels across all branches and trigger automated alerts when products fall below reorder thresholds. Combine with sales velocity data to predict stockouts before they happen.
- Consolidate sales orders and quotes across channels to analyze sales performance, quote-to-order conversion rates, average order values, and sales trends by product category or customer segment.
Tips for using Parabola with Cin7 Omni
- Schedule your flows based on operational needs: Run inventory reconciliations hourly during peak fulfillment periods, daily for overnight reporting, or weekly for performance analysis. Align your schedule with your team's workflow.
- Use filters to control data volume: Leverage date ranges, status filters, and branch-specific queries to pull only the data you need. This keeps your flows fast and focused on recent or relevant records.
- Join related data for complete context: Combine sales orders with product data to add descriptions and costs, or join purchase orders with branch transfers to track inventory from supplier to warehouse to fulfillment center.
- Create validation checks for data quality: Use filters and formulas to flag anomalies like orders missing shipping info, inventory adjustments without reason codes, or purchase orders with quantity mismatches between ordered and received.
- Set up alerts for critical thresholds: Configure Slack or email notifications when inventory drops below safety stock, when orders are stuck in processing longer than your SLA, or when purchase orders are overdue for receiving.
- Normalize IDs early in your flow: Standardize product SKUs, order references, and location identifiers at the beginning of your flow so downstream joins to other systems (Shopify, NetSuite, warehouse systems) are consistent and reliable.
By connecting Cin7 Omni with Parabola, you can automate the tedious manual work of exporting data, reconciling spreadsheets, and generating reports—freeing your operations team to focus on strategic decisions instead of data wrangling.
Integration:
Coupa
How to use Parabola's Coupa integration
Parabola's Coupa integration allows teams to pull invoices and purchase orders directly into automated workflows, enabling real-time spend analysis and cross-system reconciliations without manual data exports.
- Automatically retrieve invoice and purchase order data for reconciliation and reporting
- Combine Coupa financial data with ERP, warehouse, and sales channel information
- Track procurement performance and identify billing discrepancies
- Build automated dashboards showing spend by supplier, status, and time period
Learn more about Parabola's Coupa integration below.
How to authenticate
Coupa uses OAuth 2.0 Client Credentials for secure API access. To connect Coupa to Parabola, you'll need to create an OAuth client in your Coupa instance and obtain your credentials.
Creating an OAuth client in Coupa:
- Log in to your Coupa instance as an administrator with integration permissions.
- Navigate to Setup > Oauth2/OpenID Connect Clients. (You can type "oauth" in the search box to find it quickly.)
- Click Create.
- From the Grant Type dropdown, select Client credentials.
- Fill in the required fields:
- Name: Give your client a descriptive name (e.g., "Parabola Integration")
- Login: Your admin username
- Contact First Name, Contact Last Name, and Contact Email: Your contact information
- Select the Scopes you need for your integration:
core.accounting.read– Required to access invoicescore.purchase_order.read– Required to access purchase orders- You can add additional scopes based on your specific needs
- Click Save.
- After saving, you'll see your Client ID (Identifier) and Client Secret. Copy these credentials to a secure location—you'll need them to connect in Parabola.
Connecting in Parabola:
- In your Parabola flow, add a Pull from Coupa step.
- Click Authorize and you'll be prompted to enter:
- Client ID: Your Coupa OAuth client identifier
- Client Secret: Your Coupa OAuth client secret
- Instance: Your Coupa subdomain (e.g., if your Coupa URL is
https://acme.coupahost.com, enteracme) - Scopes: The scopes you selected when creating the client (e.g.,
core.accounting.read core.purchase_order.read). Each scope must be separated by a space.
- Click Connect. Parabola will securely store your credentials and automatically handle token generation and refresh.
- Once authenticated, select the data you want to pull and configure any filters.
Available data
Using the Coupa integration in Parabola, you can pull:
- Invoices: Invoice records including invoice numbers, status (draft, pending approval, approved, paid, voided, disputed, etc.), creation and update timestamps, totals, and file URLs for invoice PDFs. Filter by date ranges, status, or account type.
- Invoice details by ID: Retrieve full details for a specific invoice using its unique identifier.
- Purchase orders: Purchase order records including PO numbers, status (draft, pending approval, approved, issued, closed, canceled, etc.), creation and update timestamps, order totals, and export status. Filter by date ranges, status, export status, or account type.
All data can be filtered by creation date, update date, status, and account type. The integration supports pagination to handle large datasets efficiently.
Common use cases
- Three-way match reconciliation: Pull invoices and purchase orders from Coupa, combine with receiving data from your warehouse or ERP, and automatically flag discrepancies in quantities, pricing, or missing documents.
- Spend analysis and reporting: Aggregate invoice data by supplier, category, or time period to create automated dashboards showing spending trends, budget utilization, and savings opportunities.
- Invoice processing automation: Monitor pending and approved invoices, combine with payment data from your accounting system, and track time-to-payment or identify invoices stuck in approval workflows.
- Purchase order tracking: Track PO status from creation through closure, identify open POs aging beyond expected timelines, and alert procurement teams about delayed orders or missing receipts.
- Supplier performance monitoring: Combine invoice and PO data to calculate on-time delivery rates, analyze invoice accuracy, and identify suppliers with frequent disputes or billing issues.
- Month-end close acceleration: Automate the extraction and reconciliation of invoices and purchase orders against your general ledger or ERP system to reduce manual effort during financial close periods.
Tips for using Parabola with Coupa
- Schedule your flows to run daily or hourly during critical periods like month-end close to keep financial data current and reduce last-minute reconciliation work.
- Use date filters strategically: Filter by
created-atorupdated-atdates to pull only recent records, reducing API load and speeding up your flows. For ongoing reconciliations, pull data from the last 30-90 days. - Ask for just the fields you need: Use the fields setting to pull in the minimal fields that the Flow needs to operate. The less fields you request, the faster the data will be returned by Coupa to Parabola. Large amounts of data can take a long time to pull without reducing the fields.
- Combine with other systems: Join Coupa invoices and purchase orders with data from your ERP (NetSuite, SAP, etc.), warehouse management system, or procurement tools to create comprehensive operational views and catch cross-system discrepancies.
- Add validation checks: Use Parabola's Filter and Formula steps to flag exceptions like invoices without matching purchase orders, POs in "issued" status for over 60 days, or invoices with disputed status.
- Set up alerts: Configure Email or Slack notifications in Parabola to alert finance and procurement teams when specific conditions are met, such as high-value invoices pending approval or POs exceeding budget thresholds.
- Document your workflow: Use Parabola's step notes to explain your logic and filters so teammates can easily understand and maintain your flows as business requirements evolve.
By connecting Coupa with Parabola, you transform procurement and invoice data into automated workflows that deliver real-time visibility, faster reconciliations, and proactive exception management—all without manual exports or spreadsheet work.
Integration:
Create a sheet
Write or paste a sheet of data by hand. Sheets are best used for small datasets like lookup tables or additional rows that can be fed to subsequent steps. This step is limited to 100 rows and 100 columns.
Creating a sheet of data
Create a sheet of data by typing in values, or copying and pasting from an existing spreadsheet. The sheet has 100 rows and 10 columns by default. Extra columns will be added automatically if the data you have pasted requires them. You can also use the "+ Column" button to add more columns manually.
Data can be highlighted across rows, columns, or cells to be edited or deleted. Use the "Clear sheet" button to clear out all data from the sheet, including the headers.
Updates to the dataset will only be saved to be used by other steps in your Flow once you click the "Save this sheet" button.
Tips
- Max 100 rows and 100 columns
- The first row represents column headers used by subsequent steps
- Sheets don’t accept formulas or formatting, only raw data
Integration:
CSV file
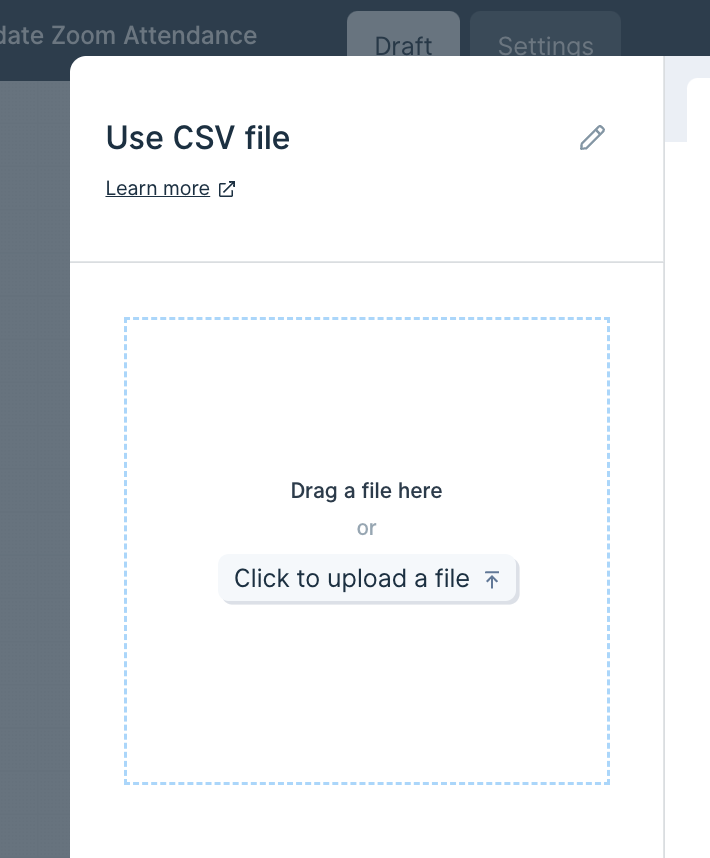
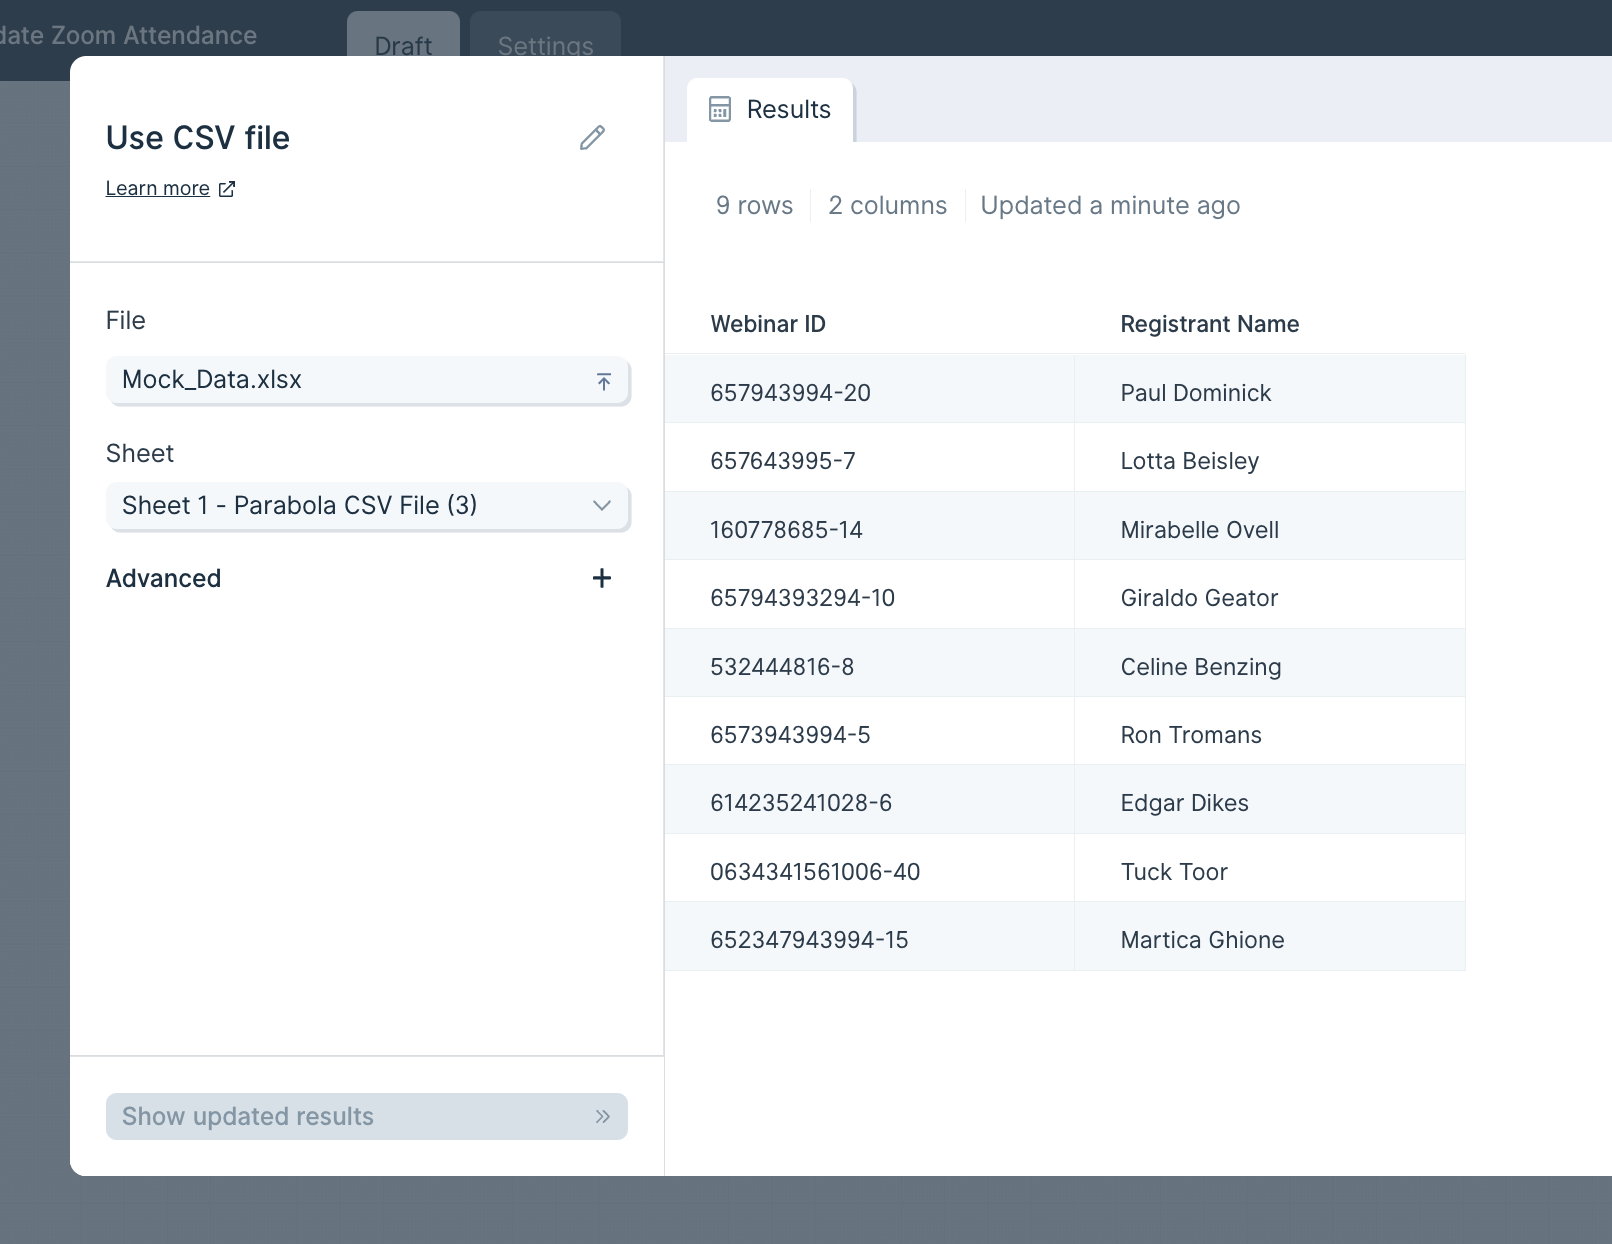
The Use CSV file step enables you to pull in tabular data from a CSV, TSV, or a semicolon delimited file.
Custom Settings
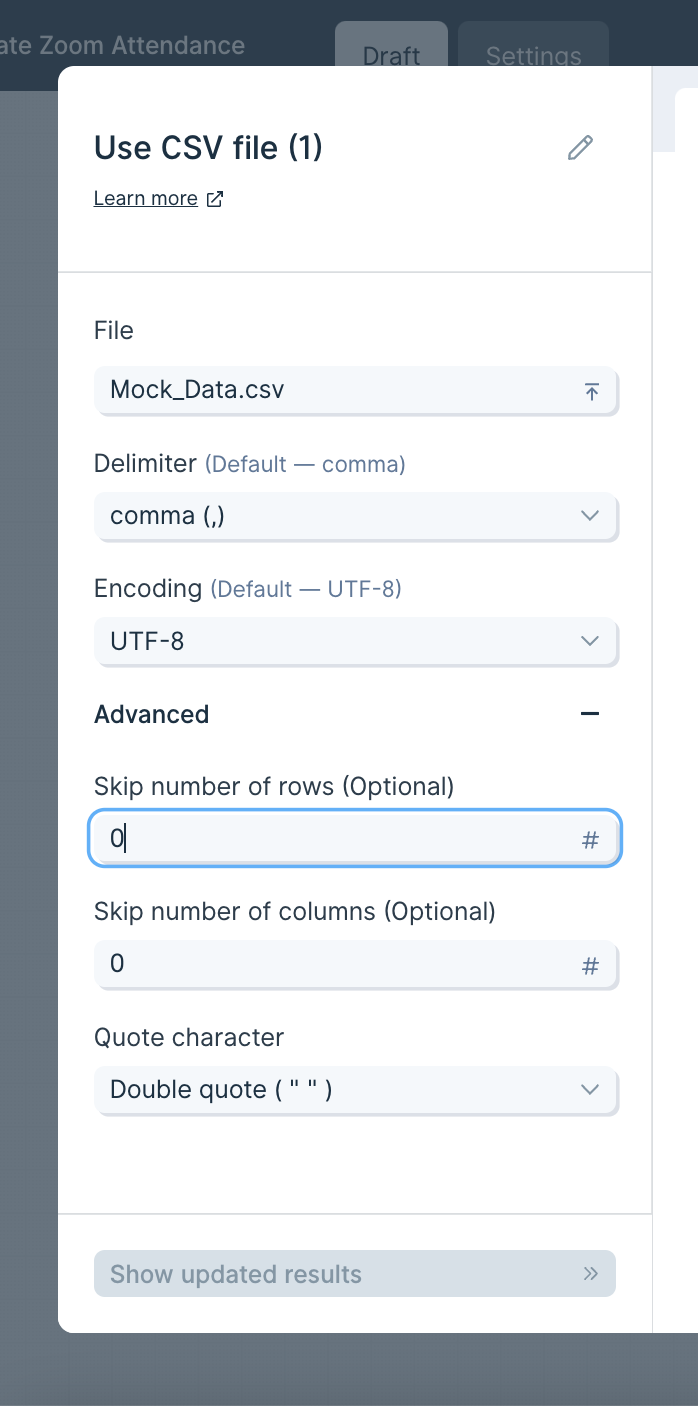
The first thing to do when using this step is to either drag a file into the outlined box or select "Click to upload a file".
Once the file is uploaded and displayed in the Results tab, you'll see two settings on the lefthand side: File and Delimiter. You can click File to upload a different file. Parabola will default to using a comma delimiter, but you can always update the appropriate delimiter for your file by clicking on the Delimiter dropdown. Comma , , tab \t, and semi-colon ; are the three delimiter types we support.
In the "Advanced Settings", you can set a number of rows and a number of columns to skip when importing your data. This will skip rows from top-down and columns from left-to-right. You can also select a Quote Character which will help make sure data with commas in the values/cells don’t disrupt the CSV structure.
Helpful Tips
- Security: the files you upload through this step are stored by Parabola. We store the data as a convenience, so that the next time you open the flow, the data is still loaded into it. Your data is stored securely in an Amazon S3 Bucket, and all connections are established over SSL and encrypted.
- Limitations: Parabola can't pull in updates to this file from your computer automatically, so you must manually upload the file's updates if you change the original file. Formatting and formulas from a file will not be preserved. When you upload this file, all formulas are converted to their value and formatting is stripped.
The "Generate CSV file" step allows you to export tabular data as a CSV file. You can use it to create custom datasets from various sources within your Flow. Once the Flow run is complete, the CSV file can be downloaded from the Flow’s Run History. You can also configure the step to email a download link to the Flow owner.
Custom Settings
Once you connect your Flow to this export step, it will display a preview of the tabular data to be exported.
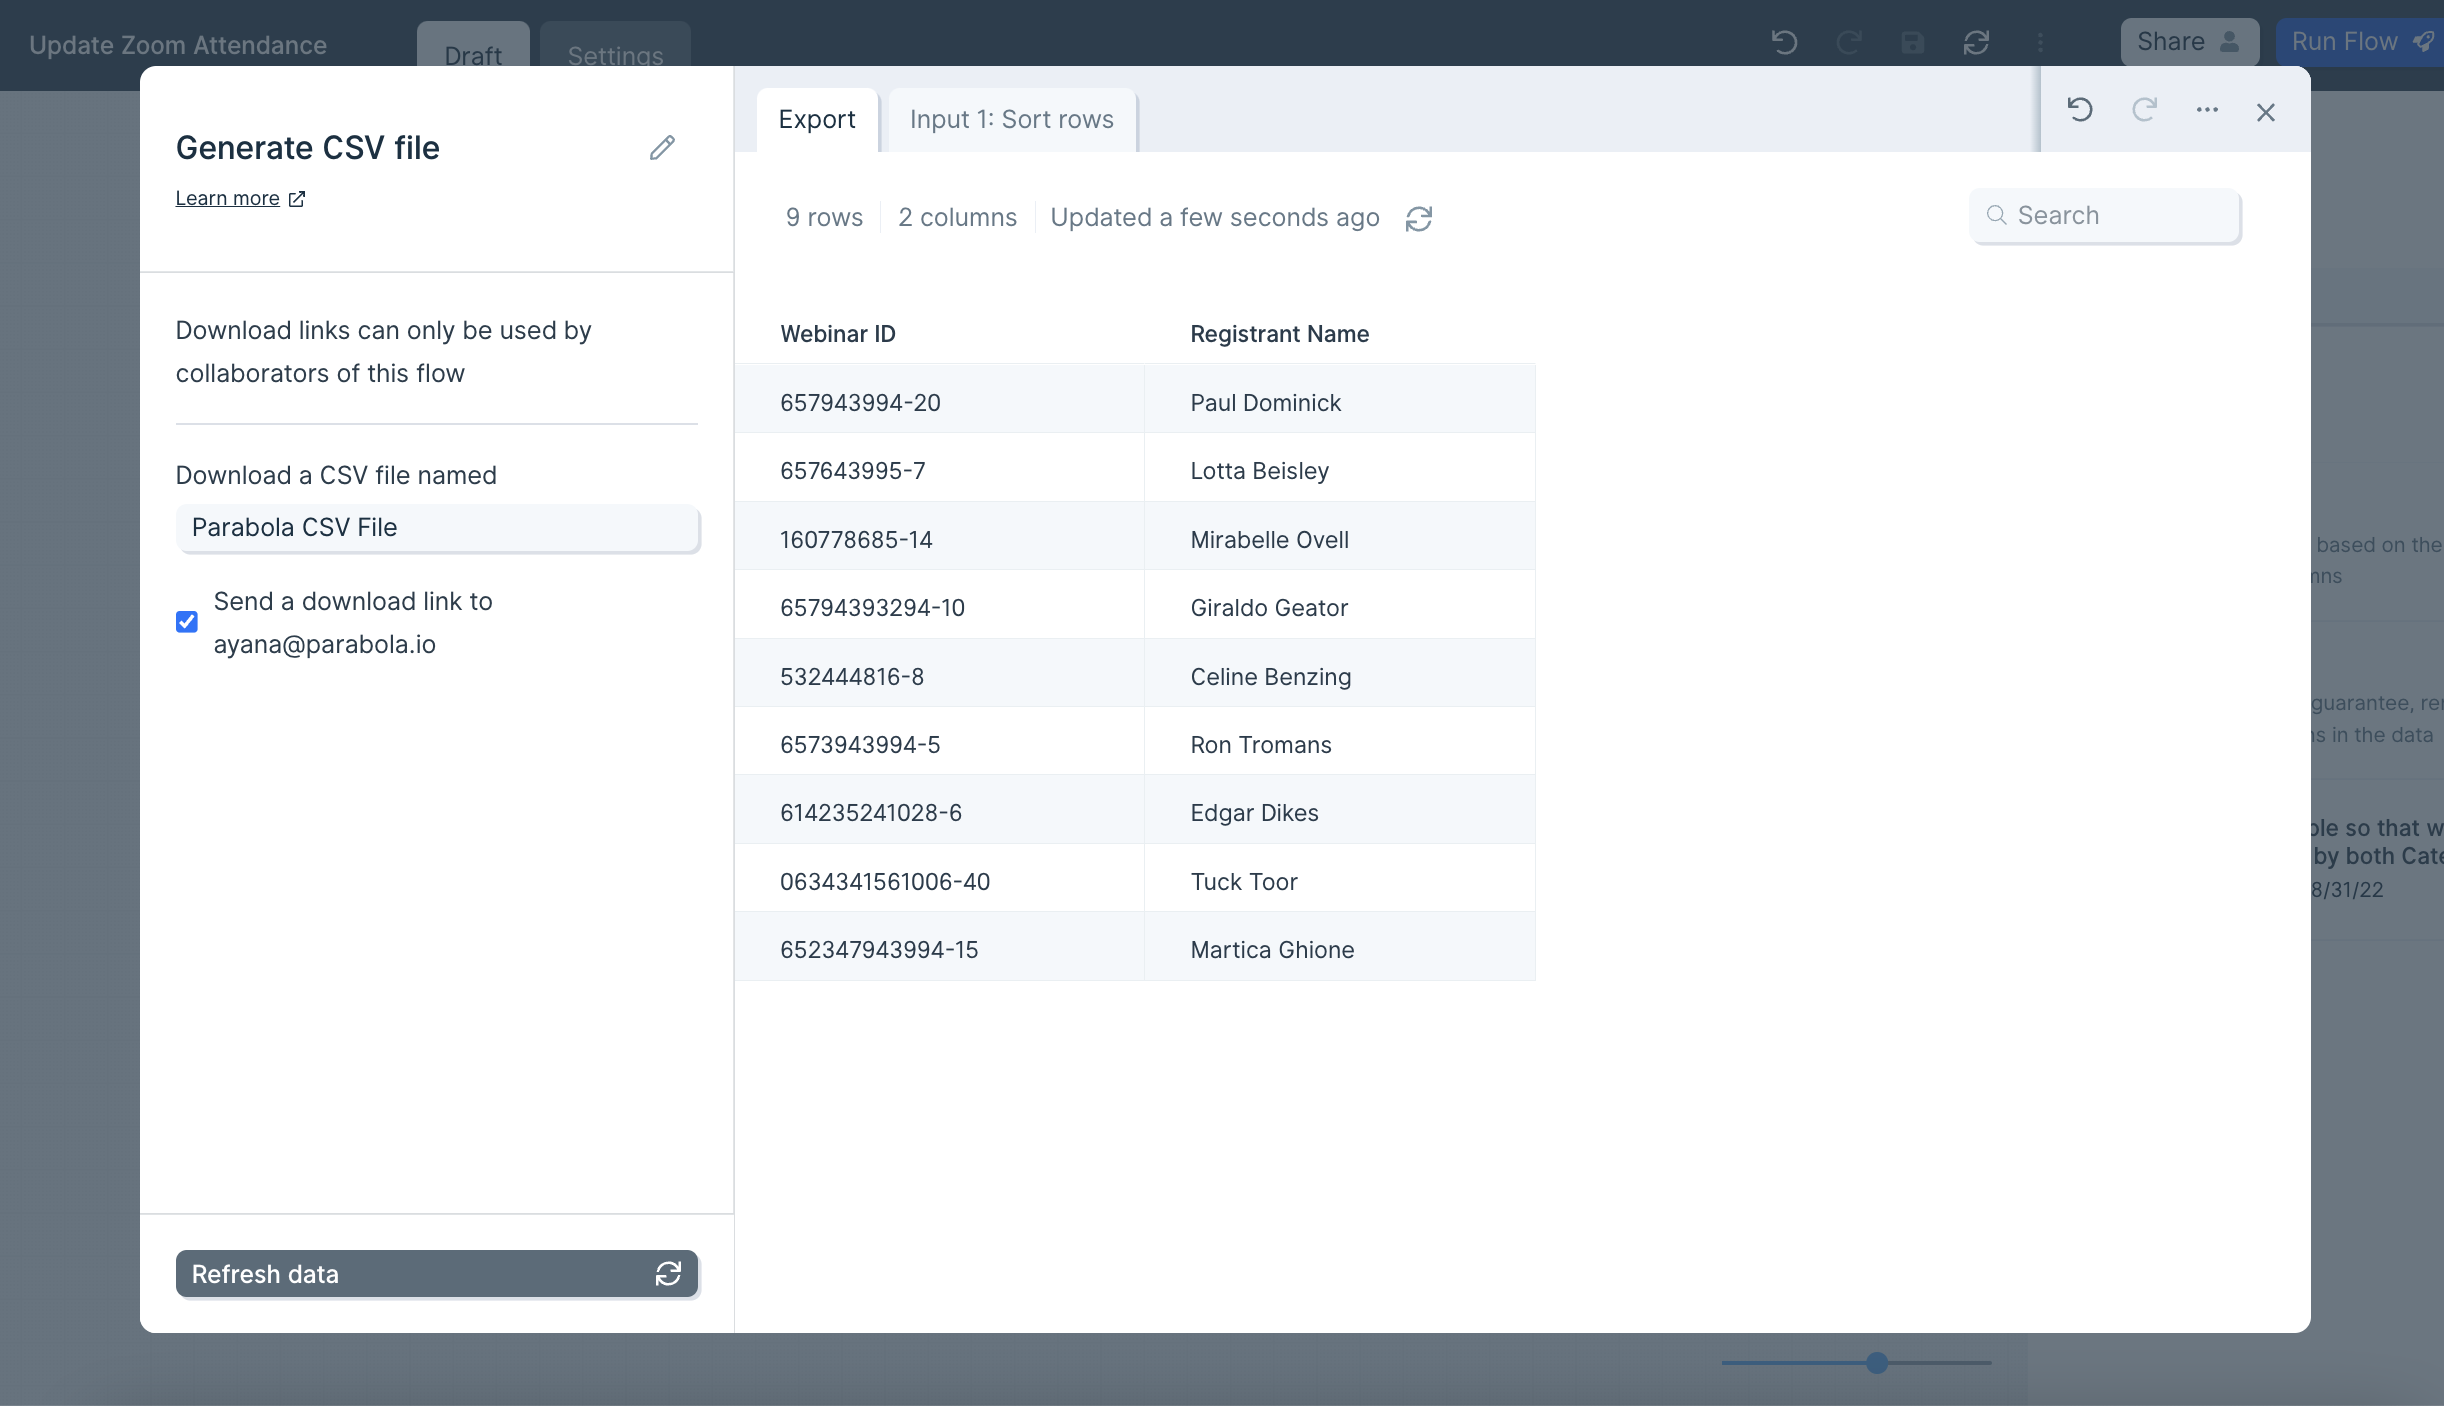
The name of the generated file will match the step’s title. To rename your custom dataset file, simply double-click the step title and enter a new name.
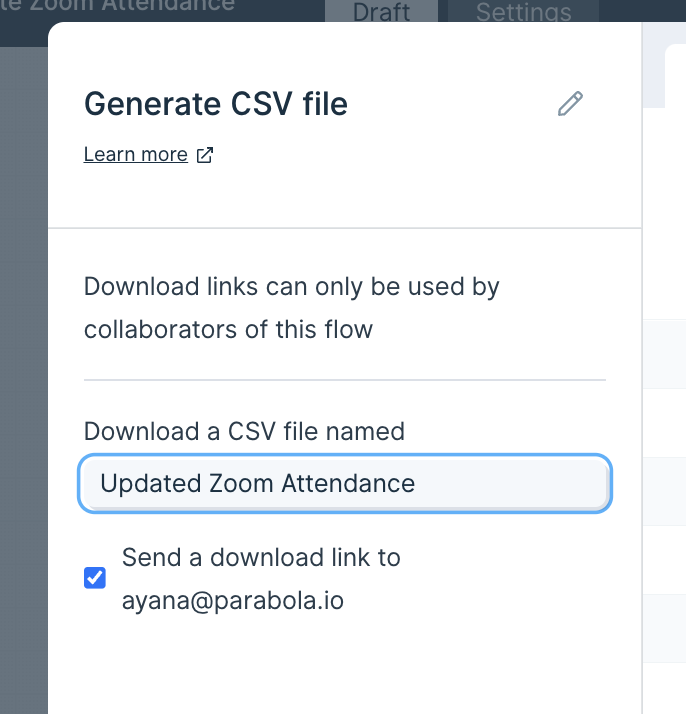
After publishing and running your Flow, you can download the generated CSV file from the Flow’s Run History panel. Past CSVs created by this step are also accessible there.
You can optionally configure the step to email a download link to the Flow owner when the run is complete. Please note that this link will expire after 24 hours.
If the step receives zero rows of data as input, no CSV file will be generated and no download link will be emailed.

Helpful Tips
Security
Files generated by this step are stored by Parabola for your convenience. This allows the data to be reloaded the next time you open the Flow. Your data is stored securely in an Amazon S3 bucket, with all connections established over SSL and encrypted.
Limitations
This step supports only one input source at a time.
If your Flow includes multiple branches or datasets, you'll need to connect each one to its own Generate CSV file step to export them separately.
Alternatively, consider using the "Generate Excel file" step, which allows multiple inputs and creates a single Excel file with each input as a separate tab.
Integration:
Date & time
The Start with date & time row step creates a single row with the current date and time, with customizable offsets by day and timezones. As its name indicates, this step is a starting step so it does not accept any inputs. The current date and time will be determined automatically at the time the flow is run.
You would start your flow off with the Start with date & time row if you need relative date data as one of your data sources. The most common use for this step is if you need to provide date variables when working with APIs. Many APIs require dates to be sent in order to pull the information that you need. Since manually adjusting those dates before every flow run would defeat the purpose of an automation, this Start with date & time row solves for that.
Customize settings
You can add multiple rules to this step by clicking on the blue Add Date & Time Rule link. Each rule will be represented in a new column.
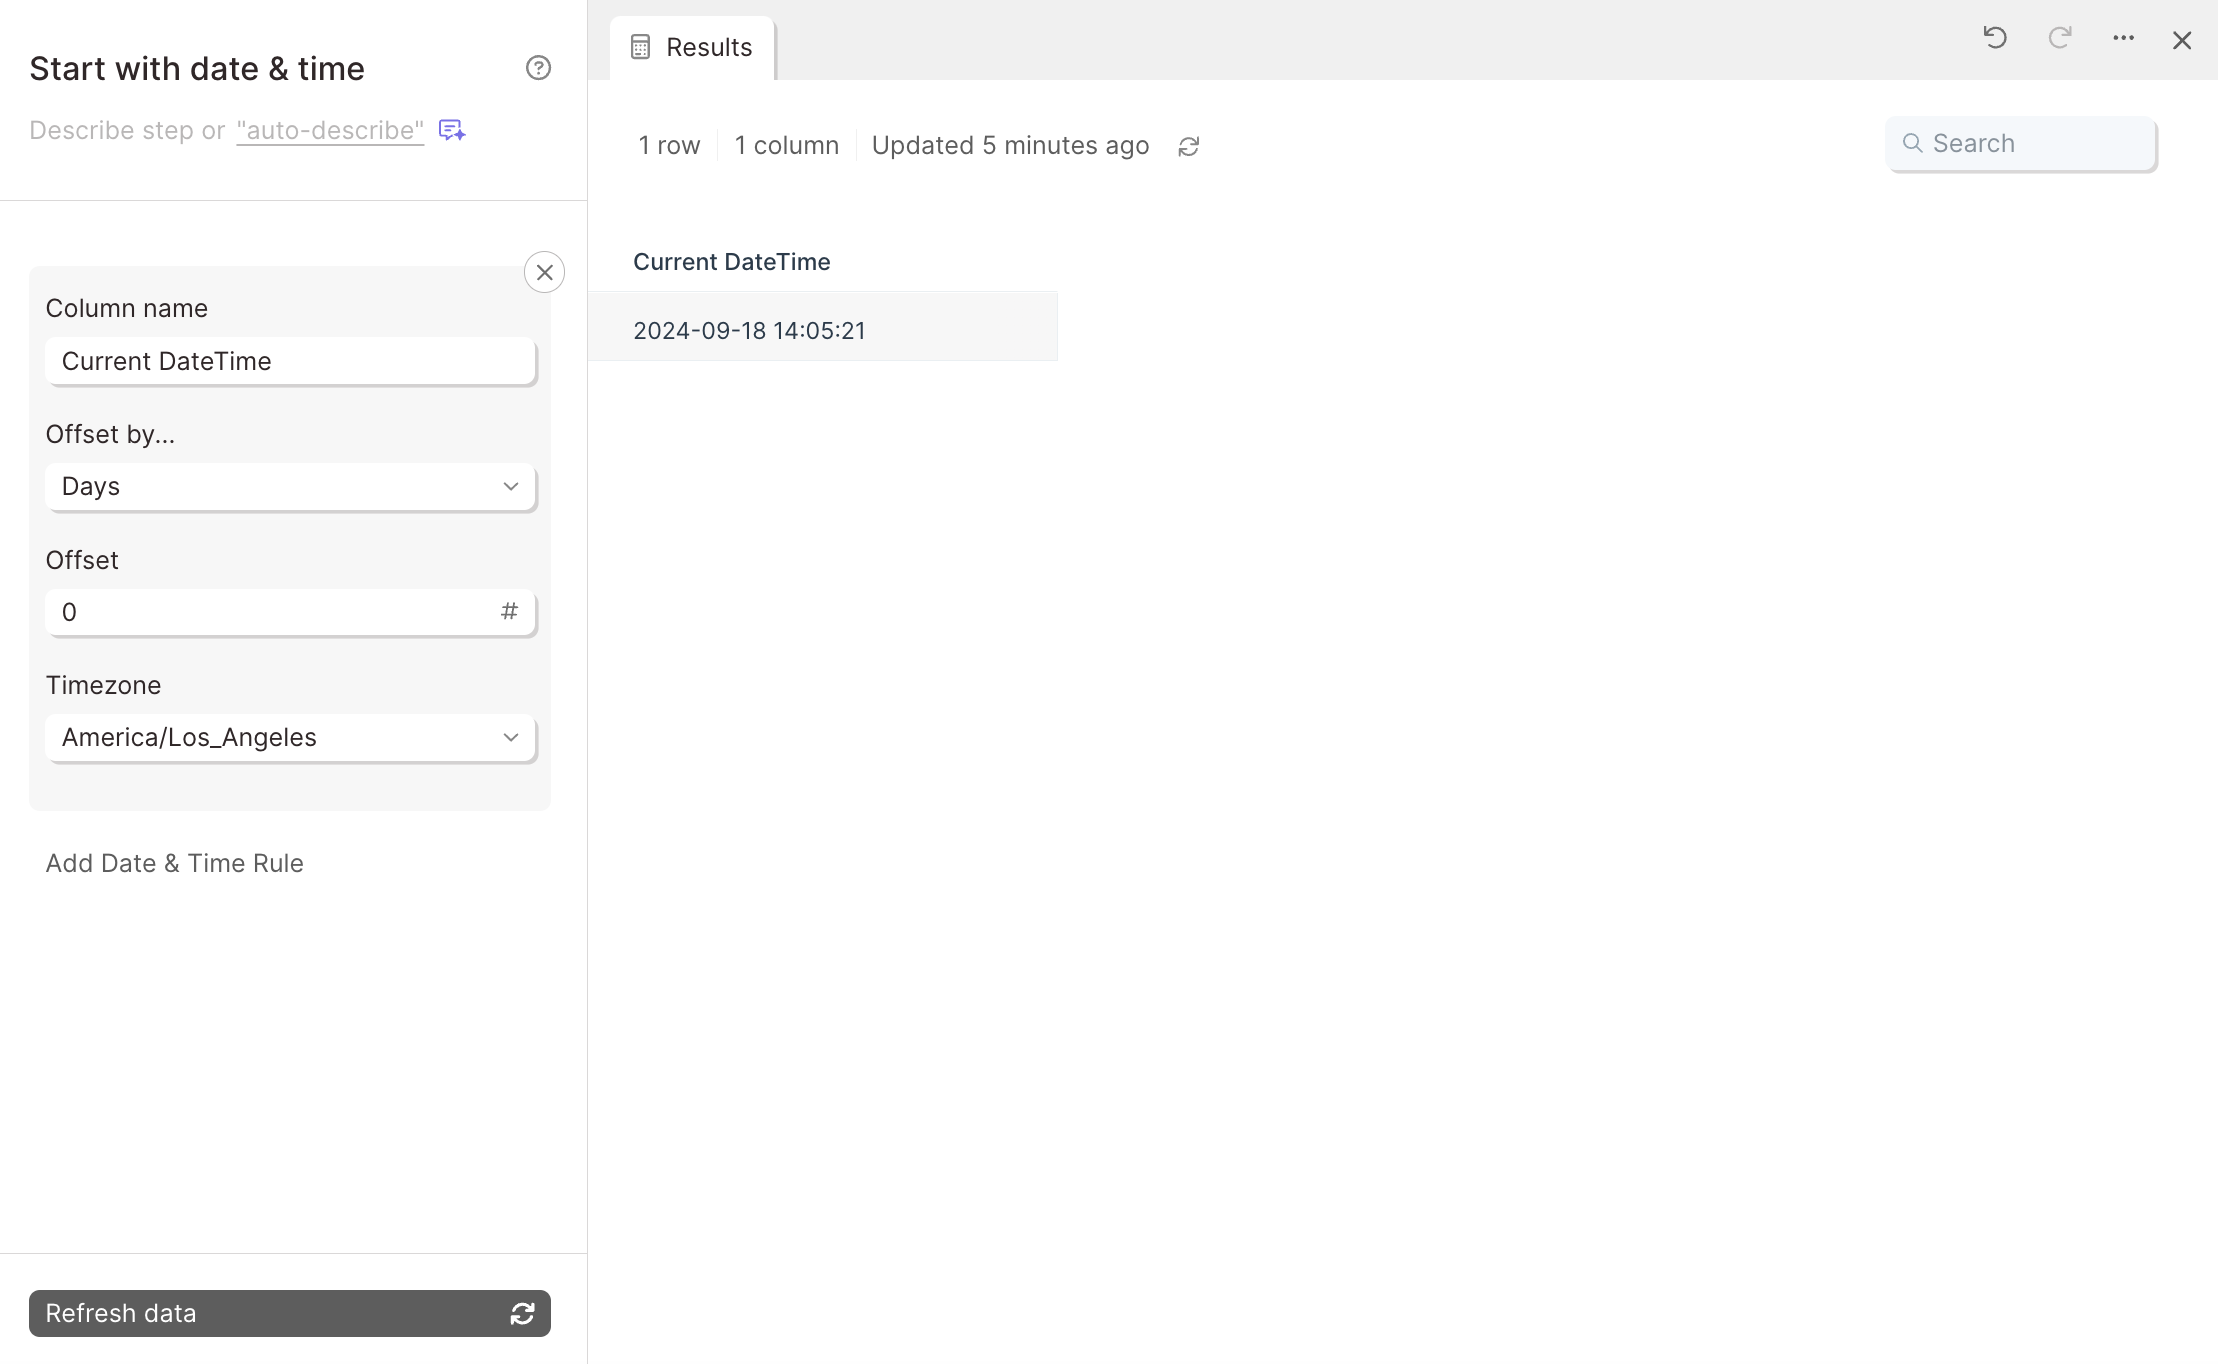
By default, the Days Offset field will be set to 0, meaning the date displayed is the current date and time. If you choose a positive value for the offset, it will display a future date, and if you choose a negative value, it will display a past date.
All date and time values created by this step look like this: 2019-09-18 12:33:09 which is a format of YYYY-MM-DD hh:mm:ss. If you prefer a different date format, connect a Format dates step right after this one to get the date values in your preferred format.
Integration:
Deposco
How to authenticate
Deposco uses OAuth 2.0 for secure API access. To connect Deposco with Parabola, you'll need to create an application in the Deposco Developer Portal and obtain your API credentials.
- Create an application in the Deposco Developer Portal
- Log in to the Deposco Developer Portal.
- Navigate to Applications and click Create Application.
- Complete the application form, including required access scopes (select the data types you need to access)
- Since this step currently only pulls data, you only need to grant Read access.
- Submit your application for Deposco review and approval.
- Once approved, you'll receive a Client ID and Client Secret on your application's detail page.
- Install the application in your Deposco environment
- After approval, use the installation link provided in the Developer Portal.
- A user with admin access to your Deposco environment must open the link, log in, and grant access to the application.
- This generates a Refresh Token for your application.
- Connect in Parabola
- In your Parabola flow, add a Pull from Deposco step.
- Click Authorize and enter your credentials:
- Client ID: From the Developer Portal
- Client Secret: From the Developer Portal
- Refresh Token: Generated during application installation
Available data
Using the Deposco integration in Parabola, you can pull in a wide range of warehouse and supply chain data:
- Inventory items and adjustments. SKUs, descriptions, dimensions, weights, pricing, UPCs, and item tracking settings. Select specific inventory by facility, location, lot number, serial number, and inventory condition.
- Orders. Outbound fulfillment orders with customer details, line items, order status, and fulfillment dates.
- Customer orders (B2C and B2B) managed through Deposco's order management system
- Purchase Orders: Inbound orders from suppliers with vendor details, line items, and expected receipt dates
- Transfer Orders: Inbound and outbound transfers between facilities with shipment tracking
- Returns. Return merchandise authorizations (RMAs) with return reasons and disposition, and returns to suppliers with order and shipment details
- Outbound Shipments. Shipped orders with tracking numbers, carrier details, packages, costs, and delivery status
- Receipts. Received quantities for purchase orders and inbound shipments by item, lot, and location
- Warehouse operations information, such as facilities (warehouse and distribution center details including addresses, contacts, and operational settings) and locations (specific storage areas within facilities with zone assignments and storage details).
Common use cases
- Audit carrier invoices by reconciling billed shipping costs against actual weights, dimensions, and rates.
- Analyze carrier performance by comparing planned vs. actual ship dates and delivery times.
- Compare order data between Deposco and sales channels like Shopify or Amazon to catch sync issues.
- Set up automated alerts when inventory falls below reorder points or reaches maximum capacity.
- Match order data between Deposco, your ERP (like NetSuite), and sales channels to ensure consistency.
- Generate daily fulfillment summaries showing orders picked, packed, and shipped by facility or customer.
Tips for using Parabola with Deposco
- Schedule your flows strategically to run inventory and order flows hourly during peak fulfillment windows to catch issues quickly
- Combine data sources for deeper insights like joining inventory data with order lines to analyze which products are selling vs. sitting in stock.
- Set up proactive alerts to send Slack or email notifications when exceptions occur, when inventory falls below safety stock levels, or when receipts don't match expected quantities
- Document your flows using cards to explain complex transformations or business logic. Document any custom formulas or calculations so your team can maintain the flow.
By connecting Deposco with Parabola, you transform raw warehouse data into actionable insights, automate time-consuming reconciliations, and create real-time visibility across your entire fulfillment operation—all without waiting for engineering support.
Integration:
DHL
The DHL Shipment Tracking API is used to provide up-to-the-minute shipment status reports by retrieving tracking information for shipments, identifying DHL service providers, and verifying DHL delivery addresses.
DHL is a beta integration which requires a slightly more involved setup process than our native integrations. Following the guidance in this document should help even those without technical experience pull data from DHL. If you run into any questions, shoot our team an email at support@parabola.io.
Use Cases
🤝 DHL | Integration configuration
📖 DHL Reference docs:
https://developer.dhl.com/api-reference/shipment-tracking#reference-docs-section
🔐 DHL Authentication doc links:
https://developer.dhl.com/api-reference/shipment-tracking#get-started-section/user-guide
Instructions
1. Click My Apps on the portal website.
2. Click the + Add App button.
3. The “Add App” form appears.
4. Complete the Add App form.
5. You can select the APIs you want to access.
6. When you have completed the form, click the Add App button.
7. From the My Apps screen, click on the name of your app. The Details screen appears.
8. If you have access to more than one API, click the name of the relevant API.
⚠️ Note: The APIs are listed under the Credentials section.
9. Click the Show link below the asterisk that is hiding the Consumer Key.
🔐 Parabola | Authentication configuration
1. Add an Enrich tracking from DHL step template to your canvas.
2. Click into the Enrich with API: DHL Tracking step to configure your authentication.
3. Under the Authentication Type, select None.
4. Click into the Request Settings to configure your request using the format below:
Request Headers
Example Screenshot
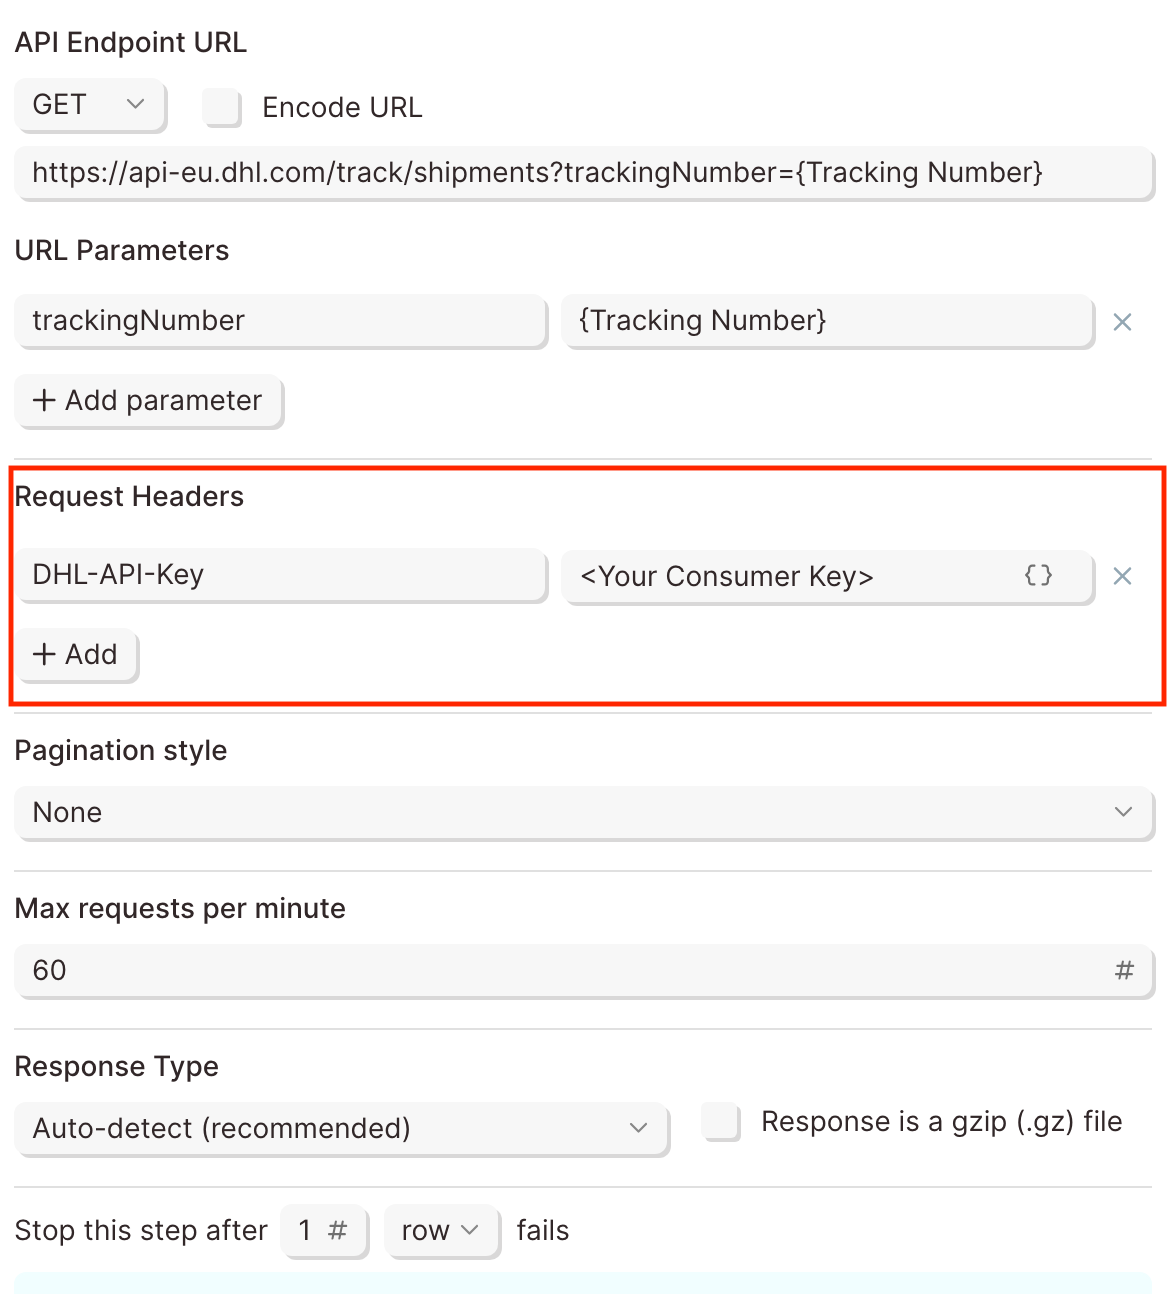
🌐 DHL | Sample API Requests
Track DHL Shipment Statuses by tracking number
Get started with this template.
Test URL
https://api-test.dhl.com/track/
Production URL
https://api-eu.dhl.com/track/
1. Add a Use sample data step to your Flow. You can also import a dataset with tracking numbers into your Flow. (Pull from Excel File, Pull from Google Drive, Pull from API, Use sample data, etc.)
💡 Tip: When using your own data, use the Edit columns step to rename the tracking column in your source data to Tracking Number.
2. Connect it to the Enrich with API: DHL Tracking step.
3. Under Authentication Type, select None.
4. Click into the Request Settings to configure your request using the format below:
API Endpoint URL
💡 Tip: The Enrich with API step makes dynamic requests for each row in the table by inserting the tracking number in the API Endpoint URL.
The example above assumes, there is a Tracking Number column and is referenced using curly brackets:{Tracking Number}
Enclose your column header containing tracking numbers with curly brackets to dynamically reference the tracking numbers in your table.
Request Headers
5. Click Refresh data to display the results.
Example Screenshot
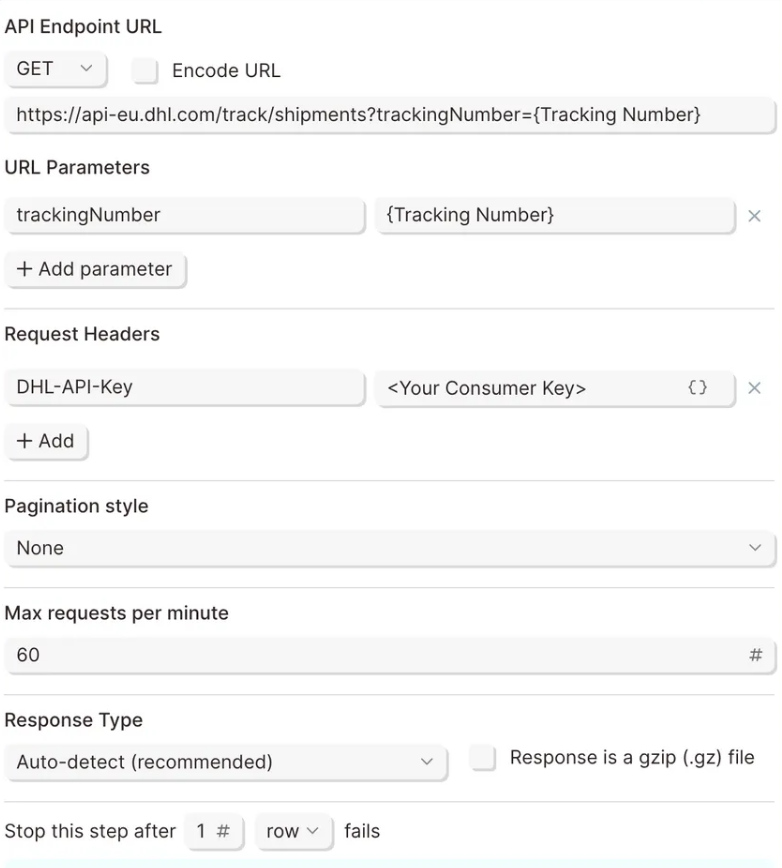
📣 Callouts
⚠️ Note: Rate limits protect the DHL infrastructure from suspicious requests that exceed defined thresholds.
When you first request access to the API, you will get the initial service level which allows 250 calls per day with a maximum of 1 call every 5 seconds.
Additional rate limits are available and they are granted according to your specific use case. If you would like to request for additional limits, please proceed with the following steps:
1. Create an app as described under the Get Access section.
2. Click My Apps on the portal website.
3. Click on the App you created.
4. Scroll down to the APIs list and click on the "Request Upgrade" button.
Integration:
DocSpring
Use the Send to DocSpring step to automatically create submissions for your DocSpring PDF Templates.
Connect your DocSpring account
To connect to your DocSpring account, you'll first need to click the blue "Authorize" button.
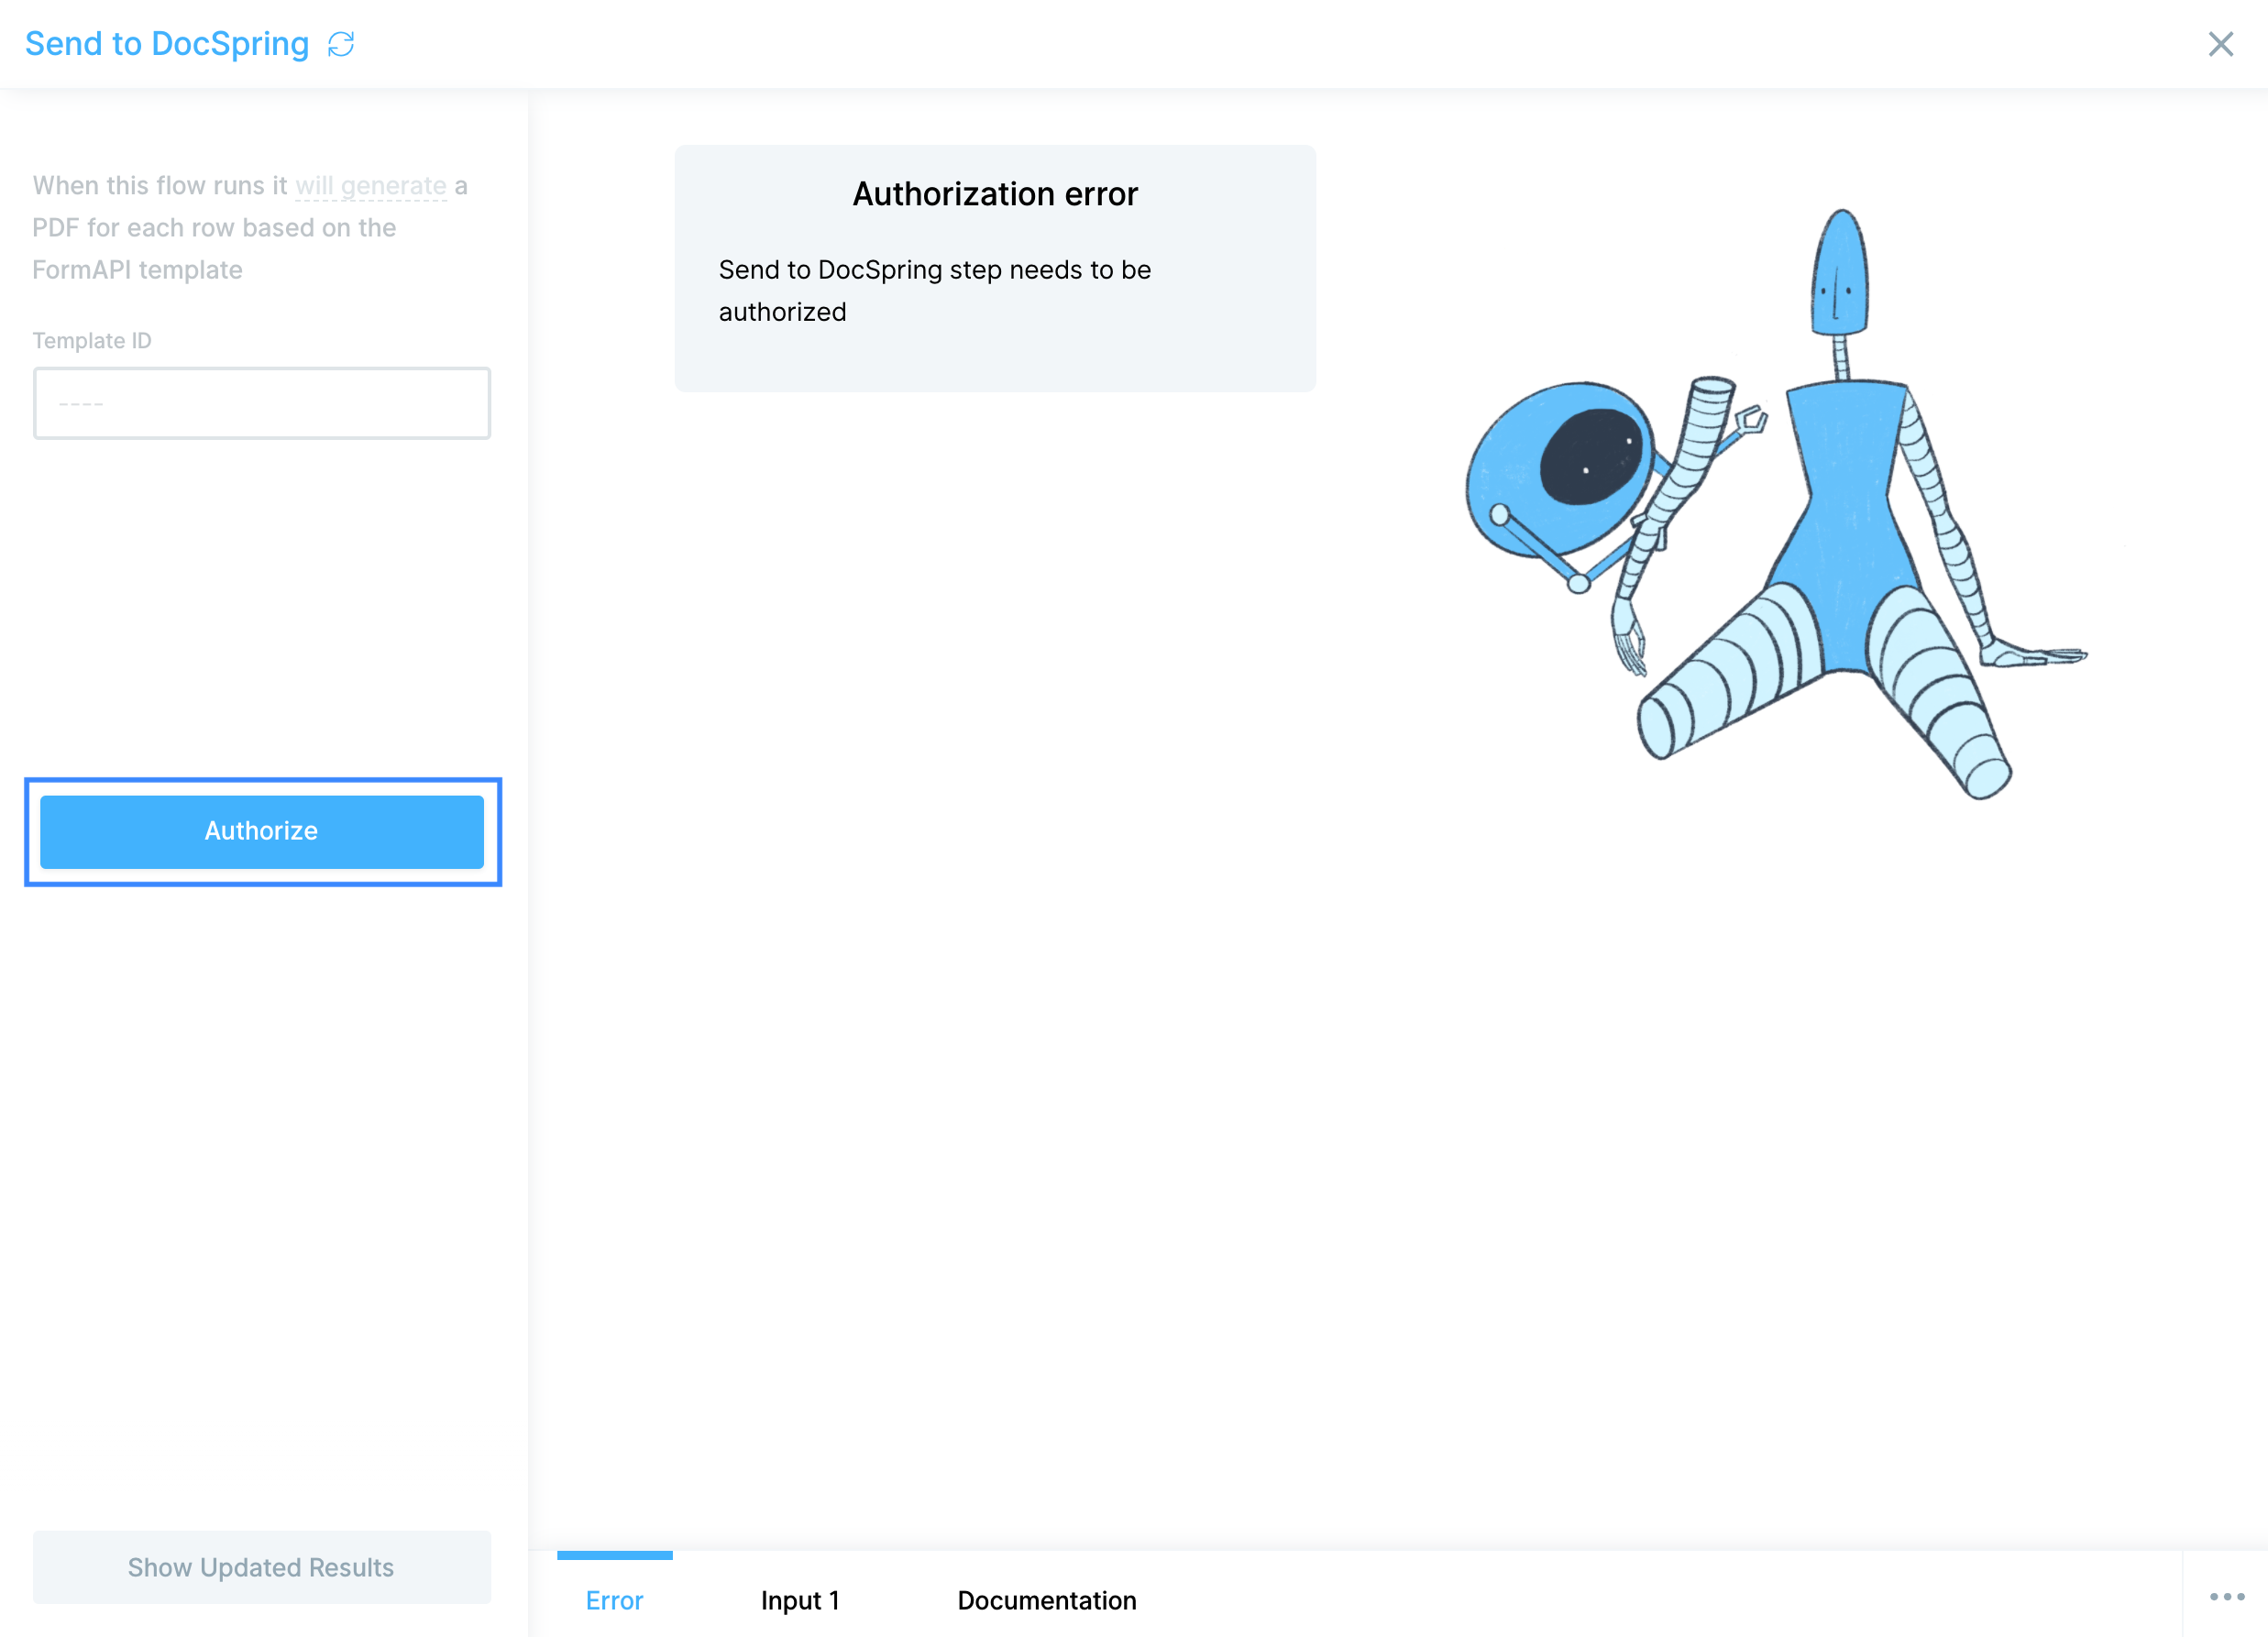
You'll need your DocSpring API Token ID and your DocSpring API Token Secret to proceed. To do so, visit your API Token settings in DocSpring.
Reminder: if you're creating a new API Token, the Token Secret will only be revealed immediately after creating the new Token. Be sure to copy and paste or write it down in a secure location. Once you've created or copied your API Token ID and Secret, come back to Parabola and paste them into the correct fields.

Custom settings
To pull in the correct DocSpring Template, you'll need to locate the Template ID. Open the Template you want to connect in DocSpring and locate the URL. The Template ID is the string of characters following templates/ in the URL:
https://app.docspring.com/templates/{Template ID}
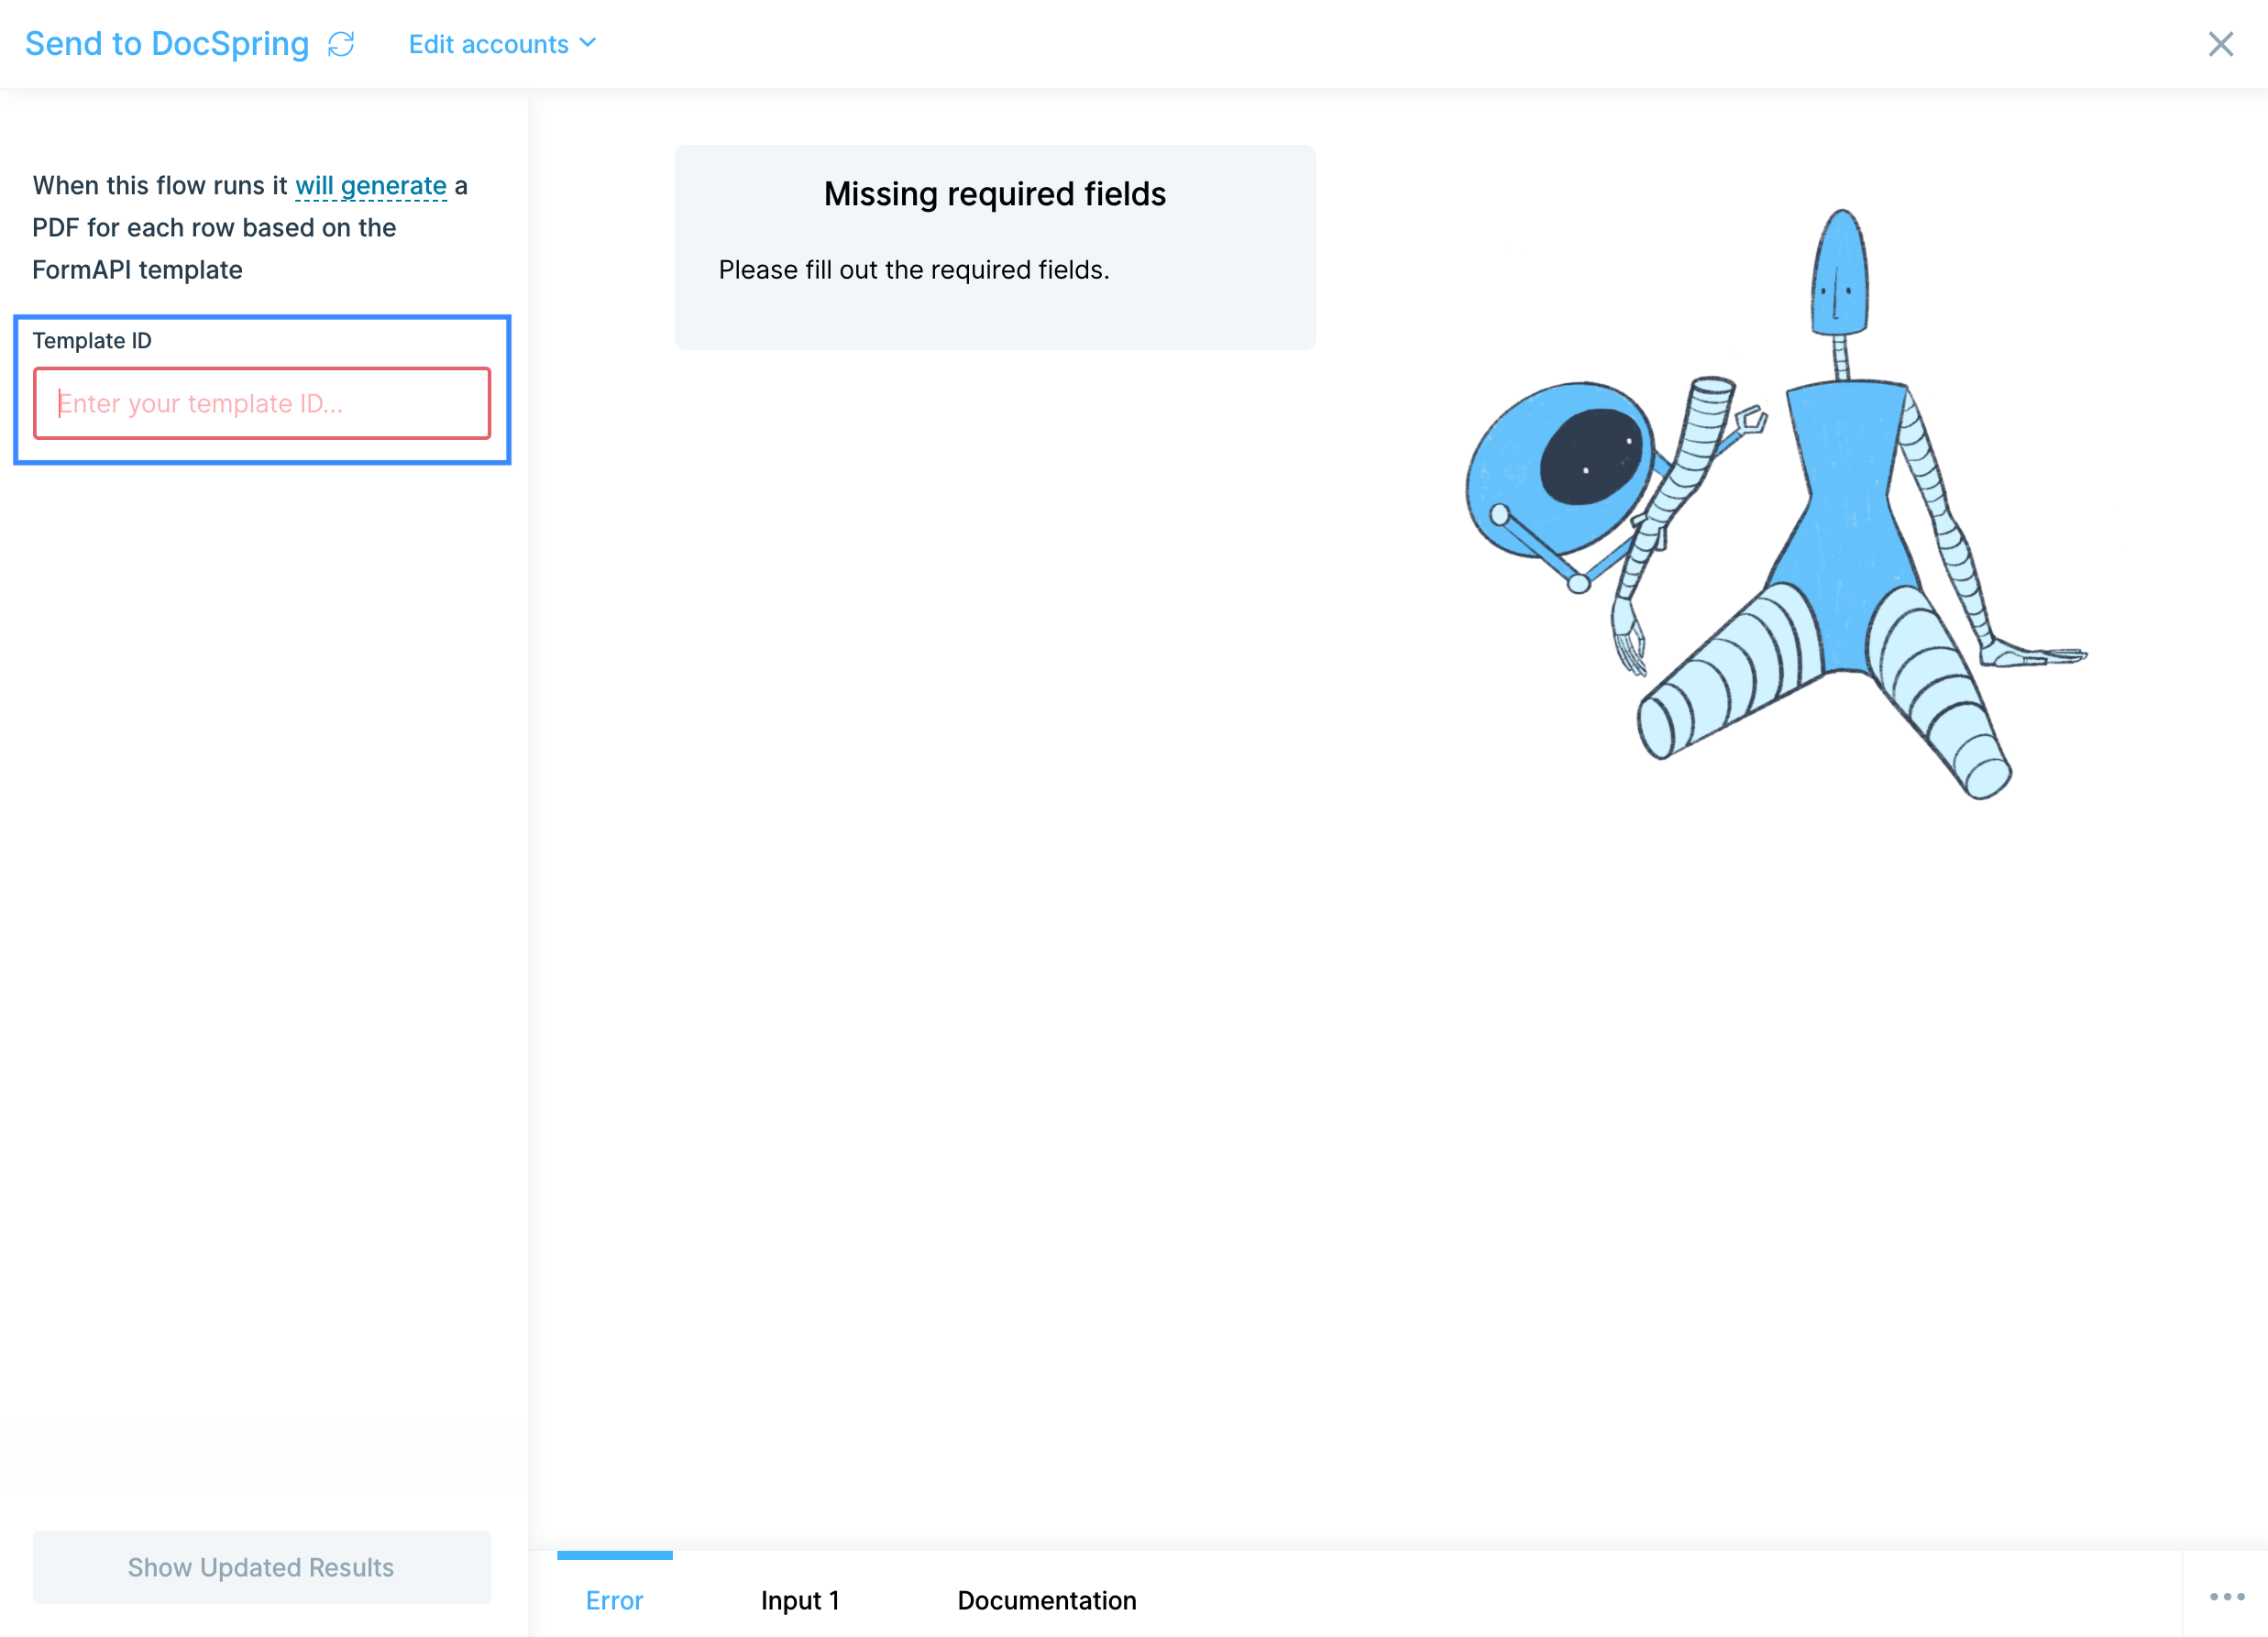
Paste the ID from the URL in the Template ID field.
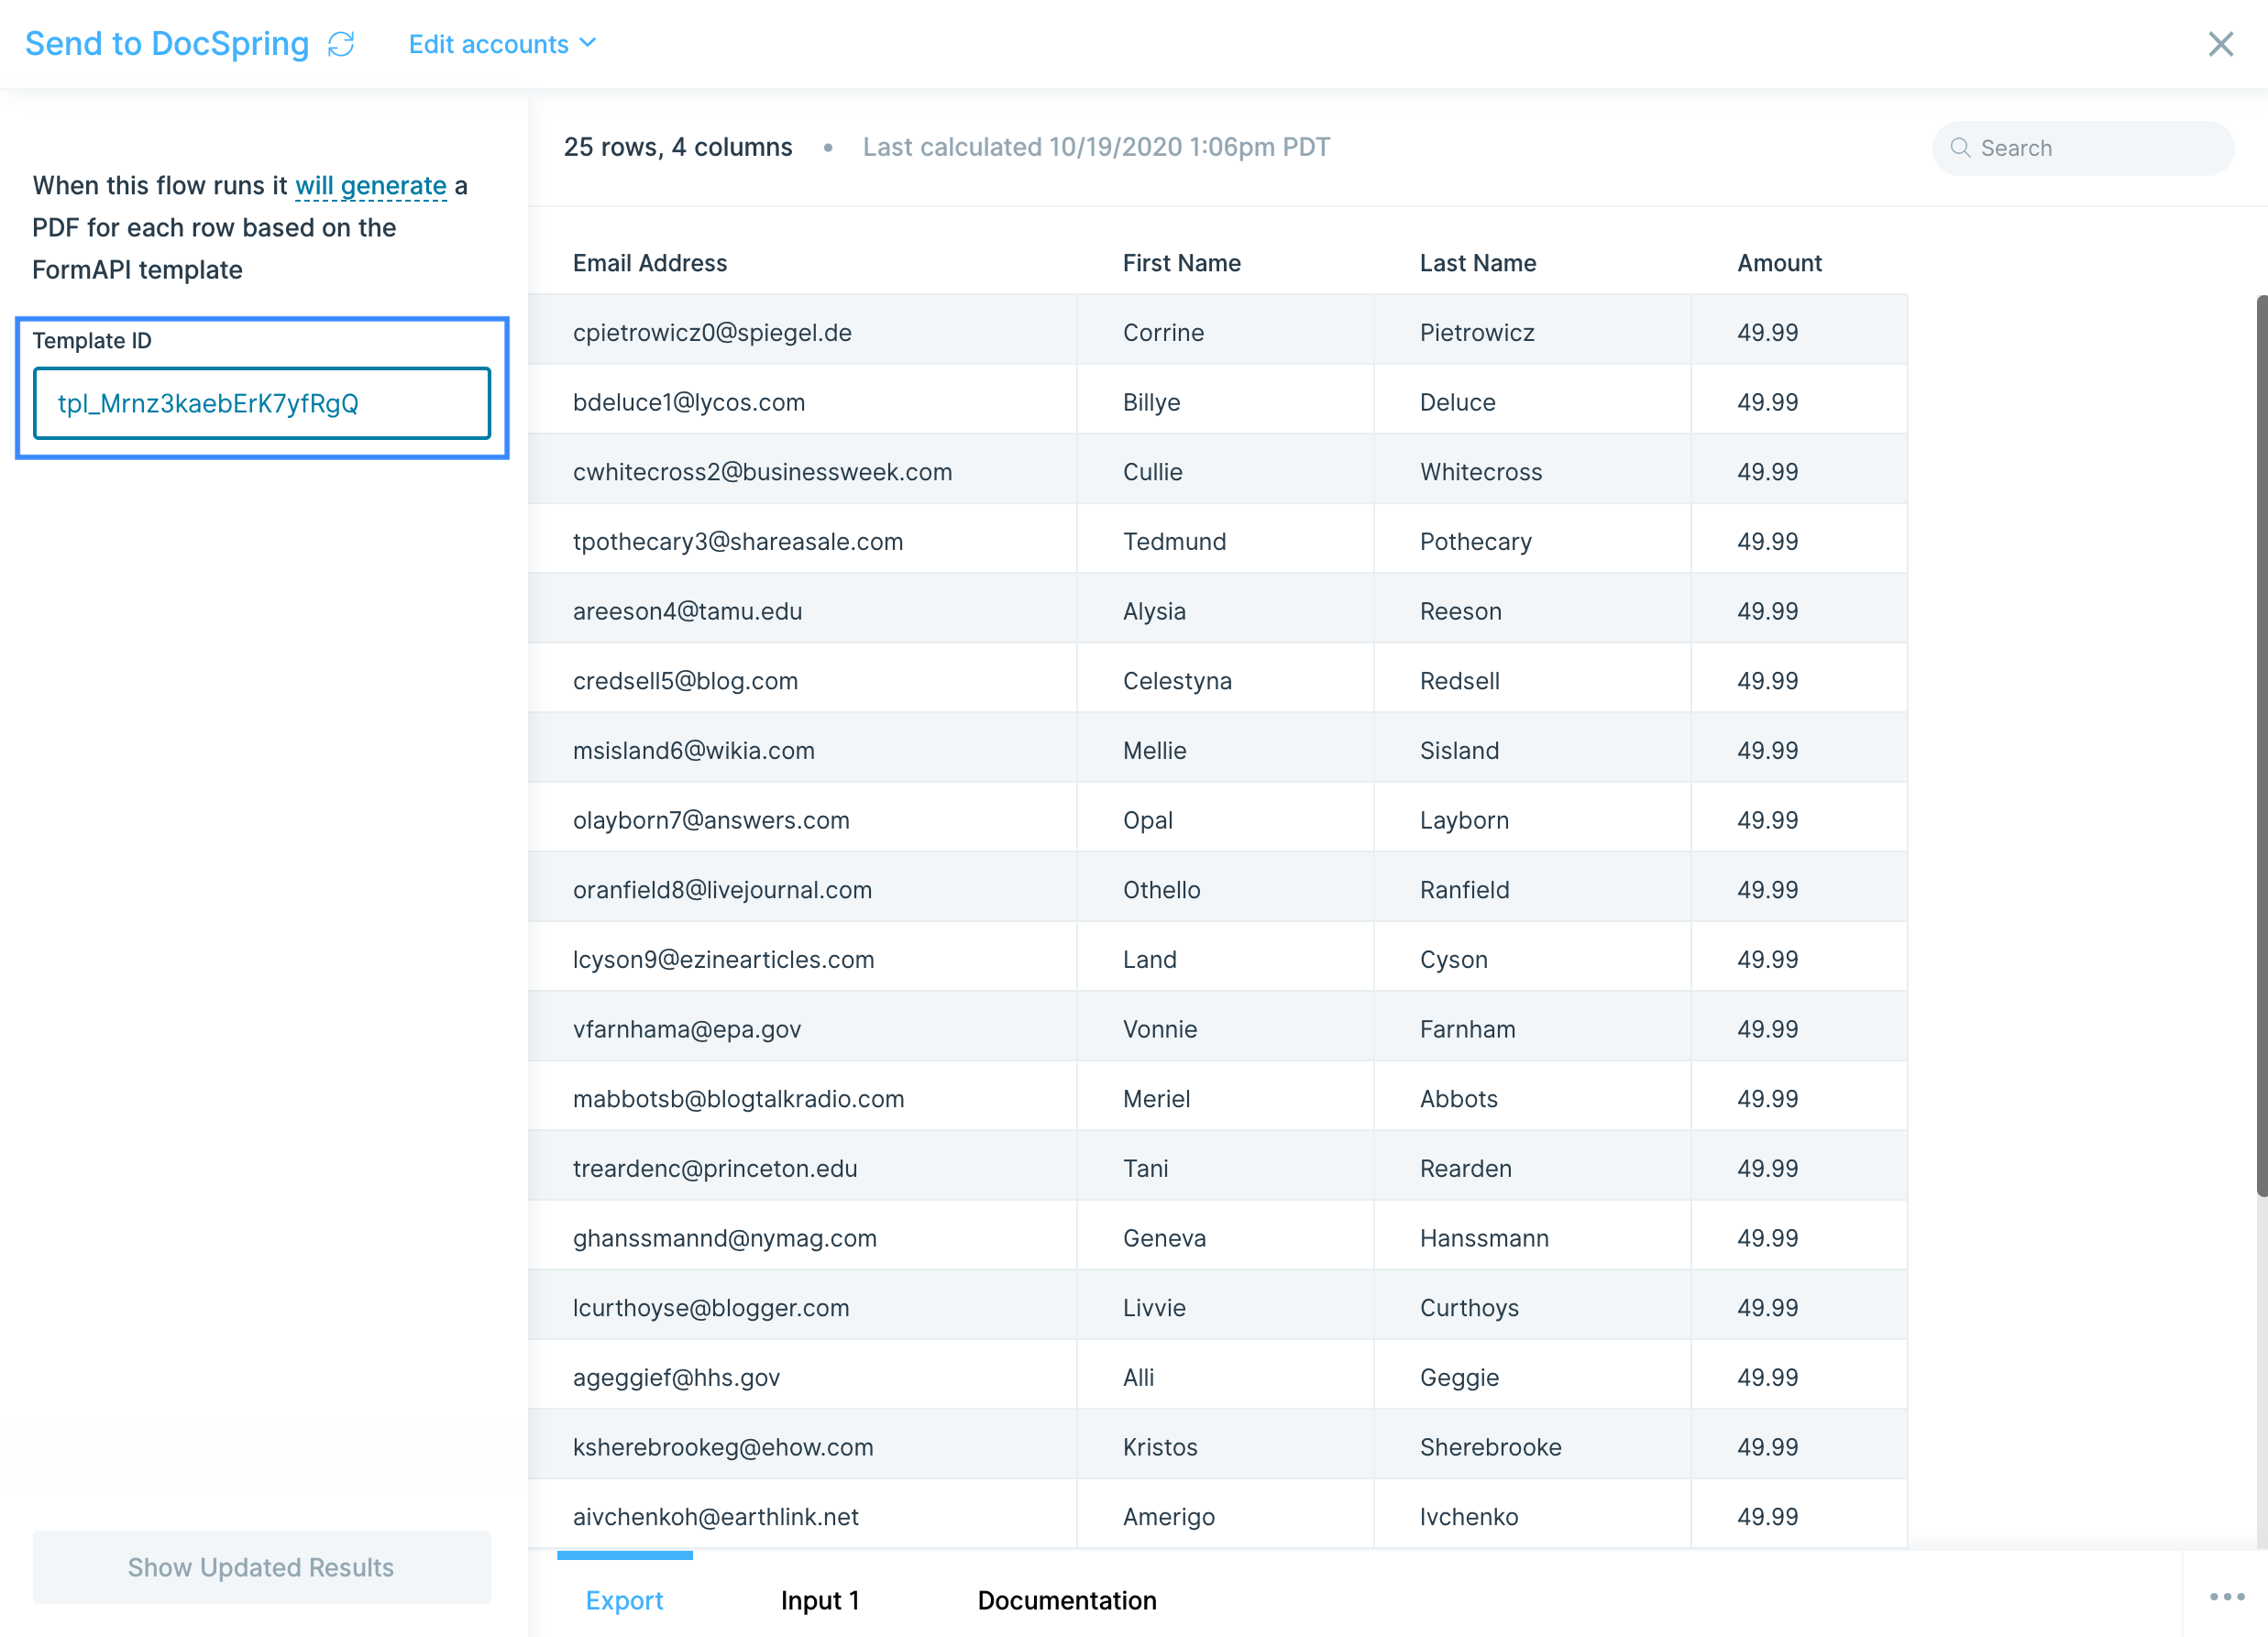
Helpful tips
- Your PDF templates in DocSpring can accept a variety of data types to fill in their fields, however, there are no column mapping options in Parabola. Make sure your column headers match the names of the fields in DocSpring, exactly, to ensure your data fills in the correct predefined field in the PDF.
Integration:
Drip
The Pull from Drip step is a beta step. This means that while it's not a fully built-out integration, it's a preconfigured Pull from an API step that makes it easy to get set up and pull data from Drip using their API.
Drip is a marketing automation platform built for ecommerce.
Connect to your Drip account
You will need the following 3 things to connect to the Drip API:
- Your Account ID
- Your API Key
- A name to call the connection between Parabola and Drip (this can be anything)
You should be able to locate your API Key from your User Settings page on Drip.
Once you've located this information from Drip:
- Add your account ID to the API Endpoint URL where specified
- Add your API Key to the Username field. Please keep the Password field blank.
- Add the name you thought of to the User-Agent header value. This can be anything, but you do need to put something.
Custom settings
By default, the Pull from Drip beta step is set up to pull data from the Subscribers API endpoint which pull a list of all subscribers.
https://api.getdrip.com/v2/YOUR_ACCOUNT_ID/subscribers
You can update that endpoint URL in the API Endpoint URL field if you'd like to pull in other data from Drip's API. You can read their full API docs here.
Helpful tips
- If the Pull from Drip step does not bring back all of your data, try increasing the "Max Pages to Fetch" field so that more pages are fetched.
Integration:
Dropbox
The Pull from Dropbox step gives you the ability to pull in a spreadsheet from your Dropbox account. You can pull in CSV and XLS files from a personal or shared folder.
Connect your Dropbox account
To connect to your Dropbox account, select Authorize to login in with your Dropbox credentials.
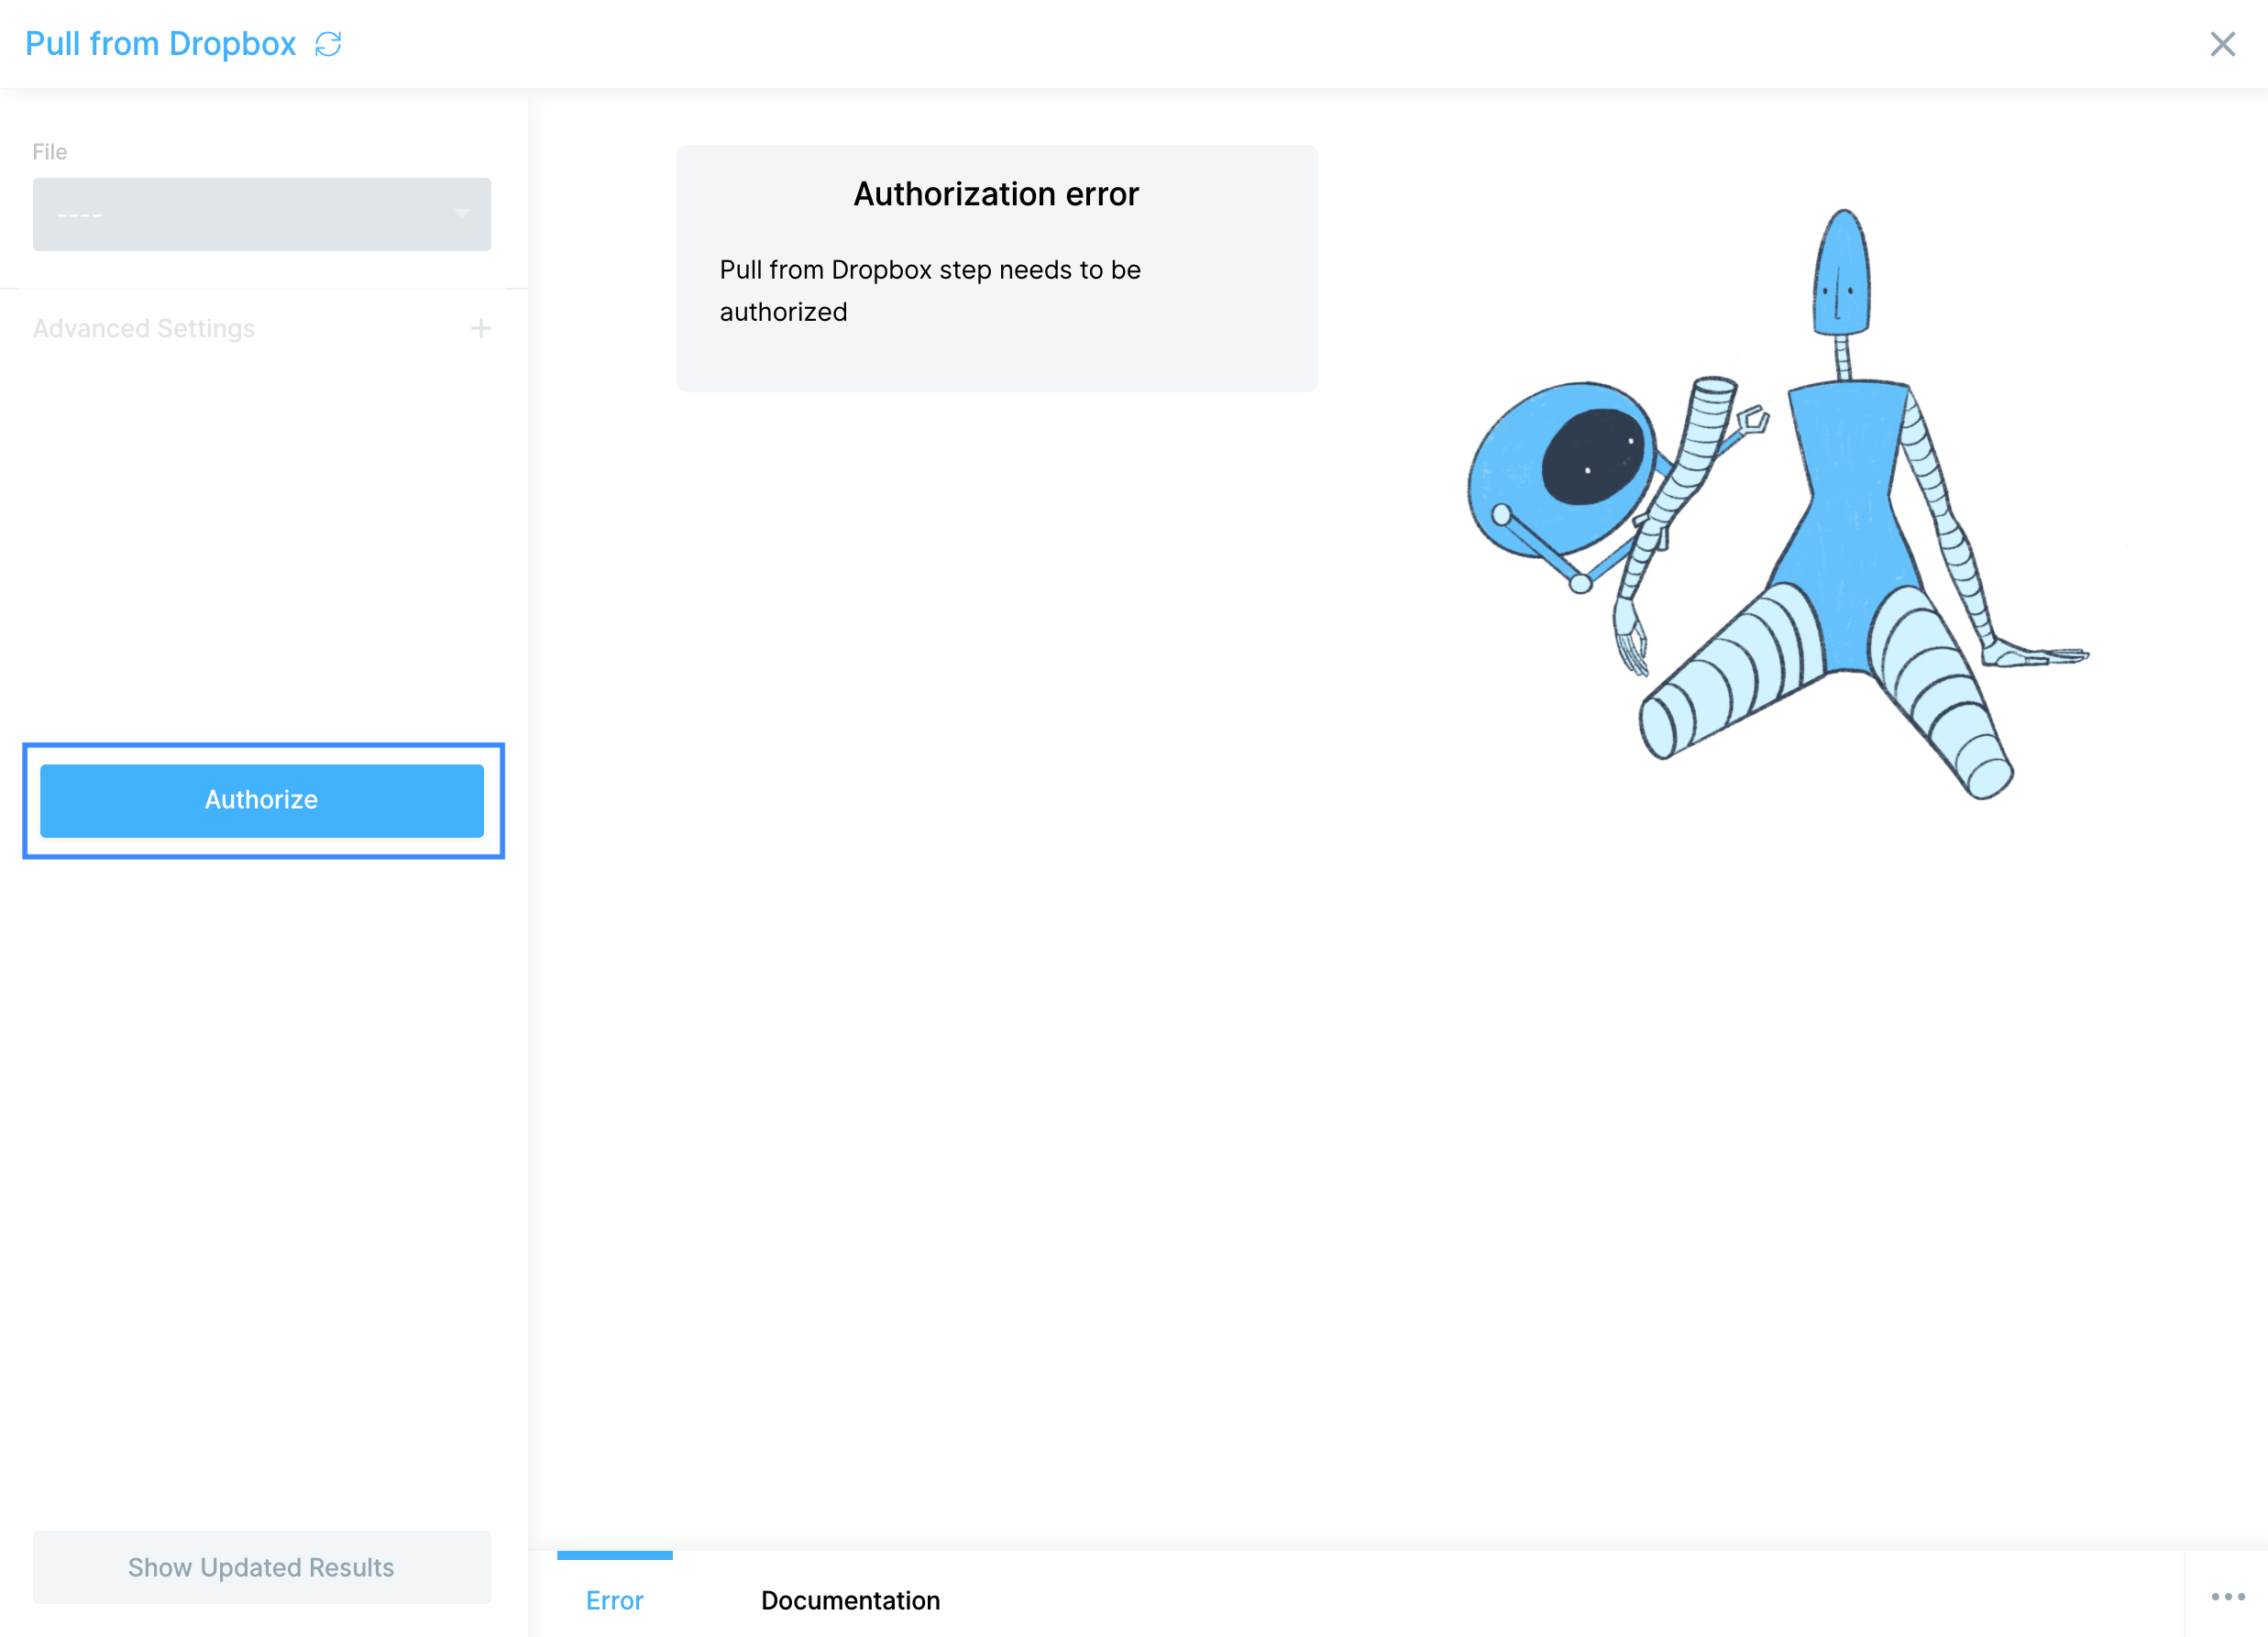
Custom settings
To pull a Dropbox file into Parabola, select it from the File dropdown. You will see all files that you have access to (for Dropbox Business customers, that means both personal and team files).
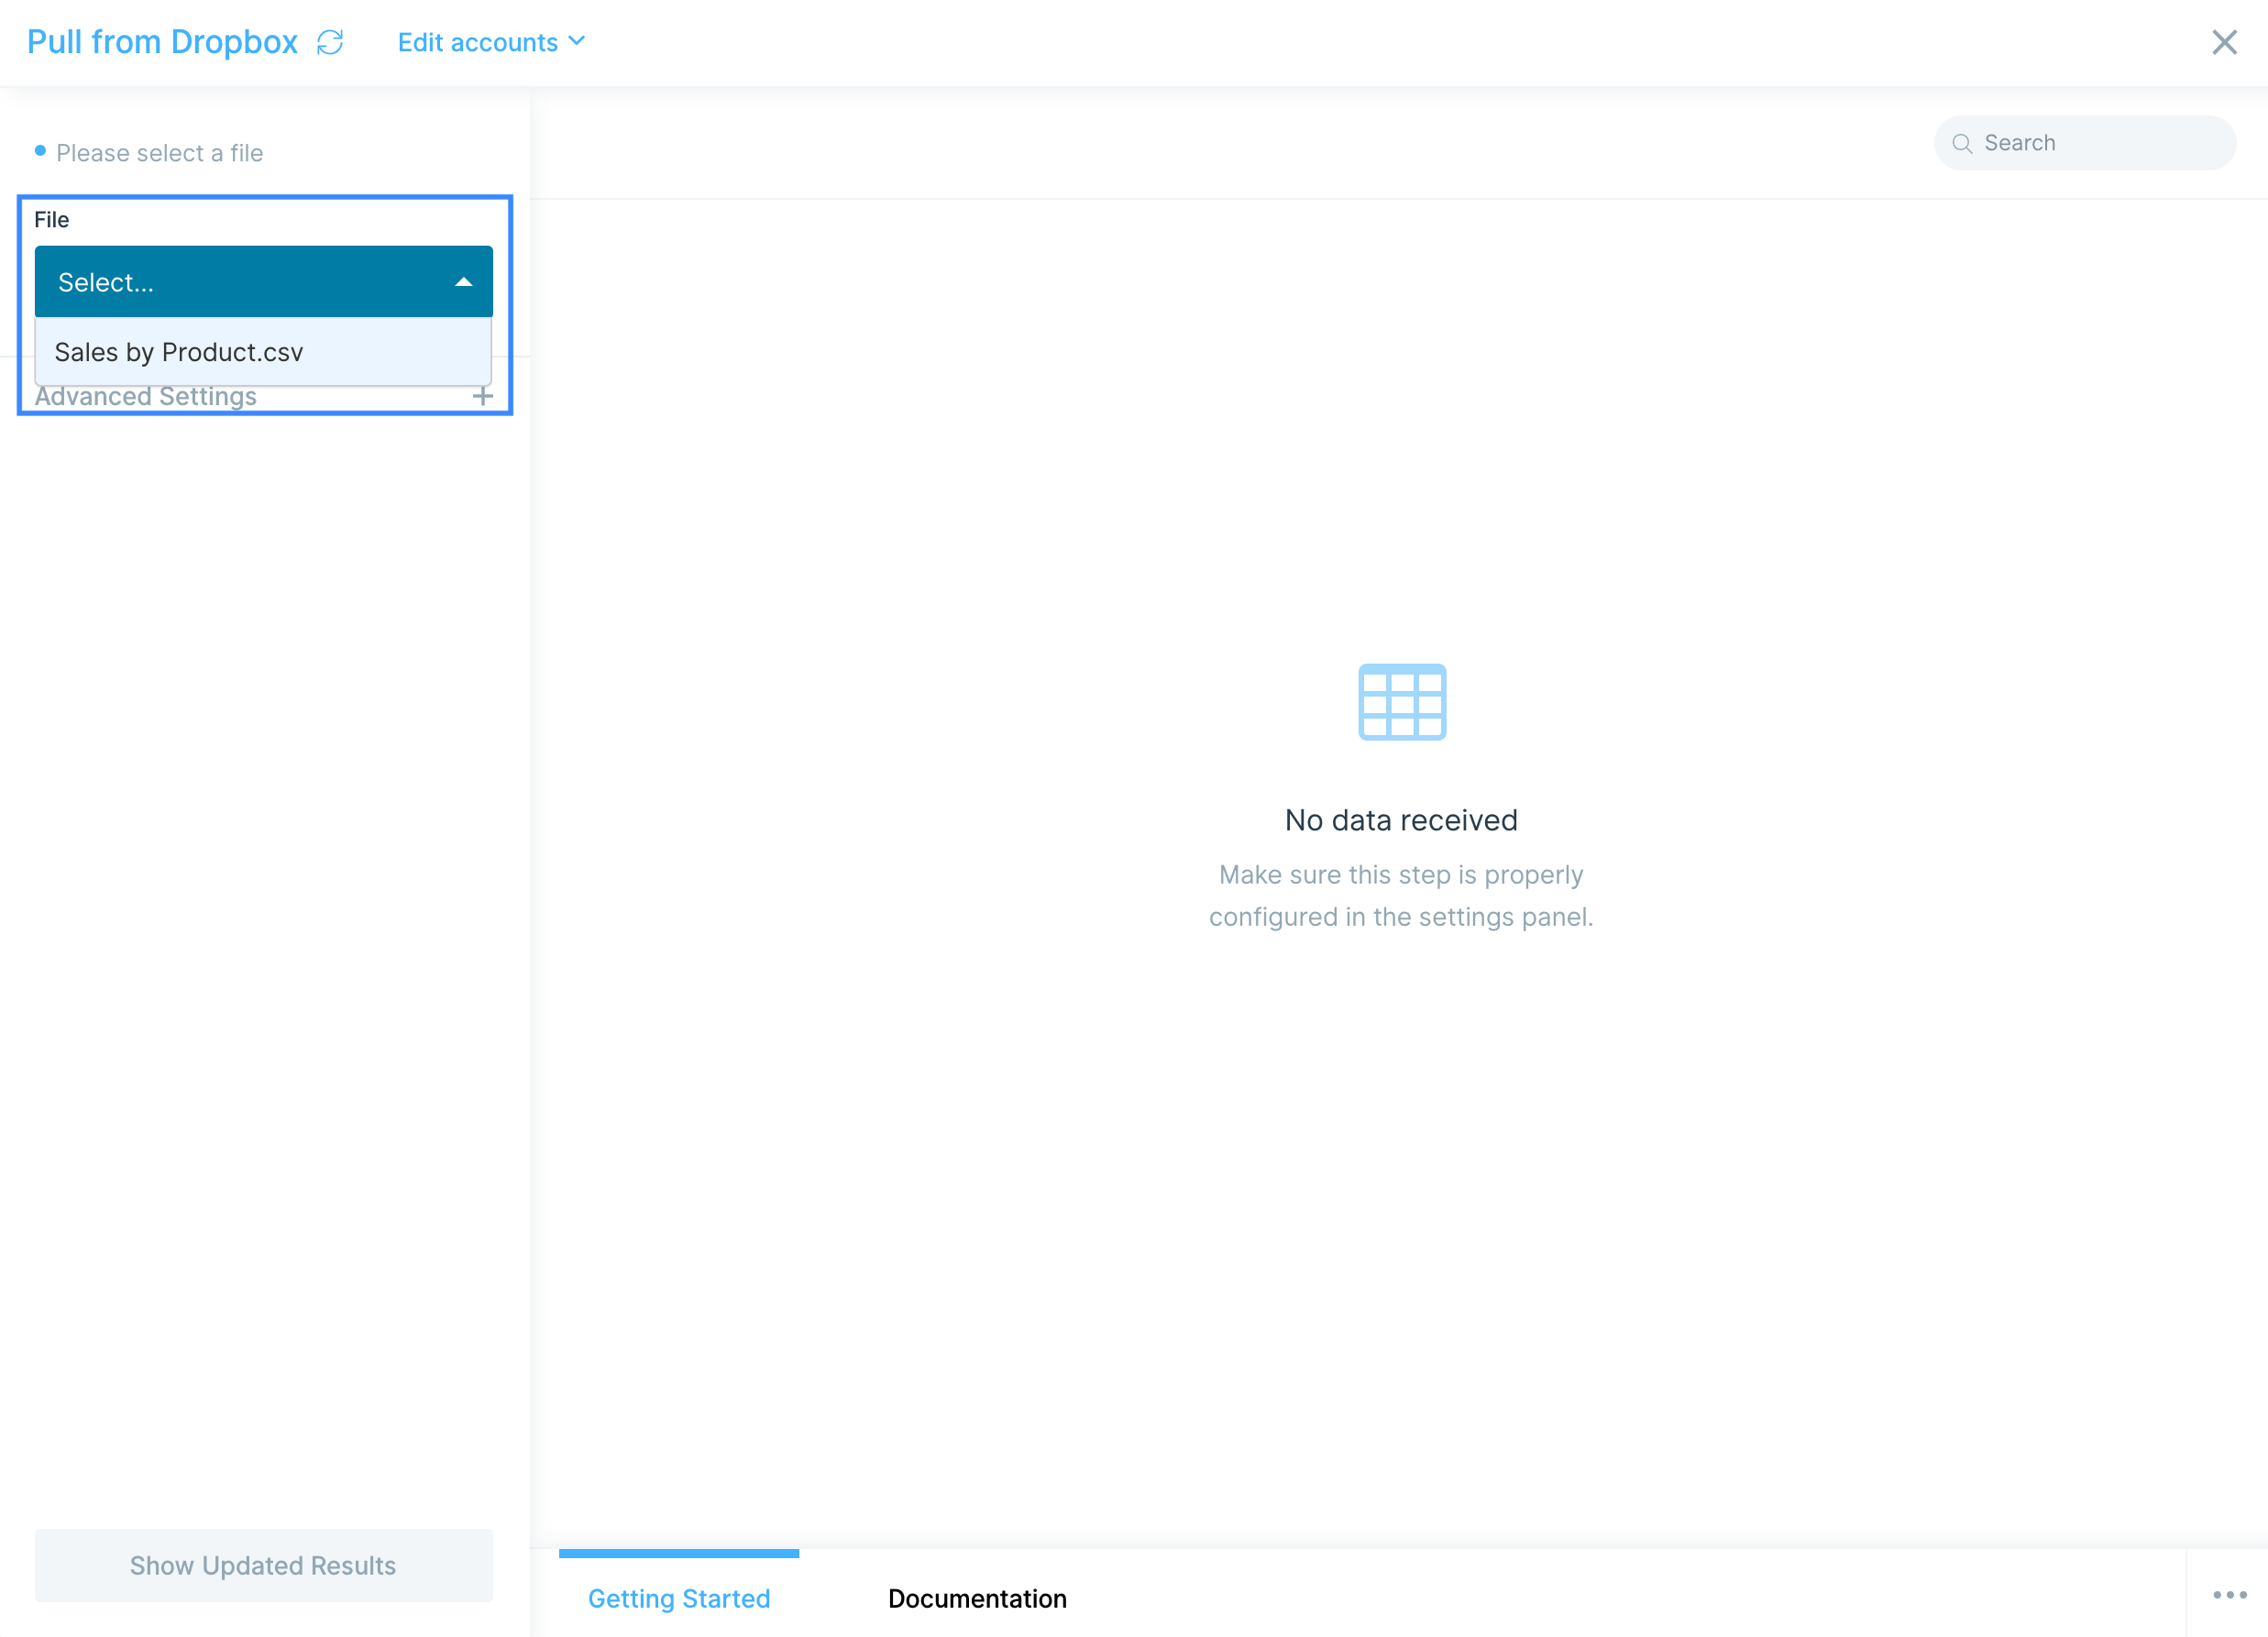
If your file is a CSV, you can then choose the Delimiter. By default, the delimiter is set to comma , , but you can also select tab \t or semicolon ; to match your data source.
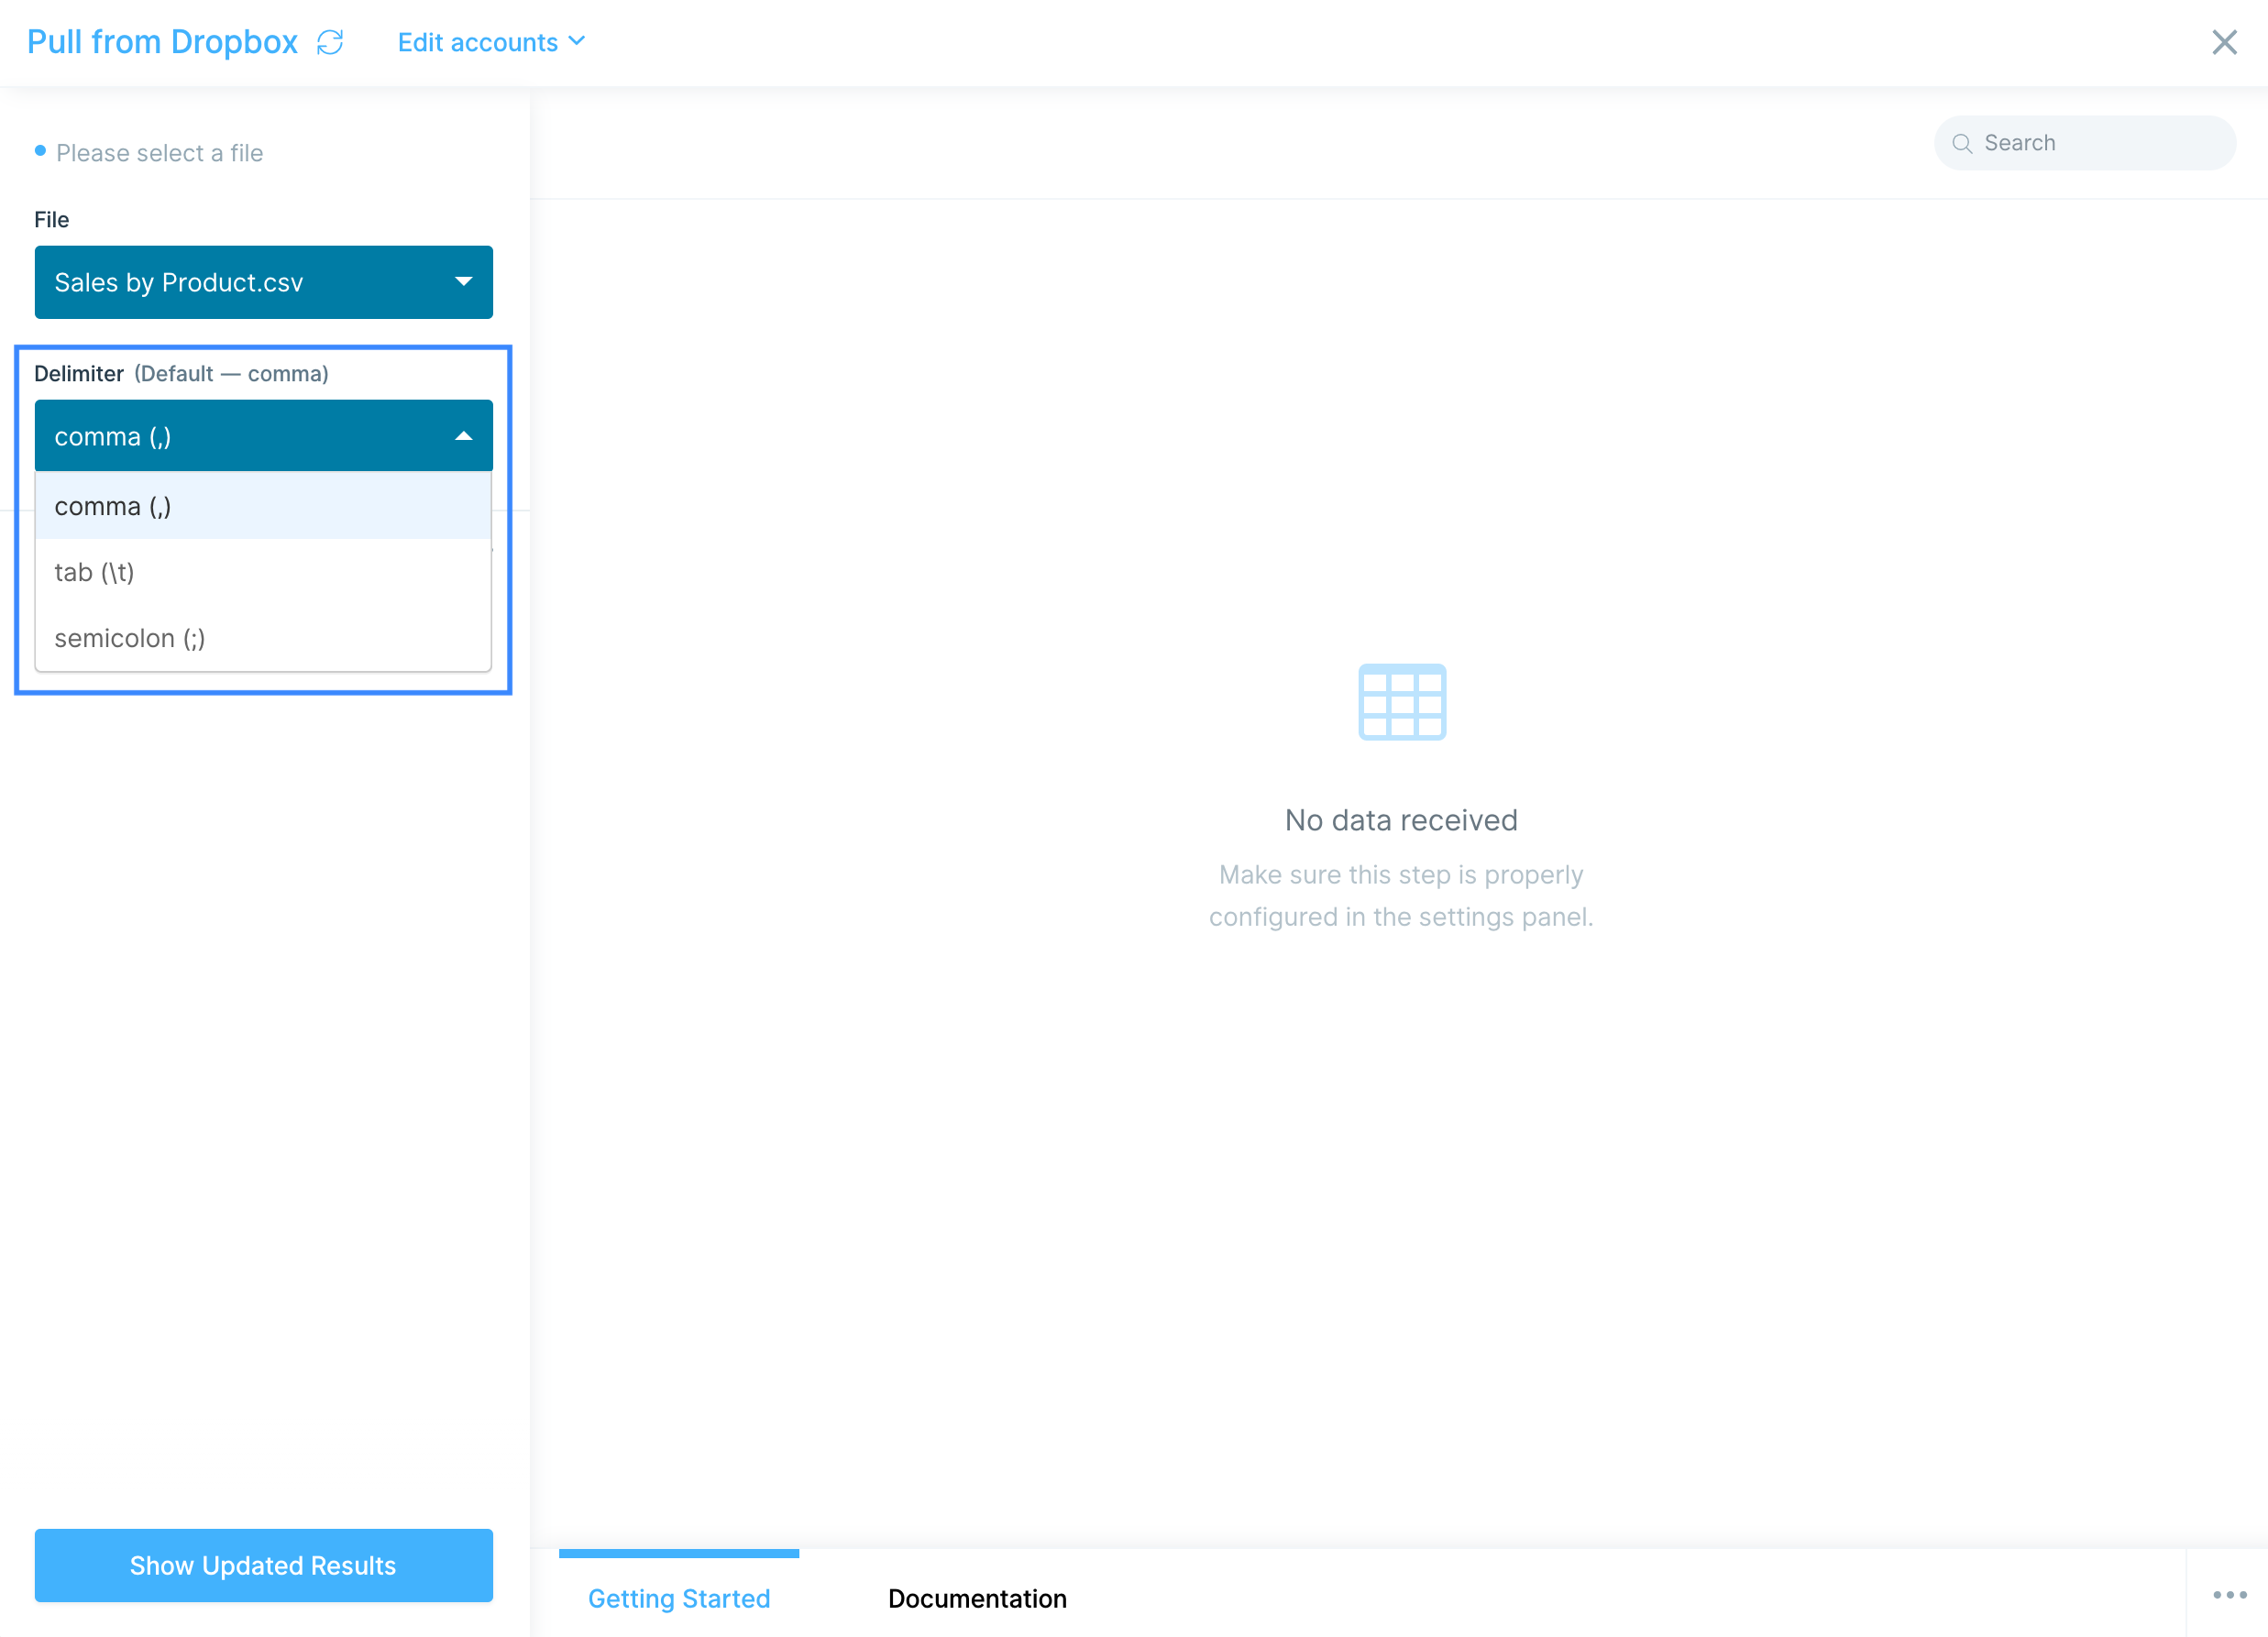
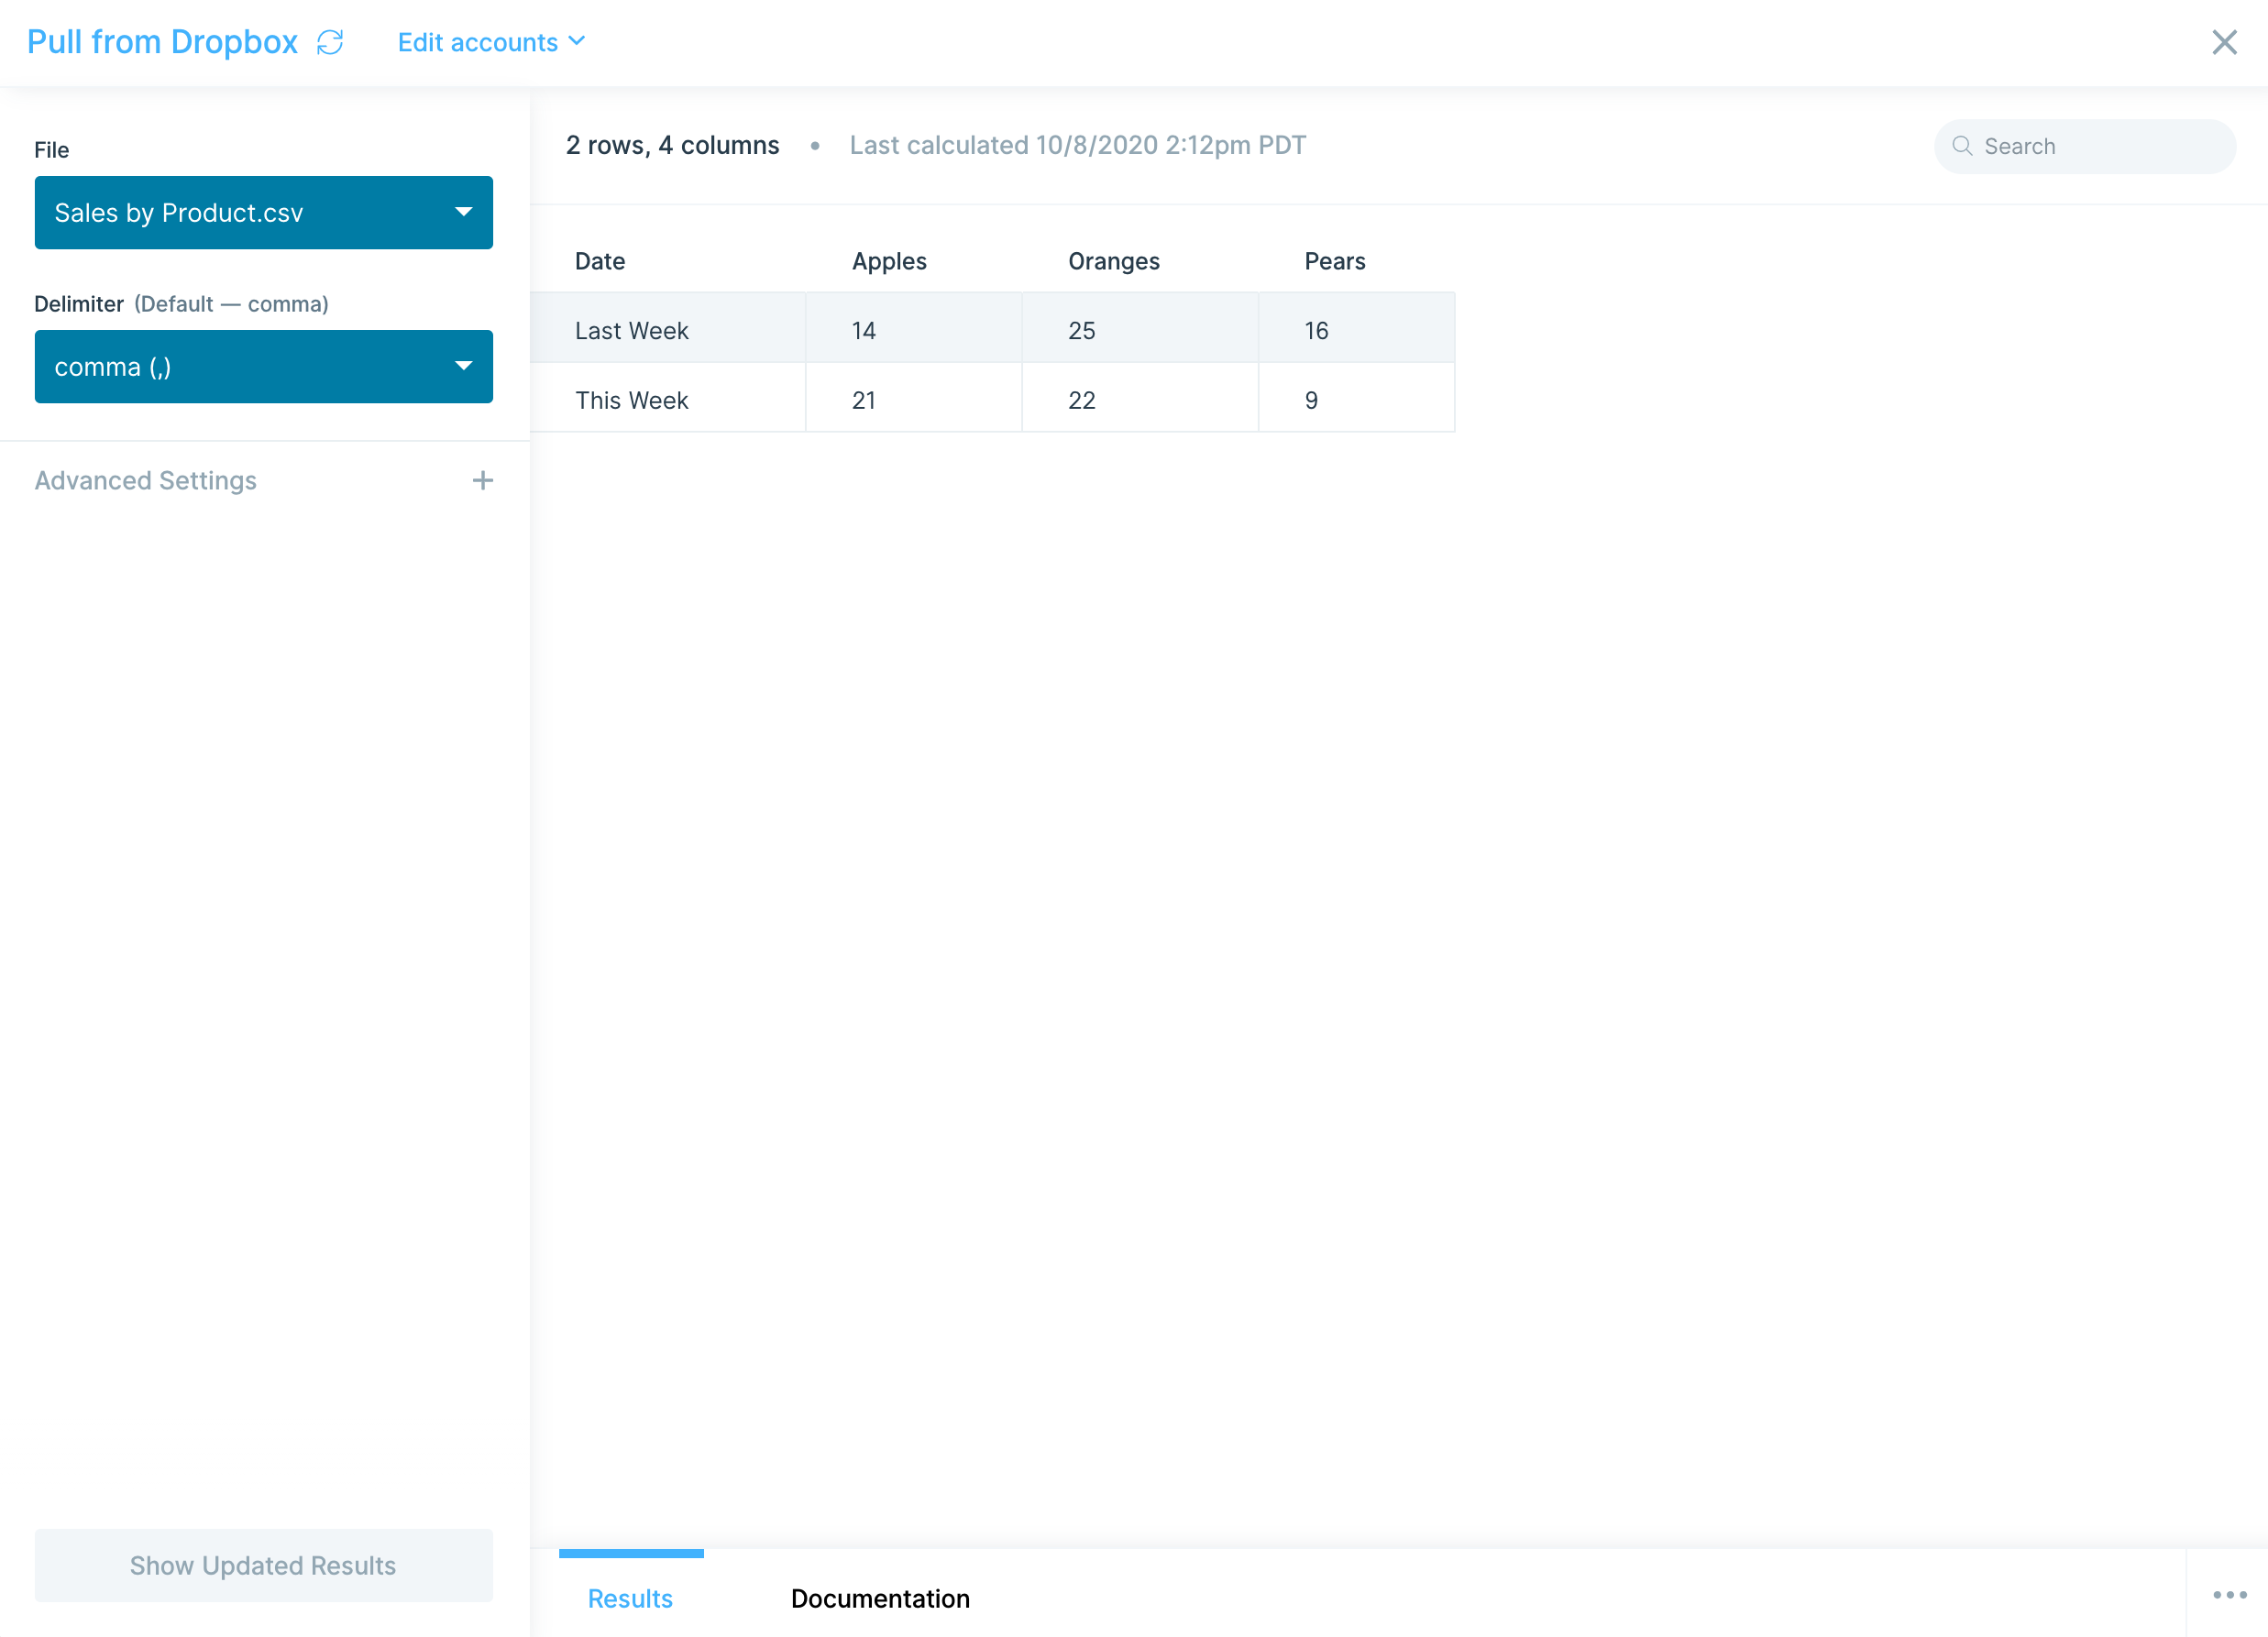
Helpful tips
- Any changes you make to the Dropbox file will be automatically synced with Parabola.
- This step will only be able to pull in files that are located in directories that are owned by the primary owner of the Dropbox account.
- For Dropbox Business accounts, you can pull in files from either team folders or your private member folder. You will see a combined list of all files you have access to.
- To search for a specific file, enter a search term in "Search by filename" (under Advanced Settings). Click to show updated results, and any matching files will now appear in the File dropdown.
The Send to Dropbox step gives you the ability to send CSV data to your Dropbox account. You can choose between creating a completely new file, once or everytime the flow runs, or updating an existing file in Dropbox.
Connect your Dropbox account
To connect to your Dropbox account, click Authorize to login in with your Dropbox credentials.

Custom settings
Under the File dropdown, decide if your data will create a brand new file or overwrite an existing file that already exists in Dropbox. When overwriting an existing file, you will see all files you have access to (for Dropbox Business customers, that means both personal and team files).

If you select to Create New File, you must also give your file a New File Name.
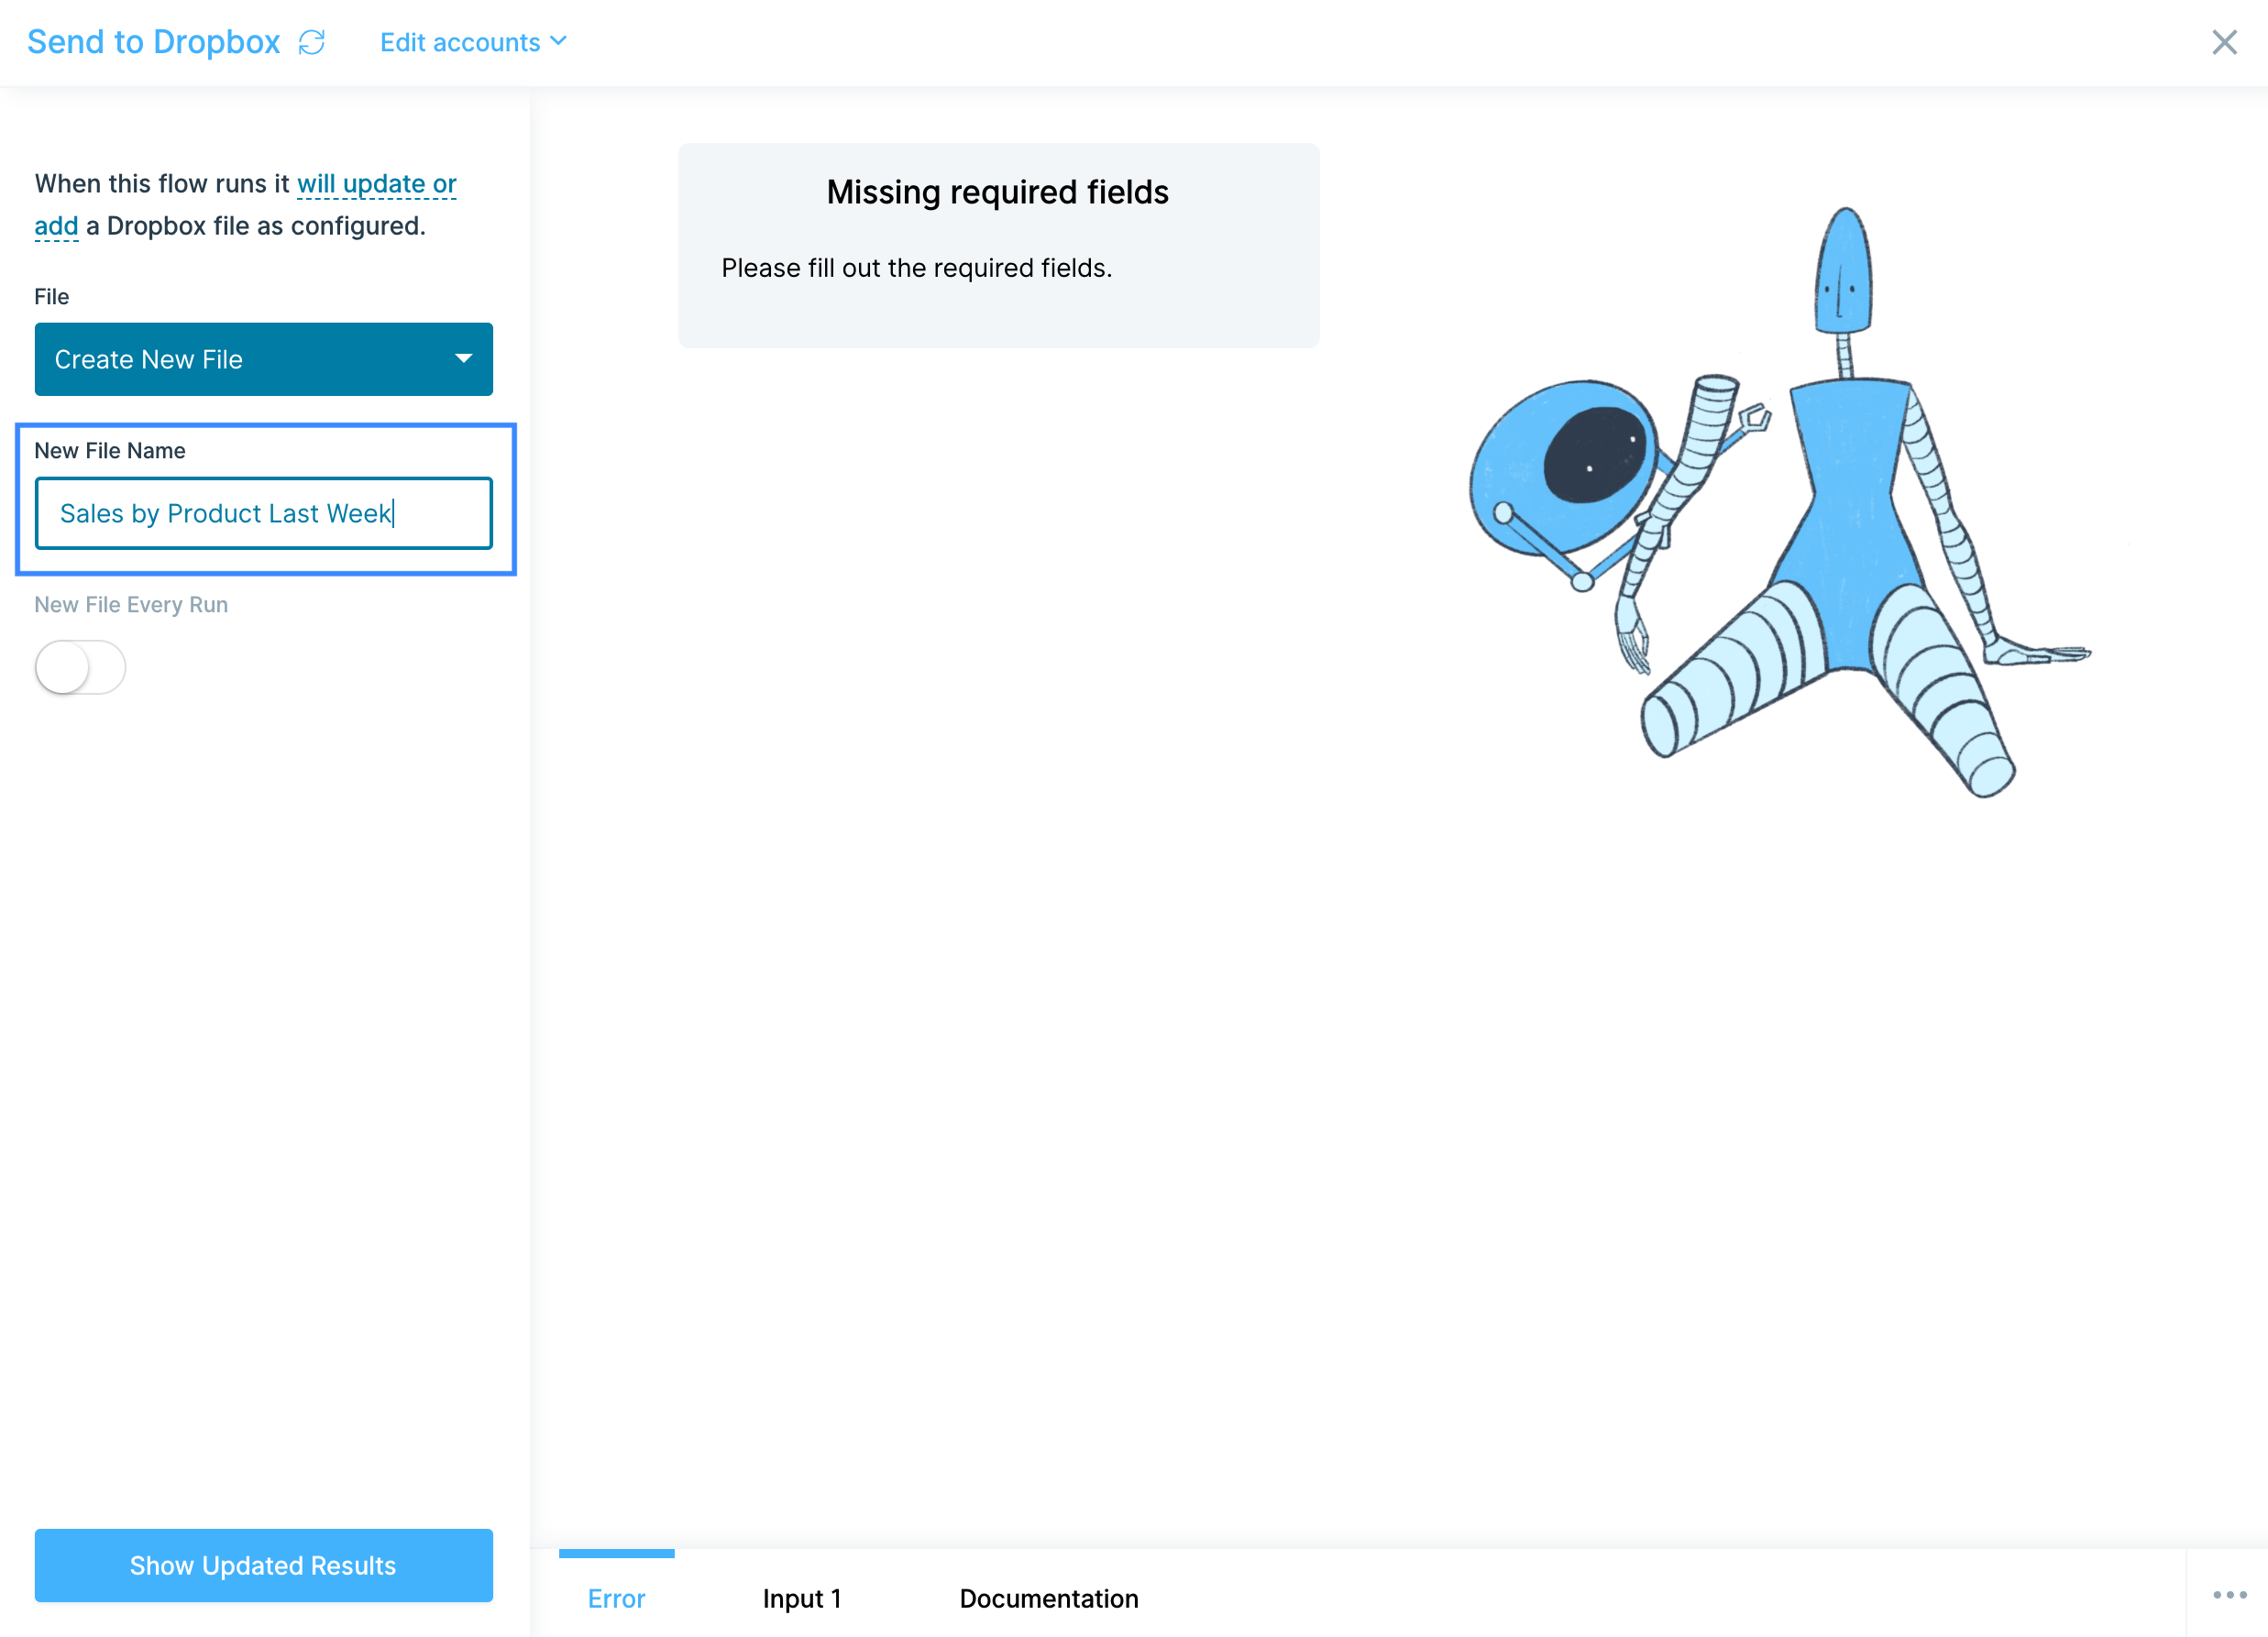
You can toggle New File Every Run, which when turned off, gives you the ability to send this newly created file is a one-off, or if turned on, will create a separate, new file in Dropbox each time the flow runs.

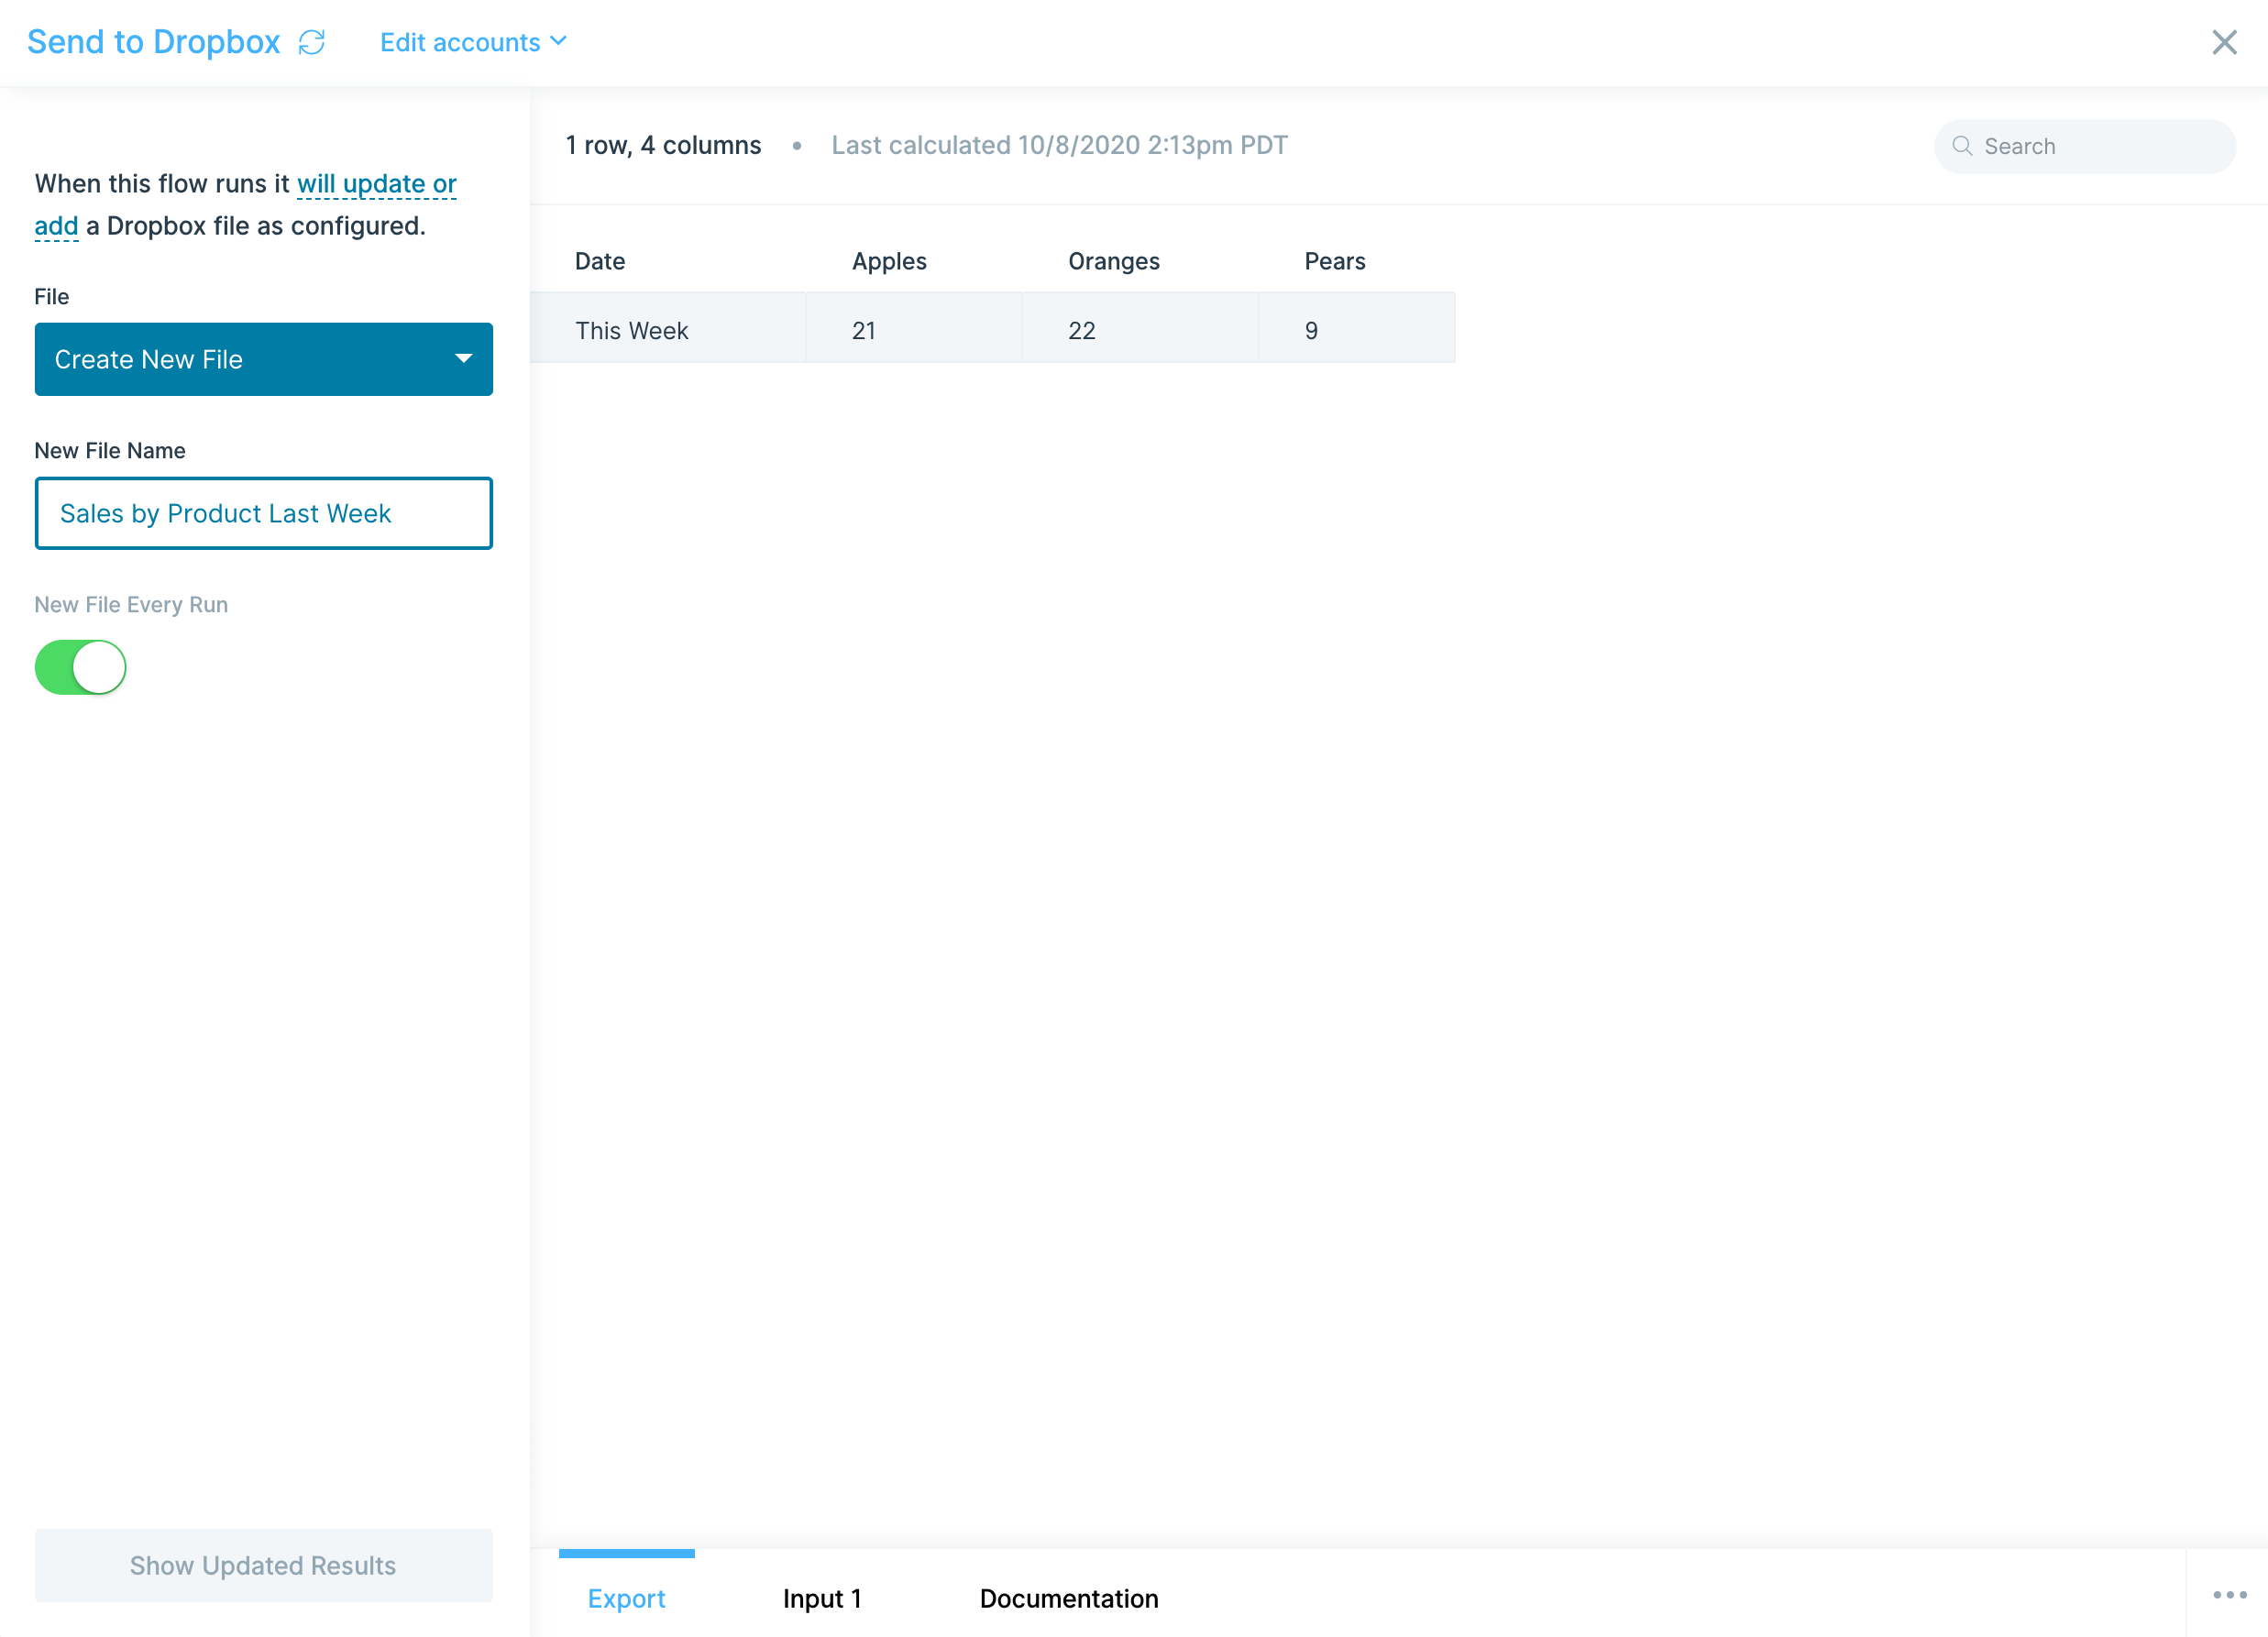
Helpful tips
- Anyone with access to the existing file will be able to see and use the changed data.
- For Dropbox Business accounts, new files will automatically be created in your private member folder.
- To search for a specific file, enter a search term in "Search by filename" (under Advanced Settings). Click to show updated results, and any matching files will now appear in the File dropdown.
Integration:
EasyPost
How to authenticate
EasyPost uses Basic Authentication with your API key as the username (no password required). To connect EasyPost to Parabola:
- Get your API key from EasyPost:
- Log in to your EasyPost account and navigate to Account Settings > API Keys.
- Click the Add Additional API Key button. You'll see both Test and Production API keys.
- Copy your API key: Production to use with live data, or Test for testing purposes.
- Connect in Parabola:
- In your flow, add a Pull from EasyPost step.
- Click Authorize and paste your EasyPost API key when prompted.
- Leave the password field blank; EasyPost only requires the API key as the username.
Parabola will securely store your credentials and use them to authenticate each request to EasyPost.
Available data
Using the EasyPost integration in Parabola, you can bring in:
- Addresses: Full address details including name, company, street address, city, state, ZIP code, country, phone, email, and residential/commercial classification. Filter by address ID or retrieve all addresses.
- Address verification results: Verified and corrected address data to ensure deliverability and reduce shipping errors.
- Trackers: Shipment tracking information including carrier name, tracking code, current status, estimated delivery date, and detailed tracking events with timestamps and locations.
- Shipment SmartRates: AI-powered transit time predictions across various percentiles for every rate associated with a shipment, helping you understand delivery reliability.
- Shipment SmartRate delivery dates: Estimated delivery dates based on a planned ship date, with carrier-specific rates, service levels, costs, and EasyPost's predicted delivery timing.
- Shipment SmartRate precision shipping: Suggested ship dates for each carrier and service level to meet a desired delivery date, including delivery confidence scores and estimated transit days.
Common use cases
- Optimize carrier selection by comparing SmartRate transit time predictions across percentiles to choose the most reliable service for time-sensitive shipments.
- Improve delivery accuracy by verifying customer addresses before shipment creation, reducing failed deliveries and carrier address correction fees.
- Monitor shipment performance by pulling tracker data to analyze on-time delivery rates, identify delayed shipments, and measure carrier performance across regions.
- Automate delivery date communication by retrieving precision shipping data to determine the best ship date for meeting customer delivery expectations.
- Audit shipping costs and service levels by combining EasyPost rate data with actual shipment outcomes to validate carrier pricing and identify cost-saving opportunities.
- Create proactive customer alerts by tracking shipment status changes and triggering notifications when packages are out for delivery or experiencing delays.
Tips for using Parabola with EasyPost
- Schedule your flow to run automatically based on your business needs: hourly for real-time tracking updates, or daily for delivery performance reporting.
- Use address verification early in your fulfillment workflow to catch invalid addresses before labels are printed, saving time and reducing shipping errors.
- Combine SmartRate data with your order management system to automatically select the most cost-effective service level that still meets delivery commitments.
- Filter by delivery confidence scores when using precision shipping data to identify rates that give you the highest probability of on-time delivery.
- Join tracker data with order records from platforms like Shopify or your warehouse management system to create unified shipment visibility dashboards.
- Set up alerts in Parabola to notify your team via Slack or email when shipments show exception statuses or delivery delays.
- Leverage percentile data from SmartRates to understand carrier reliability—higher percentiles (95th, 99th) show worst-case transit times, while lower percentiles (50th) show typical performance.
- Export reports to Google Sheets or your BI tool to share carrier performance metrics with stakeholders and track improvements over time.
Integration:
Email a file attachment
The Email a file attachment step gives you the ability to send an email to a list of recipients with a custom message and an attached file (CSV or Excel) of your transformed data.
Setup
- Connect your flow to Email a file attachment.
- Select your Email template:
- Parabola branded (default): sends a branded email.
- Plain text without branding: sends a simple plaintext email.
- Delivery details: Regardless of template, emails are sent from the Parabola domain. The sender address is team@parabolamail.com. Set ‘Reply-to’ if you want responses to go elsewhere.
- In the step, fill out all required fields:
- Email recipients: enter up to ten email addresses.
- Email subject: enter your subject line.
- Email body: write your message.
- In Advanced settings, set Reply-to to direct recipient replies to the right inbox.
Use merge tags
You can insert dynamic values in Email recipients, Email subject, Email body, File name, and Reply-to by wrapping a column name in {}.
Example: {Name} inserts the value from the first row of the {Name} column from the first connected input.
- To automatically remove any columns used as merge tags from the attachment, open Advanced settings and turn on Remove merge columns from output file.
Multiple inputs (Excel only)
If File format = Excel, the step can accept multiple inputs. Each input becomes a separate tab in the generated file. Give each tab a unique name.
Security
Parabola stores files you send through this step so your flow can reload results next time. We store data securely in Amazon S3, and all connections use SSL with encryption.
Limitations
- Maximum email size: 30 MB.
- The step does not send an email if the input contains zero rows.
- You can email up to 10 recipients
- This step sends an attachment to your specified recipients. By contrast, the Generate CSV file and Generate Excel file steps create a downloadable file and email a link to the flow owner. Files from the Generate steps are also available in the flow’s Run history.
Integration:
Excel file
The Use Excel file step enables you to pull in tabular data from an Excel file.
Custom settings
First, select Click to upload a file.

If your Excel file has multiple sheets, select which one you'd like to use in the dropdown menu for Sheet.
In the Advanced Settings, you may also select to skip rows or columns. This will skip rows from top-down and columns from left-to-right.
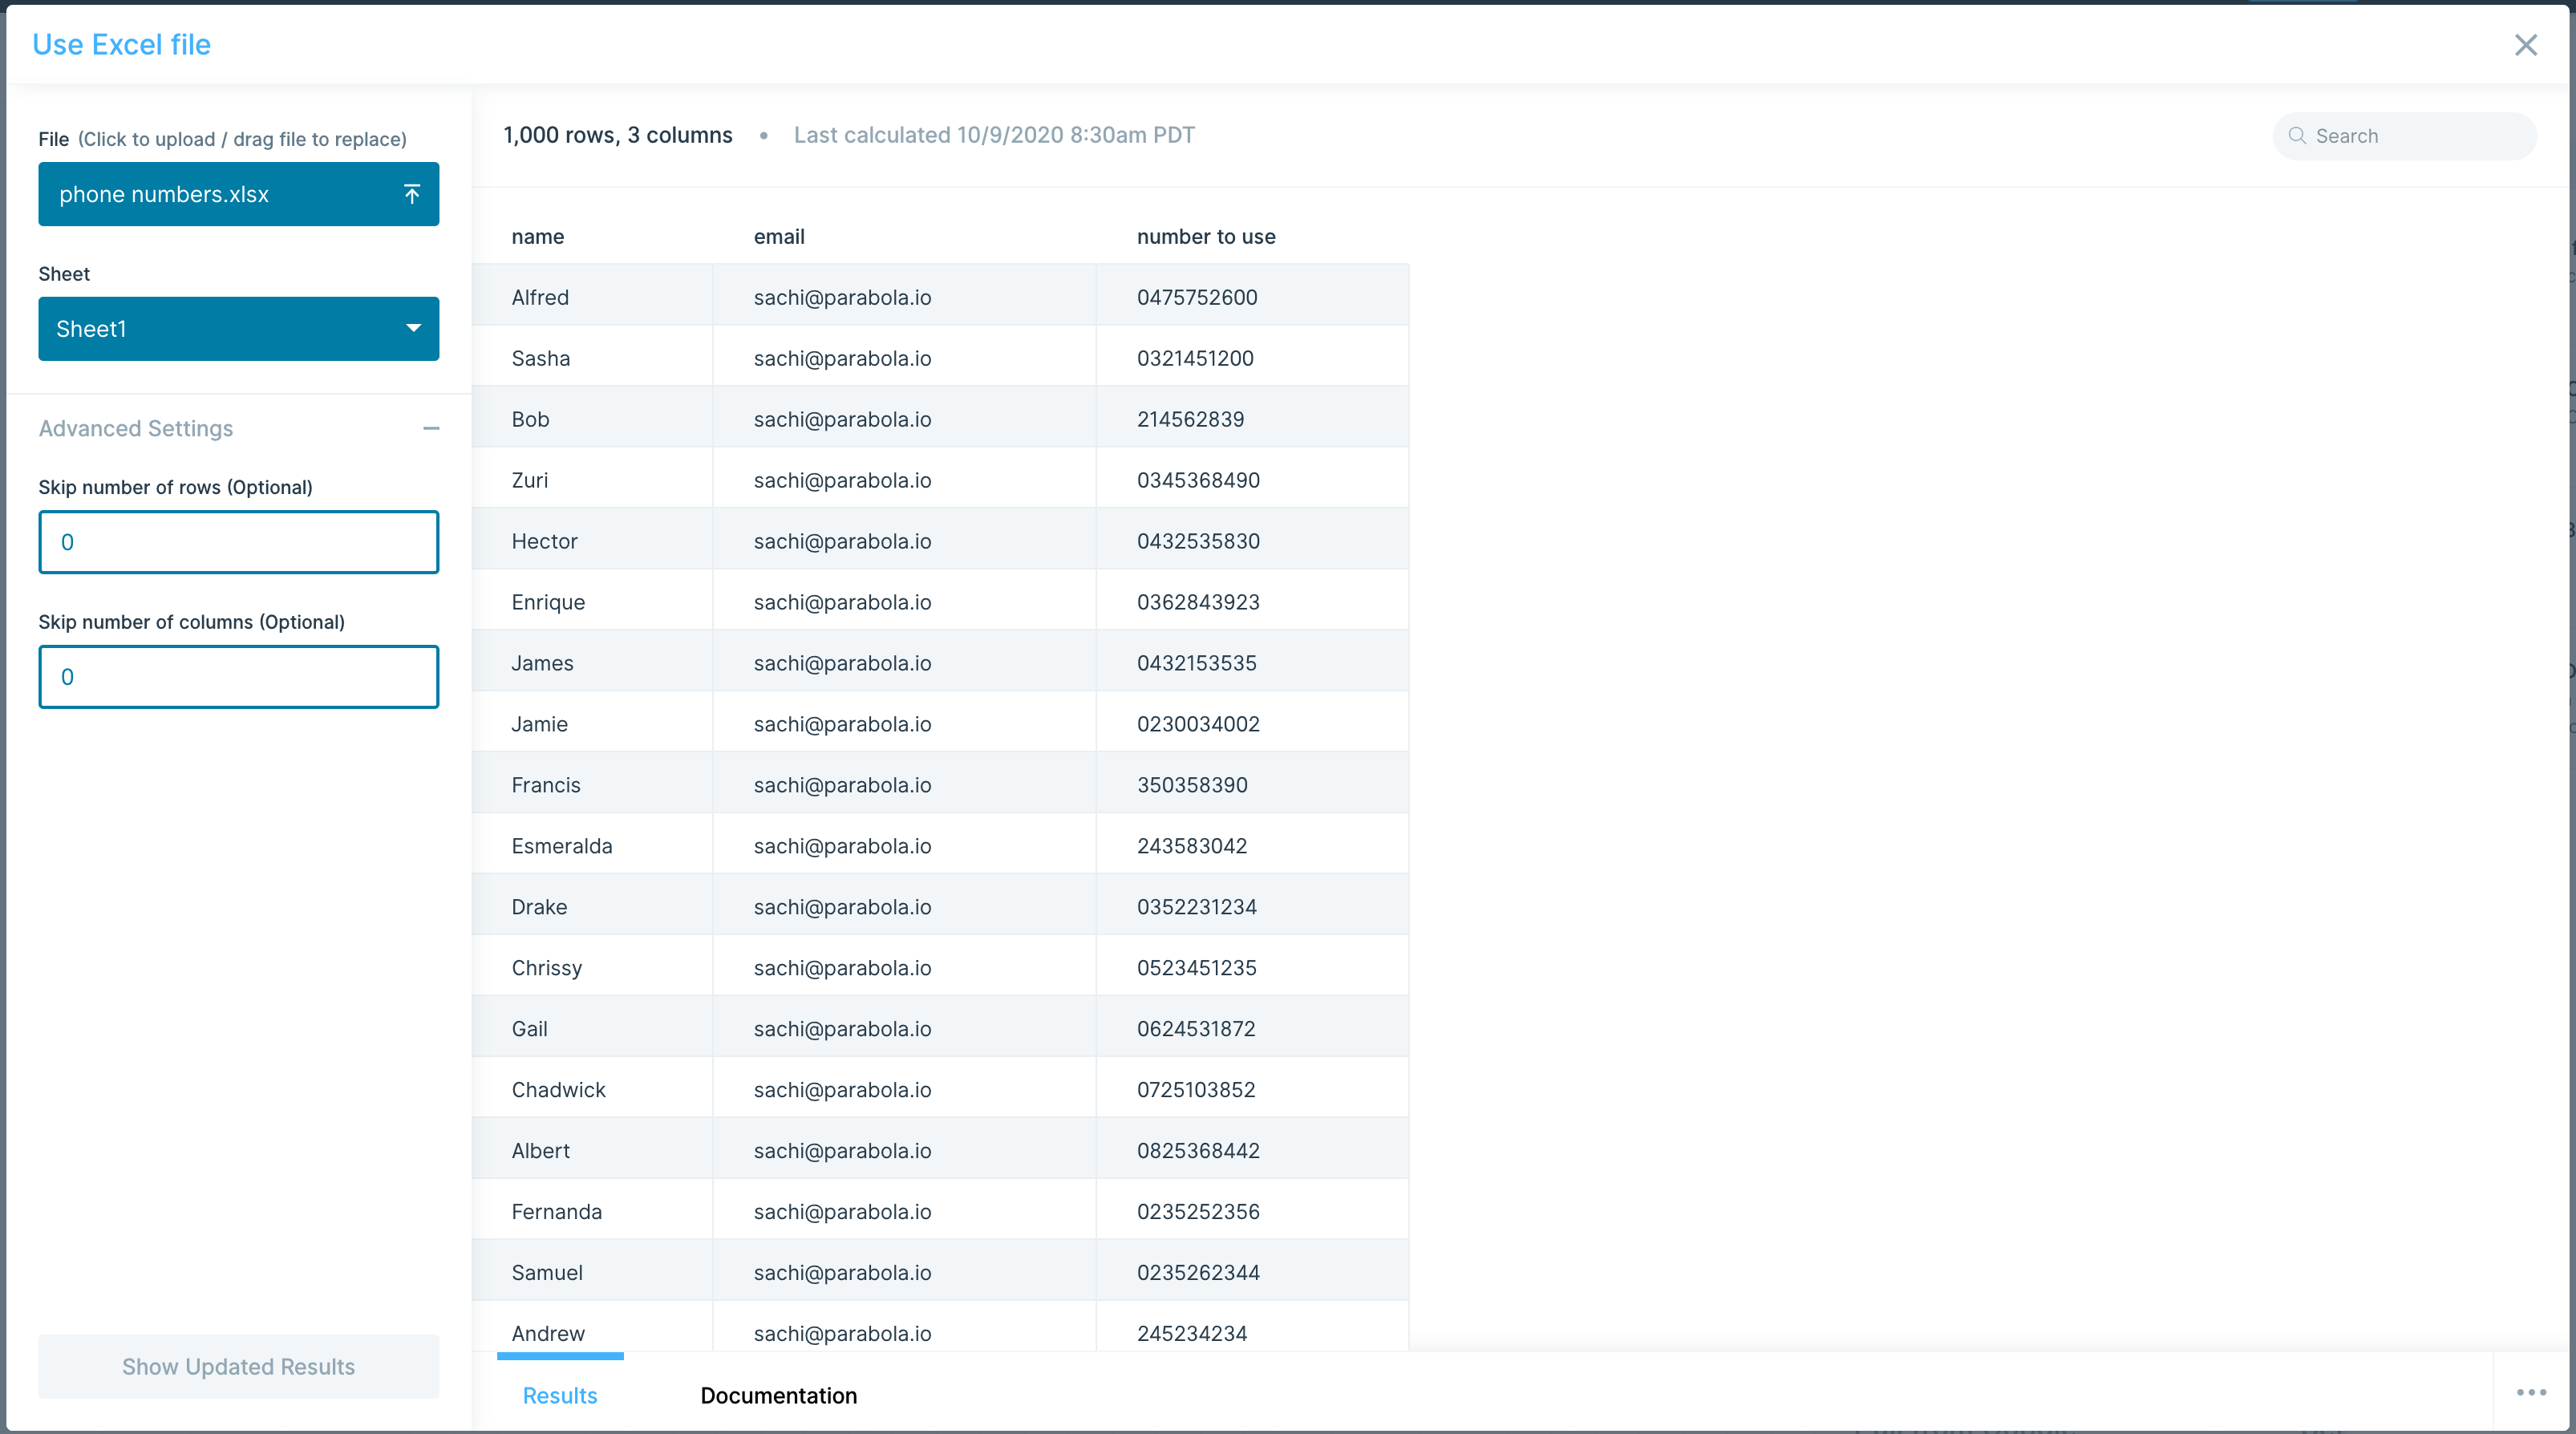
Formatted data
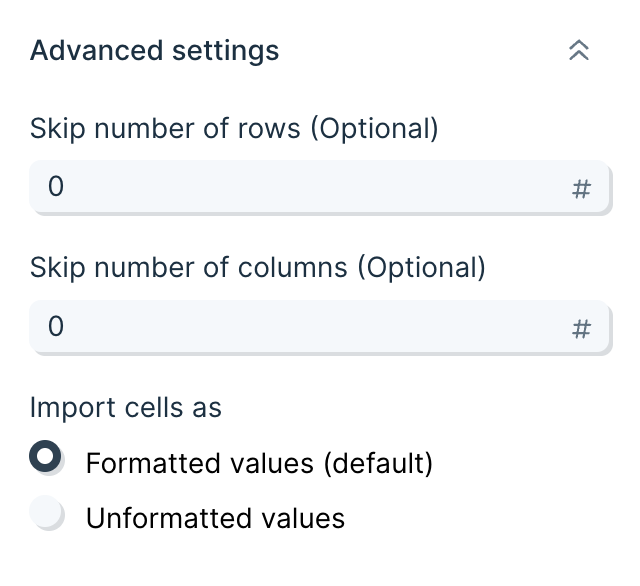
Cell data is imported as formatted values from Excel. Dates, numbers, and currencies will be represented as they appear in the Excel workbook, as opposed to their true underlying value.
Enabling unformatted values will import the underlying data from Excel. Most notably, this will show raw numbers without any rounding applied, and will convert dates to Excel's native date format (the number of days since 1900-01-01).
Helpful tips
Limitations
This step can't pull in file updates from your computer, so if you make dataset changes and wish to bring them into Parabola, this requires manually uploading the updated Excel file. When you upload an Excel file, all formulas are converted to their value, and formatting is stripped (formatting or formulas are not preserved). If you want to pull in live updates on each run without having to upload a file manually, you can use a step like Pull from SharePoint, OneDrive, or Google Drive.
Security
The files you upload through this step are stored by Parabola. We store the data as a convenience, so that the next time you open the flow, the data is still loaded into it. Your data is stored securely in an Amazon S3 Bucket, and all connections are established over SSL and encrypted.
Custom Settings
Once you connect your Flow to this export step, it will show a preview of the tabular data to be sent.

The step will automatically send this downloadable Excel file link to the email address of the Flow owner.
By default, the name of the file will be ‘Parabola Excel File’—if you'd like to rename your dataset, click the box under ‘Download a Excel file named’ and type your new filename.
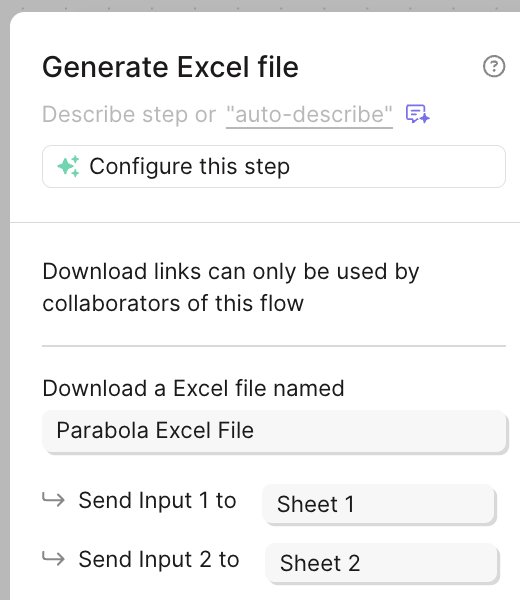
Note that the Generate Excel file step can take multiple inputs. Each input step will send data to a separate sheet, and the names of these sheets can be customized. 'Input 1' will map to 'Sheet 1' by default, and so forth. Refer to the 'Input' tabs at the top of your step window to ensure your step is sending your data to the desired source.
Once you publish and run your Flow, the emailed Excel file link will expire after 24 hours.
If the step has no data in it (0 rows), then even after running your Flow, an email with an Excel file won't be sent.
You can download past Excel files that were generated with this step by opening the “Run History” panel, navigating to the Flow run, and clicking Download Excel.
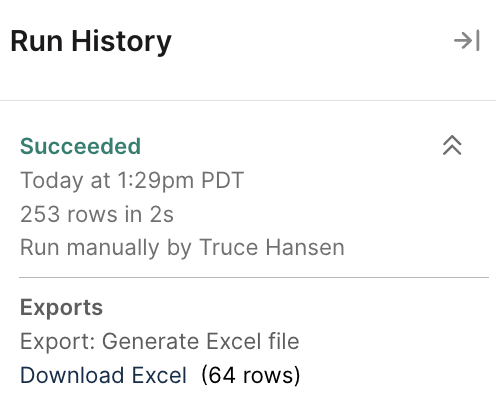
Helpful Tips
Security
The files you send through this step are stored by Parabola. We store the data as a convenience, so that the next time you open the Flow, the data is still loaded into it. Your data is stored securely in an Amazon S3 Bucket, and all connections are established over SSL and encrypted.
Limitations
All sheet names must be less than or equal to 31 characters, or the Flow will fail.
Integration:
Exchange Rate
How to authenticate
ExchangeRate-API uses a simple API key for authentication. Here's how to get connected:
- Get your API key from ExchangeRate-API
- Visit ExchangeRate-API and sign up for a free account (no credit card required for the free plan, which includes 1,500 requests per month).
- Once logged in, navigate to your dashboard where you'll find your API key displayed.
- Copy your API key and store it somewhere secure.
- Connect in Parabola
- In your Parabola flow, add a Pull from ExchangeRate-API step.
- Click Authorize and paste your API key when prompted.
- Parabola will securely store your credentials and use them to authenticate each request.
Once authenticated, you can start pulling conversion rates into your workflows.
Important tip: Reduce API calls by removing duplicate currency conversion pairings before hitting the API
Before your conversion step, use Parabola's Remove duplicates step on your currency pair columns to eliminate redundant requests. This helps you stay within your monthly quota, especially on the free plan. Then, you can use a Combine tables step to re-join your live exchange rate pairs.
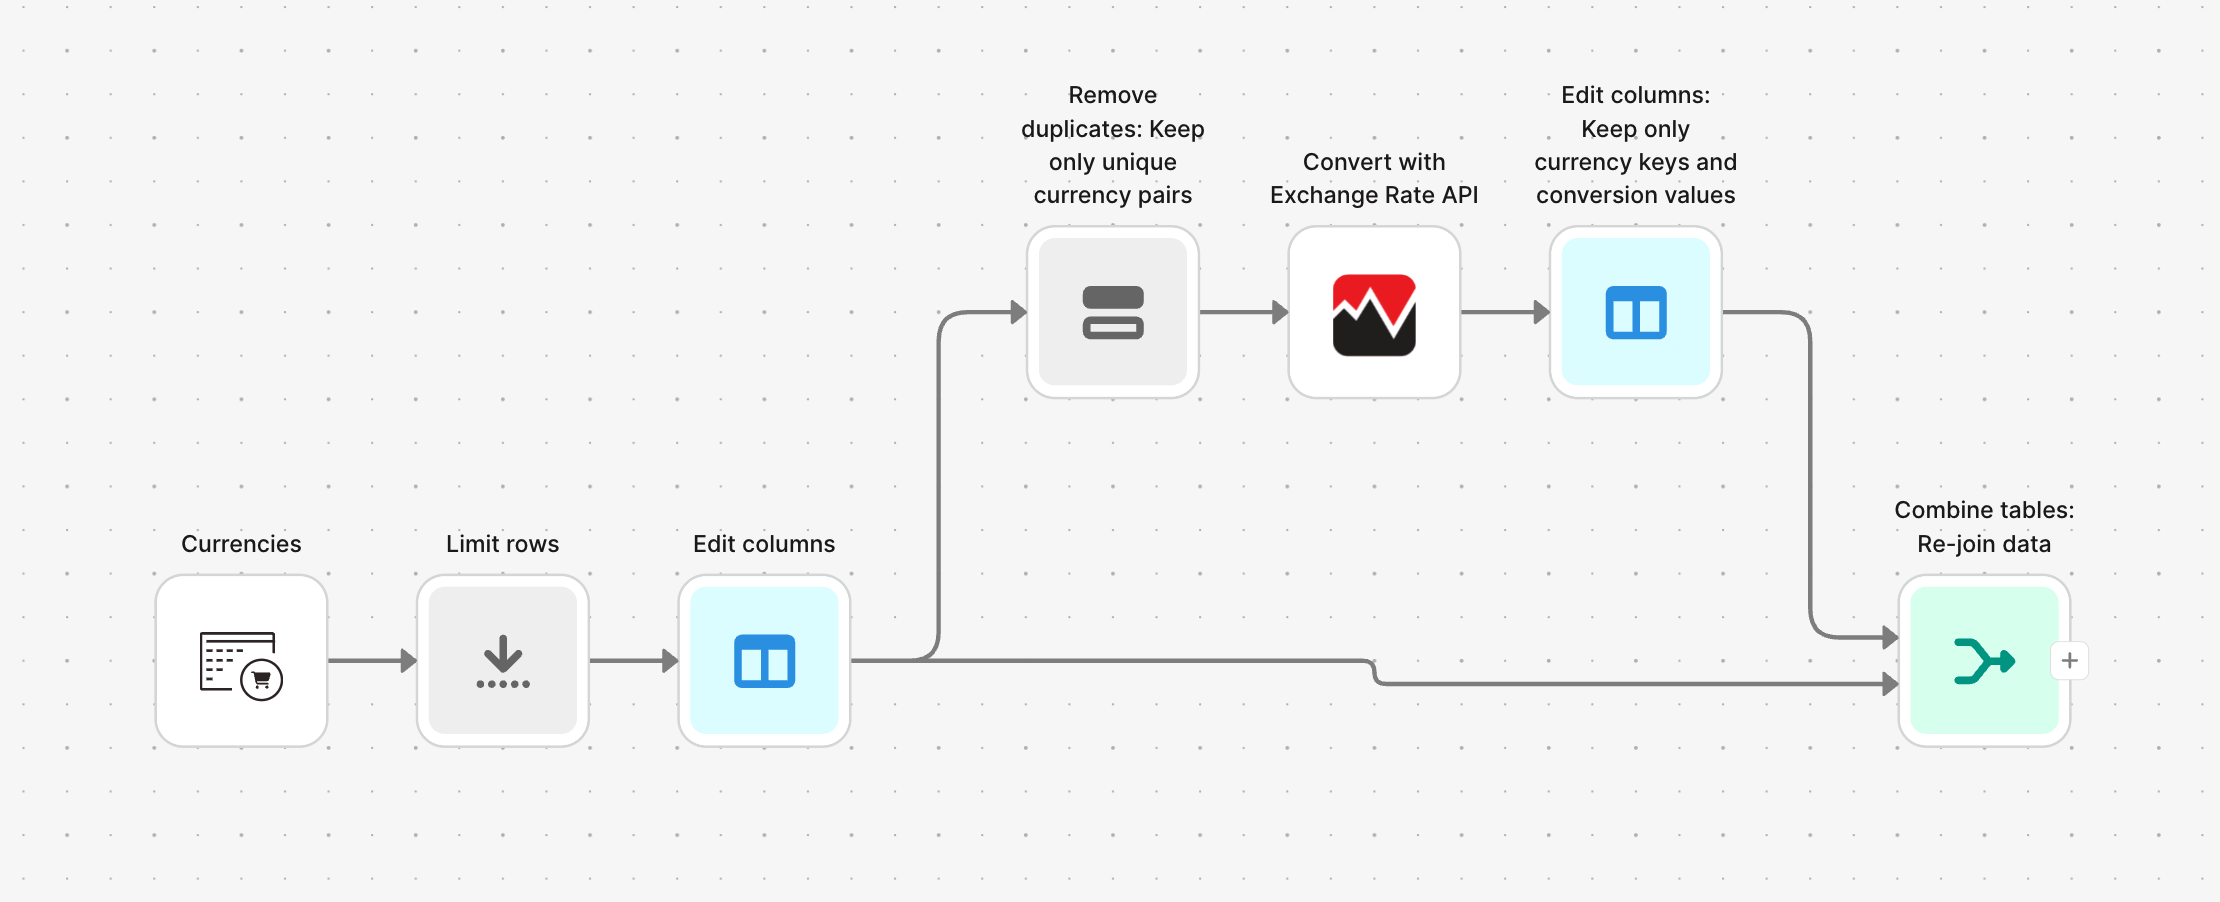
Available data
Using the ExchangeRate-API integration in Parabola, you can pull:
- Currency pair conversion rates: Get the latest exchange rate between any two currencies using ISO 4217 three-letter codes (e.g., USD to EUR, GBP to JPY). The response includes the base currency, target currency, conversion rate, and timestamps for when rates were last updated.
- Currency conversions with amounts: Convert a specific amount from one currency to another and receive both the exchange rate and the calculated result. Perfect for converting invoice totals, product prices, or transaction amounts in bulk.
Each response includes helpful metadata like the last update time and next scheduled update, so you always know how current your data is.
Common use cases
- Standardize multi-currency financial reporting: Pull transactions from systems like Shopify, NetSuite, or Stripe, convert all amounts to your reporting currency (e.g., USD), and generate consolidated revenue reports without manual conversions.
- Display localized pricing for international customers: Automatically convert your product catalog prices into local currencies for different regions, ensuring customers see accurate pricing in their preferred currency.
- Reconcile invoices and payments across currencies: Match vendor invoices or customer payments in different currencies against your accounting records by converting everything to a single base currency, making reconciliation faster and more accurate.
- Audit and validate currency conversions: Compare conversion rates used in past transactions or invoices against current market rates to identify discrepancies, overcharges, or outdated exchange rates in your financial data.
- Automate landed cost calculations: Combine exchange rates with freight invoices, customs data, and tariff information to calculate accurate landed costs for international shipments in your local currency.
- Month-end close currency adjustments: Pull exchange rates on the last day of the month to revalue foreign currency balances, calculate unrealized gains/losses, and generate journal entries for your ERP or accounting system.
Tips for using Parabola with ExchangeRate-API
- Reduce API calls by removing duplicates upstream: Before pulling conversion rates, use Parabola's Remove duplicates step on your currency pair columns to eliminate redundant requests. This helps you stay within your monthly quota, especially on the free plan.
- Separate rate lookup from conversion: Instead of converting each row individually, pull unique currency pairs first, then rejoin the rates to your original dataset and use Parabola's Add math column step to calculate converted amounts. This approach is much more efficient.
- Schedule your flow strategically: Exchange rates typically update once daily (around midnight GMT for most services). Schedule your flow to run after rates refresh to ensure you're always working with current data—daily runs in the morning work well for most use cases.
- Store historical rates for trend analysis: Export conversion rates to a Google Sheet or database with timestamps to build a historical record. This lets you analyze currency volatility, track rate changes over time, or audit past conversions.
- Set up alerts for significant rate changes: Use Parabola's Add column and Filter steps to flag currency pairs where rates have changed by more than a certain percentage. Send alerts via Slack or email to notify your finance team of major movements.
- Standardize currency codes: Use Parabola's Find & replace or Edit text steps to ensure all currency codes in your source data match ISO 4217 format (three uppercase letters) before making API calls. This prevents errors from inconsistent formatting like "usd" vs "USD."
Integration:
Extract from email
The Extract from email step gives you the ability to receive file attachments (CSV, XLS, PDF, or JSON files) from an incoming email and pass it to the next step (eg., combining email data with PDF or Google Sheets data). The step also gives you the ability to pull an email subject and body into a Parabola Flow. Use this unique step to trigger Flows, using content from the email itself.
Watch the Parabola University video below to see this data pull in action.
Default attachment settings
To begin, take note of the generated email address that is unique to this specific flow. Copy the email address to your clipboard to start using this dedicated email address yourself or to share with others.
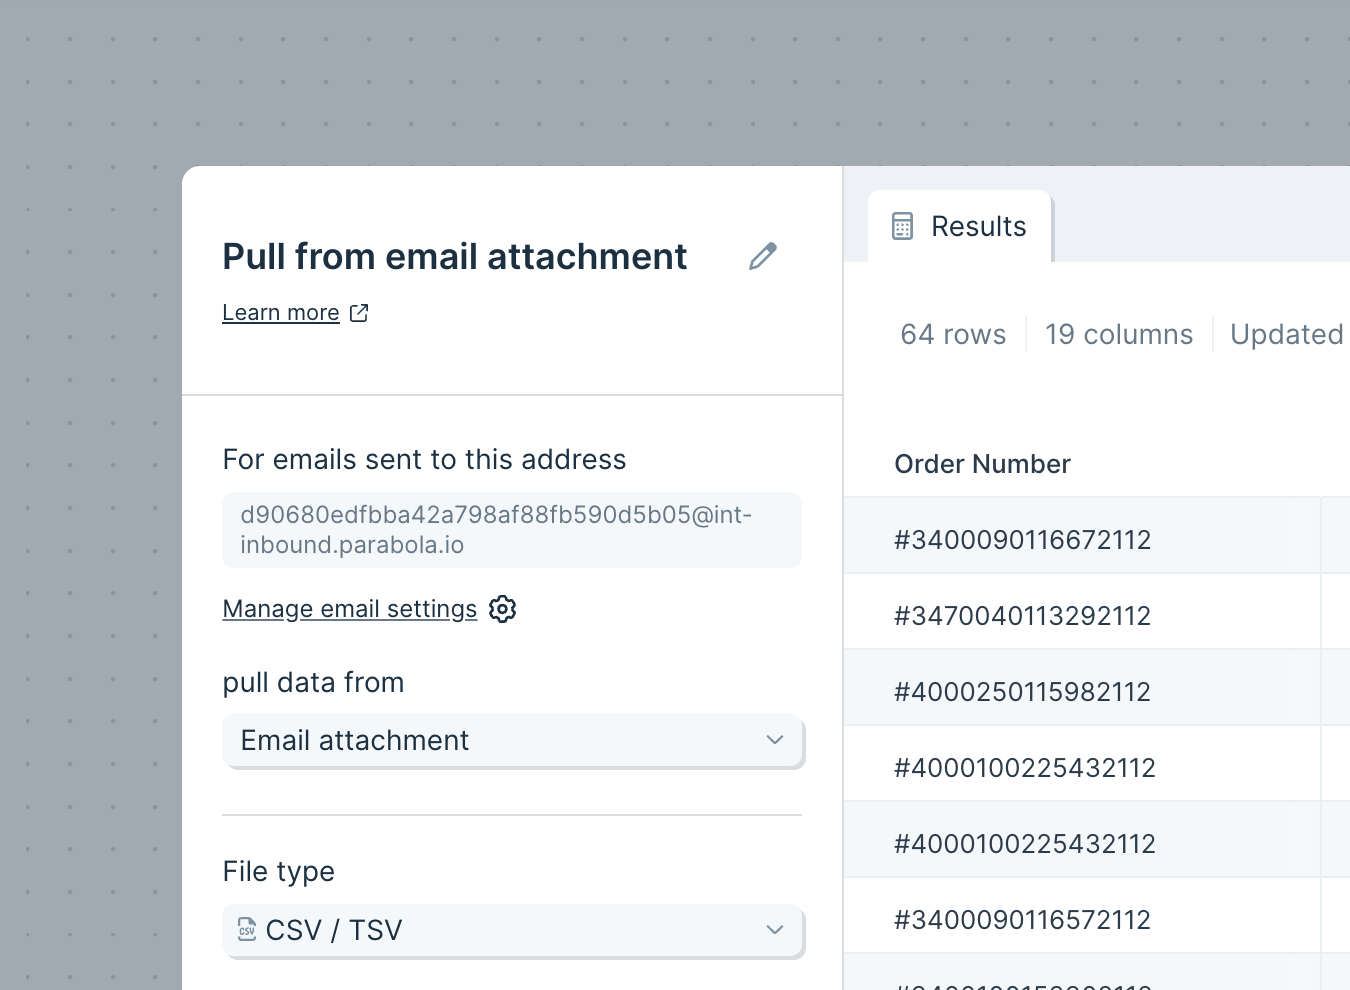
The File Type is set to CSV / TSV, though you can also receive XLS / XLSX, PDF, or JSON files.
The Delimiter is set to comma (,), but can also be adjusted to tab (\t) and semicolon (;). If needed, the default of Quote Character set to Double quote ( " " ) can be changed to single quote ( ' ' ).
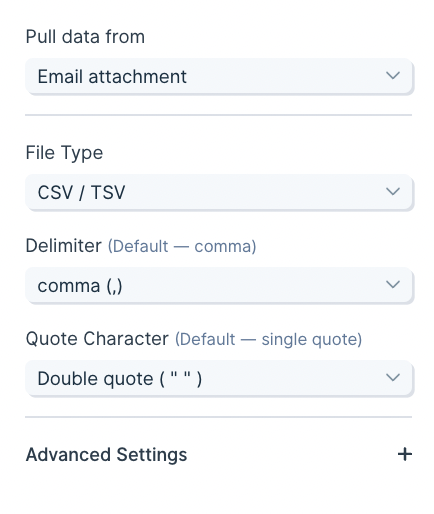
Custom settings
This step contains optional Advanced settings, where you can tell Parabola to skip a certain number of rows or columns when receiving the attached file.
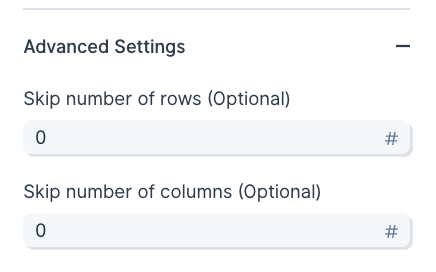
Auto-forwarding emails into a Parabola flow
To auto-forward a CSV attachment to an email outside of your domain, you may need to verify the @inbound.parabola.io email address. The below example shows how to set this up in Gmail.
Video overview
Step-by-step instructions
1. Prepare Your Extract from Email Step in Parabola
- In your Parabola Flow, drag in a new Extract from Email step.
- Configure it to pull in email content, not just attachments.
- Click Update Results to save this configuration.
💡 You’ll use this address to forward emails into your Parabola Flow. Don't forget to copy this email address.
2. Set Up Forwarding in Gmail
- Go to Gmail → click the gear icon → See all settings.
- Navigate to the Forwarding and POP/IMAP tab.
- Click “Add a forwarding address.”
- Paste the email address from your Parabola step and click Next → Proceed.
3. Confirm the Gmail Forwarding Request via Parabola
- Back in Parabola, wait for the Parabola flow to run from receiving the verification email.
- Click to "View email content" and click on the auto-forwarding link
- Follow Parabola's prompt to view an external URL
- Once you're on the confirmation URL, click "Confirm"
✅ Gmail will now recognize the Parabola address as a valid forwarding destination.
4. Create a Gmail Filter to Automatically Forward Specific Emails
- In Gmail, go to Settings → Filters and Blocked Addresses → Create a new filter.
- Set criteria such as:
- From:
nycwarehouse@gmail.com - Subject:
New York City Warehouse Inventory - Has attachment: ✅
- From:
- Click Create filter, then:
- Check Forward it to and select your verified Parabola email address.
- Click Create filter.
5. Clean up your Flow (If necessary)
- If you created a temporary Extract from Email step just for the verification, you can now delete it.
- Your Parabola Flow will continue to receive the filtered, auto-forwarded emails daily.
Other troubleshooting tips
- If you do not see the email content come into the Flow after a few minutes, double-check the email settings on that step/Flow. Click on the gear icon in the lefthand side of the step where it says "View all Flow email settings". Make sure the checkbox "Reject emails that do not contain valid attachments" is unchecked.
- If it is already checked, check your email inbox for an email with the subject line, "Sorry, we were unable to process your email attachment". The verification link from gmail should be available in the email content of this email. Click on the verification link and you should have successful verified this forwarding address!
Pull multiple file attachments
By default, Flows will run with the first valid attached file. If you want the Flow to run through multiple attached files (multiple attachments on one email), open the “Email trigger settings” modal and change the setting to “Run the Flow once per attachment:”

(Access these settings from the Extract from email step, or from the Flow trigger settings on the published Flow page.)
For emails with multiple files attached, the Flow will run once per file received, sequentially.
- Files must be of the same type (CSV, XLS, PDF, or JSON) for the runs to process.
- The file type is defined in the initial step settings (”File type” dropdown).
- Any files received that are of a different type will cause a Flow run error.
Pull from email content
We also support the ability to pull in additional information about an email.The default behavior pulls:
- Subject
- Body (plain text)
- CC
- From
- Attached file name
Additional fields:
- Body (HTML)
- Body (all URLs)
- Attached file URL
To access these fields, you can toggle the “Pull data from" field to ‘Email content’. If you'd like to pull both an attachment and the subject and body, select ‘Email content and attachment’.
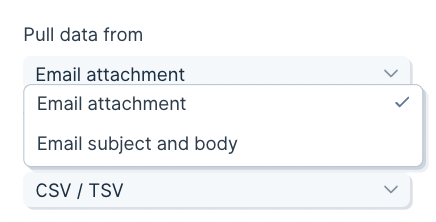
Extract data from the body of an email with AI
Use the “Extract data with AI” option to automatically extract tables and key values from email bodies to create structured output.
Enable this option under "Parsing settings" when pulling in the “Email content”.
Pull a sheet from an Excel file based on file position
Use the "position is" option when pulling in an attached Excel document to specify which sheet to pull data from by its position, rather than its name. This is great for files that have key data in consistent sheet positions, but may not always have consistent sheet names.
When using this option, only the number of sheets that are in the last emailed file will show in the dropdown. If a Flow using these settings is run and there is no sheet in the specified position, the step will error.
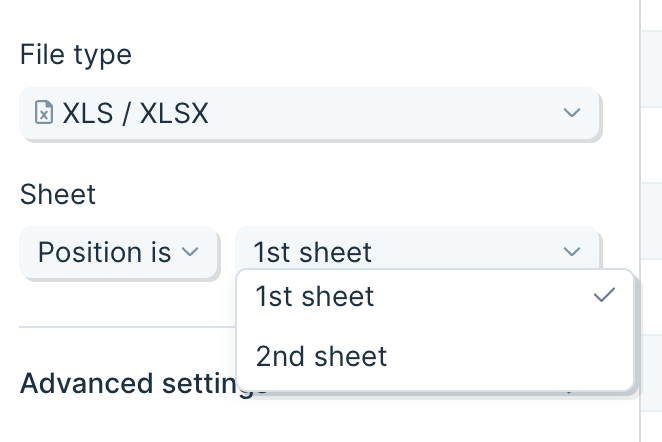
Helpful tips
- This step will run every time the dedicated email address receives a new attached file. This is useful for triggering your flow to run automatically, outside of a dedicated schedule or webhook.
- If your XLS file has multiple sheets, this step auto-selects the first sheet but can be set to look for a specific sheet.
- This step can handle attached files that are up to 5MB.
- Each run of a Flow uses one file. If your Flow has multiple Extract from email steps, they will all access the same email / file.
- What happens when multiple emails are received by your flow: If your flow is processing and another email (or multiple) comes in, then they will queue up to be pulled into your flow in the order they were received. All emails sent to a flow (up to 1,000 total) will be queued up and processed.
- By default, emails that are sent to Flow email addresses must have a valid attachment. You can disable that, and allow emails without attachments, by accessing the email trigger management modal and disabling the checkbox.
- This step can only ingest data from an email, not download a file. To generate and download a CSV from a link in an email, take the following steps:
- Extract the CSV’s URL from the email content using Extract from email
- Pass the URL into a Run another Flow step at the end of the Flow
- Begin your destination Flow with Pull from file queue
- End the destination Flow with a Generate CSV file step
Use the "Extract data with AI" option to extract tables of data and individual values from messy and difficult excel files.
Understanding your Excel data
When extracting data from an Excel file, use the settings to extract a table, or individual values (or both)
- Tables should be composed of columns and rows, with a row representing the names of the columns
- Individual values are single pieces of data that are applicable to the entire document. For example, a date at the top of a document or an invoice number
- Columns and individual values can be given additional information to ensure the tool is identifying and returning the correct information - more on that below!
Step Configuration
Selecting Excel extraction
Once you have an Excel file in your flow, select "Extract data with AI". You will see options to add details to "Extract a table" and/or "Extract individual values".
Clicking on either of those will show additional fields to fill out. Each step can extract 1 table and any number of individual values.

Extract a table
Once you enable table extraction, do the following:
- Give your table a description - this is used by AI to find the table so it's important to be clear and precise, especially if many tables are present.
- Define your columns - each column can be named, given example values, and additional instructions. If a column is conceptually clear (i.e. "Item description") then a name might be all you need. But if the name of the column is ambiguous, or its values are ambiguous, it is best practice to add example cell values, as well as additional instructions describing what this column represents and how an AI should find it.
Extract individual values
Once you enable individual value extraction, do the following:
- Define your value - each value can be named, given example values, and additional instructions. If a value is conceptually clear (i.e. "Port of entry") then a name might be all you need. But if the name of the column is ambiguous, or its values are ambiguous, it is best practice to add example cell values, as well as additional instructions describing what this value represents and how an AI should find it.
Choosing the "type" for a column or individual value
Columns and individual values are Text by default. But you can change that to improve accuracy:
- Text - anything
- True / False - results in either "True" or "False", can be used to detect checkmarks and other indicators
- Number - will remove trailing zeros on any number
- Currency -converts the currency to a number
- Date - uses "2022-09-27T18:00:00.000" format
- Signature - converts signatures to text
- List of options - chooses from a list of possible options you provide
Check out this Parabola University video for a quick intro to our PDF parsing capabilities, and see below for an overview of how to read and configure your PDF data in Parabola.
Understanding your PDF data
Parabola’s Pull from PDF file step can be configured to return Columns or Keys
- Columns are parts of tables that are likely to have more than one row associated with them
- Keys are single pieces of data that are applicable to the entire document. As an example - “Total” rows or fields like dates that only appear once at the top of a document are best expressed as keys
- Sometimes AI can interpret something as a column or a key that a human might consider the other. If the tool is not correctly pulling a piece of information, you might try experimenting with columns versus keys for that data point
- Both columns and keys can be given additional information from you to ensure the tool is identifying and returning the correct information - more on that below!
Step Configuration
You can use Extract from PDF, Extract from email, and Pull from file queue to parse PDFs. Once you have a PDF file uploaded into your Flow, the configuration settings are uniform.
Extract a table
1. Auto-detected Table (default)
Parabola scans your PDF, detects possible tables, and labels the most likely columns. This option uses LLM technology and works exceptionally well if the PDF document has a clear, structured table. All detected tables will be available in the sub-dropdown under the "Use an auto-detected table" dropdown.
- Quickest setup
- Works best when your table has headers
- You can manually add more columns or keys after
2. Define a Custom Table
Manually define the structure of your table if the AI didn’t pick it up. You can name the table and define the columns that you want to extract from the PDF by clicking on the + Add Column button.
- Good for multi-table documents
- Works well with tables spread across multiple pages
- Requires a bit more setup
3. Extract All Data (OCR-first mode)
Use OCR to return all text from the PDF — helpful if the structure is complex or you're feeding the result into an AI step later. We only recommend this option if the first two extraction methods aren't yielding the desired results.
Return formats:
- All data → Every value, one per row
- Table data → Tables split by page, each with a table ID
- Key-value pairs → Labeled items like SKU: 12345
- Raw text → One cell per page, useful for follow-up AI parsing
Extract values
If there are document-level values like invoice date and PO number that you want to extract, add them as keys in this section. You can add this by clicking on the “+ Add key” button. Each key that you configure will be represented as its own column and the value will be repeated across all the rows of the resulting data set.
- Column and key names can be descriptive or instructive, and do not need to match exactly what the PDF says. However, you should try to ensure the name is something that the underlying AI can associate with the desired column of data
- Providing examples is the best way to increase the accuracy of column (or key) parsing
- The “Additional instructions to find this value” field is not required, however, here you can input further instructions on how to identify a value as well as instructions on how to manipulate that value. For example in a scenario where you want to make two distinct columns out of a singular value in the file, say an order number in the format “ABC:123". You might use the prompt - “Take the order ID and extract all of the characters before the “:” into a new column”
See below how in this case with handwriting, with more instructions the tool is able to determine if there is writing next to the word “YES” or “NO”.
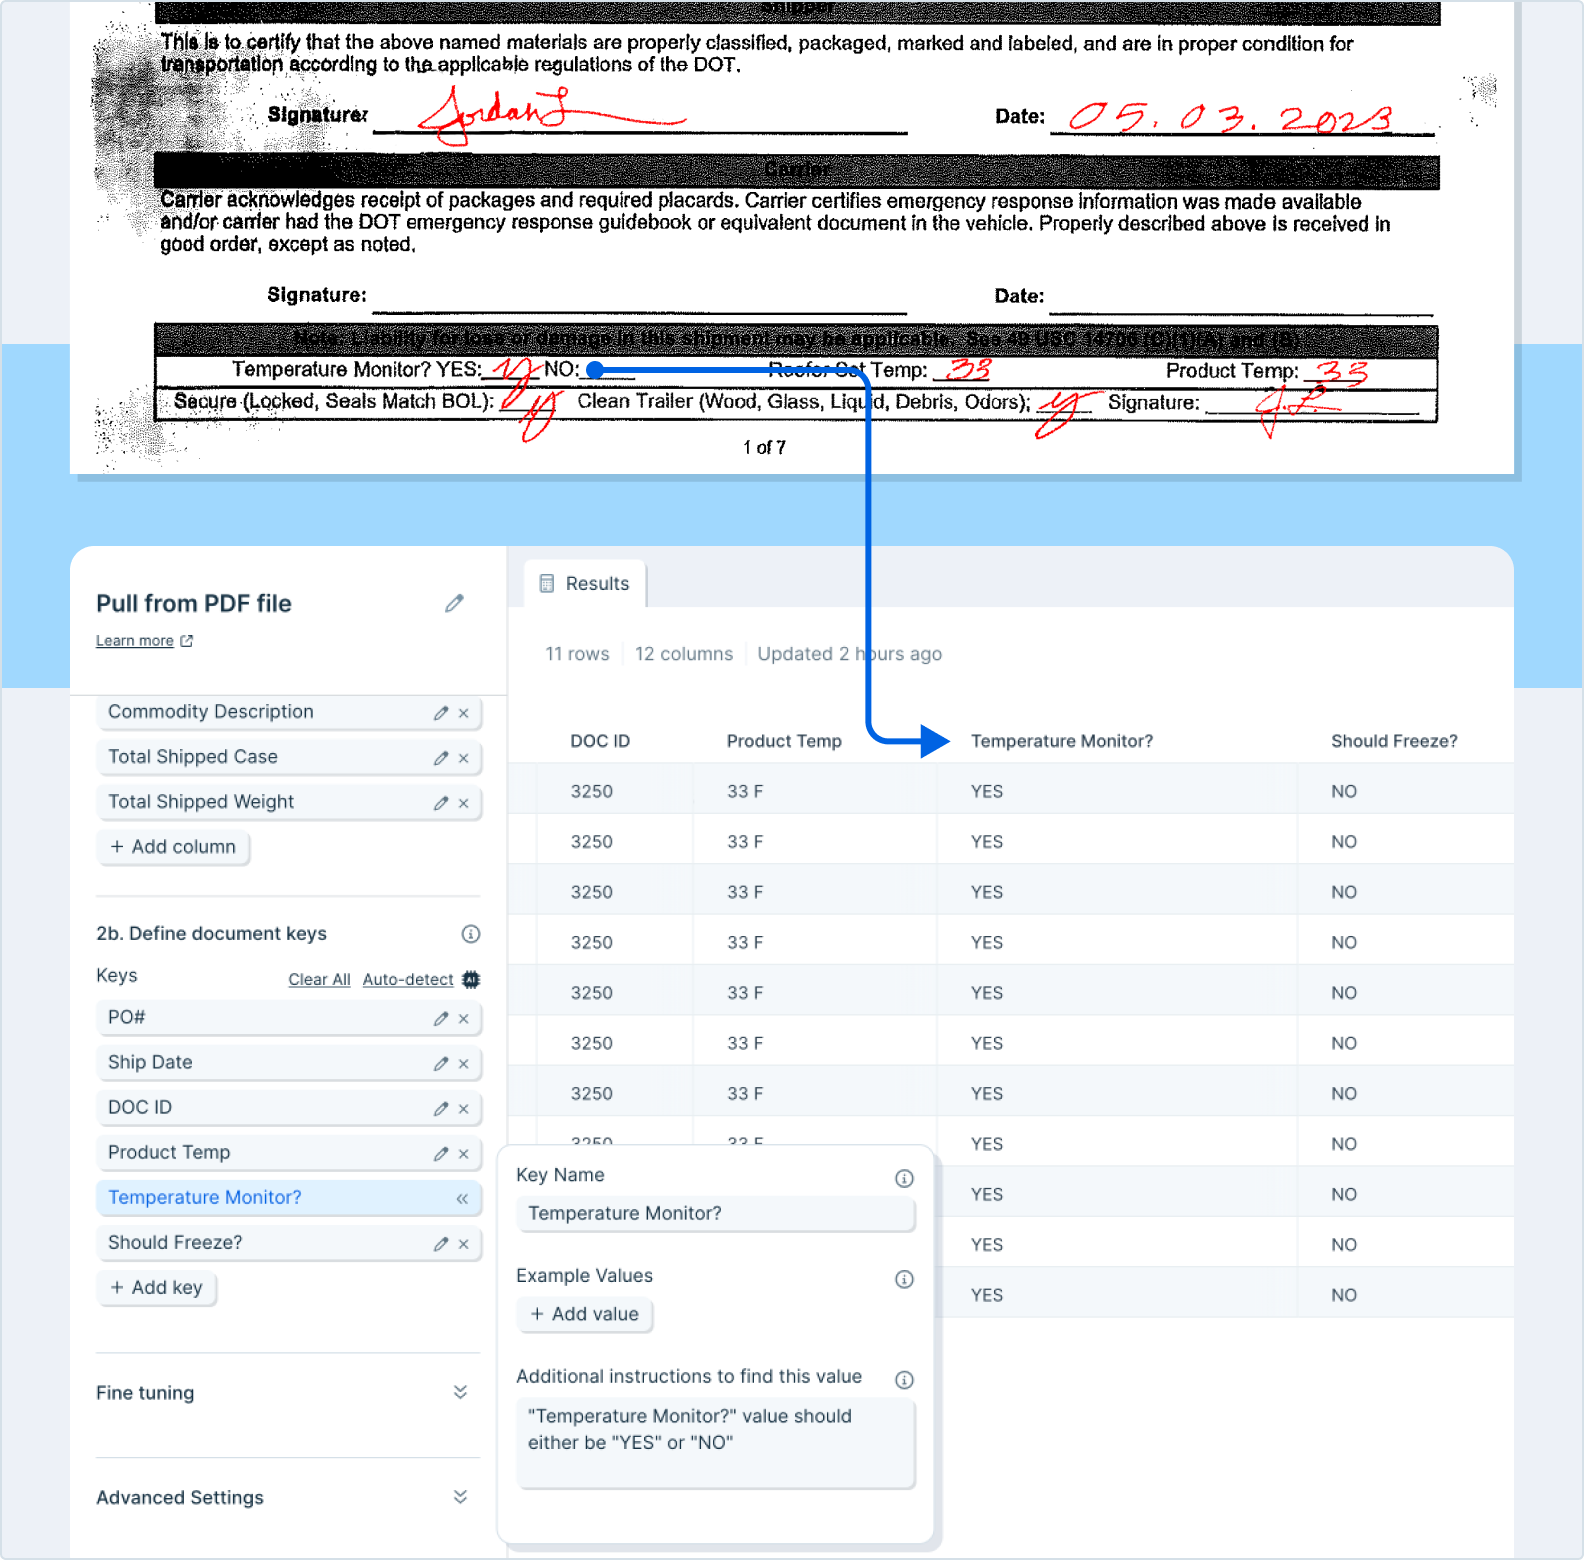
Fine Tuning
You can give the AI more context by typing additional context and instructions into this text box. Try using specific examples, or explain the situation and the specific desired outcome. Consult the chat interface on the lefthand side to help you write clear instructions.
Advanced Settings
1. Text parsing approach
You can specify the text parsing approach if necessary. The default setting is “Auto” and we recommend keeping it this way if possible. If it’s not properly parsing your PDF, you can choose between “OCR” and “Markdown”.
- OCR - This will use a more sophisticated version of OCR text extraction that can be helpful for complex documents such as those with handwriting. This more advanced model may, however, result in the tool running slower.
- Markdown - This will use Markdown for parsing. It is generally faster for parsing and may work better for certain documents, like pdfs that have nested columns and rows.
2. Retry step on error
The checkbox will be checked by default. LLMs can occasionally return unexpected errors and oftentimes, re-running the step will resolve the issue. When checked, this step will automatically attempt to re-run one time when encountering an unexpected error.
3. Auto-update prompt versions
The checkbox will be unchecked by default. Occasionally Parabola updates step prompts in order to make parsing results more accurate/reliable. These updates may change output results, and as a result, auto-updating is turned off by default. Enable this setting to always use the most reset prompt versions.
4. Page filtering
The checkbox will be unchecked by default. This setting allows users to define specific pages of a document to parse. If you only need specific values that are consistently on the same page(s), this can drastically improve run time. If you do check this box off, please make sure to complete the dropdown settings that appear below.
- Keep, Remove, or Autodetect
- The Autodetect option will allow the parser to choose what pages to use.
- The first, the last, or these
- If you select “the first”, input a number in the “#” box to instruct how many pages from the beginning of the file should be parsed.
- If you select “the last”, input a number in the #” box to instruct how many pages from the end of the file should be parsed.
- If you select “these”, input a comma-separated list of numbers in the blank box to specify which pages. For example, if you put “1, 10, 16”, the step will parse the first, tenth, and sixteenth page only of the file.
- If you select “the first”, input a number in the “#” box to instruct how many pages from the beginning of the file should be parsed.
Usage tips & Other Notes
- The more document pages that are needed for parsing, the longer it may take. To expedite this process, you can configure the step to only review certain pages from your file. The fewer the pages, the faster the results!
- If you need to pull data across multiple tables (from a single file), you will likely need multiple steps – one per table.
- File size: PDF files must be <500 MB and 30 pages
- PDFs cannot be password protected
- We recommend always auditing the results returned in Parabola to ensure that they’re complete
Using child columns
Mark columns as “Child columns” if they contain rows that have values unique from the parent columns:
Before:
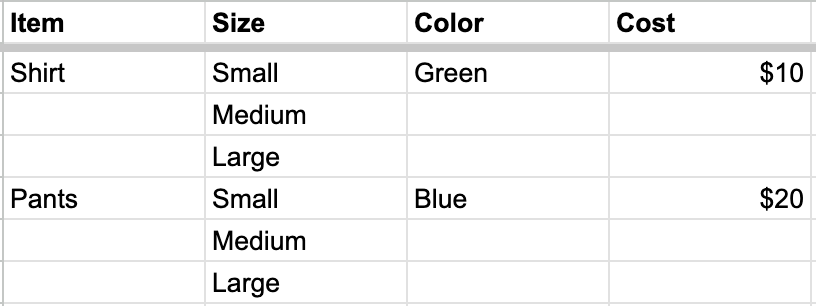
After marking “Size” as a child column:
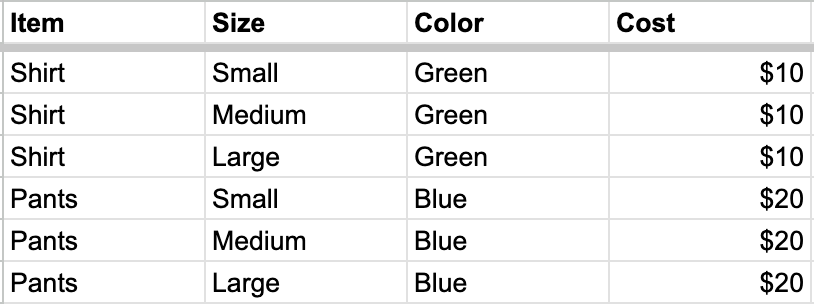
Extract from email can pull in data from a number of filetypes, including attached PDF files. Once configured, Parabola can be set to parse PDFs anytime the relevant email receives a PDF file.
Step configuration instructions can be found here.
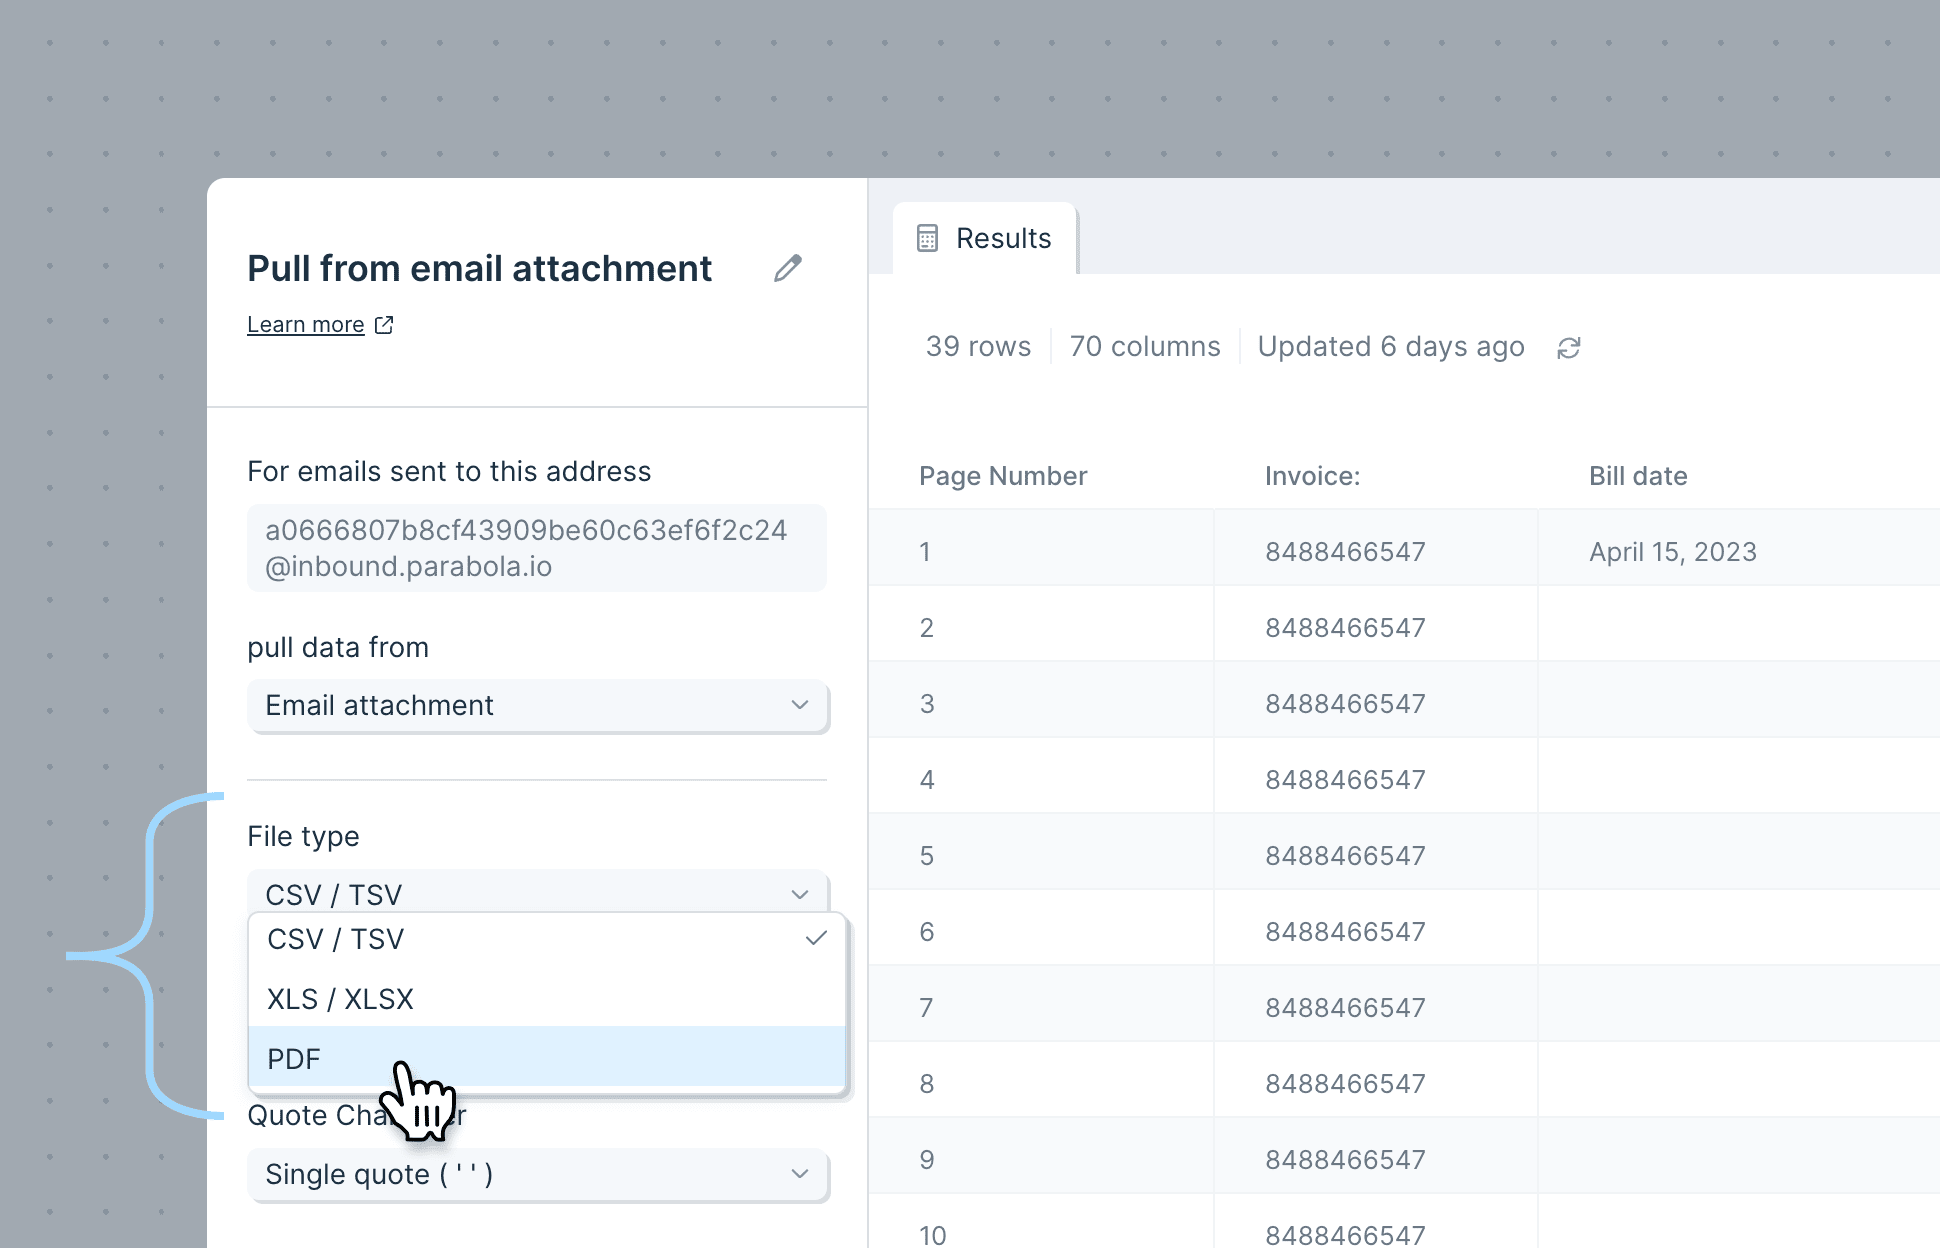
Alternative option: Pull from file queue - PDF files
Pull from file queue can receive PDF files and parse the relevant data. The file queue is a way to enqueue a Flow to run with a series of metadata + a file that is accessible via URL.
Runs can be added to the file queue via API (webhook) or via Run another Parabola Flow.
Integration:
Extract from PDF
You can import PDF files in a few different ways:
- Upload a file directly using the Extract from PDF file step
- Pull PDFs from inbound email using the Extract from email step
- Bulk process PDF files using the Pull from file queue step
Check out this Parabola University video for a quick intro to our PDF parsing capabilities, and see below for an overview of how to read and configure your PDF data in Parabola.
Understanding your PDF data
Parabola’s Pull from PDF file step can be configured to return Columns or Keys
- Columns are parts of tables that are likely to have more than one row associated with them
- Keys are single pieces of data that are applicable to the entire document. As an example - “Total” rows or fields like dates that only appear once at the top of a document are best expressed as keys
- Sometimes AI can interpret something as a column or a key that a human might consider the other. If the tool is not correctly pulling a piece of information, you might try experimenting with columns versus keys for that data point
- Both columns and keys can be given additional information from you to ensure the tool is identifying and returning the correct information - more on that below!
Step Configuration
You can use Extract from PDF, Extract from email, and Pull from file queue to parse PDFs. Once you have a PDF file uploaded into your Flow, the configuration settings are uniform.
Extract a table
1. Auto-detected Table (default)
Parabola scans your PDF, detects possible tables, and labels the most likely columns. This option uses LLM technology and works exceptionally well if the PDF document has a clear, structured table. All detected tables will be available in the sub-dropdown under the "Use an auto-detected table" dropdown.
- Quickest setup
- Works best when your table has headers
- You can manually add more columns or keys after
2. Define a Custom Table
Manually define the structure of your table if the AI didn’t pick it up. You can name the table and define the columns that you want to extract from the PDF by clicking on the + Add Column button.
- Good for multi-table documents
- Works well with tables spread across multiple pages
- Requires a bit more setup
3. Extract All Data (OCR-first mode)
Use OCR to return all text from the PDF — helpful if the structure is complex or you're feeding the result into an AI step later. We only recommend this option if the first two extraction methods aren't yielding the desired results.
Return formats:
- All data → Every value, one per row
- Table data → Tables split by page, each with a table ID
- Key-value pairs → Labeled items like SKU: 12345
- Raw text → One cell per page, useful for follow-up AI parsing
Extract values
If there are document-level values like invoice date and PO number that you want to extract, add them as keys in this section. You can add this by clicking on the “+ Add key” button. Each key that you configure will be represented as its own column and the value will be repeated across all the rows of the resulting data set.
- Column and key names can be descriptive or instructive, and do not need to match exactly what the PDF says. However, you should try to ensure the name is something that the underlying AI can associate with the desired column of data
- Providing examples is the best way to increase the accuracy of column (or key) parsing
- The “Additional instructions to find this value” field is not required, however, here you can input further instructions on how to identify a value as well as instructions on how to manipulate that value. For example in a scenario where you want to make two distinct columns out of a singular value in the file, say an order number in the format “ABC:123". You might use the prompt - “Take the order ID and extract all of the characters before the “:” into a new column”
See below how in this case with handwriting, with more instructions the tool is able to determine if there is writing next to the word “YES” or “NO”.
Fine Tuning
You can give the AI more context by typing additional context and instructions into this text box. Try using specific examples, or explain the situation and the specific desired outcome. Consult the chat interface on the lefthand side to help you write clear instructions.
Advanced Settings
1. Text parsing approach
You can specify the text parsing approach if necessary. The default setting is “Auto” and we recommend keeping it this way if possible. If it’s not properly parsing your PDF, you can choose between “OCR” and “Markdown”.
- OCR - This will use a more sophisticated version of OCR text extraction that can be helpful for complex documents such as those with handwriting. This more advanced model may, however, result in the tool running slower.
- Markdown - This will use Markdown for parsing. It is generally faster for parsing and may work better for certain documents, like pdfs that have nested columns and rows.
2. Retry step on error
The checkbox will be checked by default. LLMs can occasionally return unexpected errors and oftentimes, re-running the step will resolve the issue. When checked, this step will automatically attempt to re-run one time when encountering an unexpected error.
3. Auto-update prompt versions
The checkbox will be unchecked by default. Occasionally Parabola updates step prompts in order to make parsing results more accurate/reliable. These updates may change output results, and as a result, auto-updating is turned off by default. Enable this setting to always use the most reset prompt versions.
4. Page filtering
The checkbox will be unchecked by default. This setting allows users to define specific pages of a document to parse. If you only need specific values that are consistently on the same page(s), this can drastically improve run time. If you do check this box off, please make sure to complete the dropdown settings that appear below.
- Keep, Remove, or Autodetect
- The Autodetect option will allow the parser to choose what pages to use.
- The first, the last, or these
- If you select “the first”, input a number in the “#” box to instruct how many pages from the beginning of the file should be parsed.
- If you select “the last”, input a number in the #” box to instruct how many pages from the end of the file should be parsed.
- If you select “these”, input a comma-separated list of numbers in the blank box to specify which pages. For example, if you put “1, 10, 16”, the step will parse the first, tenth, and sixteenth page only of the file.
- If you select “the first”, input a number in the “#” box to instruct how many pages from the beginning of the file should be parsed.
Usage tips & Other Notes
- The more document pages that are needed for parsing, the longer it may take. To expedite this process, you can configure the step to only review certain pages from your file. The fewer the pages, the faster the results!
- If you need to pull data across multiple tables (from a single file), you will likely need multiple steps – one per table.
- File size: PDF files must be <500 MB and 30 pages
- PDFs cannot be password protected
- We recommend always auditing the results returned in Parabola to ensure that they’re complete
Using child columns
Mark columns as “Child columns” if they contain rows that have values unique from the parent columns:
Before:
After marking “Size” as a child column:
Use Extract from PDF to work with a single PDF file. Upload a file by either dragging a PDF file anywhere onto the canvas, or click "Click to upload a file" to select a file from your file picker.
Step configuration instructions can be found here.
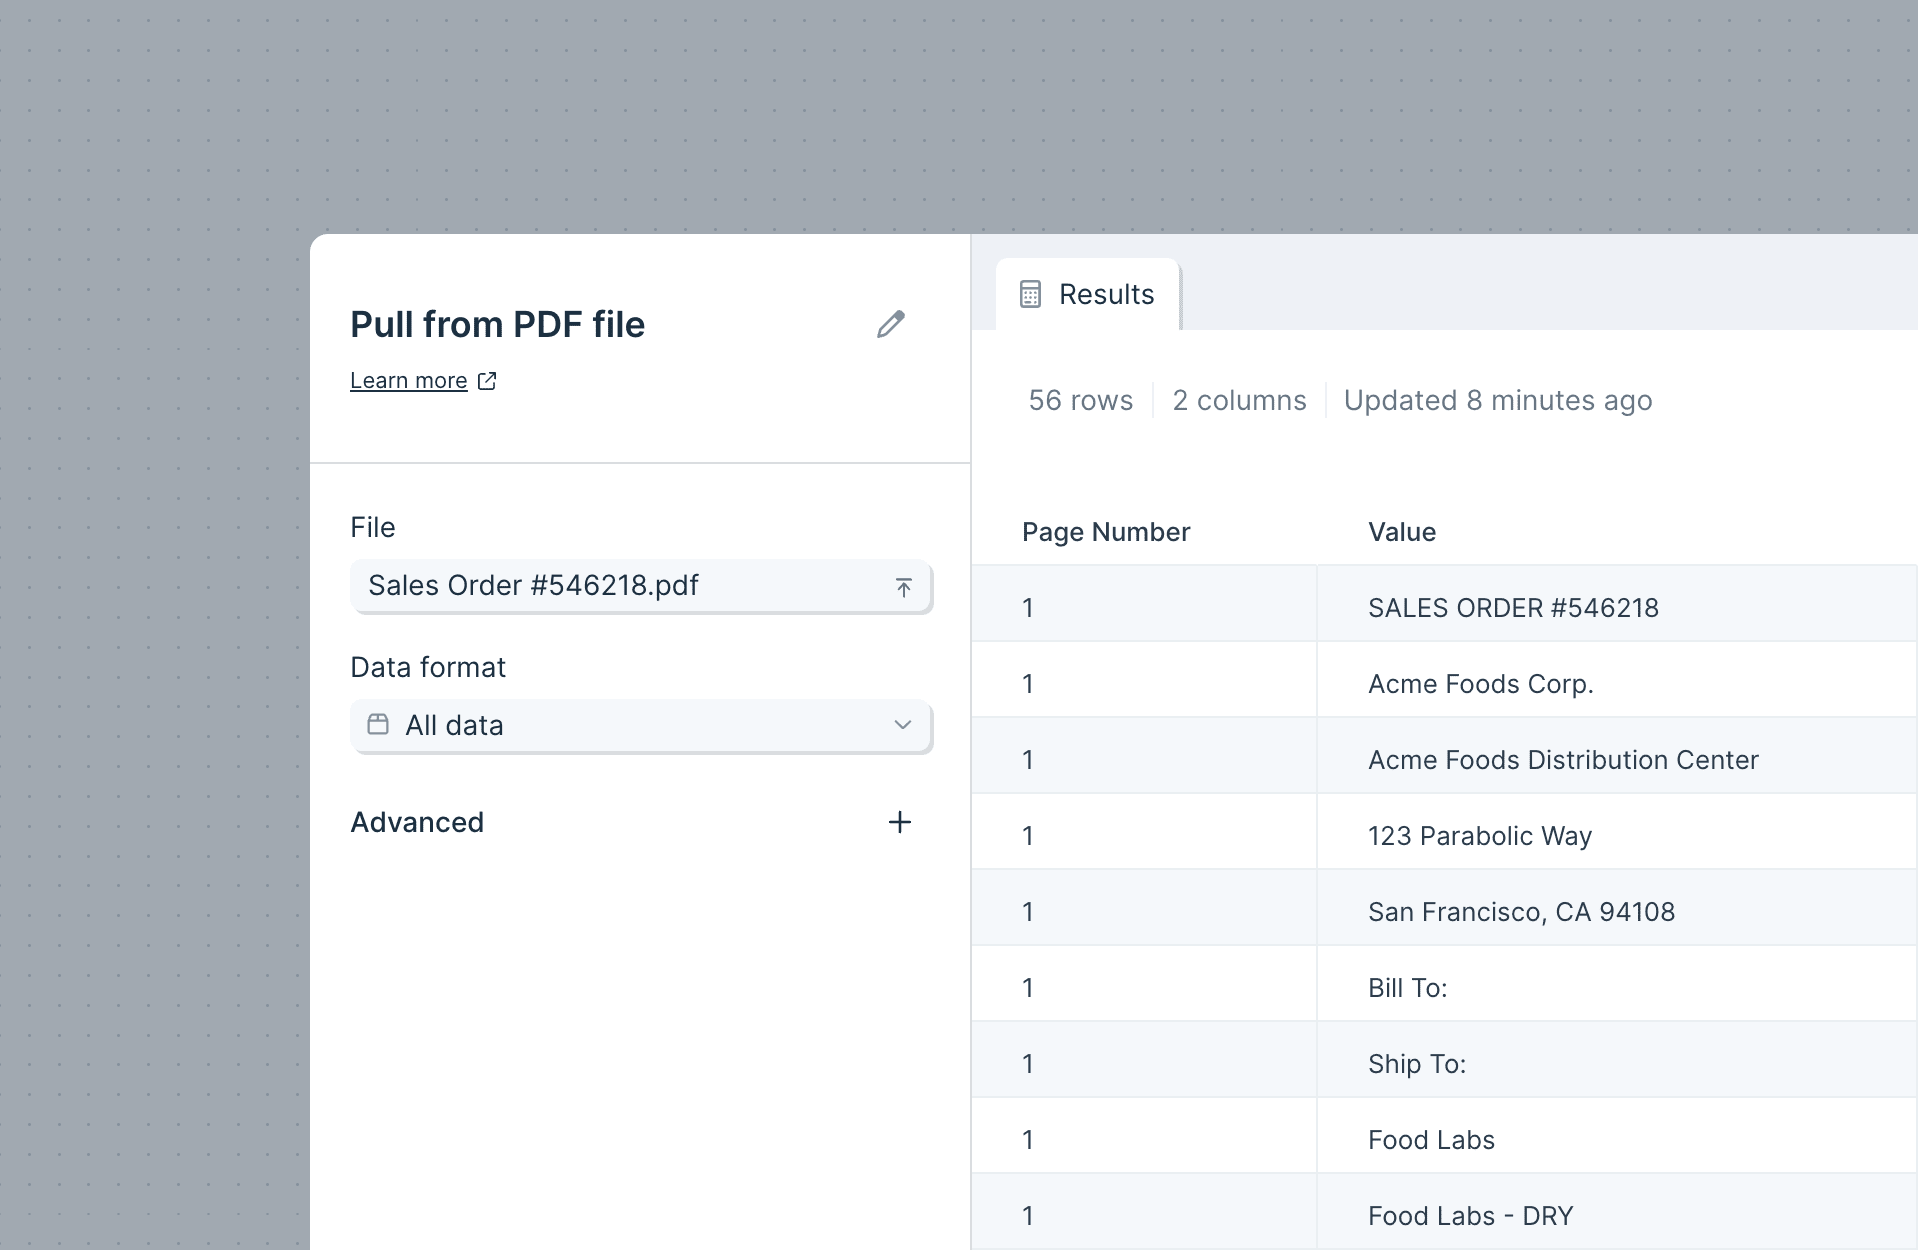
Extract from email can pull in data from a number of filetypes, including attached PDF files. Once configured, Parabola can be set to parse PDFs anytime the relevant email receives a PDF file.
Step configuration instructions can be found here.
Alternative option: Pull from file queue - PDF files
Pull from file queue can receive PDF files and parse the relevant data. The file queue is a way to enqueue a Flow to run with a series of metadata + a file that is accessible via URL.
Runs can be added to the file queue via API (webhook) or via Run another Parabola Flow.
Integration:
Facebook Ads
Use the Pull from Facebook Ads step to connect to any Facebook Ads account and pull in custom reports or columns and breakdowns.
Connect your Facebook Ads account
Double-click on the reviewing in webflow step and click the blue button to "Login with Facebook". A pop-up window will appear asking you to log in to your Facebook account to connect your data to Parabola.

If you ever need to change the Facebook Ads account that your step is connected to, or connect to multiple Facebook Ads account within a single flow, click "Edit accounts" at the top of the step. Head here for more info.
Default settings
The default settings for this flow will allow you to see data from your Facebook Ads account right away. If you have multiple Ads accounts, be sure to select the correct account here:

By default, the step will pull in insight for the last 7 days.
Selected columns:
- Reach
- Frequency
- Impressions
- Amount Spent
- CPM (Cost per 1,000 impressions)
- Link Clicks
- CTR (Link Click-Through Rate)
- CPC (Cost per Link Click)
Selected breakdown:
- Campaign Name
- Ad Set Name
- Ad Name
Presets
We've added a lot of standard reports that Facebook Ads shows in their Ads Manager page. Selecting a standard report will update your Columns and Breakdowns selection fields to show the columns that will be imported.
These standard reports can be used as it, or can also start as a great starting point to further customize your report.
Available standard reports:
- All Levels
- Campaign
- Ad Set
- Ad
- Objective
- Age
- Gender
- Age and Gender
- Country
- Region
- DMA Region
- Business Locations
- Placement
- Placement and Device
- Platform
- Platform and Device
- Time of Day (Ad Account)
- Time of Day (Viewer)
- Canvas Component
- Conversion Device
- Product ID
- Carousel Card
- Reactions
- Video View Type
- Video Sound
Custom settings
To further customize your Facebook Ads data being pulled into Parabola, you can select Columns and Breakdowns.
Each breakdown will also add its own column, and break each row into multiple rows. For example, you could look at your Reach column, and break it down by Campaign to see the reach of each campaign
Custom date ranges
You can either select a preset relative date or a custom date range in this step.

Select a preset relative date range, such as the Last 7 Days, to pull data from a range that will update every time this flow runs.
Select a custom period between, such as September 17, 2020 - September 24, 2020 to pull from a static date range that will always pull from that set range when the flow runs.
At the bottom of the step, we'll display the attribution window that is being used to product your report:
Using a 28-day click and 1-day view attribution window in your Facebook account's time zone.
Your Facebook account time zone will be used to determine how to pull data from your selected date range.
Known issues
Currently there is a known issue in the Facebook API that has not been resolved by their team yet. It causes certain requests to timeout or error when they should work. Our team is keeping tabs on the issue and will remove this known issue when it has been fixed by Facebook. In the meantime, you may need to remove certain columns of breakdowns from your settings in order to get the step working and returning data!
Helpful tips
- This step is available starting at our Plus plan.
Integration:
FedEx
The FedEx integration allows operators to automate custom shipping alerts, integrations, and reports using live data from Fedex.
How to authenticate
FedEx uses token client credentials for authentication. To connect FedEx to Parabola:
- Go to the FedEx Developer Portal and create an application to obtain your Client ID and Client Secret. See below for in-depth instructions.
- In Parabola, open the FedEx integration step and click Authorize. From there, you can enter your FedEx Client ID/Secret (and optionally Child Key/Secret).
Parabola will securely store your credentials and use them to authenticate each request to FedEx.
Creating an application in the FedEx Developer Portal
1. Navigate to the FedEx Developer Portal.
2. Click Login to access your FedEx account.
3. In the side-menu, select My Projects.
4. Click + CREATE API PROJECT.
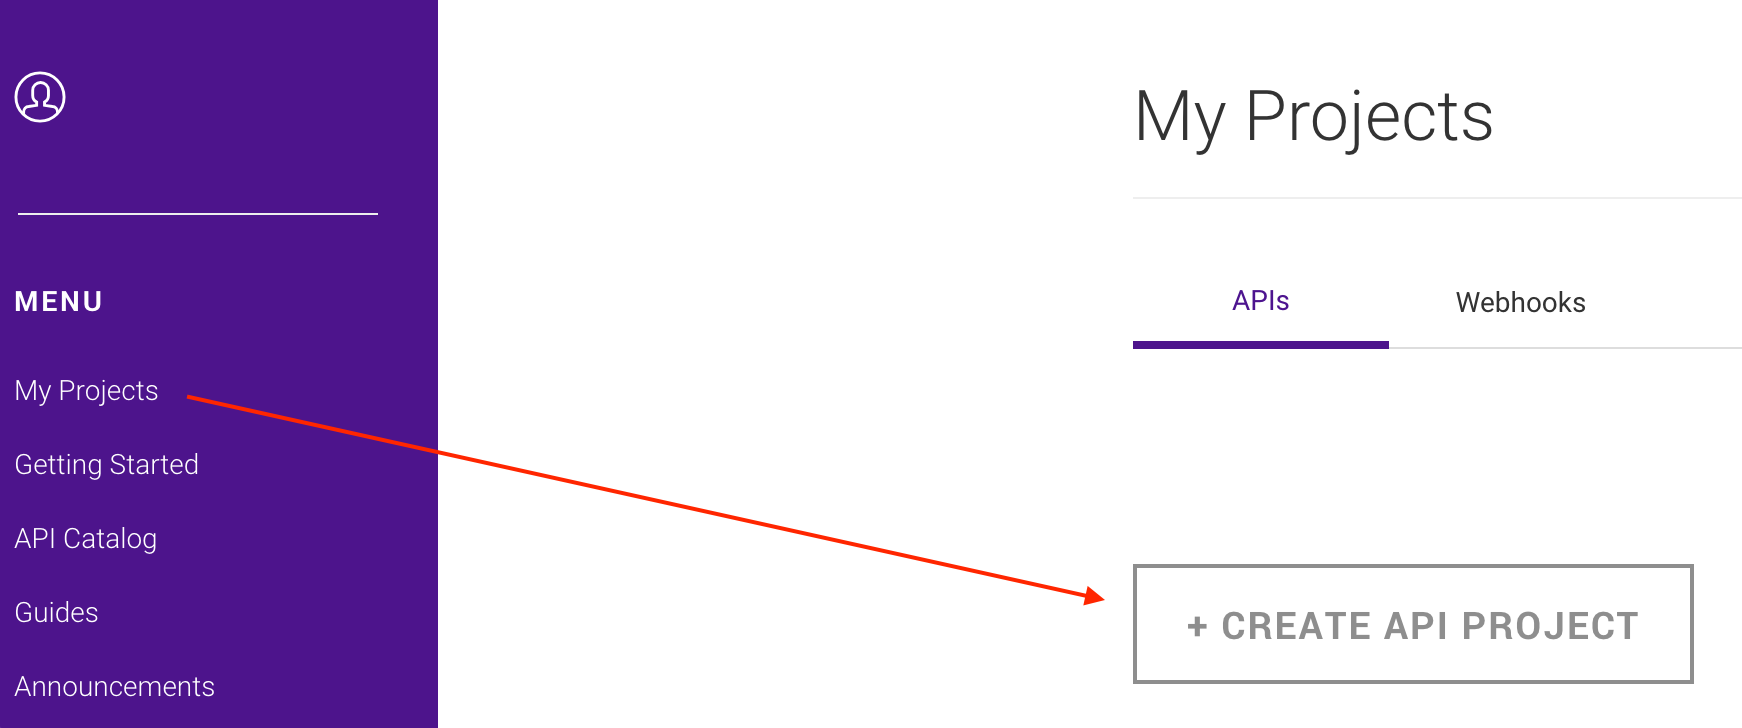
5. Complete the modal by selecting the option that best identifies your business needs for integrating with FedEx APIs.
6. Navigate to the Select API(s) tab.
7. Select the API(s) you want to include in your project. Based on the API(s) you select, you may need to make some additional selections.

⚠️ Note: If you select Track API, complete the additional steps below:
1. Select an account number to associate with your production key.
2. Review the Track API quotas, rate limits, and certification details.
3. Choose whether or not you want to opt-in to emails that will notify you if you exceed your quota.
8. Navigate to the Configure project tab.
9. Configure your project settings with name, shipping location, and notification preferences.
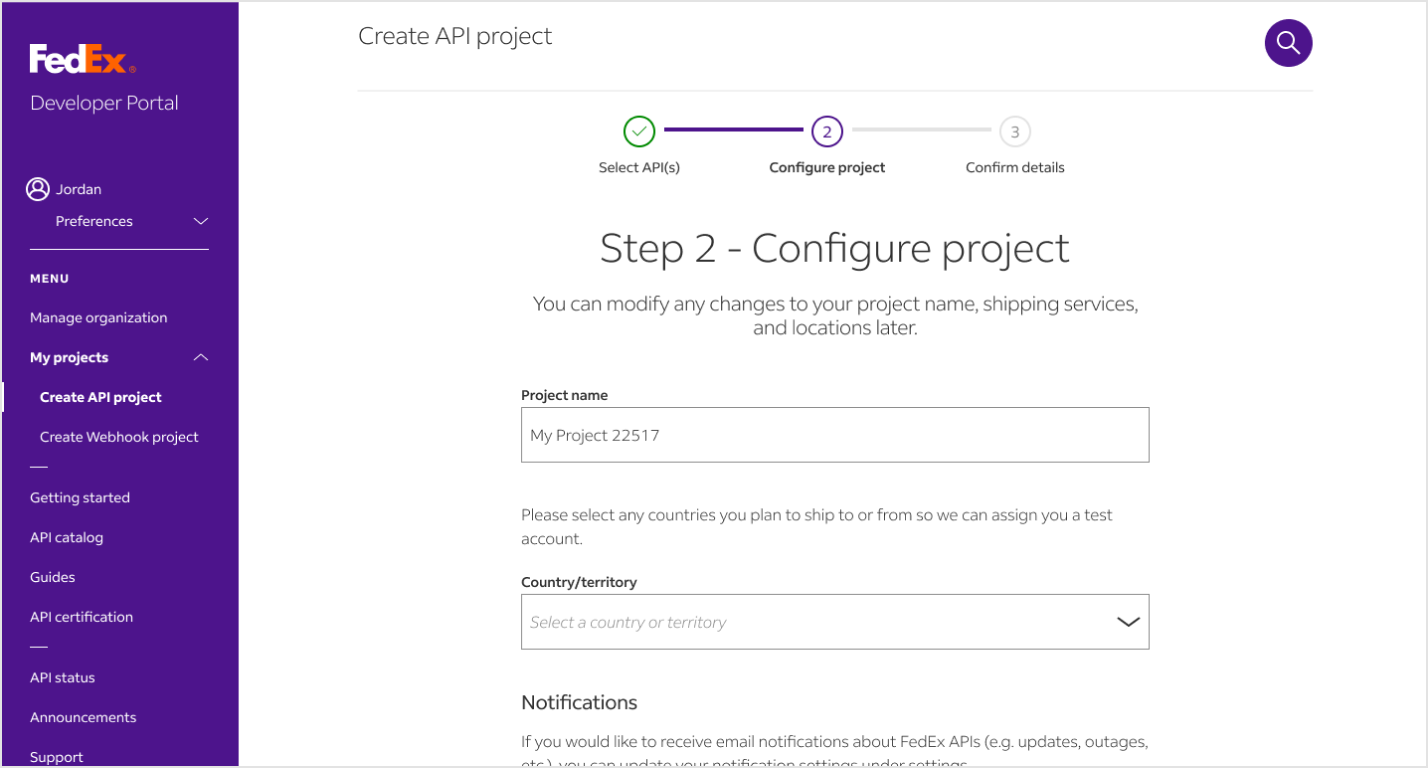
10. Navigate to the Confirm details tab.
11. Review your project details, then accept the terms and conditions.
12. On the Project overview page, retrieve your Client ID and Client Secret.
💡 Tip: Use Production Keys to connect to live production data in Parabola. Use Test Keys to review the request and response formats using from the documentation.
Available data
Using the FedEx integration in Parabola, you can bring in:
- Shipment tracking details: Tracking numbers, carrier codes, and shipment identifiers.
- Shipment events and scan history: Time-stamped location scans, event types, and delivery milestones.
- Package details: Weight, dimensions, package counts, and service descriptions.
- Origin and destination data: Full address information including city, state, postal code, and country.
- Status information: Current status codes and descriptions such as “In Transit,” “Delivered,” or “Exception.”
- Associated shipments: Multi-piece shipment data linked to a master tracking number.
- Reference-based tracking: Shipments tied to PO numbers, invoices, or customer references.
Common use cases
- Monitor delivery performance across regions and carriers.
- Reconcile proof-of-delivery documents with invoicing or ERP systems.
- Identify delayed or lost shipments and alert customer service teams.
- Consolidate tracking data from multiple warehouses or fulfillment centers.
- Generate daily shipment dashboards showing delivery statuses and exceptions.
- Audit carrier billing against actual delivery and weight data.
Tips for using Parabola with FedEx
- Schedule your flow daily to automatically refresh shipment data and stay ahead of delivery delays.
- Use Filters to flag shipments stuck in “In Transit” status for more than a set number of days.
- Combine with other systems (like Shopify, Netsuite, or your warehouse management system) to create end-to-end logistics visibility.
- Export tracking documents into cloud storage (Google Drive, OneDrive, etc.) or attach them to customer records automatically.
- Add Alerts in Parabola to notify your operations team when exceptions or delivery failures occur through Slack messages or email.
Integration:
File queue
The Pull from file queue receives a file URL (CSV, PDF, Excel) along with associated data. Use this to trigger Flows to process a file via a URL that is sent to the Flow.
This step is currently offered to users on our Advanced Plan. Check out the Pricing Page for additional information.
Sending a file to your Parabola Flow
The file queue processes files that are accessible via URL. To send a file to your Parabola Flow, make an API call to the file queue endpoint. The Pull from file queue step, once added and enabled, will show a modal containing the endpoint details. For example:
.png)
Any valid POST requests to that endpoint will trigger the Flow to run, processing the file using the file parsing settings within the step. Additional requests will be queued up to run one after another.
Alternatively, use the Run another Parabola Flow step with the following configuration to trigger runs of another Flow through the file queue:
.png)
Integration:
Flexport
How to authenticate
Flexport uses OAuth 2.0 Client Credentials for secure API access. To connect Flexport to Parabola:
- Get credentials from Flexport: Ask your Flexport account administrators to enable API access. You’ll receive client credentials (Client ID and Client Secret) or an access token. Your administrator will:
- Log into the Flexport Developer Portal at https://developers.flexport.com
- Navigate to API Credentials
- Click "Create Credentials"
- Select the appropriate resources (endpoints) you need access to and enable them
- Click "Create" to generate your credentials
- Copy your Client ID and Client Secret
- Add the Pull from Flexport step to your flow
- In your Parabola flow, add a Pull from Flexport step.
- Click Authorize, and then add expiring access token. Enter your Client ID and Client Secret when prompted. Parabola will automatically handle token exchange and renewal with this option; alternatively you can use a manual Bearer token.
- Once authenticated, select the Flexport resource you want to pull (Shipments, Bookings, Invoices, etc).
- Configure any filters such as date ranges, statuses, or specific identifiers.
Available data
Using the Flexport integration in Parabola, you can bring in a comprehensive range of logistics and freight data.
- Shipments: The core movement record, including key dates (ETD/ETA/actuals), milestones, buyers/consignees, related bookings, documents, customs entries, calculated weight/volume, dangerous goods, costs, and statuses.
- Bookings: Space reservations with carriers, including service details and requested dates. Includes associated Booking Line Items that describe booked goods and quantities.
- Shipment Containers (ocean): Container‑level details for ocean moves, including container numbers and attributes.
- Commercial Invoices: Commercial invoice headers and values associated to shipments or orders.
- Invoices: Flexport billing invoices you receive for logistics services and charges.
- Customs Entries: Declarations and entry details tied to shipments for brokerage and compliance.
- Documents: Files and metadata (e.g., BOL, packing list, invoice PDFs) attached to shipments and other records.
- Products: Catalog items, descriptions, and classification data used on documents and entries.
- Network – Companies, Company Entities, Contacts, Locations: Your trading partner graph (buyers, shippers, consignees), organizational entities, people, and addresses/locations.
Common use cases
- Shipment tracking:
- Inbound freight visibility & tracking
- ERP shipment reconciliation
- Cross‑carrier consolidation
- Cost tracking:
- Cost reporting by carrier and/or lane
- Centralized invoice database
- Reconciling shipment costs with POs and quotes
- ISF monitoring and reporting:
- Master dashboard for tracking filing statuses
- Alerts for missing or delayed filings
- Shipping milestone alerts:
- Slack or email alerts based on key milestone changes (e.g., ETA shifts, CPC departures)
Tips for using Parabola with Flexport
- Use transformation steps such as Expand JSON to re-format data to match your other systems or reporting dashboards.
- Schedule your flow to run daily (or more frequently) so your operations team has current ETAs, milestones, and charges.
- Use incremental pulls: Store the last successful run time and filter on updated dates to avoid reprocessing historical data.
- Alert on exceptions: Add conditional steps to flag missing documents, large ETA deltas, or invoice variances and send Slack/email alerts.
- Document handling: Pull document metadata first, filter to the file types you need, then retrieve and archive files to your DMS with consistent naming.
- Map business keys: Keep a crosswalk of Flexport IDs (shipment, booking, container) to your ERP/warehouse references for reliable joins.
Integration:
Frate
How to authenticate
- Get your API token in Frate Returns
- Open the Frate app and navigate to Settings.
- Under API Tokens, generate a new token.
- Once you create it, it will only be available for a one-time-copy, to make sure to save it right away to somewhere safe.
- Connect in Parabola
- Add a Pull from Frate step.
- Click Authorize and paste your Frate API Token when prompted.
Available data
Parabola can import the following from Frate Returns:
- Return groups: Grouped return records with IDs, associated order IDs/names, customer email, creation timestamps, and overall status. Filter by created/updated/shipped date ranges, order identifiers, and specific return group IDs.
- Shipments: Shipment details for returns, including shipment ID, carrier, tracking number, label URL, and current status.
- Allowlist items: Policy exception/allowlist entries with descriptions, creation timestamps, and permitted actions such as exchange, refund to original payment method, or refund to store credit.
Common use cases
- Pull return groups (and item-level context when available) to analyze patterns and trends by SKU, reason, and time window.
- Detect spikes in return rate, repeat-return customers, or high-defect SKUs and trigger Slack/Email alerts for rapid CX intervention.
- Combine Frate with sources like NetSuite and your WMS to produce cross-platform reports instantly.
- Track SLAs by measuring time from return creation → shipment → delivery to monitor processing efficiency and surface bottlenecks.
- Reconcile return and shipment data to confirm every return was shipped and received; auto-flag missing or duplicate records.
Tips for using Parabola with Frate Returns
- Filter first, then join Return Groups by date windows (created/updated/shipped) or specific orders to shrink payloads before joining to orders, CX, or ERP data.
- Create Slack/Email alerts for anomalies (e.g., spike in “pending” returns, repeat-return customers, or SKUs with high defect reasons).
- Track SLAs with timestamps to monitor processing speed and pinpoint slowdowns.
- Reconcile shipments automatically by flagging missing tracking numbers, duplicates, or statuses stuck in transit.
- Join returns data with NetSuite and your warehouse/WMS to power cross-platform reporting—no manual CSV exports.
- Schedule your flow to run hourly or daily so finance, CX, and ops dashboards stay current.
With Parabola + Frate, anything that used to start with a CSV export can now run hands-free.
Integration:
Front
The Pull from Front step pulls in data from your Front account so you can quickly make insightful reports on your team and customers.
Connect your Front account
To connect your Front account, select Authorize.
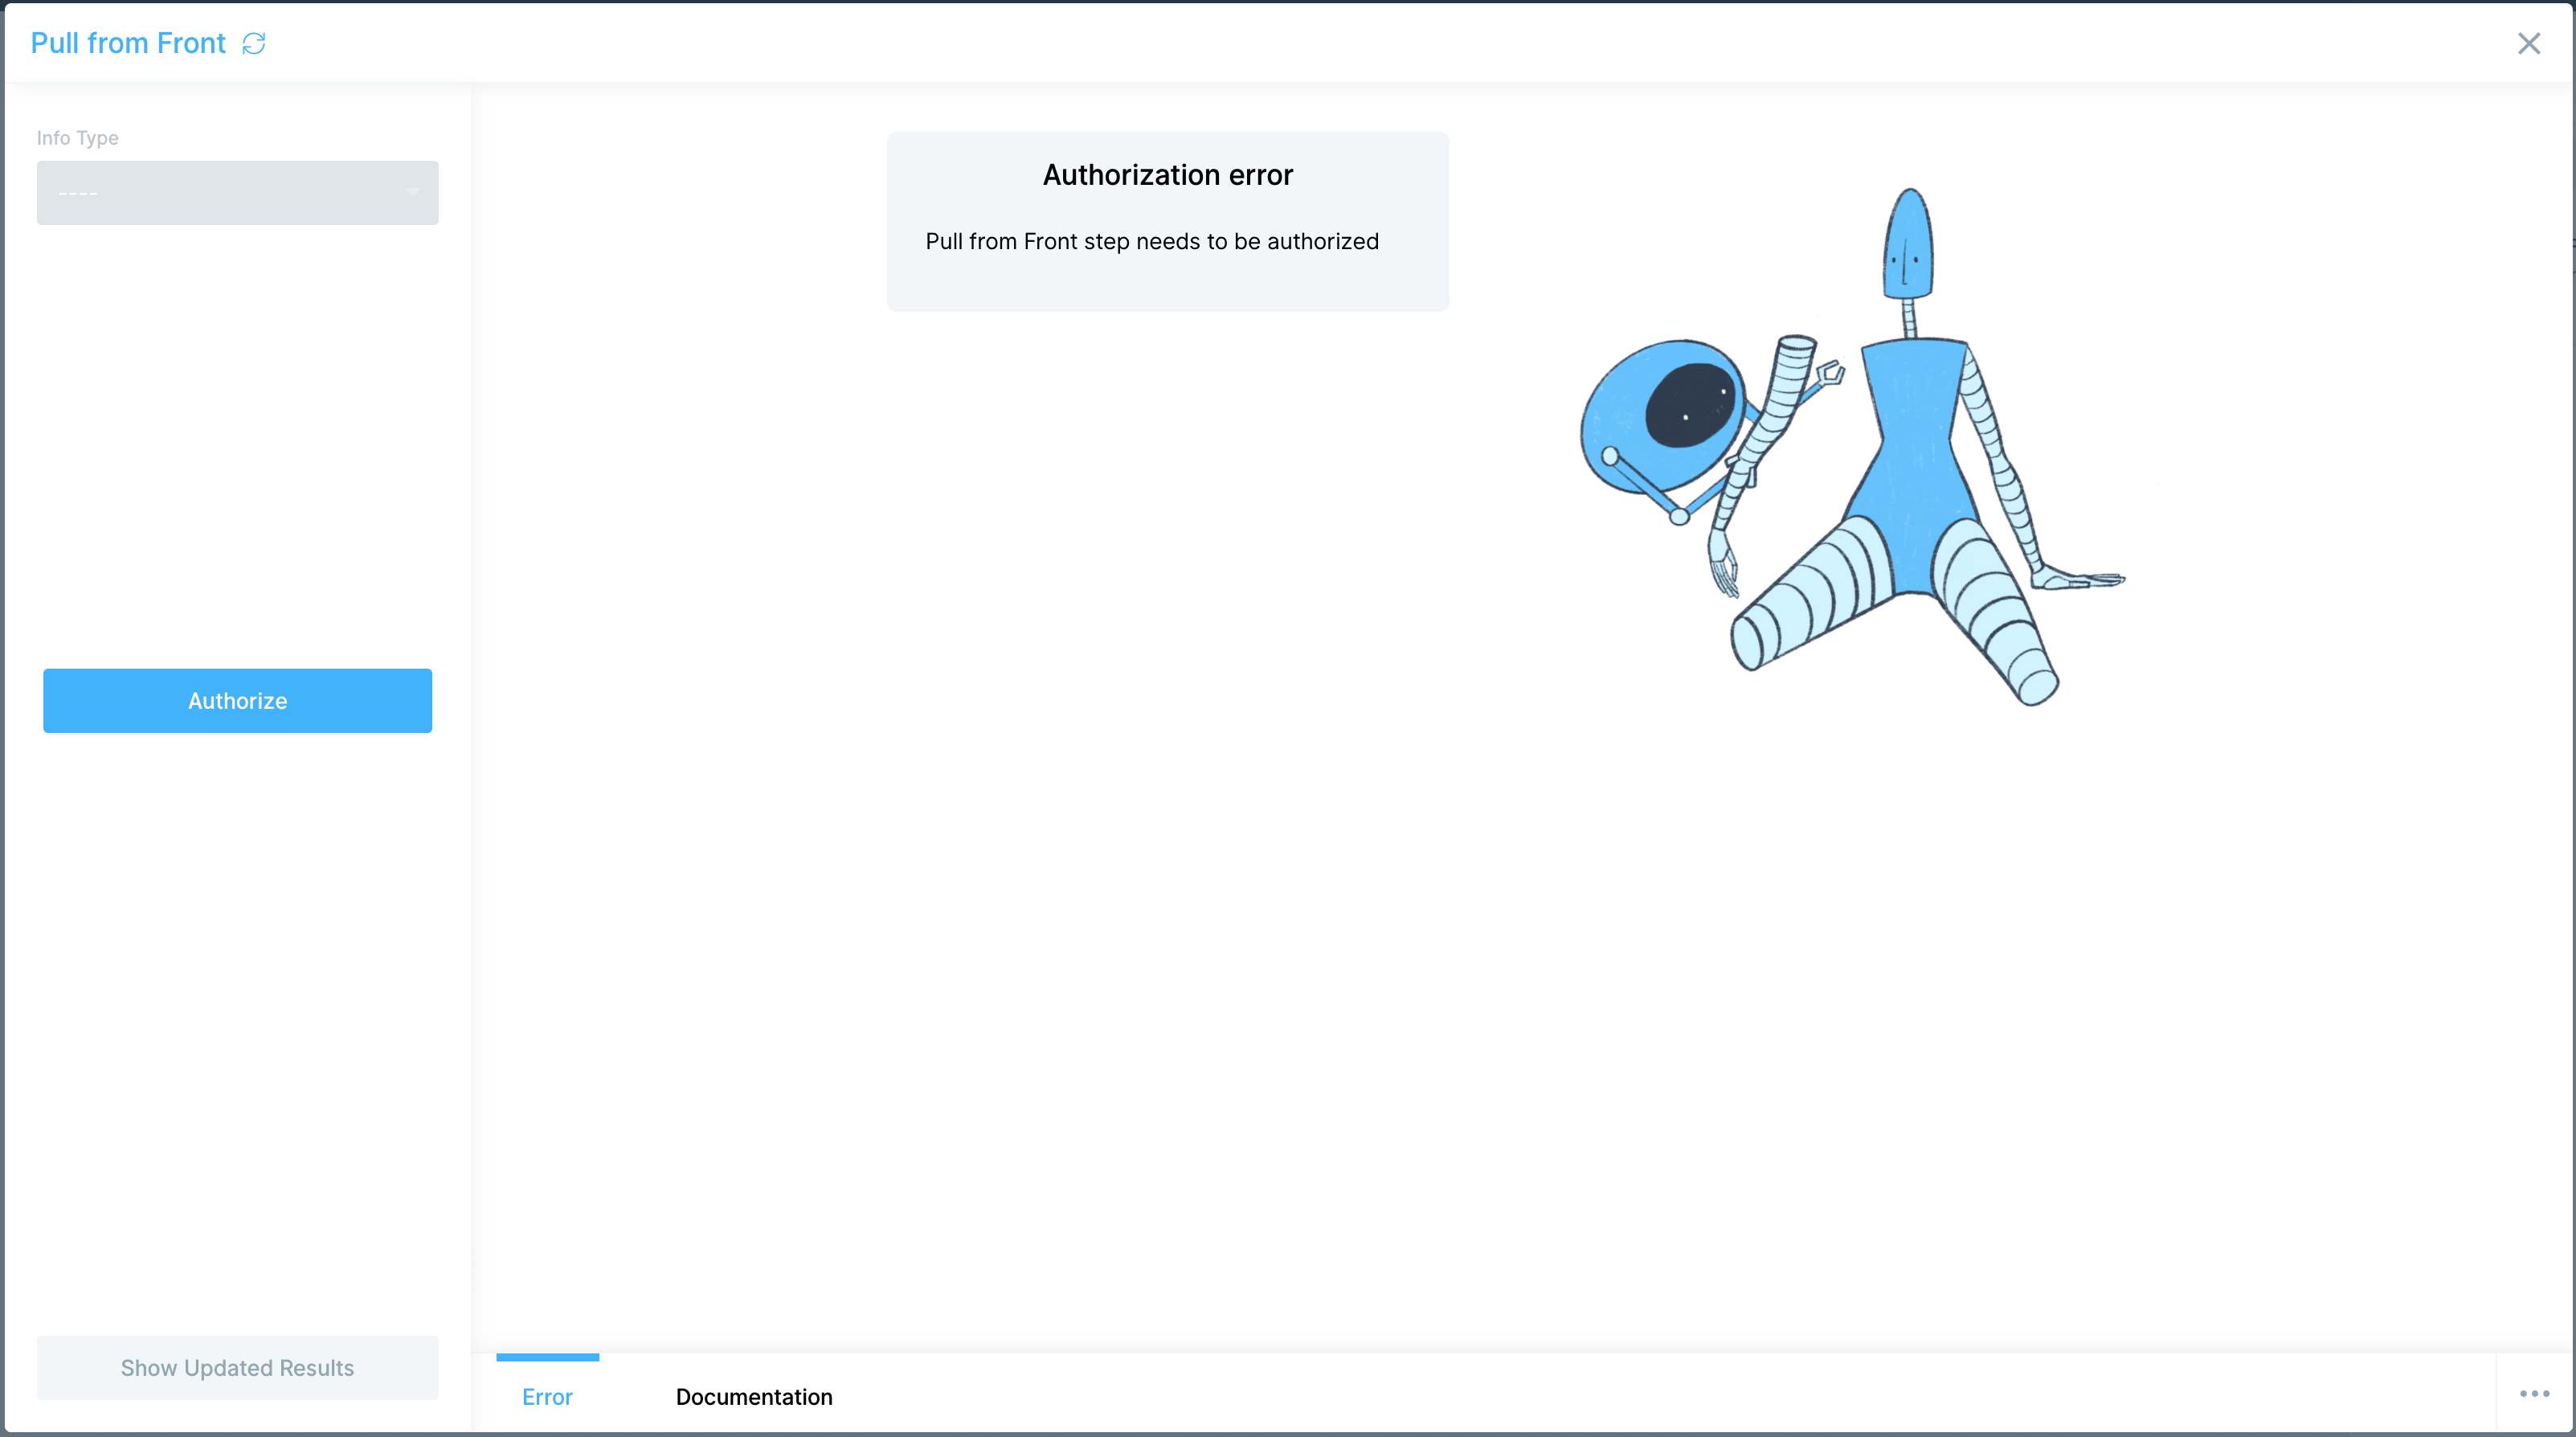
A new page will pop up asking you to Authorize again. After you do, it will return to your Parabola page.
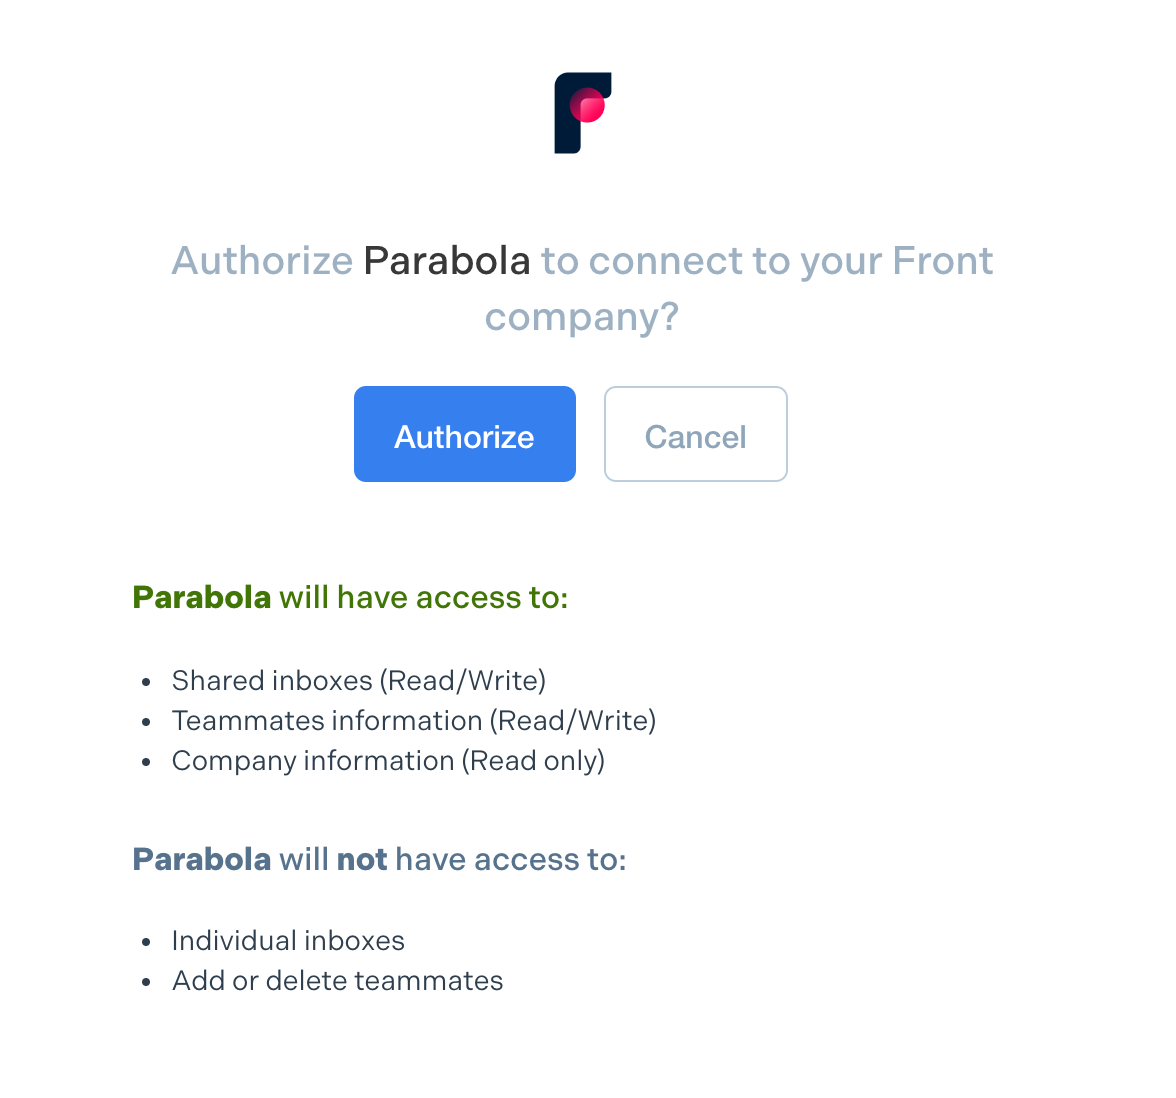
Custom settings
Once you're back in the step's settings, in the Info Type dropdown menu, select the type of data you'd like to pull in
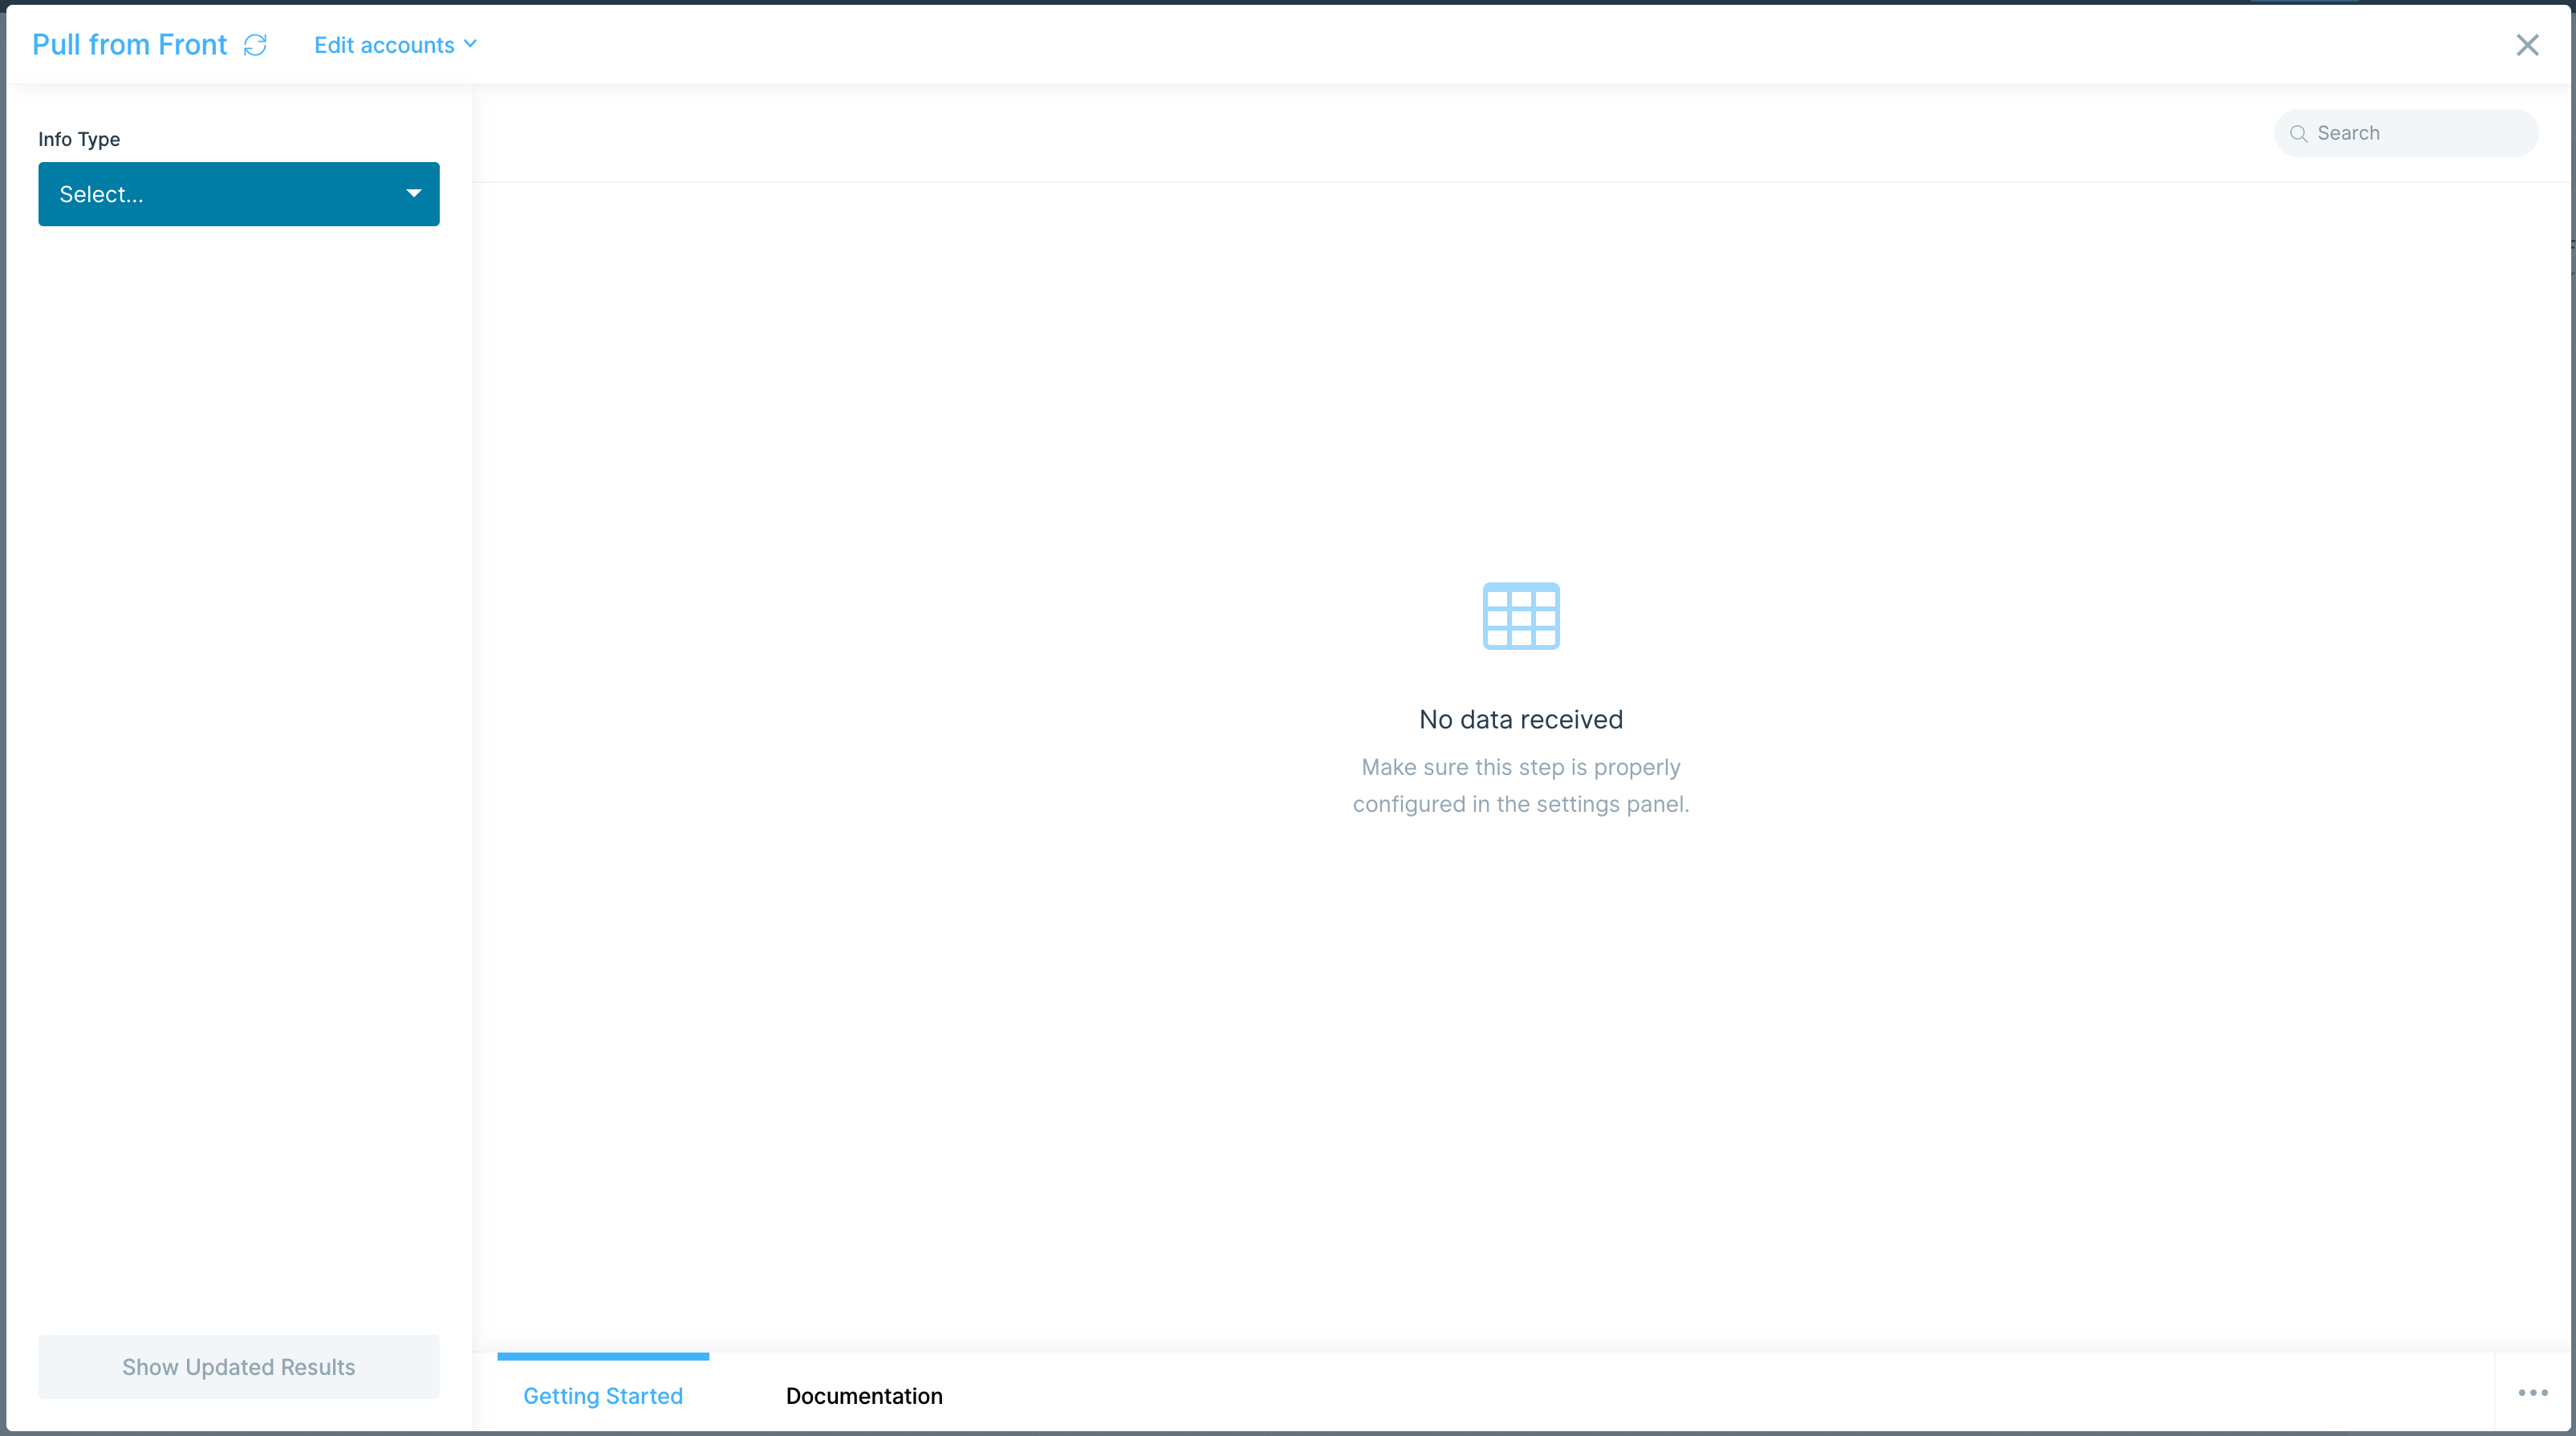
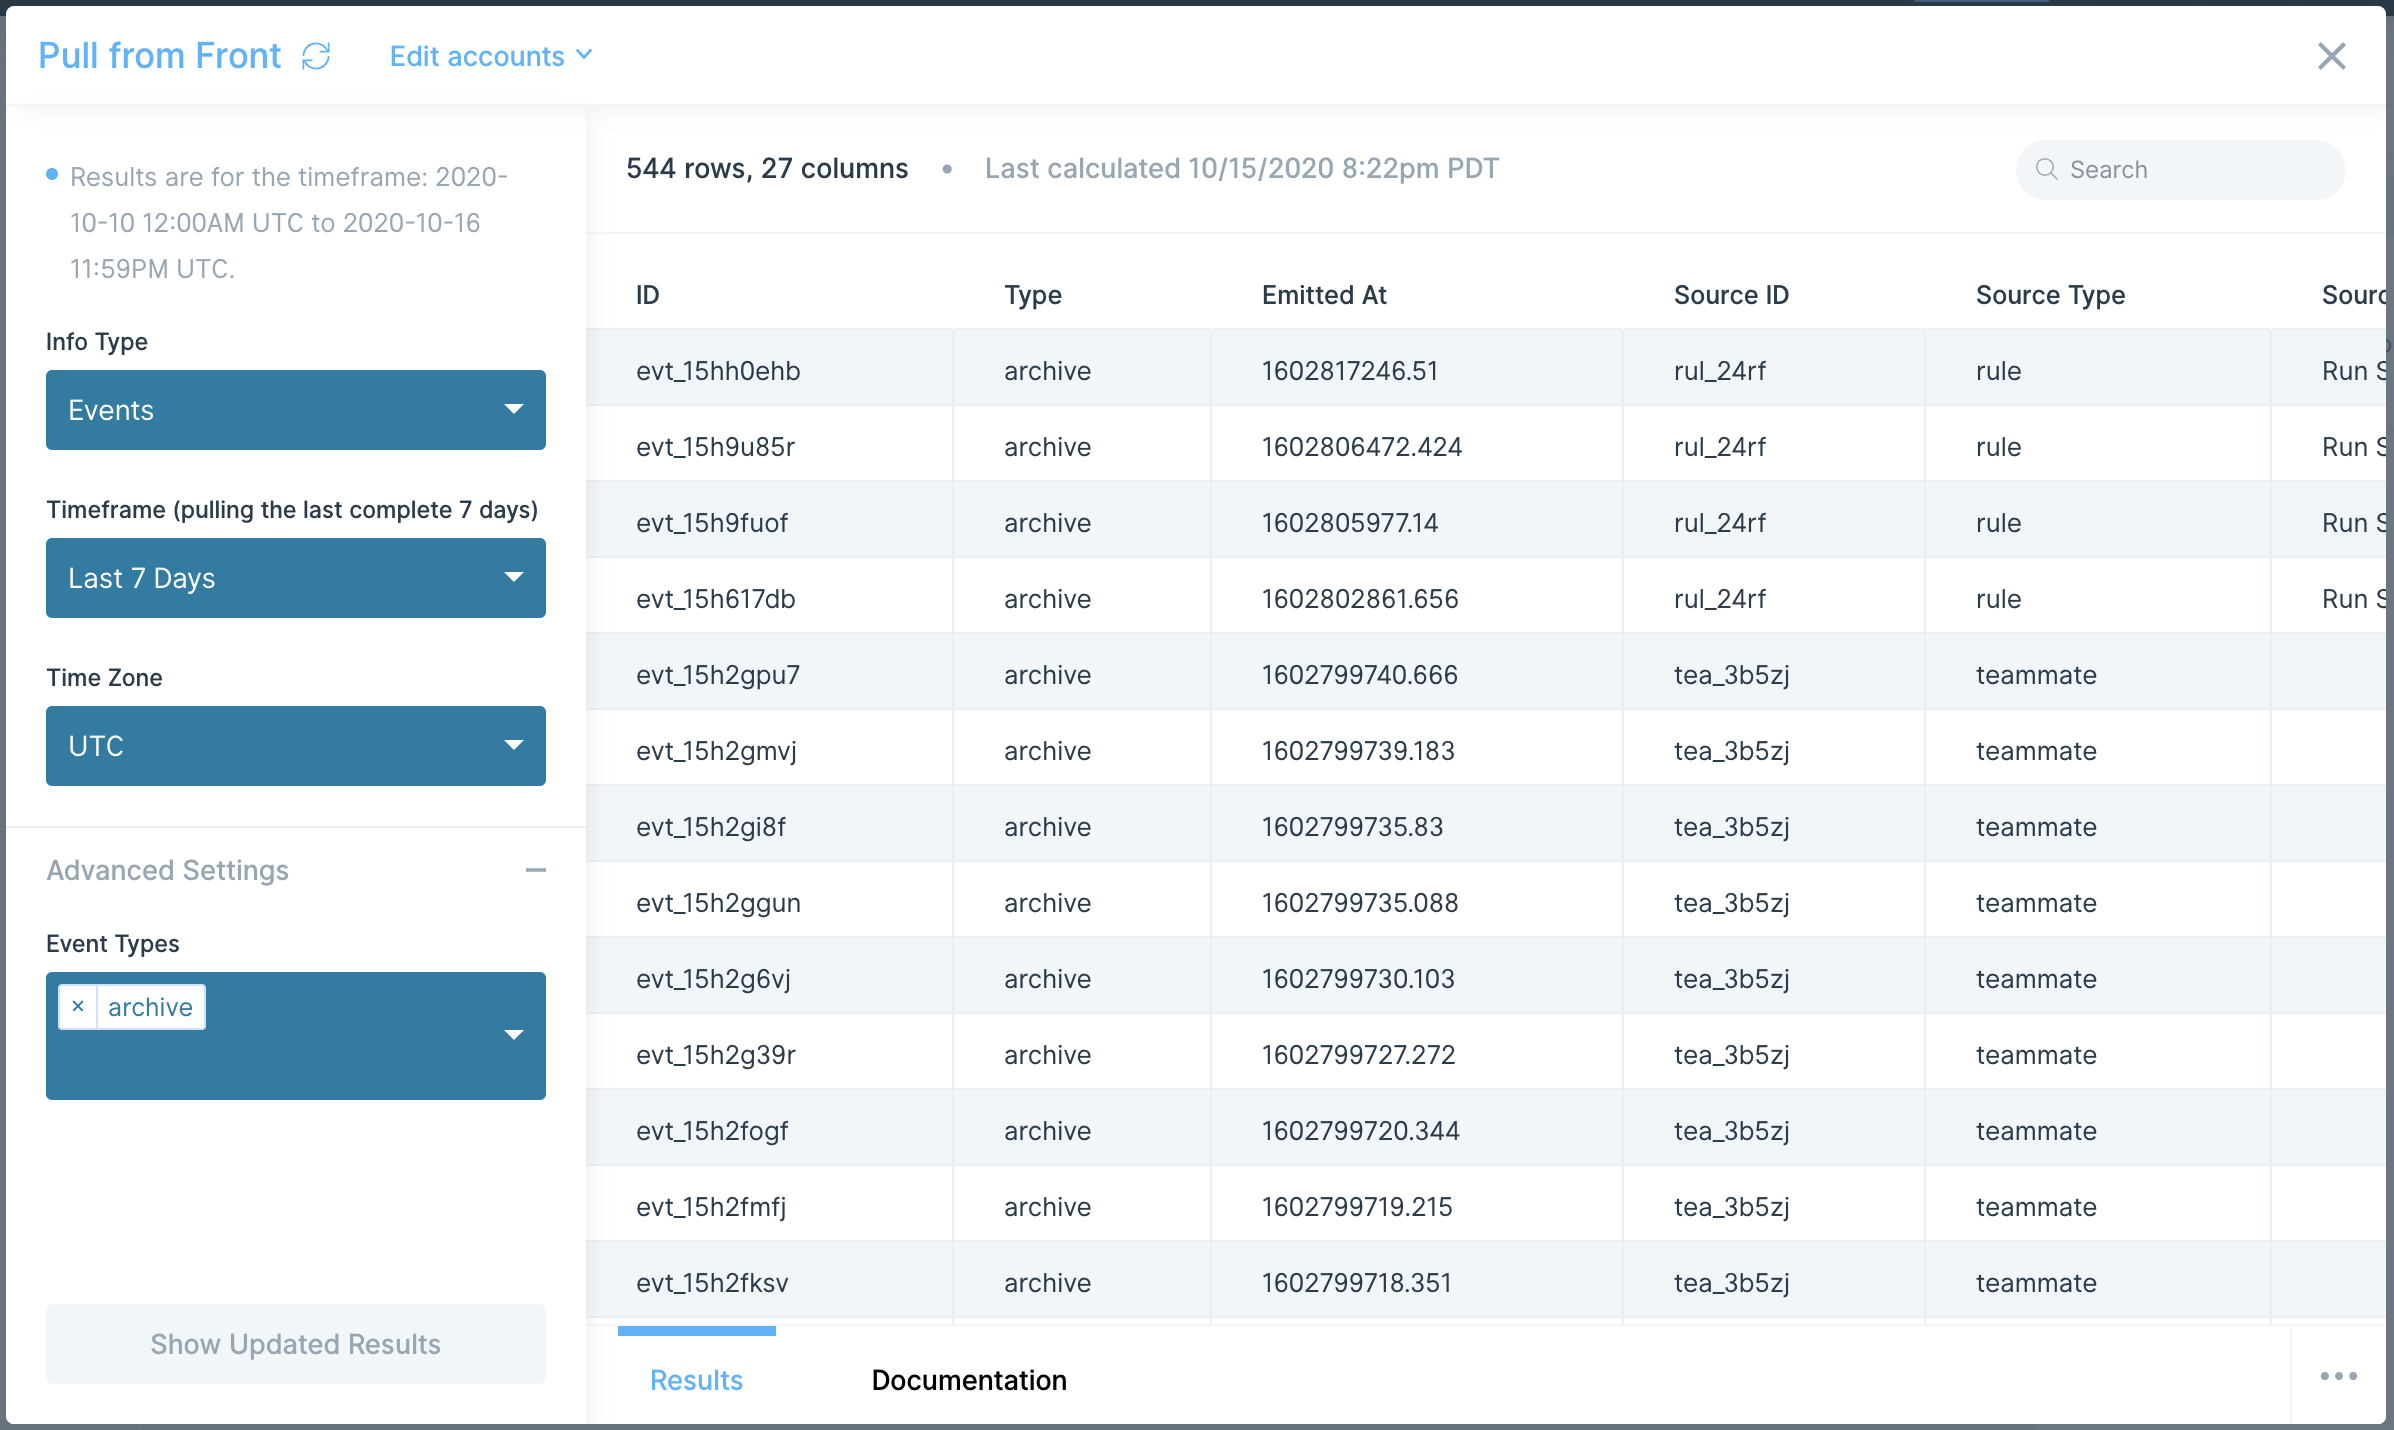
Here are the Info Types that are available:
- Events
- Teams
- Teammates
- Contacts
- Tags
Helpful tips
- Metrics on specific team members to entire team groups: In this step's settings Info Type > Teammates, select from an available team, and updated results will show one row of data per teammate with information like ID and email address. If you're looking to pull in metrics per teammate, then switch Metric Type > Table Metrics and explore ones like "team_table". There are also a few team-wide group metrics in Metric Type > Rollup Metrics like "avg_first_response_time".
- Time-based metrics show thousands of numbers in a column's row: these are in seconds. You can connect an Insert math column step to this Front import step to convert metric data from seconds into hours, days, or whichever time unit you'd like.
Integration:
FTP
Pull in files from an FTP, SFTP, or FTPS server. Target exact files, or find files based on rules within a folder. Supports csv, tsv, excel, xml, and json file parsing. Can parse edi files as csv.
Connecting to your FTP server
The first thing that you need to do is connect to your server in order to pull in any files.
When you first add an FTP step to a flow, you can open it and will see an Authorize button.
Click Authorize, and you will see this form:
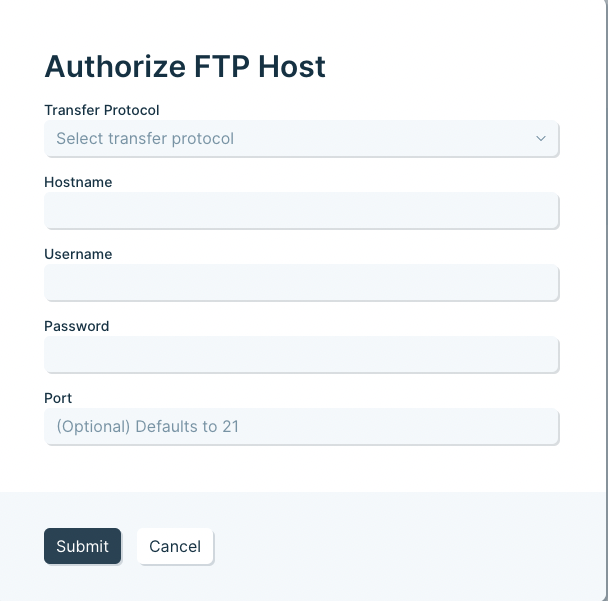
You will need to fill in each field in order to connect.
The Port can be manually set, or it will default to a port depending on which choice you have selected for the transfer protocol.
Using FTP (instead of SFTP or FTPS) is not recommended. Most FTP servers offer one of the other options.
If you are connecting via SFTP and are using a private key to connect, you will need to check the "Use public key authentication" box to see the option to upload that key and connect.
Editing your FTP connection settings or adding another connection
If you need to edit or add another connection, open your FTP step, click on "Select accounts", and then either click to add a new account, or edit the existing one.
After editing your connection settings, click the refresh button to have the step re-connect with the new settings.
Pulling in a specific file
The main option at the top of the step allows you to switch between pulling in a specific file and a file based on rules.
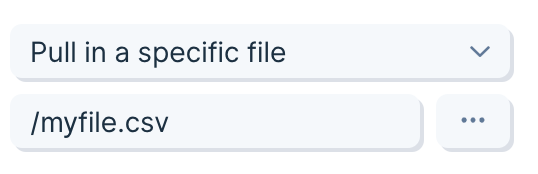
When pulling in a specific file, enter the path to that file. All paths should start with / and then progress through any folders until ending in the name of the file and its extension.
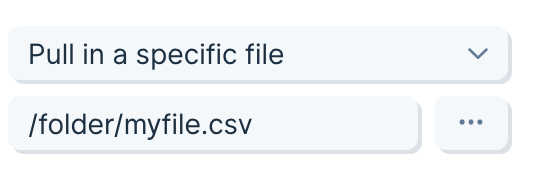
Click the 3-dot more menu to override how to parse a file. By default, this step will parse the file based on the extension of the file. But you can change that. For example, if you have a .txt file that is really a csv file inside, you can choose to parse that txt file as if it were a csv.
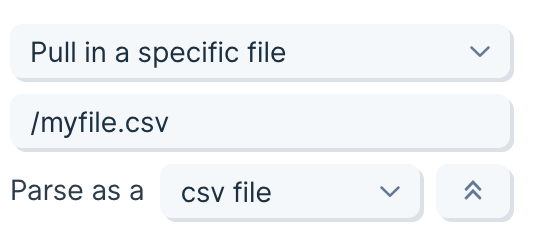
Pulling in a file based on rules
The main option at the top of the step allows you to switch between pulling in a specific file and a file based on rules.
When pulling a file based on rules, a new file will be pulled in every time the flow is run, or the step is refreshed.
A file can be selected based on:
- The last_modified date of the file
- The folder the file is in
- Matching part of the name of the file
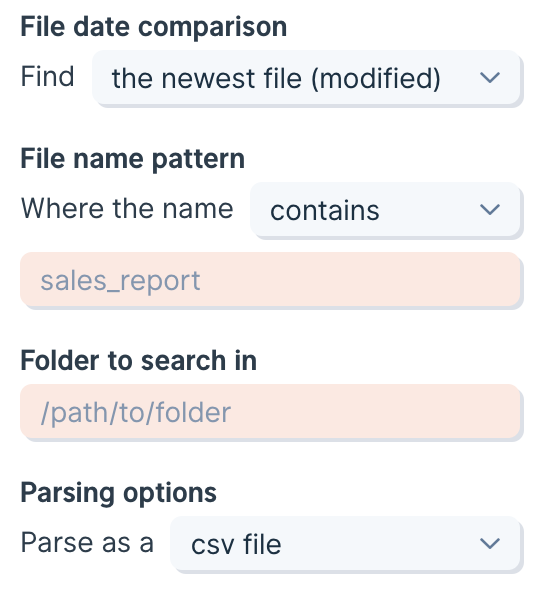
First, choose between pulling the newest file or the oldest file, based on its last modified date.
Second, choose a file name pattern. If you select is anything, no filtering based on file name will be applied. You can select to filter for files that start with, end with, or contain a certain set of characters. This can also be used to match the file extension (.csv for example).
Third, choose a folder to find the file within. If you use / then it will search the root folder. Other folders that are inside of the folder that you have indicated will not be searched and will be ignored.
Finally, select a parsing option if you want to override the default.
Every time a file is pulled in from a rule, the name will be displayed in the step settings.
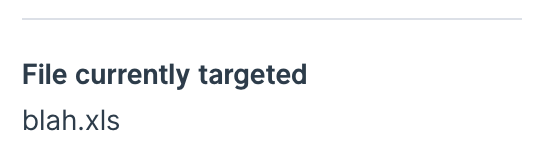
Moving files after processing (archiving)
Enable the Archive file once processed setting to automatically move files from the target folder to a different folder.
Files will be moved immediately after the data from the file is fetched by the Pull from FTP step. If the step fails for some reason with an error, the file will not be moved.
If the file is pulled in successfully, but another step causes the Flow to fail, then the file will still be archived, even if the overall Flow failed to complete.
In the run history of the Flow, the names of any files pulled in from FTP will be listed to show what file was moved during successful or failed runs.
Use of this setting is best combined with the “Pull in a file based on rules” setting. With this combination, a Pull from FTP step can continuously cycle through a specific FTP folder and process any files available within it.
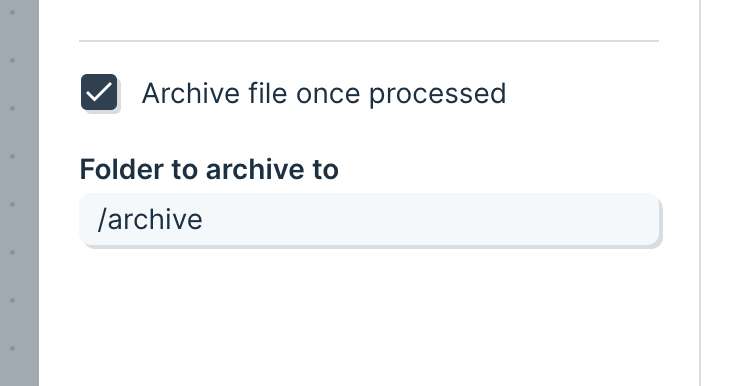
Parsing XML Files
Sometimes XML files will not successfully pull into this step. In that case, it may be due to how the step is parsing the file by default. Use the Top Level Key field to indicate which key to expand into the table. This can help if there is a list of data, but there are other keys surrounding it, and you just need to get to that interior list. You can indicate a deeper key by placing dots between each key level. For example, if you have an object called Cars, and inside it is a list called Colors, which you want to expand, you would put Cars.Colors in the Top Level Keys field.
File Metadata
To pull in file metadata like the date the file was last modified, it must be included as a value in a column.
Limits
This FTP step can be used to pull in files up to 600MB. Contact us if you need larger files to be pulled in.
Global limits my stop your file before its size does, however. Steps can only run for 1 hour, and can only pull in 5 million rows and 5000 columns.
Create or overwrite files in an FTP, SFTP, or FTPS server. Supports CSV, TSV, Excel, and JSON file creation and overwriting.
Connect to your FTP server
- Add the Send to FTP step to your flow
- Open the step and click the blue ‘Authorize’ button.
- Fill out the authorization form and save
- Transfer protocol
- Hostname
- Username
- Password
- Port
Notes
- You can set the Port manually, or leave it blank to use the default for your selected protocol.
- Prefer SFTP or FTPS for secure transfers—plain FTP isn’t recommended.
Edit or add a connection
Open the step, click ‘Select accounts,’ then either add a new account or edit an existing one. After you edit, click the refresh icon to re-connect with the new settings.
Choose your output mode
At the top of the step, choose one:
- Create a new file (recommended for dated or run-specific outputs)
- Overwrite an existing file (recommended for stable file names/paths)
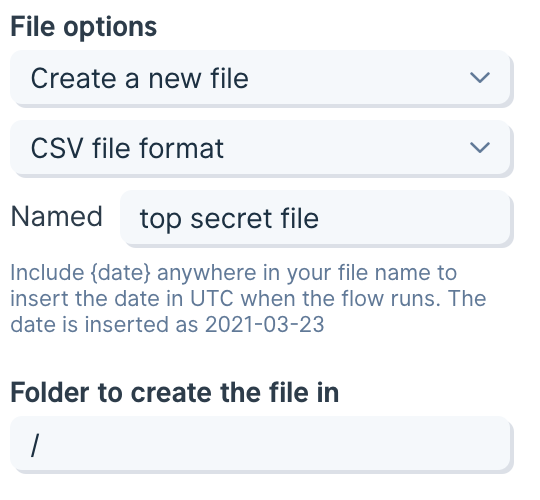
Create a new file
Configure three things:
- Format: CSV, TSV, Excel, or JSON
- File name: Do not include an extension—Parabola adds it automatically
- Folder path: The destination directory on your server
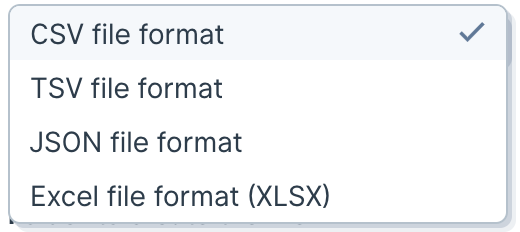
Supported formats
CSV
- Output extension:
.csv.
TSV
- Tab-separated values.
- Output extension:
.tsv.
Excel
- Output extension:
.xlsx. - No additional formatting is applied.
JSON
- Top-level JSON array; each row becomes an object.
- Output extension:
.json.
Name the file
Type the base file name without an extension. For example, enter customers (not customers.csv). If you include an extension, you’ll end up with a duplicate (e.g., customers.csv.csv).
Use merge tags to make the name unique:
Date/time merge tags (UTC)
{date}→YYYY-MM-DD{dateNoDash}→YYYYMMDD{dateTime}→YYYY-MM-DD HH:MM:SS{timestampDash}→YYYY-MM-DD_HH-MM-SS
Column merge tags (create mode only)
Reference values from your data to build the file name:
- Wrap the column name in curly braces like,
{CustomerId} - Examples:
invoices_{CustomerId}_{date}→invoices_12345_2025-09-30export_{Region}_{timestampDash}→export_APAC_2025-09-30_14-03-22
Advanced Settings
- Enable checkbox to omit header rows in exports (default is off)
- Enable checkout to remove merge columns from output (default is off)
Tips
- Most servers reject duplicate names in the same folder. Use date/time or column merge tags to avoid collisions.
- Avoid special characters your server may not allow in file names.
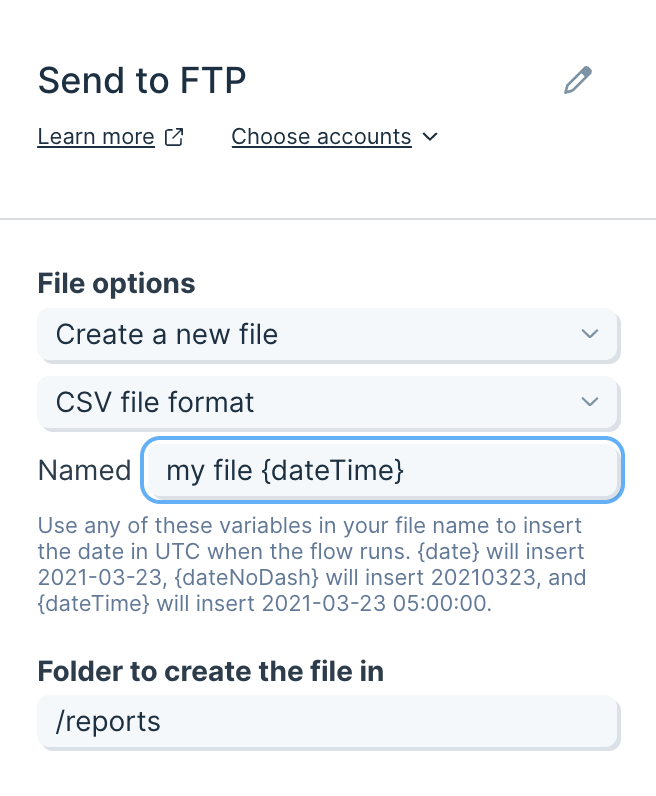
Choose a folder to put the file
Specify the destination folder path:
- Paths start at the root:
/ - Example for a root-level folder named
reports:/reports - Example nested path:
/exports/daily
Overwrite an existing file
Set File options dropdown to "Overwrite an existing file". Select the output format and enter the full path (including the file name and extension) in the "File o overwrite" field.
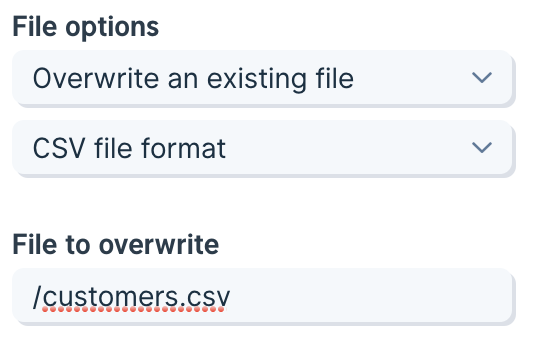
Select a format
Choose the format that matches the file’s intended use. While Parabola replaces the file contents entirely (so mismatched extensions can still “work”), keeping the extension aligned with the actual format prevents downstream confusion.
Choose the file path
Provide an absolute path from the root /:
- Root example:
/customers.csv - Nested example:
/crm/customers.csv
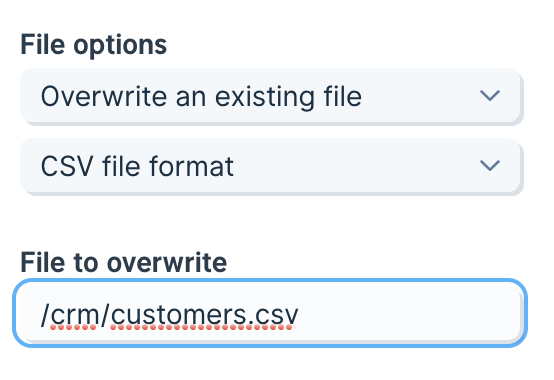
Advanced Settings
- Enable checkbox to omit header rows in exports (default is off)
Integration:
Fulfil
Use the Pull from Fulfil integration to bring key Fulfil data into Parabola — allowing you to transform your Fulfil data for more granular visibility, blend Fulfil data with information from other systems, and trigger alerts based on custom logic.
How to authenticate
Fulfil uses API Key authentication for secure access.
- Go to your Fulfil site and generate an API key. See below for in-depth instructions.
- In Parabola, add the Fulfil integration step.
- Click Authenticate and add your API key.
- Note: you will also need to update the tenant field to be your organization’s name. This can be found in the URL when accessing the Fulfil website (e.g., for https://acme.fulfil.io, use acme).
Once connected, you can select from Fulfil’s available endpoints to bring live data into your flow.
Creating a Fulfil API Key
1. Navigate to the main page of your ERP by swapping your {tenant} in the URL: https://{tenant}.fulfil.app/client/#/
2. Click on your username on the top right and then preferences
3. Select Manage personal access tokens.
.png)
4. In the upper right-hand corner select click the Generate Personal access token button.
.png)
5. Enter a helpful token description and click the Generate button.
.png)
6. Copy the API Key and store it somewhere safe.
Available data
Using the Fulfil integration, you can pull in a wide range of operational data, including:
- Sales Orders and Lines: Order headers and line details, including customers, products, quantities, prices, and fulfillment states.
- Products: Product master data, SKUs, pricing, and inventory attributes.
- Customers and Suppliers (Parties): Contact details, account information, and classifications for customers and vendors.
- Invoices: Sales and purchase invoices, including totals, taxes, and payment status.
- Shipments (Outbound and Internal): Shipment records with itemized contents, destinations, and fulfillment status.
- Stock Moves: Detailed inventory movement logs across warehouses and transactions.
- Purchase Orders and Lines: Order headers and line-level details, including suppliers, costs, and received quantities.
- Production BOMs: Bill of materials for manufactured products.
- EDI Documents: Transactional documents exchanged with trading partners.
- Automation Rules: Rules that drive workflow automation within Fulfil.
Common use cases
- Consolidate sales data across channels with data from Shopify, Amazon, or other platforms.
- Reconcile shipments and invoices to confirm fulfillment accuracy.
- Track purchasing and supplier performance by comparing purchase orders against receipts and lead times.
- Monitor inventory levels and turn valuation reports into dashboards for real-time visibility.
- Automate accounting workflows with invoice and payment data to reduce manual entry.
Tips for using Parabola with Fulfil
- Schedule your flow to run daily or hourly to keep reports, dashboards, and reconciliations up to date.
- Filter by state or date to limit imports and sync only recent or relevant data.
- Join related data like Orders, Lines, and Products to create unified operational views.
- Add validation steps to flag data mismatches (e.g., invoices without shipments).
- Document your logic with step notes so your team can easily maintain and audit your flows.
By connecting Fulfil with Parabola, you turn your ERP data into actionable automation, powering real-time visibility, faster reconciliations, and smarter operations across your business.
Integration:
Geckoboard
Use the Send to Geckoboard step to send your data to Geckoboard's data visualization tool and automatically update the underlying data of your dashboards.
Connect your Geckboard account
To connect your Geckoboard account, click Authorize.

Follow the link to lookup the Geckoboard API Key, copy from your Geckoboard account settings, and paste into Parabola. Click Authorize to complete the connection.

Custom settings
First, choose a Dataset Name. This name will auto-format to remove capital letters and spaces, as required by Geckoboard.

Using the dropdowns, map your data's columns to the appropriate field data types available in Geckoboard. If you want to make a line chart with this dataset, you must have a "Date" column.


Helpful tips
- If you are using this data to add a new widget in Geckoboard, select "Datasets" and then choose the corresponding dataset when you are prompted to choose a source in Geckoboard.
- You can only send a maximum of 5,000 rows to Geckoboard at a time. If you find yourself exceeding this limit, we suggest using the Remove rows step or grouping your data to reduce the number of data points.
- If you are sending date data, it must be in YYYY-MM-DD format, which you can easily achieve using the Format dates step.
- If you do not plan on sending every column of data to Geckoboard sure to use the Remove columns step prior to the Send to Geckoboard step to reduce the columns down to just the data you wish to send.
Integration:
Google Analytics
This step will only work with Google Analytics V4. If you have not yet migrated over to GA V4 and are using Google’s Universal Analytics, you will need to use the Pull from Google Analytics UA step to pull in your Google Analytics data. Google is deprecating Universal Analytics on July 1, 2023. Once you have moved your data over to Google Analytics 4, you will need to update your Flows to use this Parabola step to continue accessing your Google Analytics data. Read more about how Google is updating this here.
Use the Pull from Google Analytics 4 step to bring all of your Google Analytics data into Parabola in a familiar format. Choose a date range and which metrics and dimensions to pull in to create a report just like you are used to doing in Google Analytics.
Connect your Google Analytics account
Begin by authenticating your Google Analytics account by clicking Authorize.
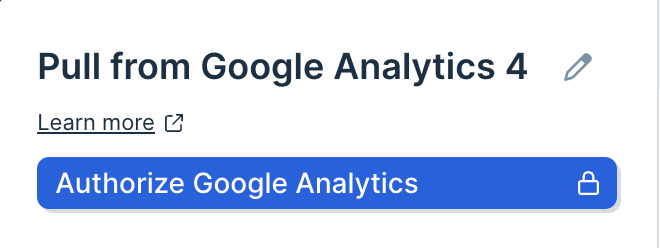
Choosing your settings
First, select the Account and Property that you would like to pull data from.
Then, select which metrics to pull in. These are same metrics that are available in Google analytics. Every metric that you add will result in a column being added to your report. You can select as many metrics as necessary for your report, including New Users, Bounces, Sessions, and many more.
Use dimensions to group your metrics and break them into more rows. Each dimension adds a column to the front of your table, and often will change any how many rows your report contains. Leaving the dimensions field blank will result in a single row of data.
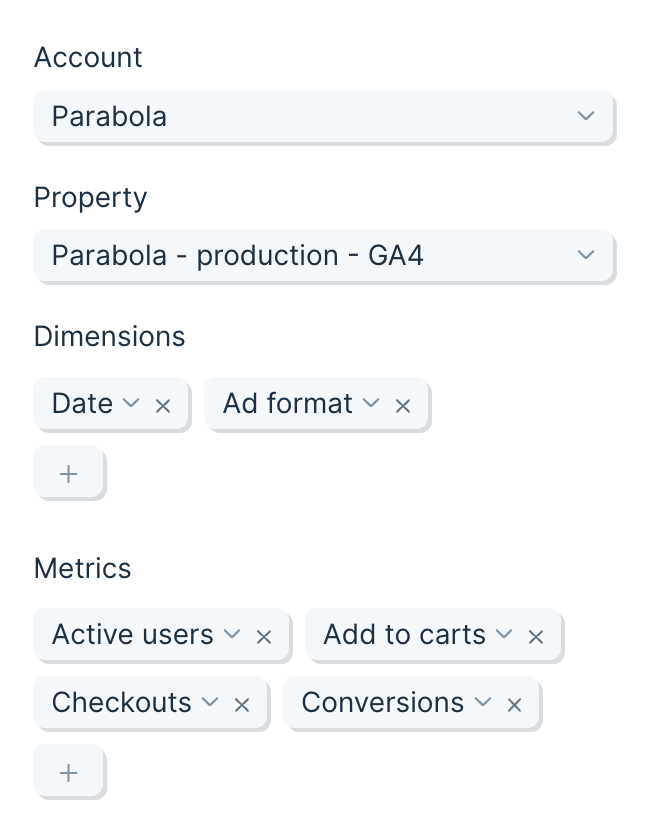
The time frame can be updated to let you pull data from:
- In the last 7 days
- The previous day
- In the month to date
- The previous X days/weeks/months/etc.
- The current X day/week/month/year to date.
- After a set date
- Between two dates
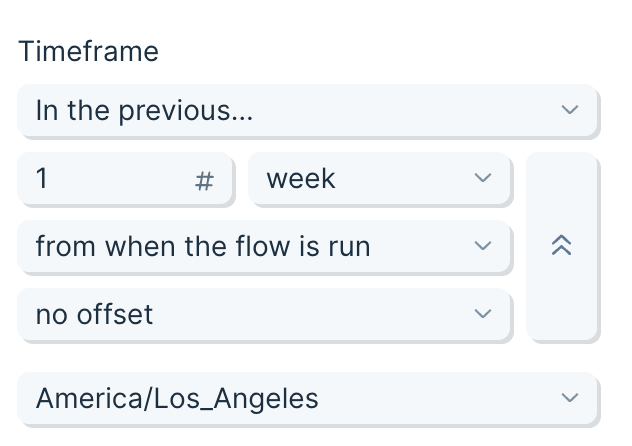
You can also adjust for when you'd like the timeframe calculation to run, giving you the ability to pick between when the Flow is run or the most recently completed month/week/day/hour. The latter option is great for running a report for the last month, on the 1st of the following month, while excluding any data collected for far that day.
Lastly, if you choose, you can add offset for your date timeframe.
If you are looking to compare this data set to the same set, but from the previous period, a great way to do that is to pull in the two data sets, and the use the Combine tables step to combine them, using their dimensions in the matching rules.
Helpful tips
- This step is available starting at our Plus plan.
- The Pull from Google Analytics 4 step will only show you options for metrics and dimensions that are compatible (as defined by Google) with your current selection. You can explore valid combinations using this tool.
Migrating to the Google Analytics 4 step
Google is deprecating Universal Analytics on July 1, 2023. To continue accessing your Google Analytics data, you will need to update to Google Analytics 4 as outlined by Google here. Once you’ve migrated over to GA4, you will need to use this new Pull from Google Analytics 4 step to pull in your data.
In any existing Flow that has a Pull from Google Analytics step, you will need to replace it with a new Pull from Google Analytics 4 step.
Setting your replacement steps up should be as easy as replicating the metrics and dimensions that you were pulling.
Keep in mind that combinations of metrics and dimensions that may have been valid in Google Analytics UA (the prior version) may no longer be valid in Google Analytics 4. Our new Pull from Google Analytics 4 step will only show you options for metrics and dimensions that are compatible (as defined by Google) with your current selection.
Google is deprecating Universal Analytics on July 1, 2023. To continue accessing your Google Analytics data, you will need to update to Google Analytics V4 as outlined by Google here. Once you’ve migrated over to GA4, you will need to use our new "Pull from Google Analytics 4" step to pull in your data.
New data will continue to be pulled in by your existing Pull from Google Analytics steps until July 1, 2023. After that date, existing data will continue to be accessible in Parabola for at least 6 months, until Google no longer allows access to that historic data.
- New data will continue to be pulled in by your existing Pull from Google Analytics steps until July 1, 2023.
- After that date, existing data will continue to be accessible in Parabola for at least 6 months, until Google no longer allows access to that historic data.
If you have any questions, please reach out to help@parabola.io.
Connect your Google Analytics account
Begin by authenticating your Google Analytics account by clicking Authorize.

Default settings
Make sure that you're pulling data from the correct property and site.

You can adjust which property or site's data is being pulled into Parabola by selecting from the dropdown.
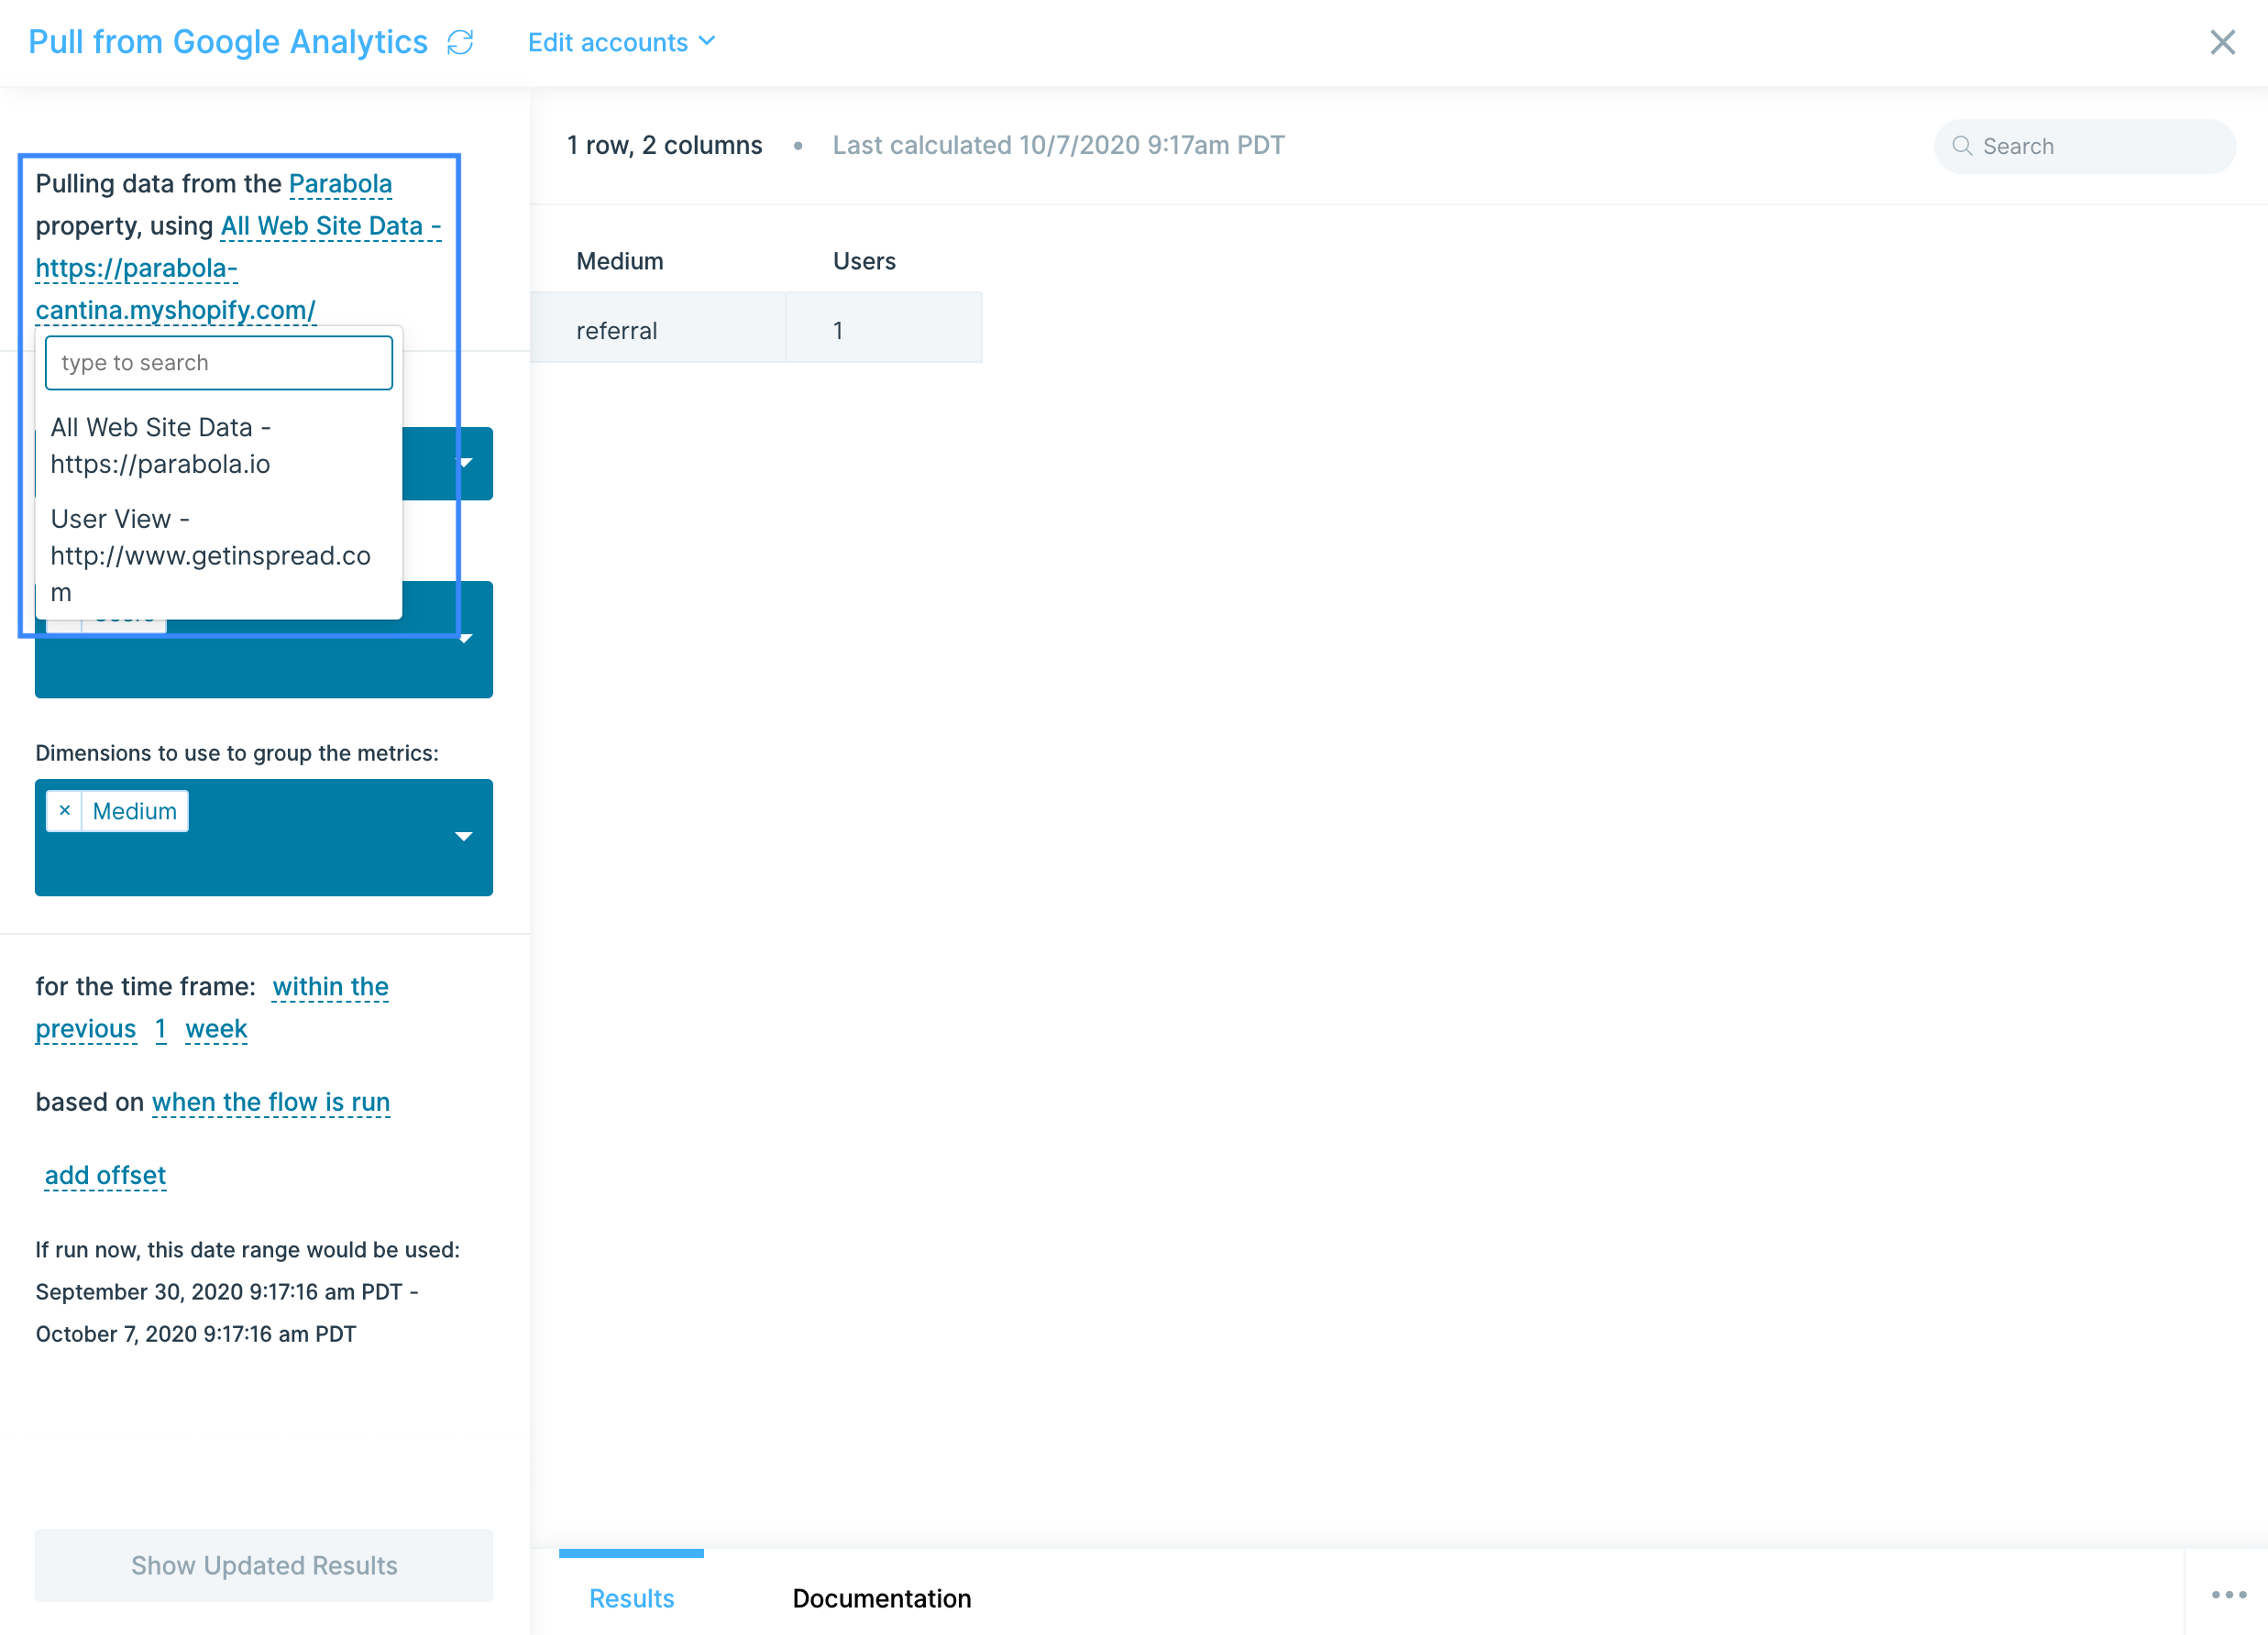
By default, the Pull from Google Analytics step will bring in Users by Medium.

The timeframe is also set to within the previous 1 week based upon when the flow is run, without an offset of dates.
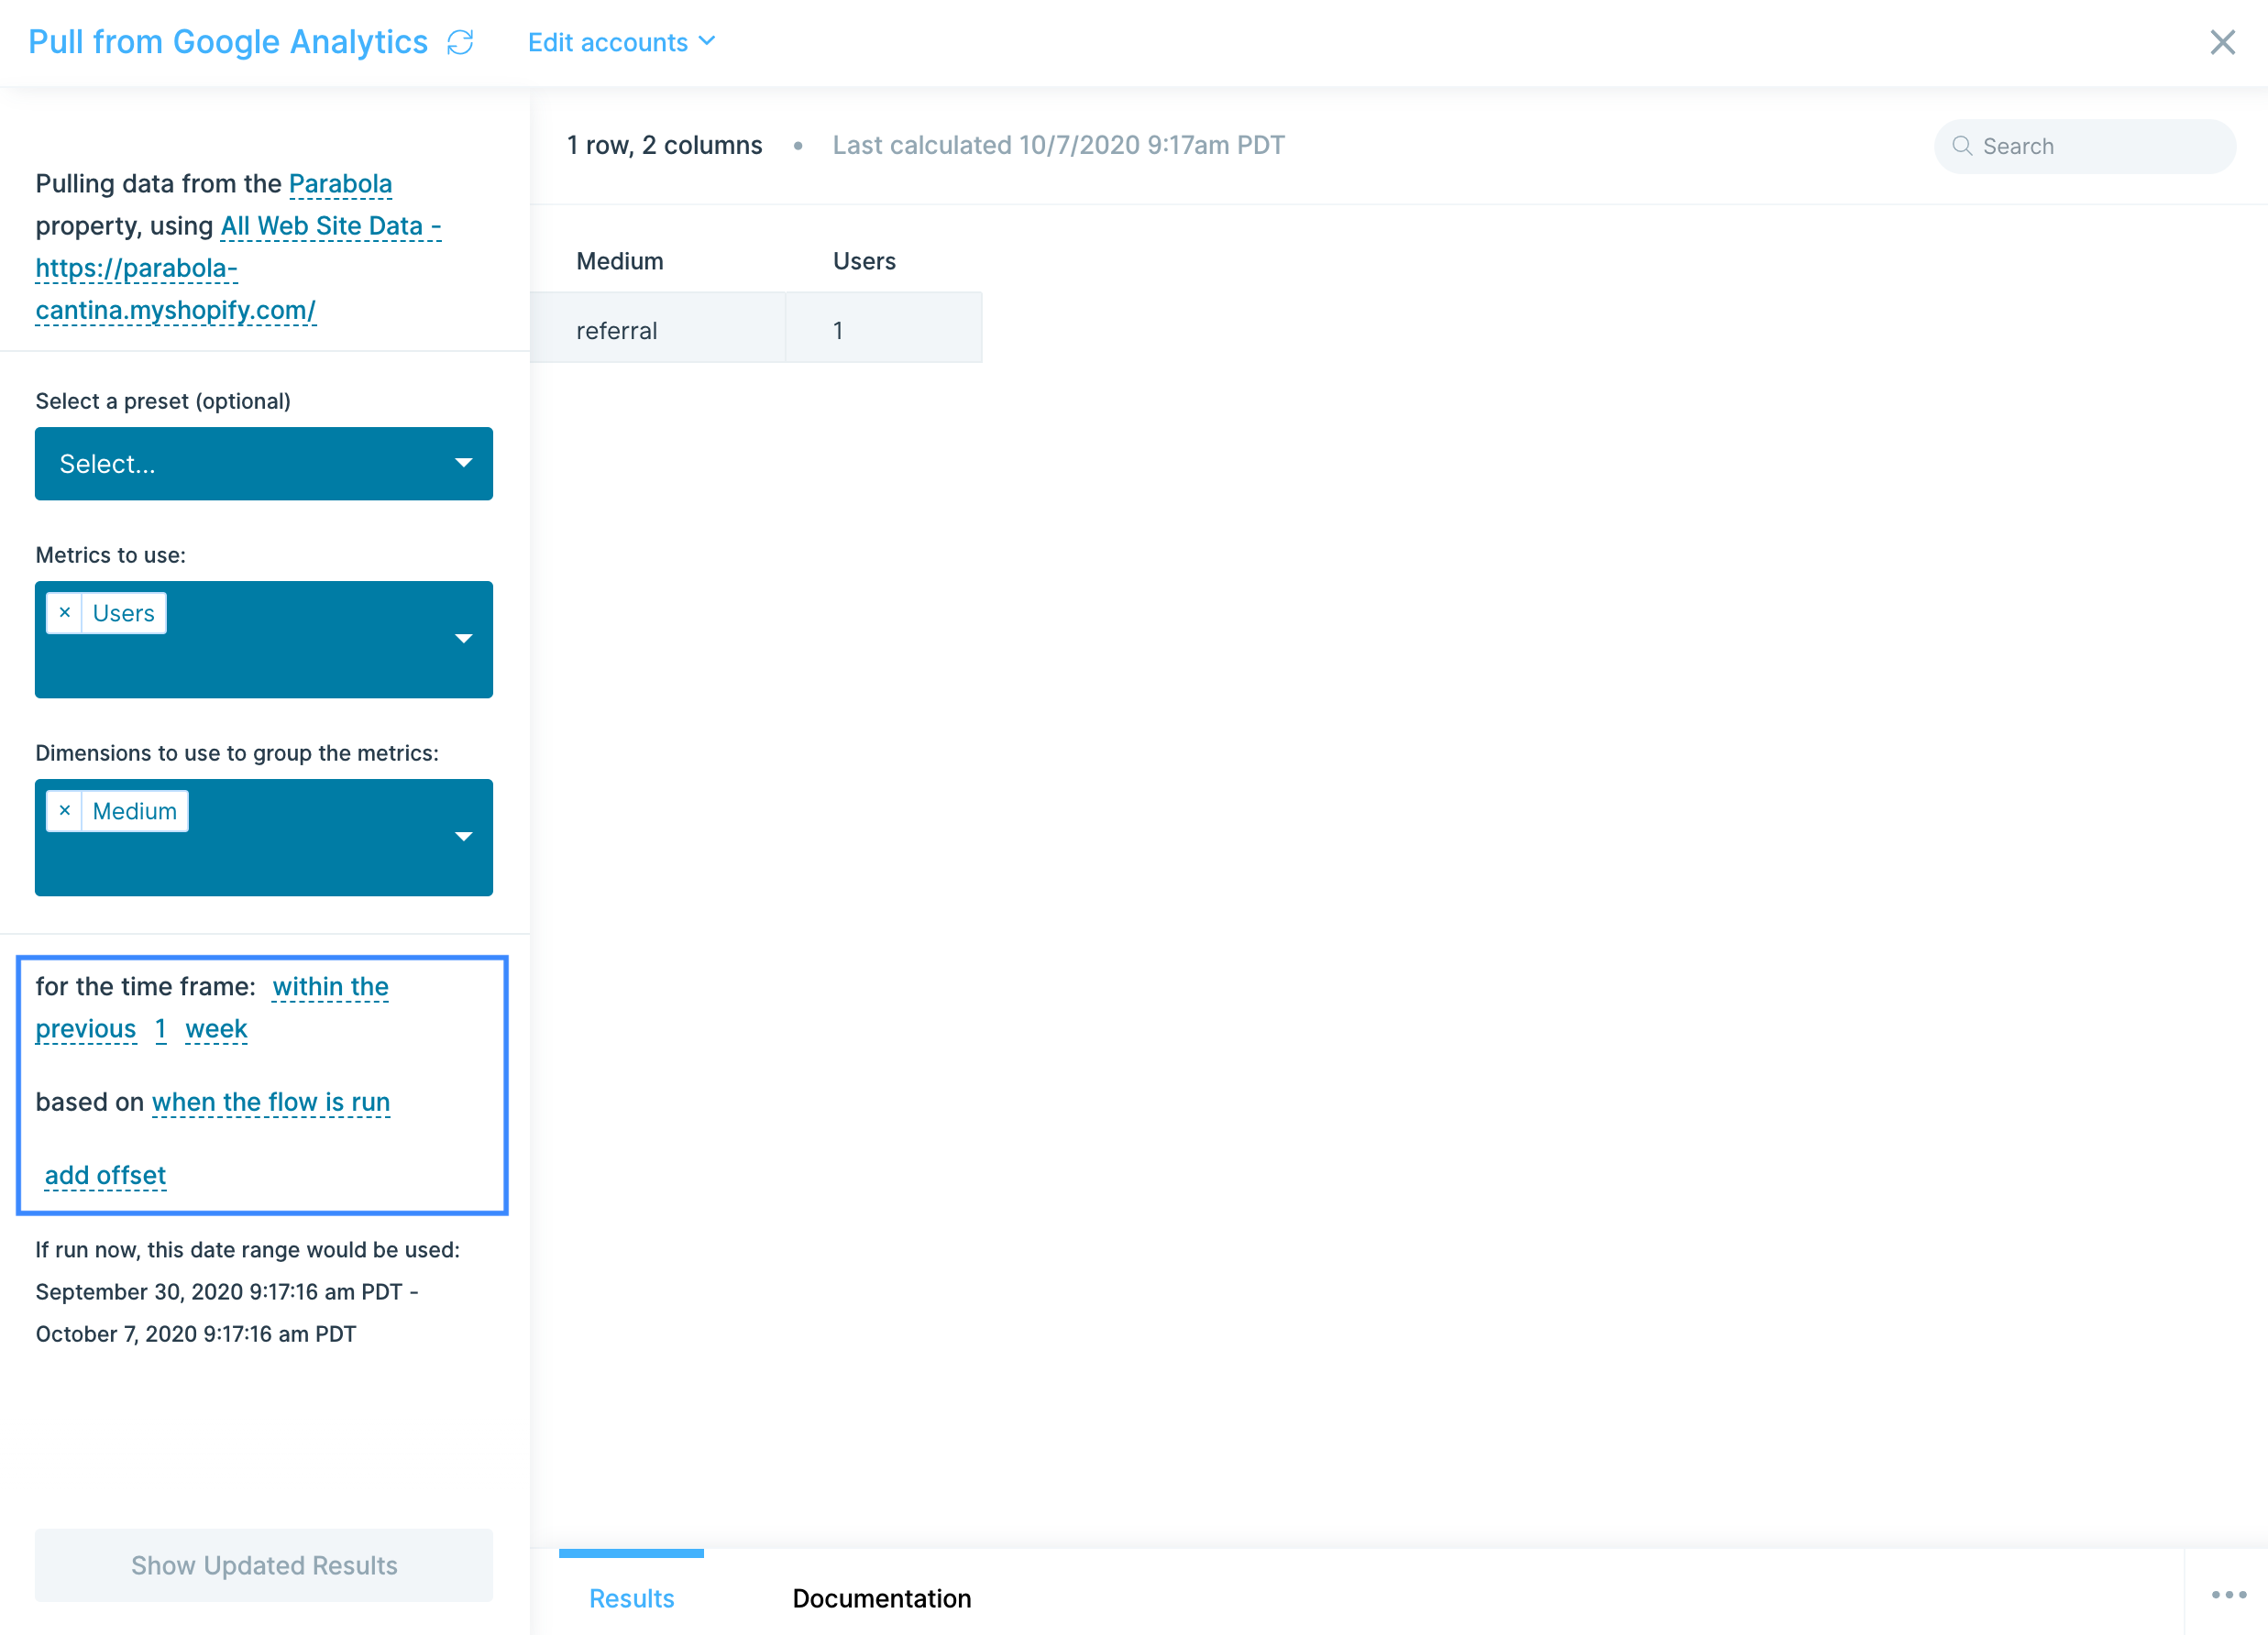
Presets
We offer a variety of preset reports that are the same as those in the Google Analytics sidebar. Selecting a preset report will update the columns in your Metrics to use and Dimensions to use to group the metrics selection fields.
Use these as-is, or as a base for building your own customized reports.
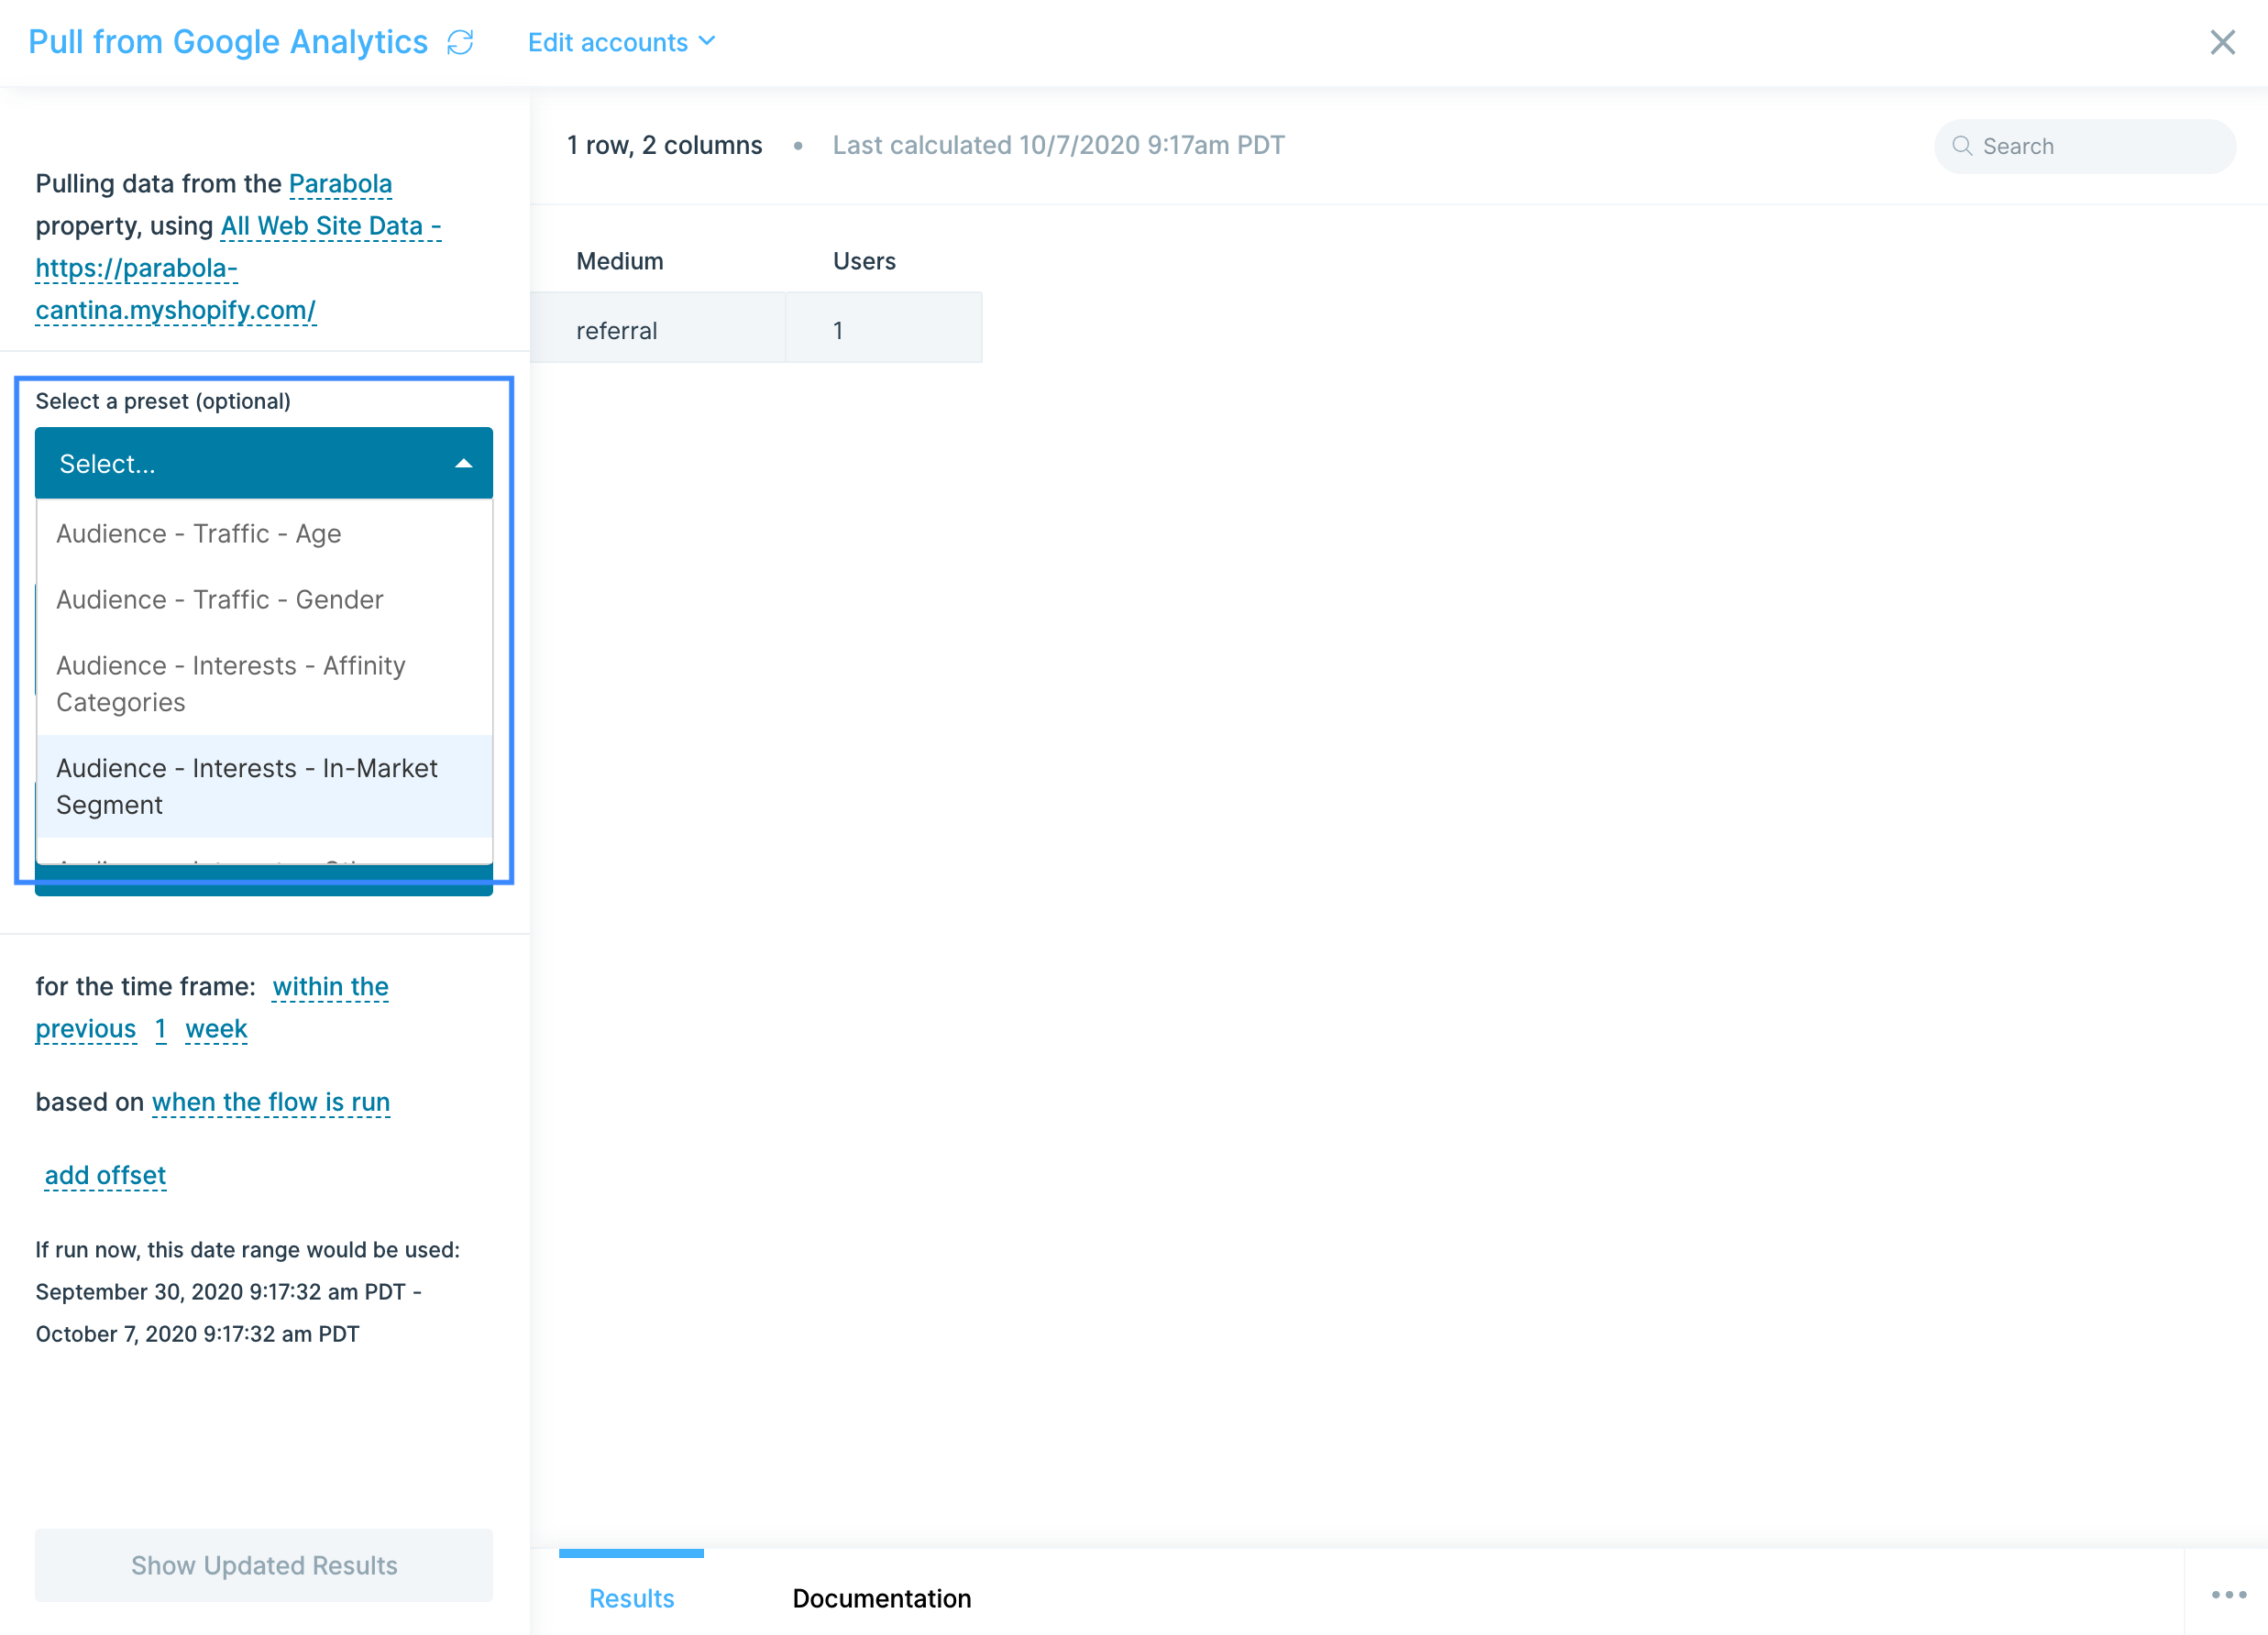
Custom settings
You will find the Metrics to use field shows the same metrics you'd see in Google Analytics. Every metric that you add will result in a column being added to your report. You can select as many metrics as necessary for your report, including New Users, Bounces, Sessions, and more.
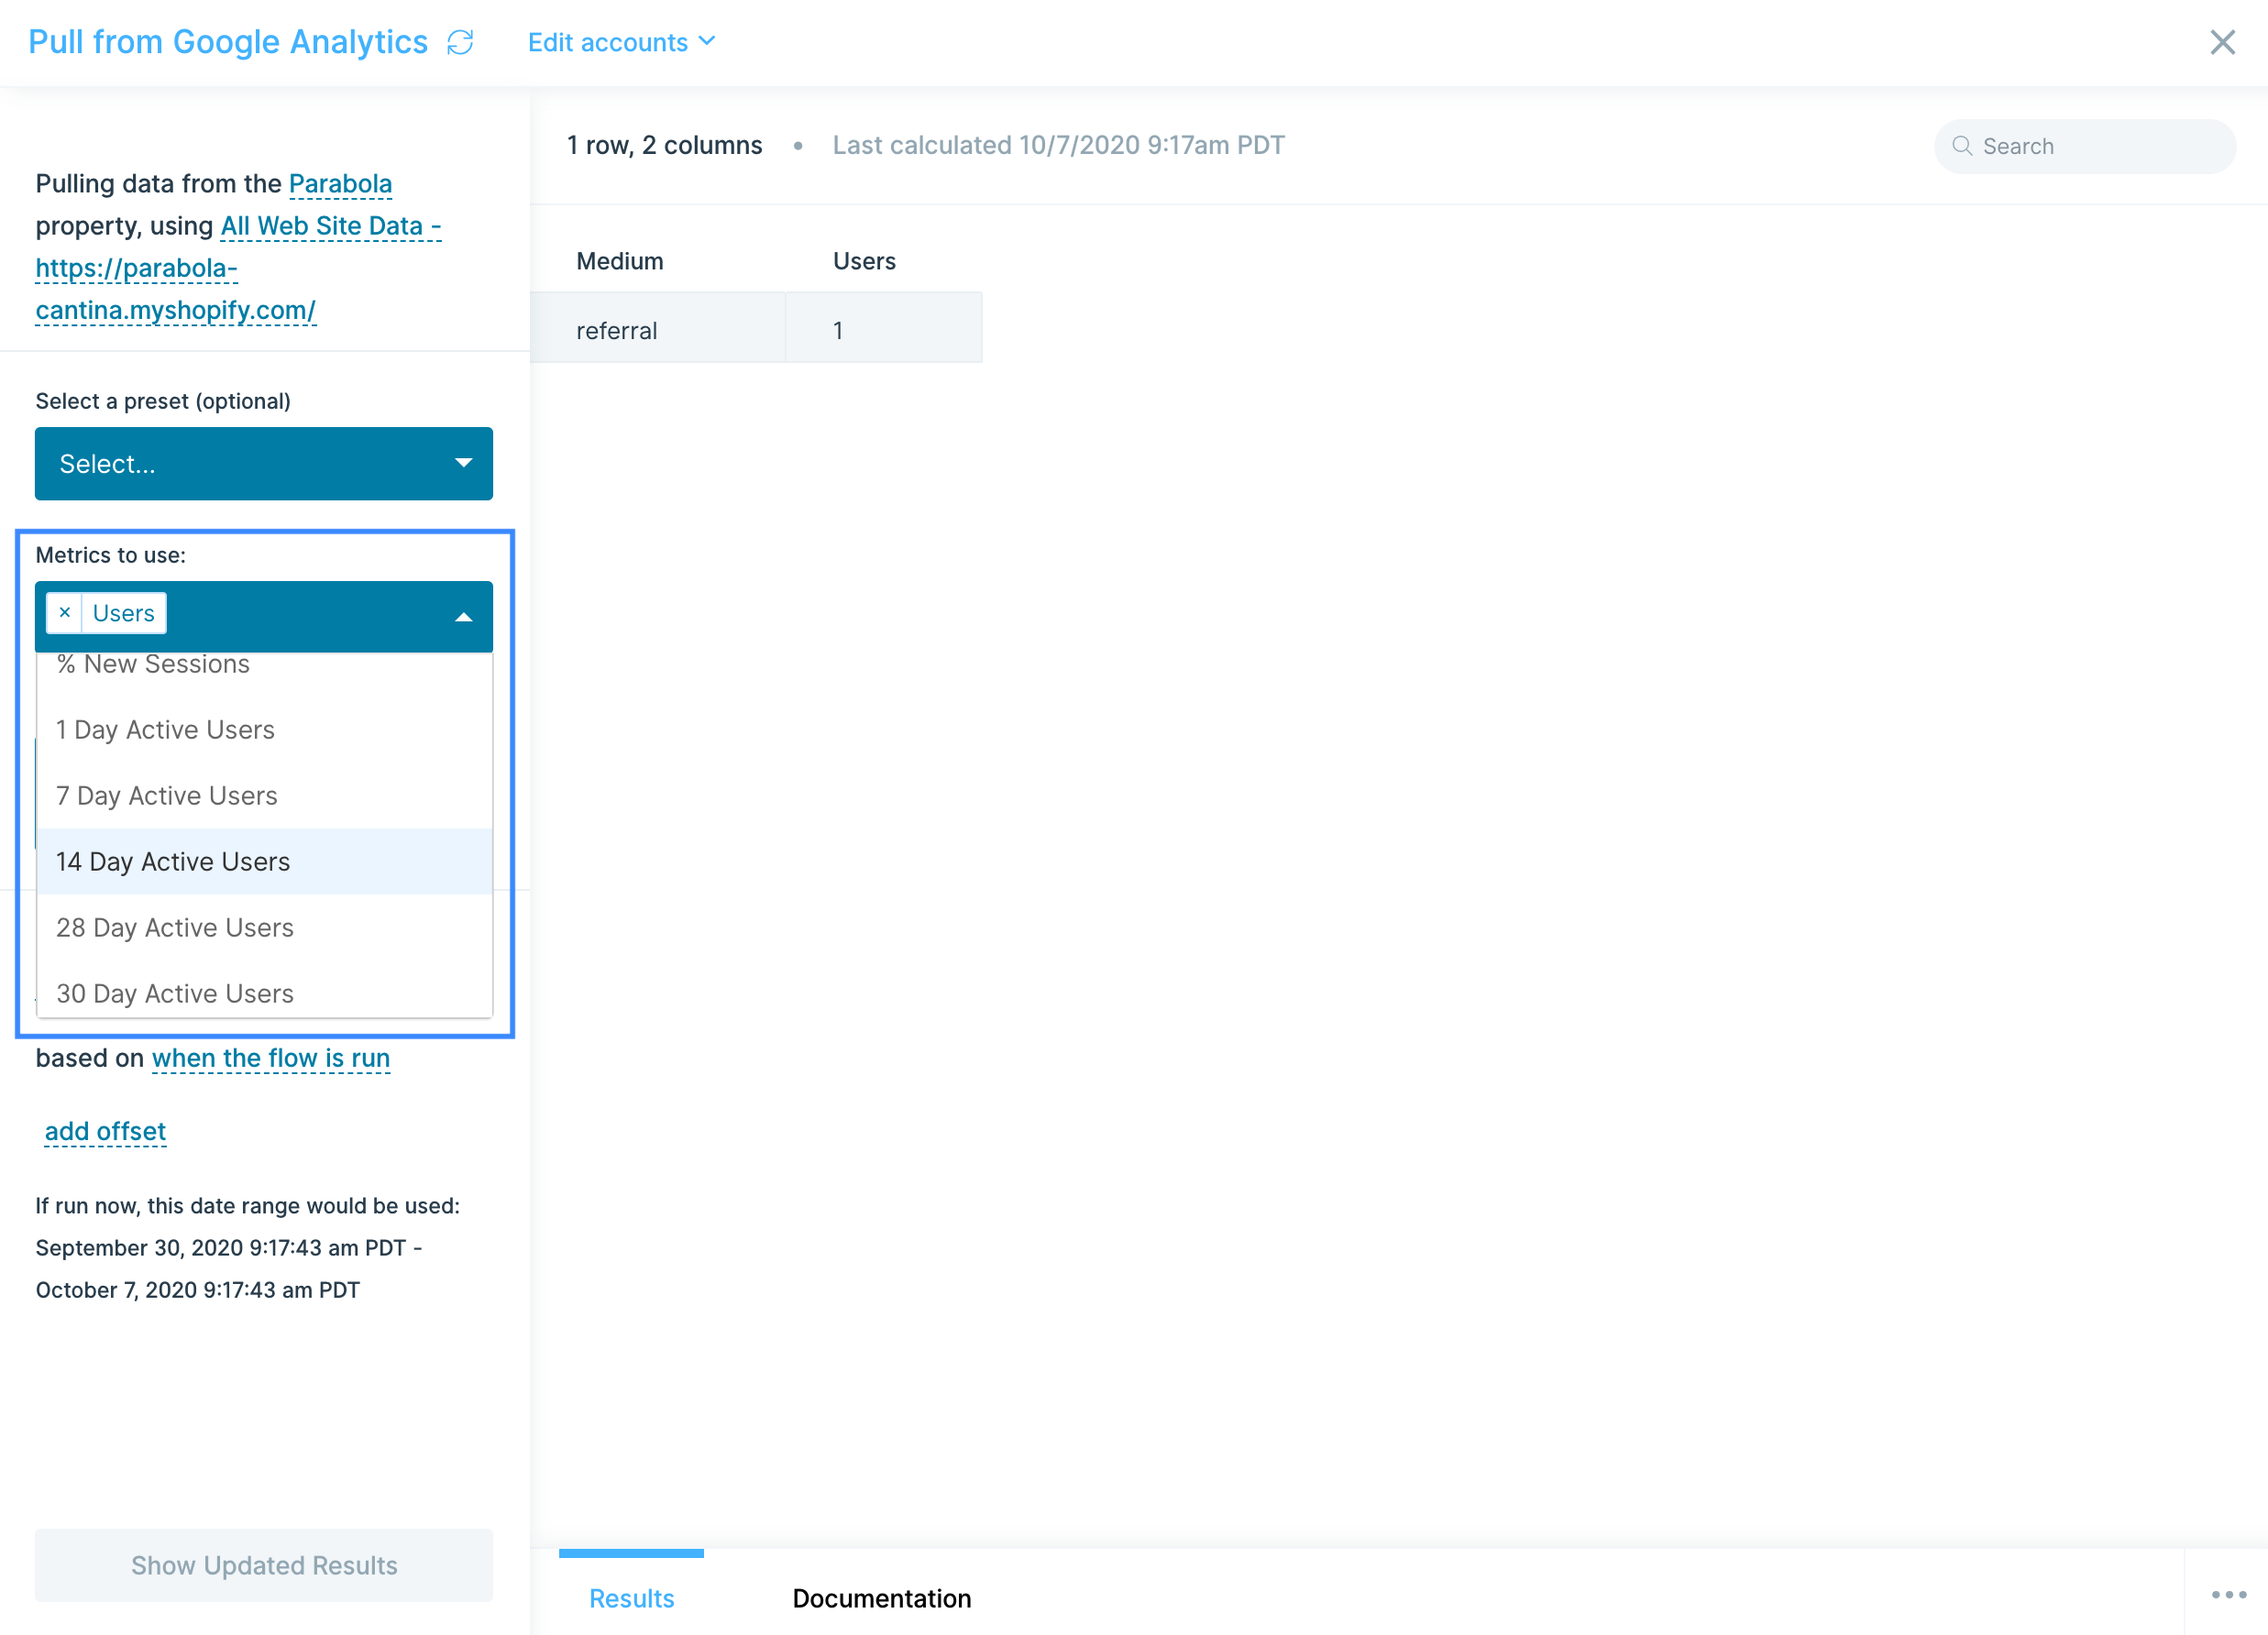
You can use various Dimensions to use to group the metrics, including Medium, Source, Campaign, Social Media, and more. Each dimension also adds a column, usually to the front, and it also will change how many rows you see in your data. Leaving this field blank will result in a single row of data, which is not grouped by anything.
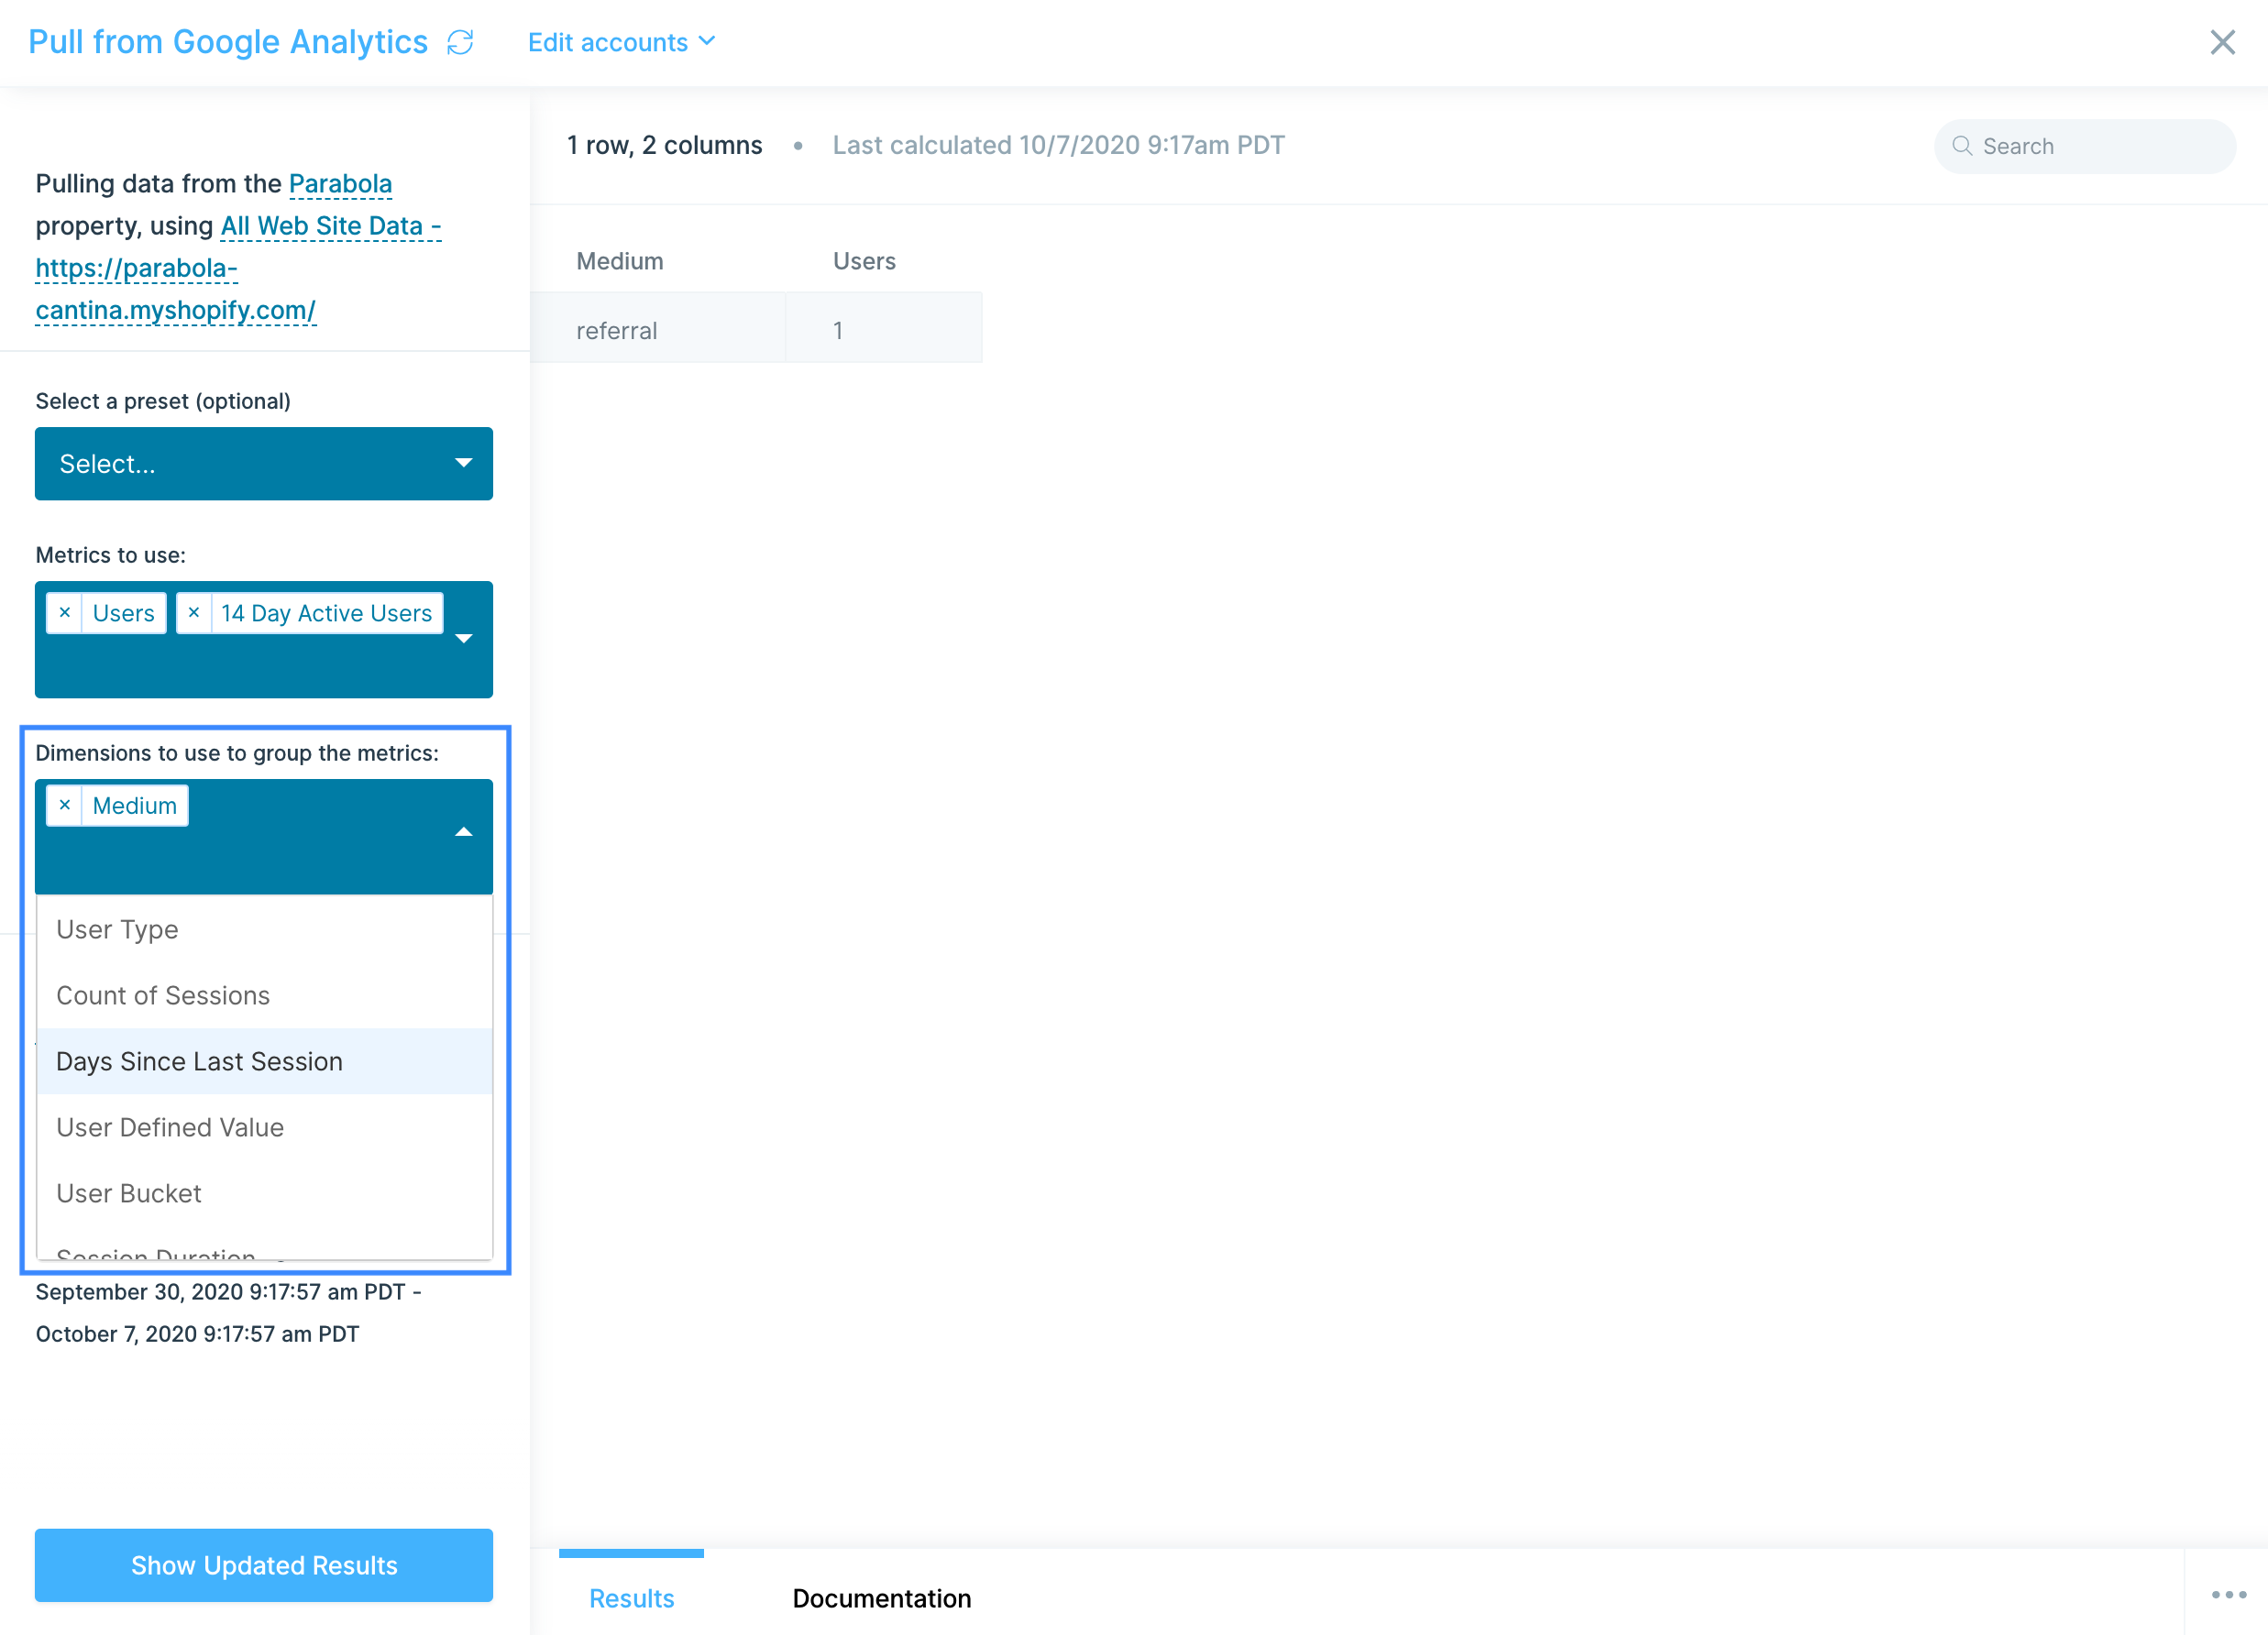
The time frame can be updated to let you pull data from:
1. Between two dates
2. Between a date and today
3. The previous X days/weeks/months/etc.
4. The current X day/week/month/year to date.
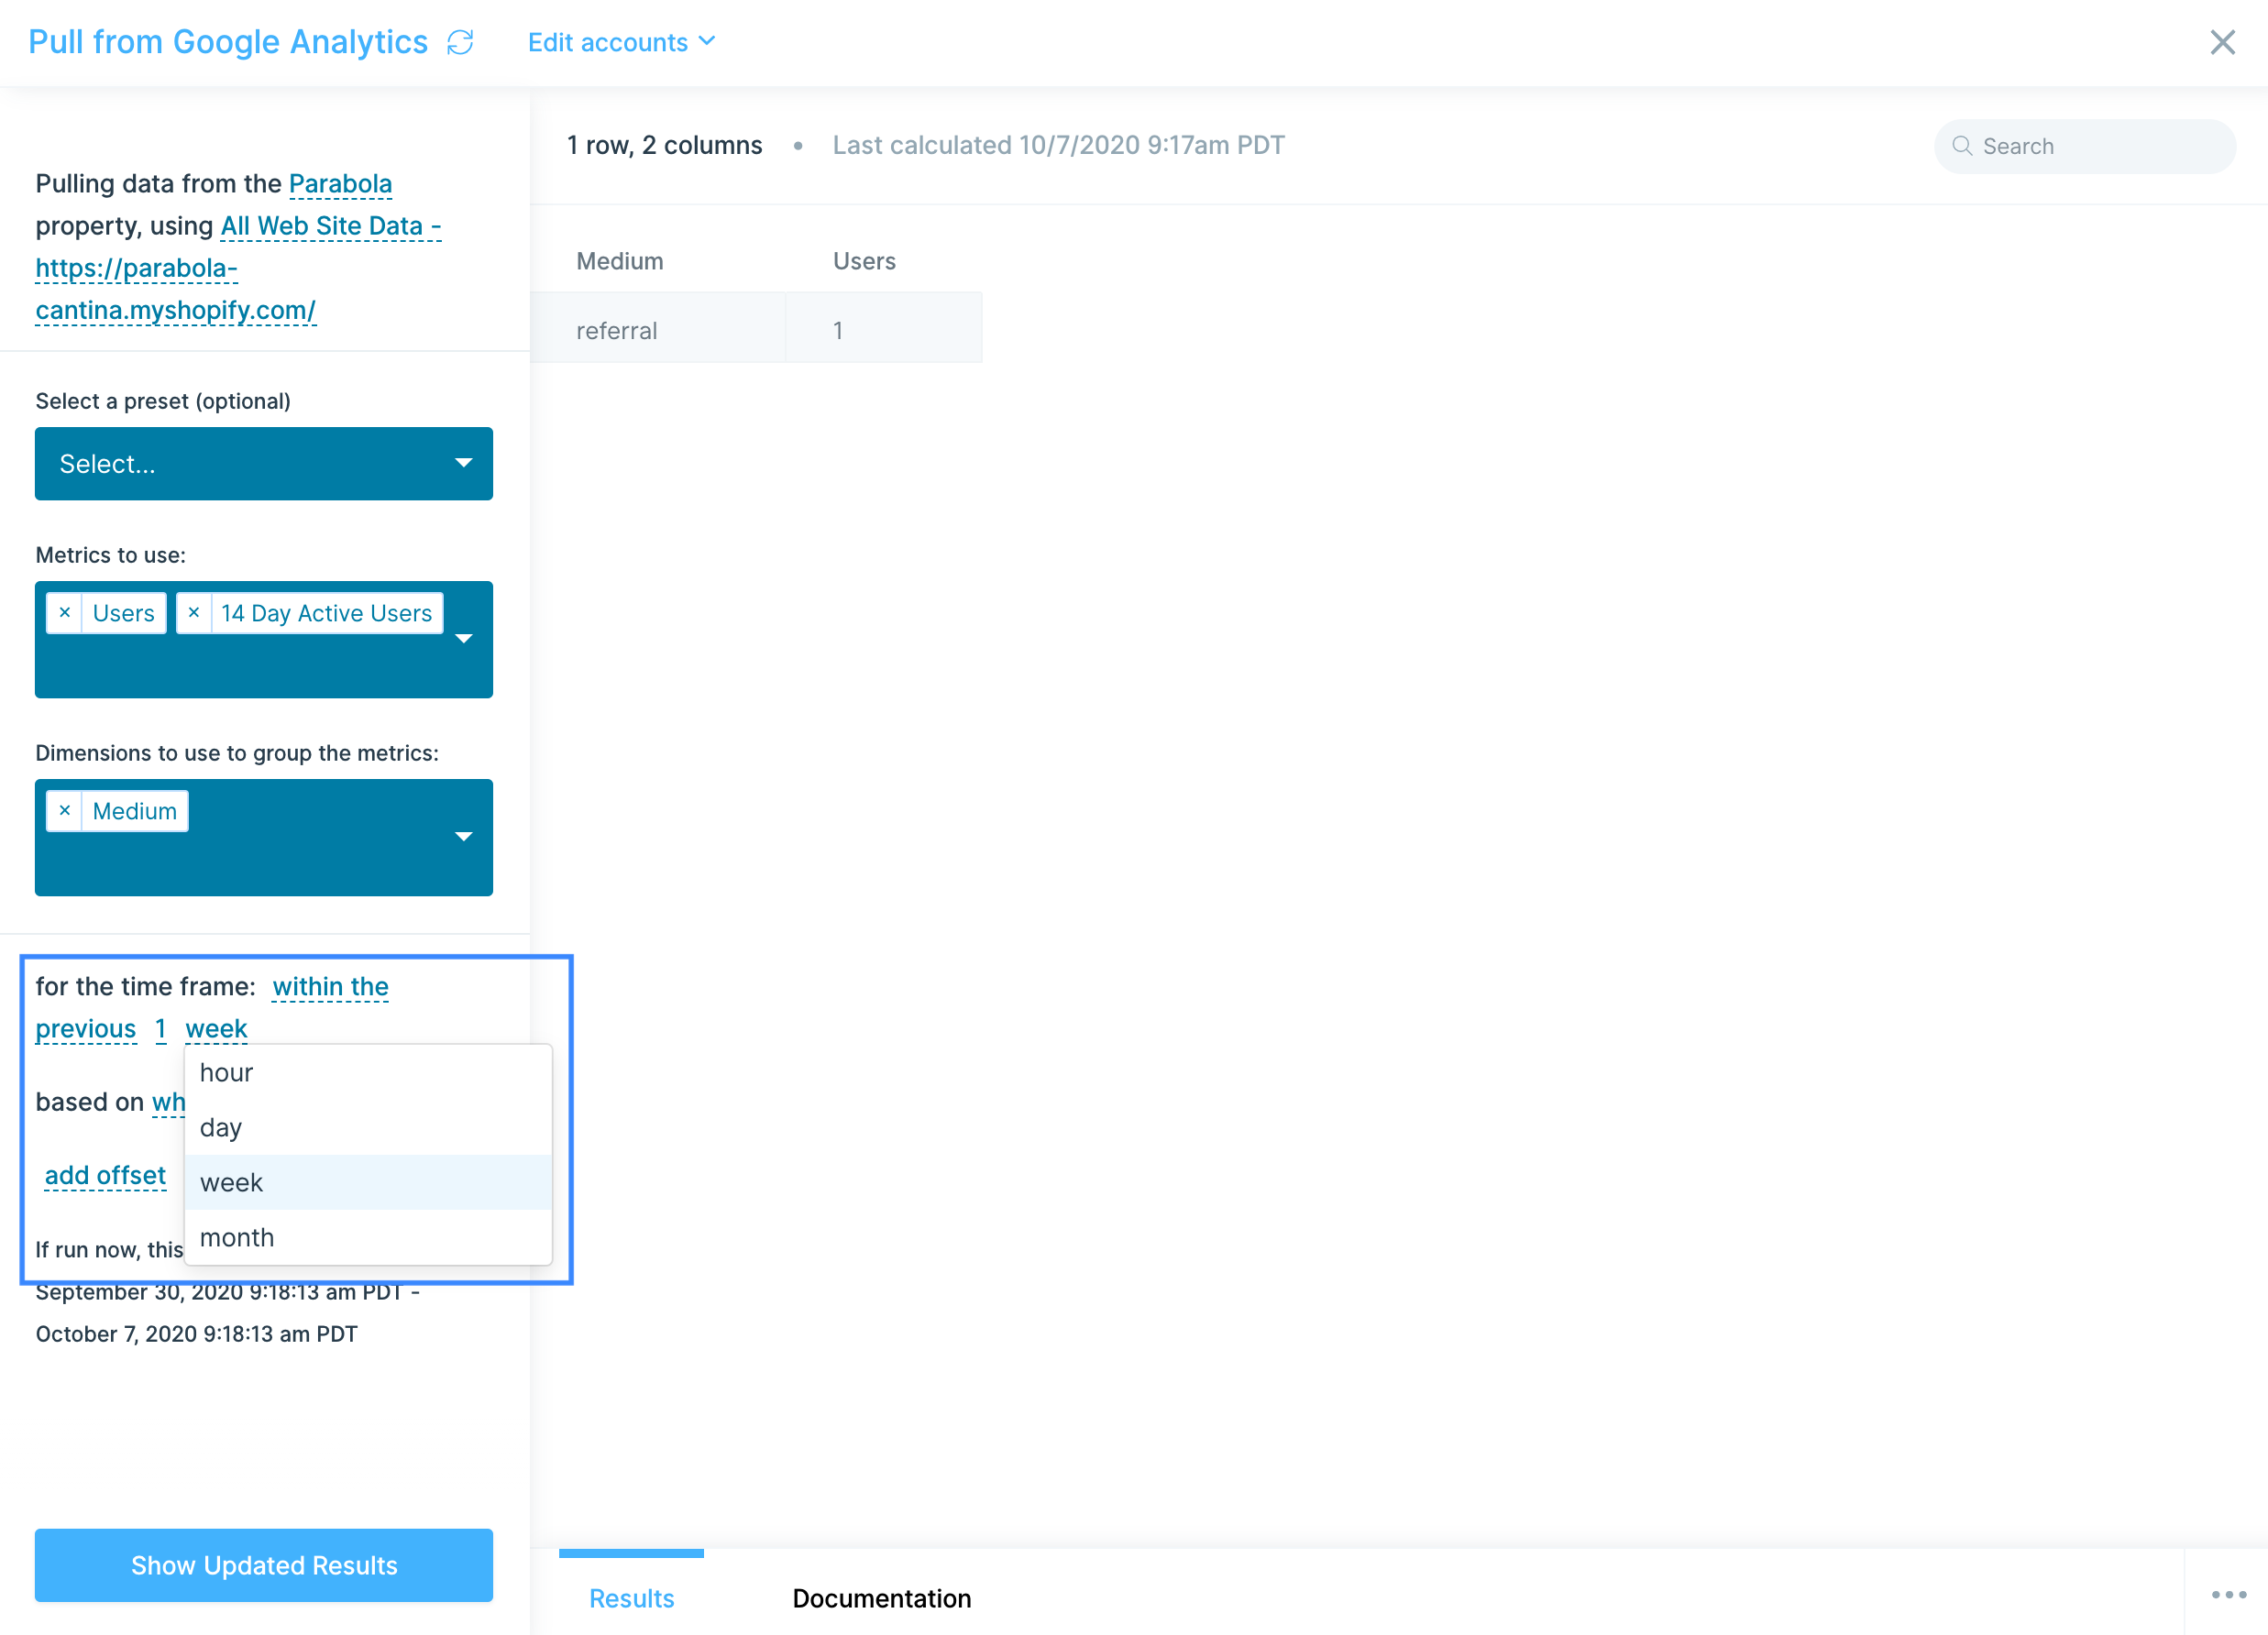
You can also adjust for when you'd like the timeframe calculation to run, giving you the ability to pick between when the flow is run or the most recently completed month/week/day/hour. The latter option is great for running a report for the last month, on the 1st of the following month, while excluding any data collected for far that day.
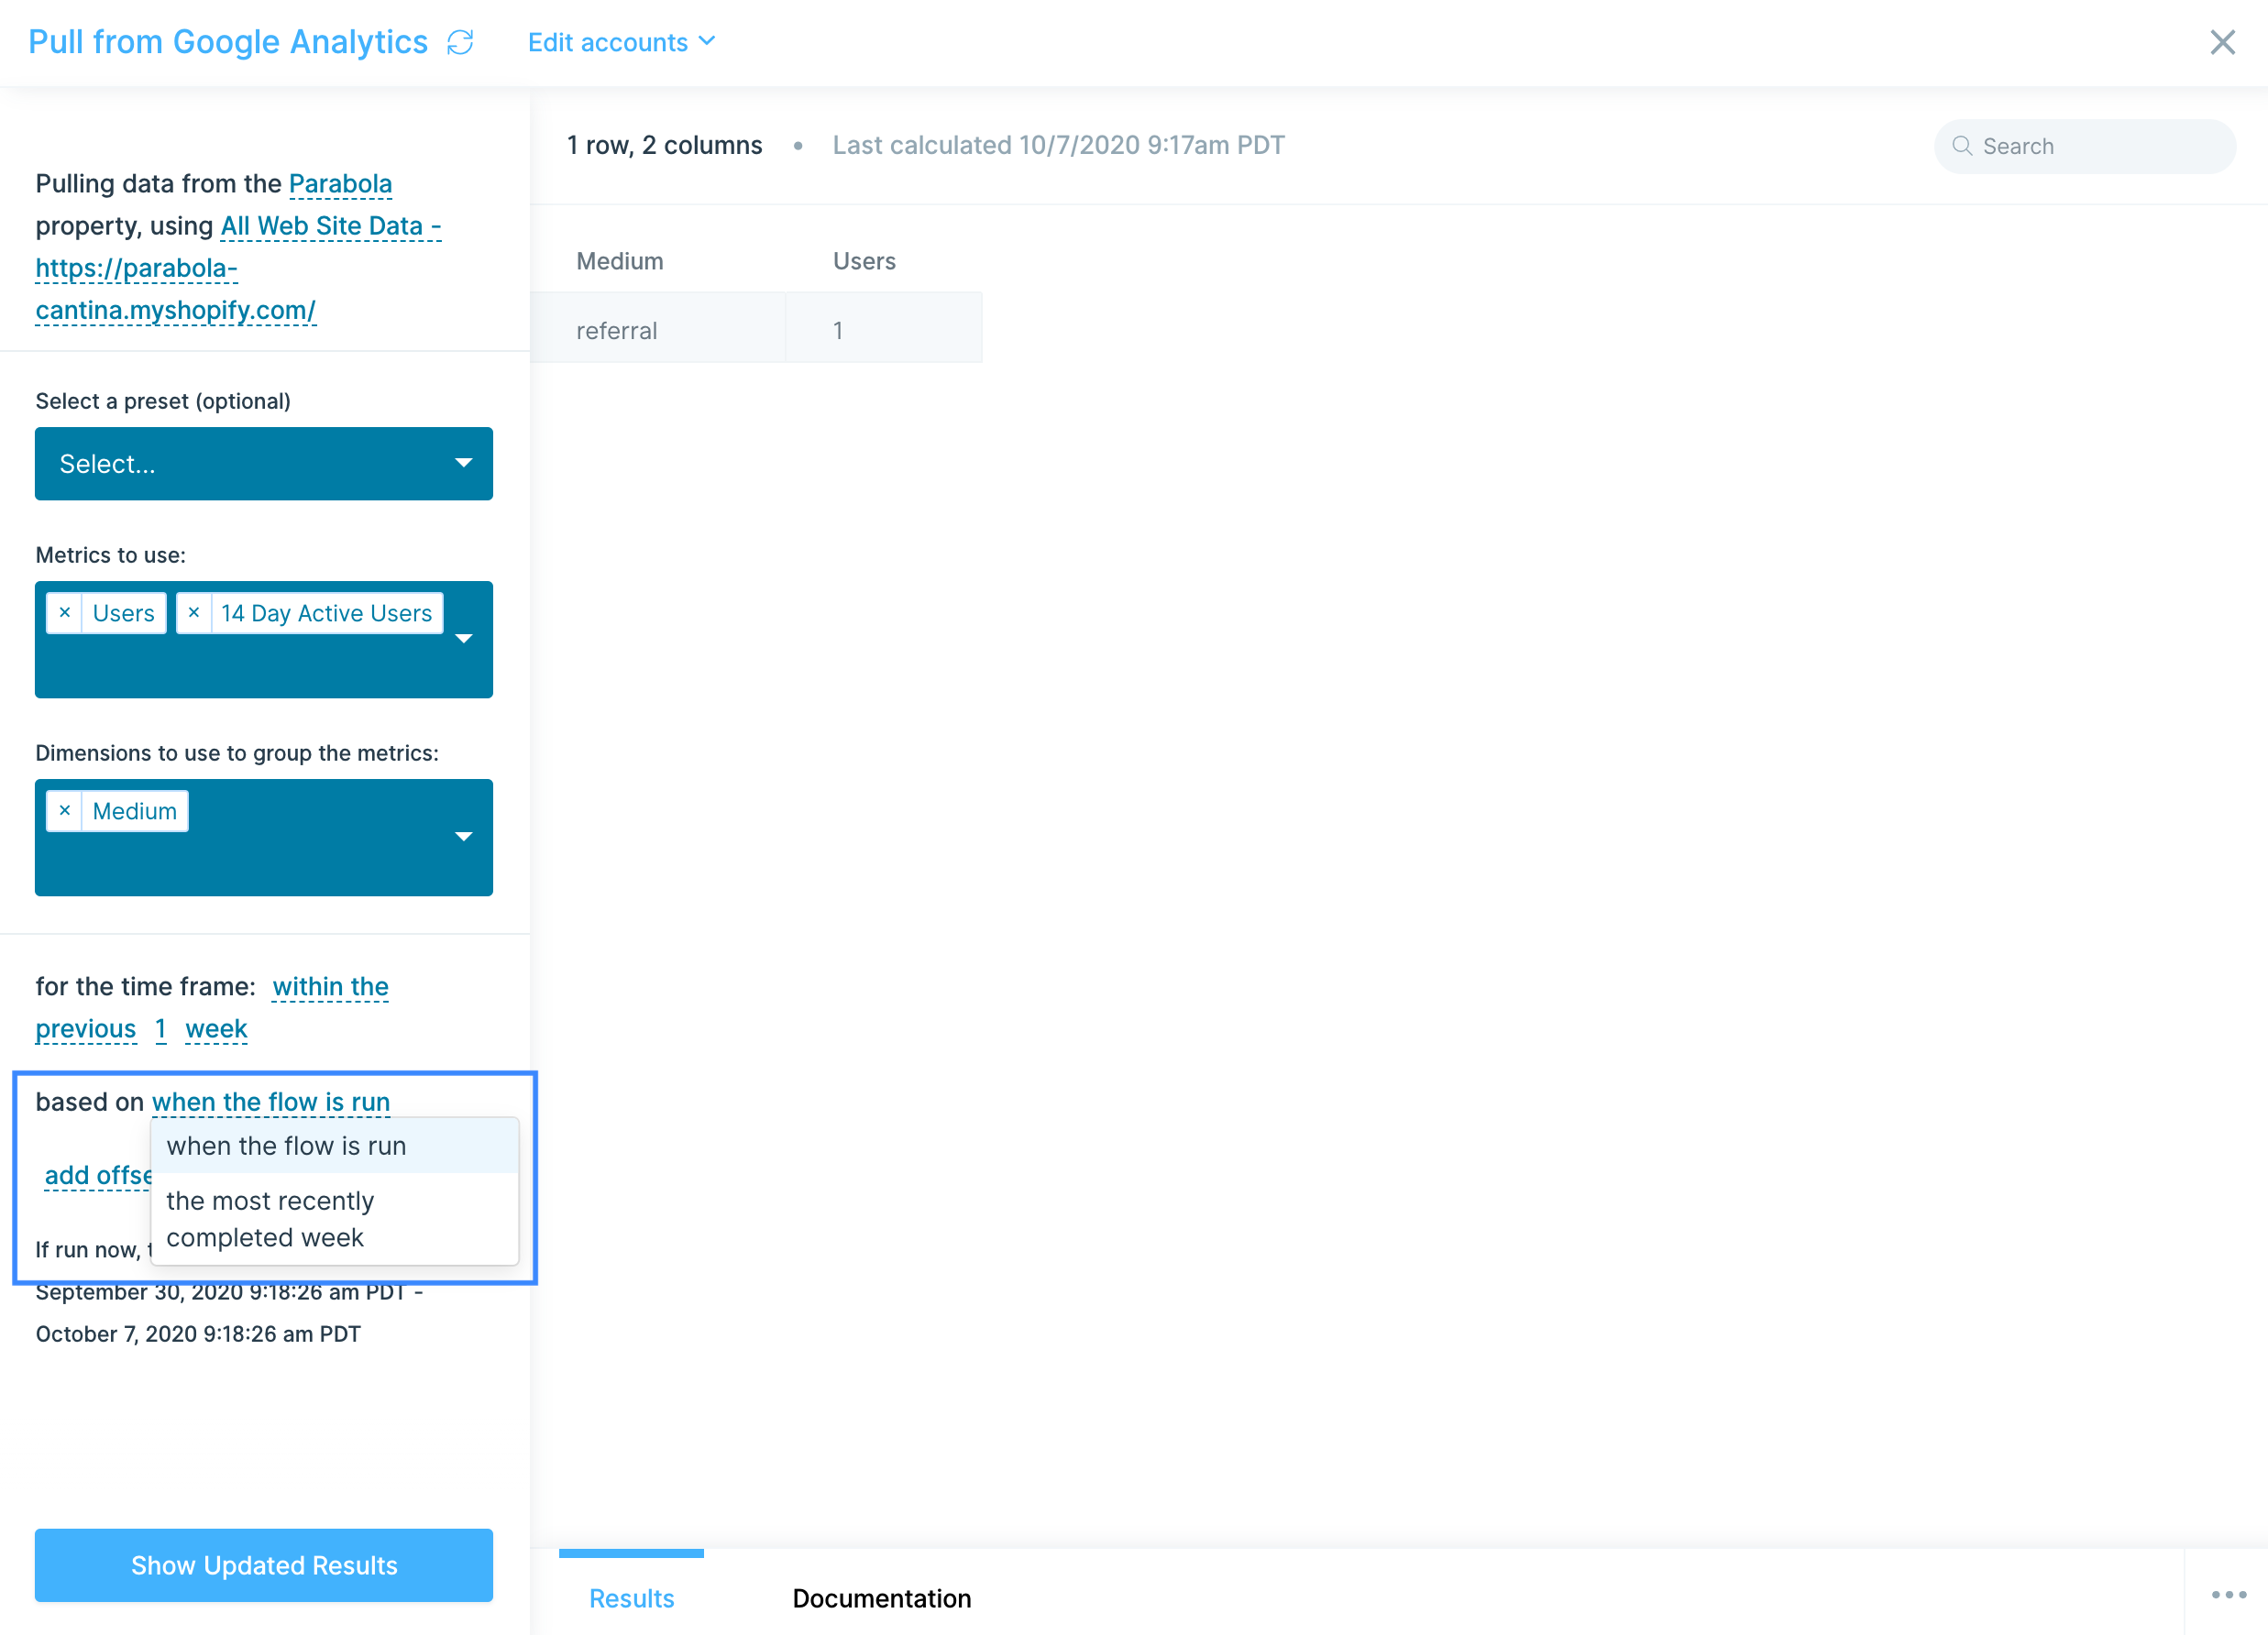
Lastly, if you choose, you can add offset for your date timeframe.
If you are looking to compare this data set to the same set, but from the previous period, a great way to do that is to pull in the two data sets, and the use the Combine tables step to combine them, using their dimensions in the matching rules.
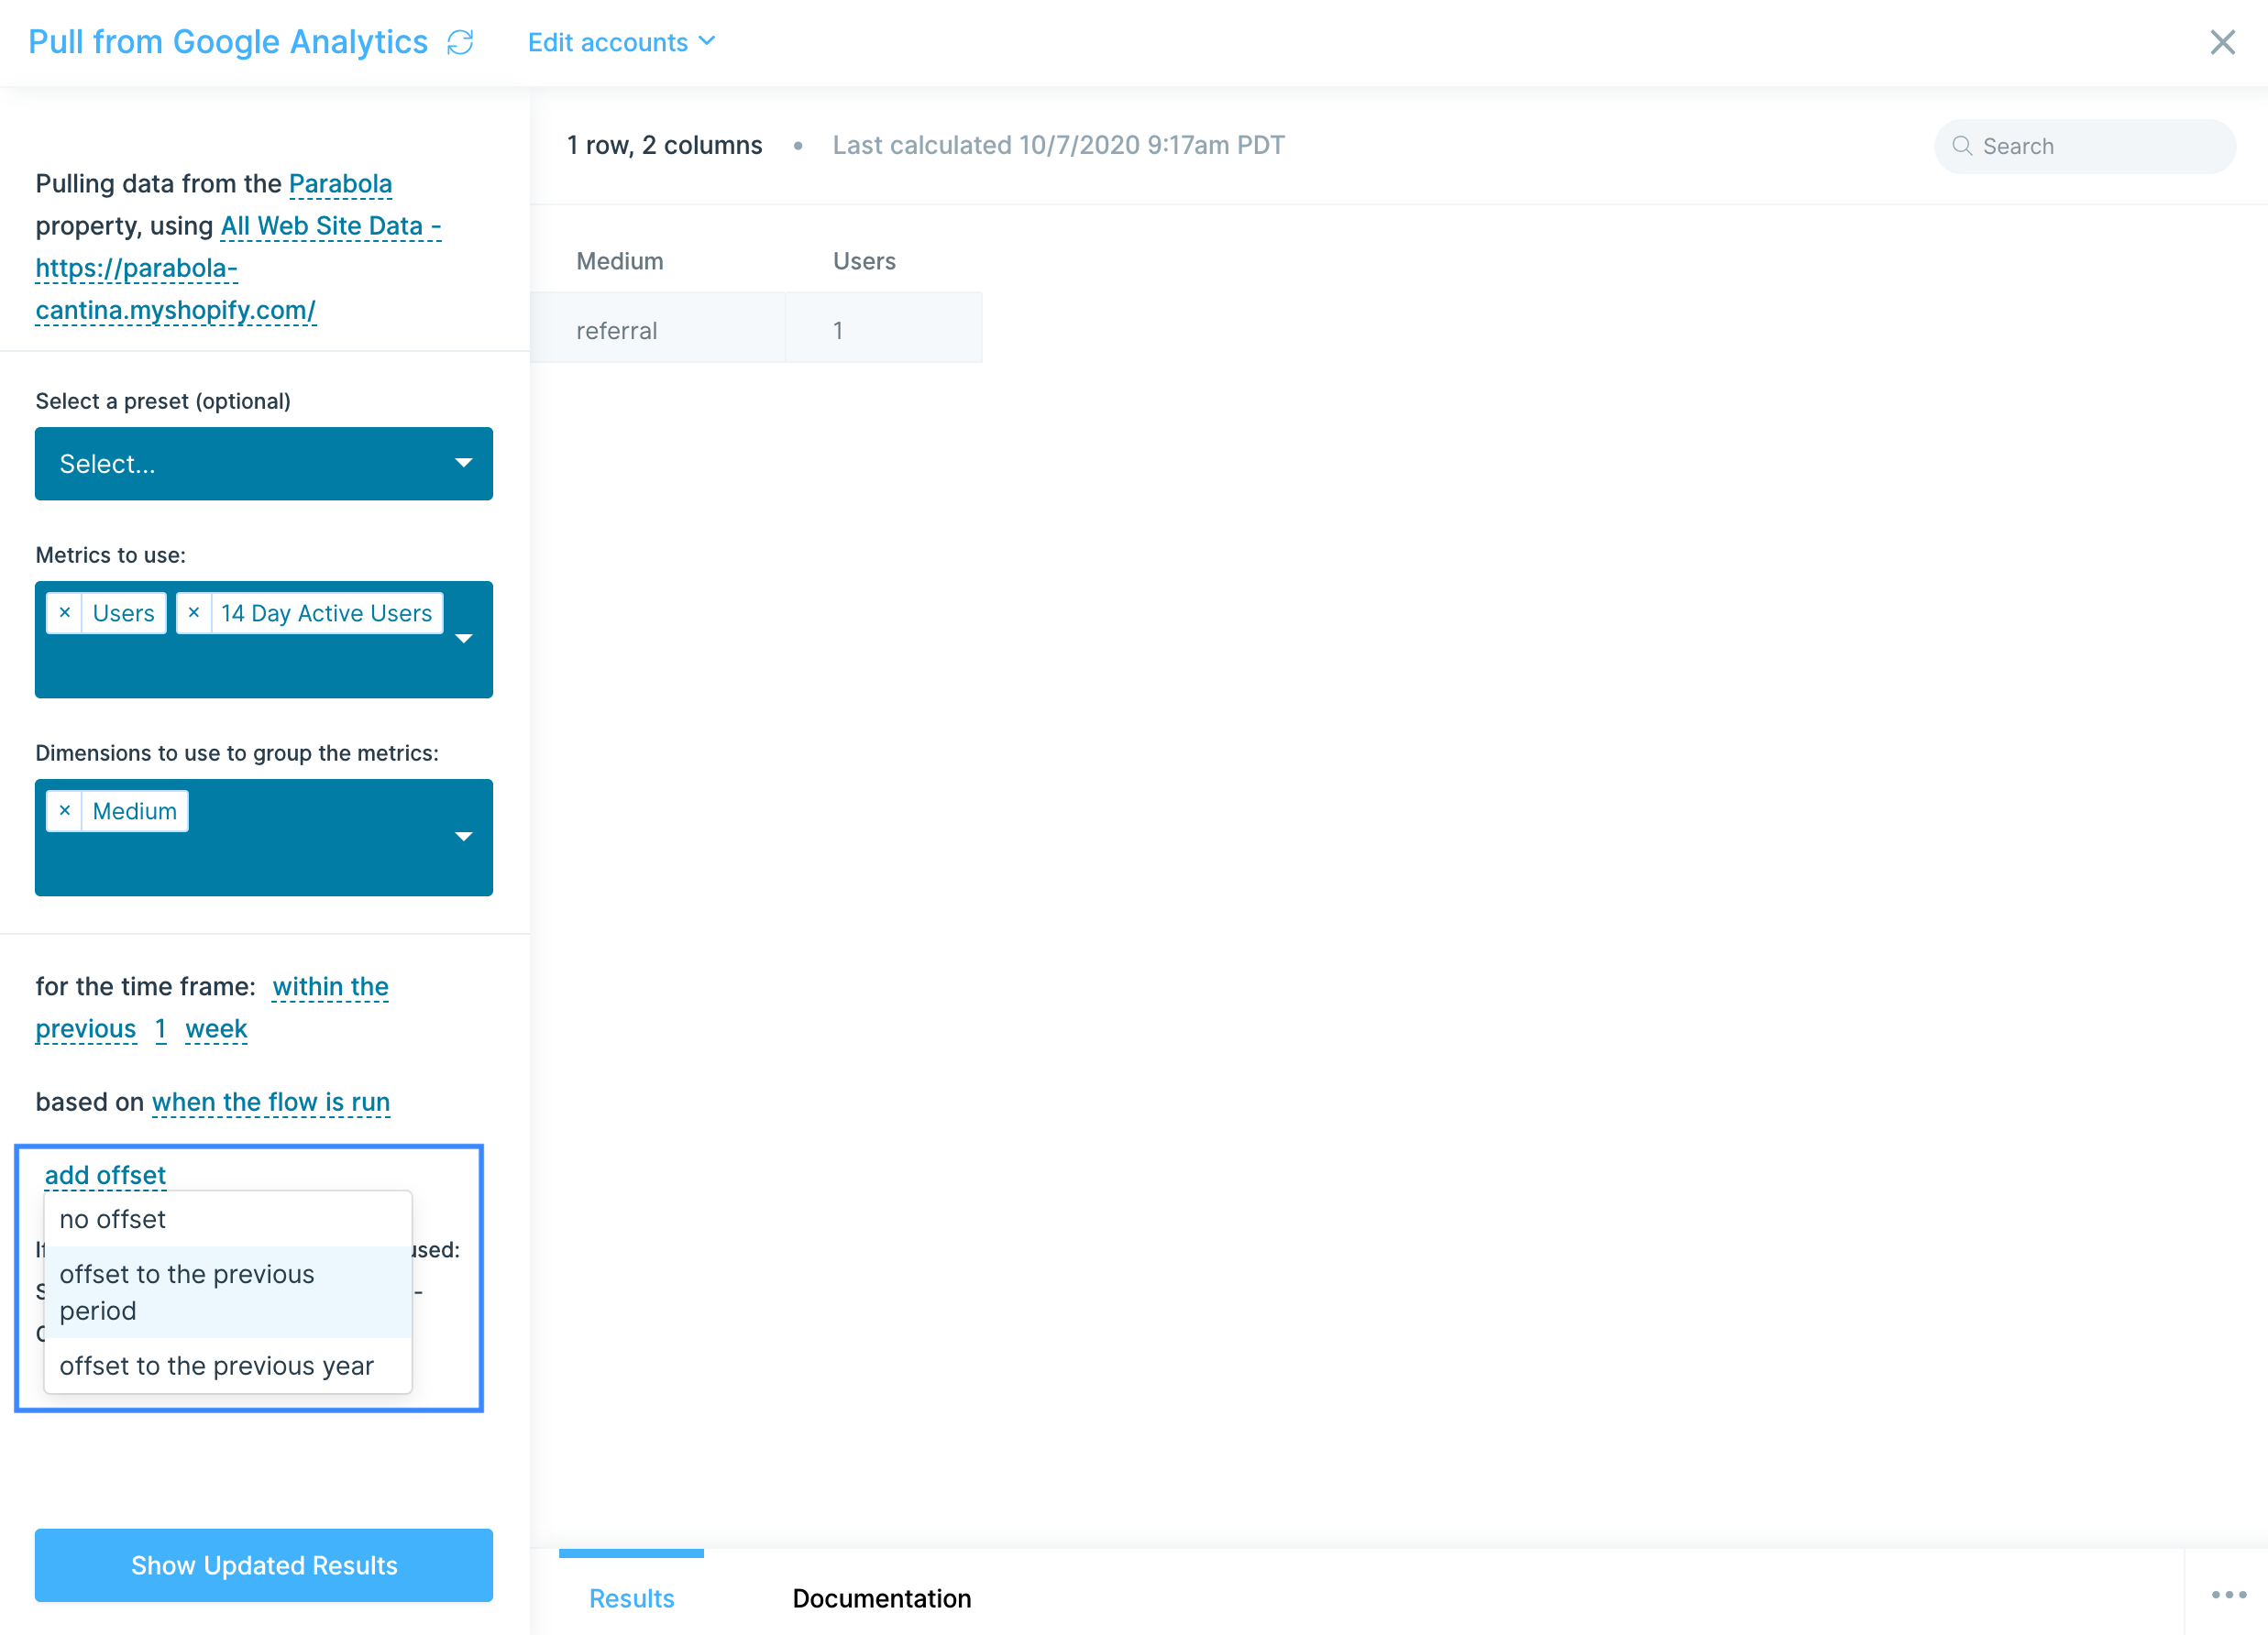
Helpful tips
- This step is available starting at our Plus plan.
- Please note that Google Analytics Reporting API V4 (App + Web) is not yet supported in this step. Use the Pull from Google Analytics 4 step to pull in data from your GA V4 account.
Integration:
Google Drive
The Pull from Google Drive step gives you the ability to pull in CSV, Excel files, and Google Sheets from your Google Drive.
Connect your Google Drive account
To connect your Google Drive account, click Authorize to login with your Google account credentials.
Setting up the step
Use the file selector to select which file to pull data from
.png)
If you have multiple dataset sheets (tabs) in a file, specify which one you'd like to pull in by clicking on the dropdown menu under the file name.
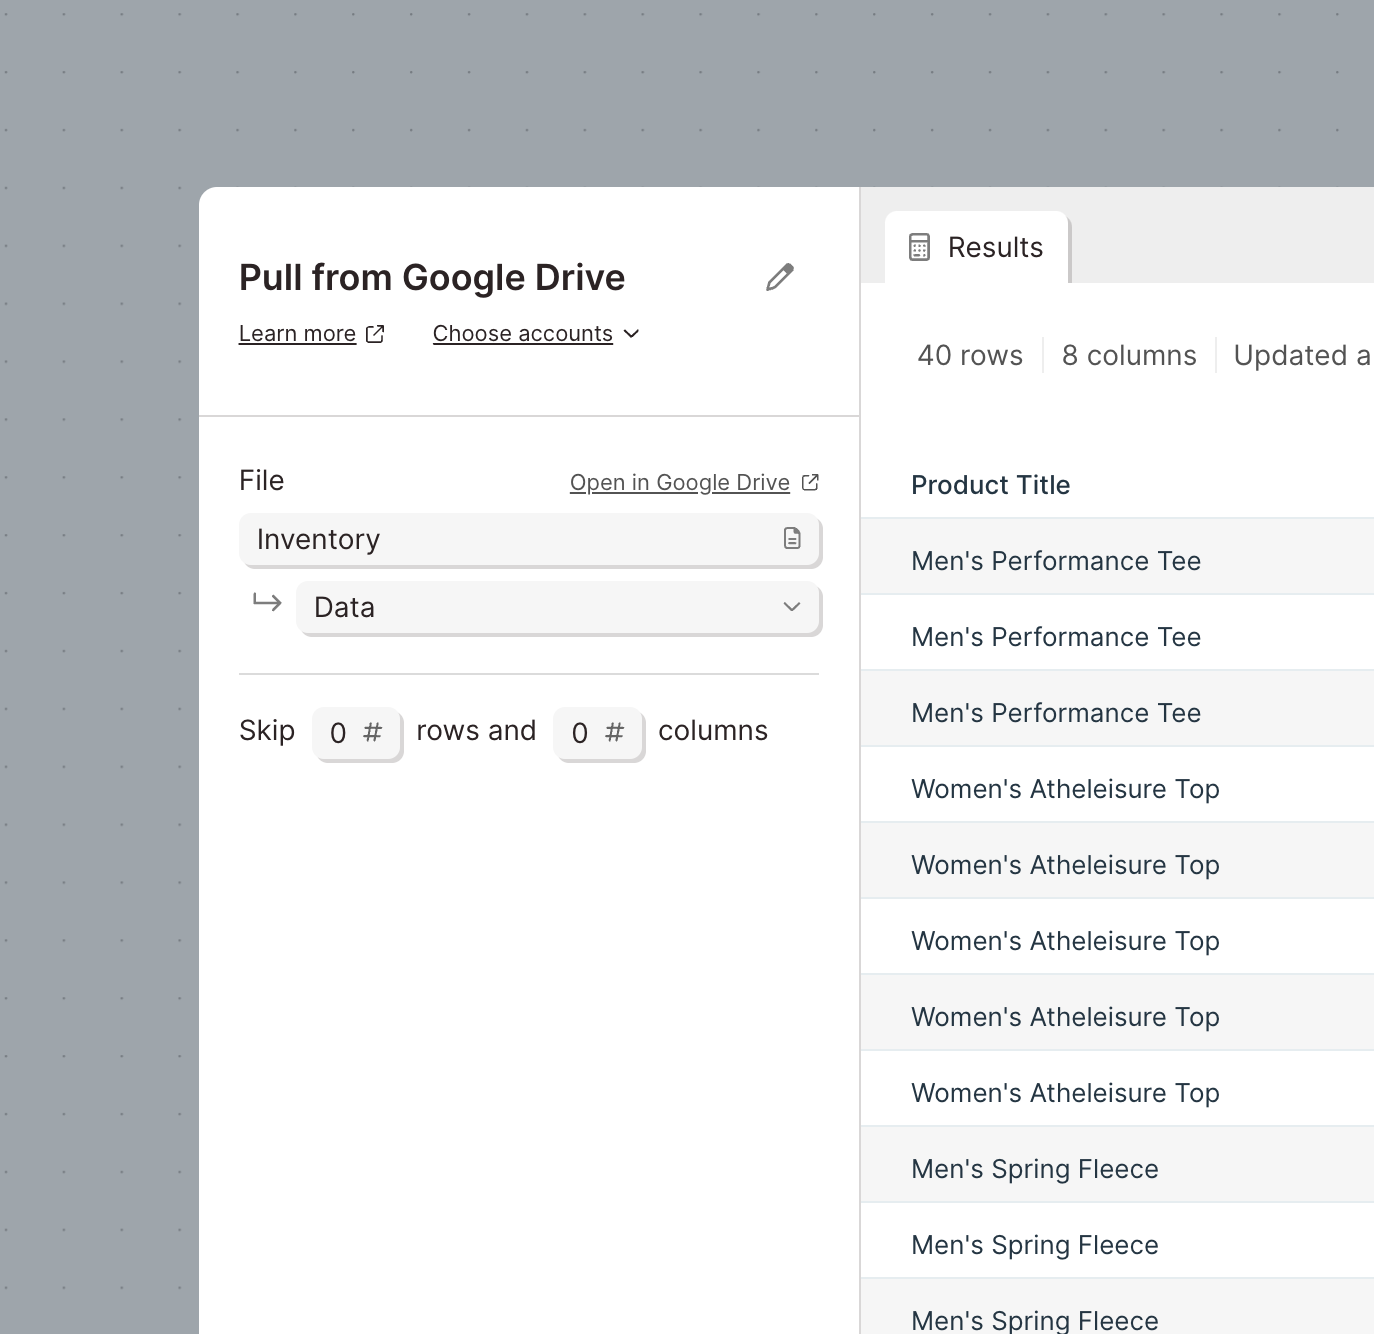
You can also select to skip rows or columns of your choosing. This will skip rows from top-down and columns from left-to-right.
Helpful tips
- This step pulls data in exactly as it is shown in Google Drive. Formatted dates and numbers will be pulled in and shown in their formatted state. Visual formatting, such as colors, font changes, or sizing will not show up in Parabola.
- Any changes you make to the Google Drive file will be automatically updated when you run a flow, or manually updated if you click the refresh icon to the right of the step's name.
- This step can access any file in any Drive that your Google account has authorization to access.
- Google Sheets is unable to parse names that contain colons. Replace colons in the name of the sheet with an underscore or period to remove any colons.
- Other teammates who have access to a Flow where you have authenticated your Google account will not be able to see any other files in your Google Drive. If they want to update the file that the step is using, they will need to authenticate and select a file from their own Google Drive.
The Send to Google Sheets step gives you the ability to automate sending custom datasets to Google Sheets. You can create a new Google Sheets file or update a specific sheet by having the dataset overwrite or append (add on) to an existing file.
Connect your Google Sheets account
To connect to your Google account, click Authorize to login with your Google account credentials.
Setting up the step
Select how you want this step to export data:
- Add data to an existing file (by overwriting the file or appending data to the bottom)
- Create a new file to write data to
- Create a new file on every run
Once you’ve selected a file to add data to, or have created a new file, select a sheet to send data to (one for each input to the Send to Google Sheets step).
When creating a new file or creating a new file on every run, you can select to create that file in the root of your Drive, or within a specific folder.
.png)
Helpful tips
- To ensure your header column titles carry over to your sheet, be sure to overwrite a sheet once. Any appending afterwards will still keep the header column titles. However, if you append to a blank sheet, header column titles won't be included in the exported data.
- This export step can accept multiple input sources, but here are a couple useful things to know. If you want your input sources to be exported to the same sheet, use the Stack tables step to combine your data set before sending it to the Send to Google Sheets step. If you want your input sources to be exported to different sheets, you'll have the option to select the specific sheet that your inputs should send data to.
- Anyone with access to the Google Sheet file will be able to see and use the updated datasets.
- This step can access any file in any drive that your Google account has authorization to access.
- Google Sheets has a 10 million cell limit. Any data being sent through a Send to Google Sheets step will need to be within that cell limit.
- Other teammates who have access to a Flow where you have authenticated your Google account will not be able to see any other files in your Google Drive. If they want to update the file that the step is using, they will need to authenticate and select a file from their own Google Drive.
Export your flow results directly into Google Drive as CSV, Excel, or Google Sheets files.
Connect your Google account
- Add the Send to Google Drive step to your flow.
- Open the step and click Authorize.
- Sign in with your Google account credentials to complete the connection.
Choose your export mode
Select how you want the step to handle files:
- Overwrite an existing file
- Append to an existing file (Google Sheets only)
- Create a new file (static name/dynamic name)
- Create a new file on every run (static name/dynamic name)
- Parabola will automatically add a dynamic timestamp to file names for the "create a new file on every run" option to avoid collisions. The dynamic timestamp will look like this
2025-09-30 16:41:19Zand the timezone is set to UTC.
- Parabola will automatically add a dynamic timestamp to file names for the "create a new file on every run" option to avoid collisions. The dynamic timestamp will look like this
File type behavior
- Google Sheets
- Can be overwritten, appended to, or created new.
- Multiple inputs can populate different tabs in the same file.
- Subject to Google’s 10 million cell limit.
- Excel (.xlsx)
- Can be overwritten or created new.
- Multiple inputs can populate different tabs.
- CSV (.csv)
- Can be overwritten or created new.
- Accepts only a single input (no tabs).
File location
When creating new files, choose the location:
- Place it in the root of your Drive.
- Or specify a folder.
This step can access any file or folder in any Drive your Google account has access to (My Drive or Shared Drives).
Dynamic file names with merge tags
Use merge tags to insert dynamic values into the file name. Wrap the column name in {}.
Examples:
report_{date}→report_2025-09-30.csv- Please note that
{date}is referencing a column called{date}. It is not a dynamic variable. You could use Add date & time to add a dynamic date column that you can then reference in your file name.
- Please note that
sales_{Region}→sales_APAC.xlsx
Notes:
- Merge tags are supported in the file name field only (not in sheet/tab names).
Helpful tips
- Headers when appending: Overwrite the sheet once to establish headers. If you append to a blank sheet, headers won’t be included.
- Appending functionality: Appending to an existing file is only supported for Google Sheets. New rows will always be appended to the bottom of the existing dataset.
- Combining inputs:
- To send multiple inputs to the same sheet, use the Stack tables step first.
- To send multiple inputs to different sheets, configure each input to map to a specific tab.
- File access: Anyone with access to the target Google Sheet will see updated data after export.
- Team permissions: Other teammates using your flow cannot browse your Drive. They’ll need to re-authenticate with their own Google account if they want to update the connected file.
Integration:
Google Sheets
Integration:
Gorgias
How to authenticate
Gorgias uses OAuth 2.0 for secure authentication. To connect Gorgias to Parabola:
- Get your Gorgias subdomain
- Your subdomain is the part of your Gorgias URL before
.gorgias.com. For example, if your Gorgias URL ishttps://acme.gorgias.com, your subdomain isacme.
- Your subdomain is the part of your Gorgias URL before
- Connect in Parabola:
- In your flow, add a Pull from Gorgias step.
- Click Authorize and enter your Gorgias subdomain when prompted.
- You'll be redirected to Gorgias to approve the connection. Accept the permissions necessary to make the connection and pull your data into Parabola.
Parabola will securely store your credentials and automatically refresh your access token, so you don't need to re-authenticate.
Available data
Using the Gorgias integration in Parabola, you can bring in:
- Tickets: Full ticket details including subject, status (open, closed, etc.), channel (email, chat, social), assignee information, customer details, tags, spam status, creation and update timestamps, and custom fields.
- Messages: Individual messages within tickets, including message body (HTML and plain text), channel, sender information (from agent or customer), and timestamps.
- Customers: Customer profiles with email addresses, names, external IDs, and associated customer data.
- Events: Ticket lifecycle events such as ticket creation, closure, assignment changes, and other activity with timestamps and event type details.
- Satisfaction surveys: CSAT survey data including survey scores, send dates, and associated ticket IDs.
- Tags: All tags used in your Gorgias account for categorizing and organizing tickets.
- Users (Agents): Team member information including names, email addresses, and user IDs.
Common use cases
- Pull ticket and message data to measure support team performance, including response times, resolution rates, and agent productivity across different channels and time periods.
- Analyze satisfaction survey scores alongside ticket data to identify which issues, products, or agents drive higher or lower CSAT scores.
- Schedule flows to pull yesterday's tickets, calculate key metrics (first response time, tickets resolved, backlog), and send summary reports to Slack or email.
- Track ticket volumes by tag, channel, or event type to spot recurring issues, seasonal patterns, or emerging product problems that need attention.
- Reconcile Gorgias ticket and customer data with Shopify order data to understand which products generate the most support volume or identify high-value customers who need extra attention.
- Export tickets and messages with specific tags or from certain time periods for quality assurance reviews, training, or compliance audits.
Tips for using Parabola with Gorgias
- Schedule your flow to run daily to keep support dashboards and reports current. For real-time monitoring during peak seasons, consider hourly refreshes.
- Use date filters to pull only recent tickets or events rather than reprocessing historical data on every run, which speeds up your flow and reduces API usage.
- Combine with other data sources including Shopify orders, carrier tracking data, or inventory systems to create end-to-end operational visibility and identify root causes of support issues.
- Set up alerts in Parabola to notify your team via Slack or email when ticket volumes spike, response times exceed thresholds, or CSAT scores drop below targets.
- Filter and order by status and tags to focus on specific ticket segments like open tickets, escalated issues, or tickets tagged with specific product lines or problem types.
- Document your logic with cards in Parabola so your team can easily understand and maintain your support reporting flows as your needs evolve.
Integration:
HubSpot
Use the Pull from HubSpot step to pull in Contacts, Companies, Deals, and Engagements data from your HubSpot CRM.
Connect your HubSpot account
To connect your HubSpot account, click Authorize.
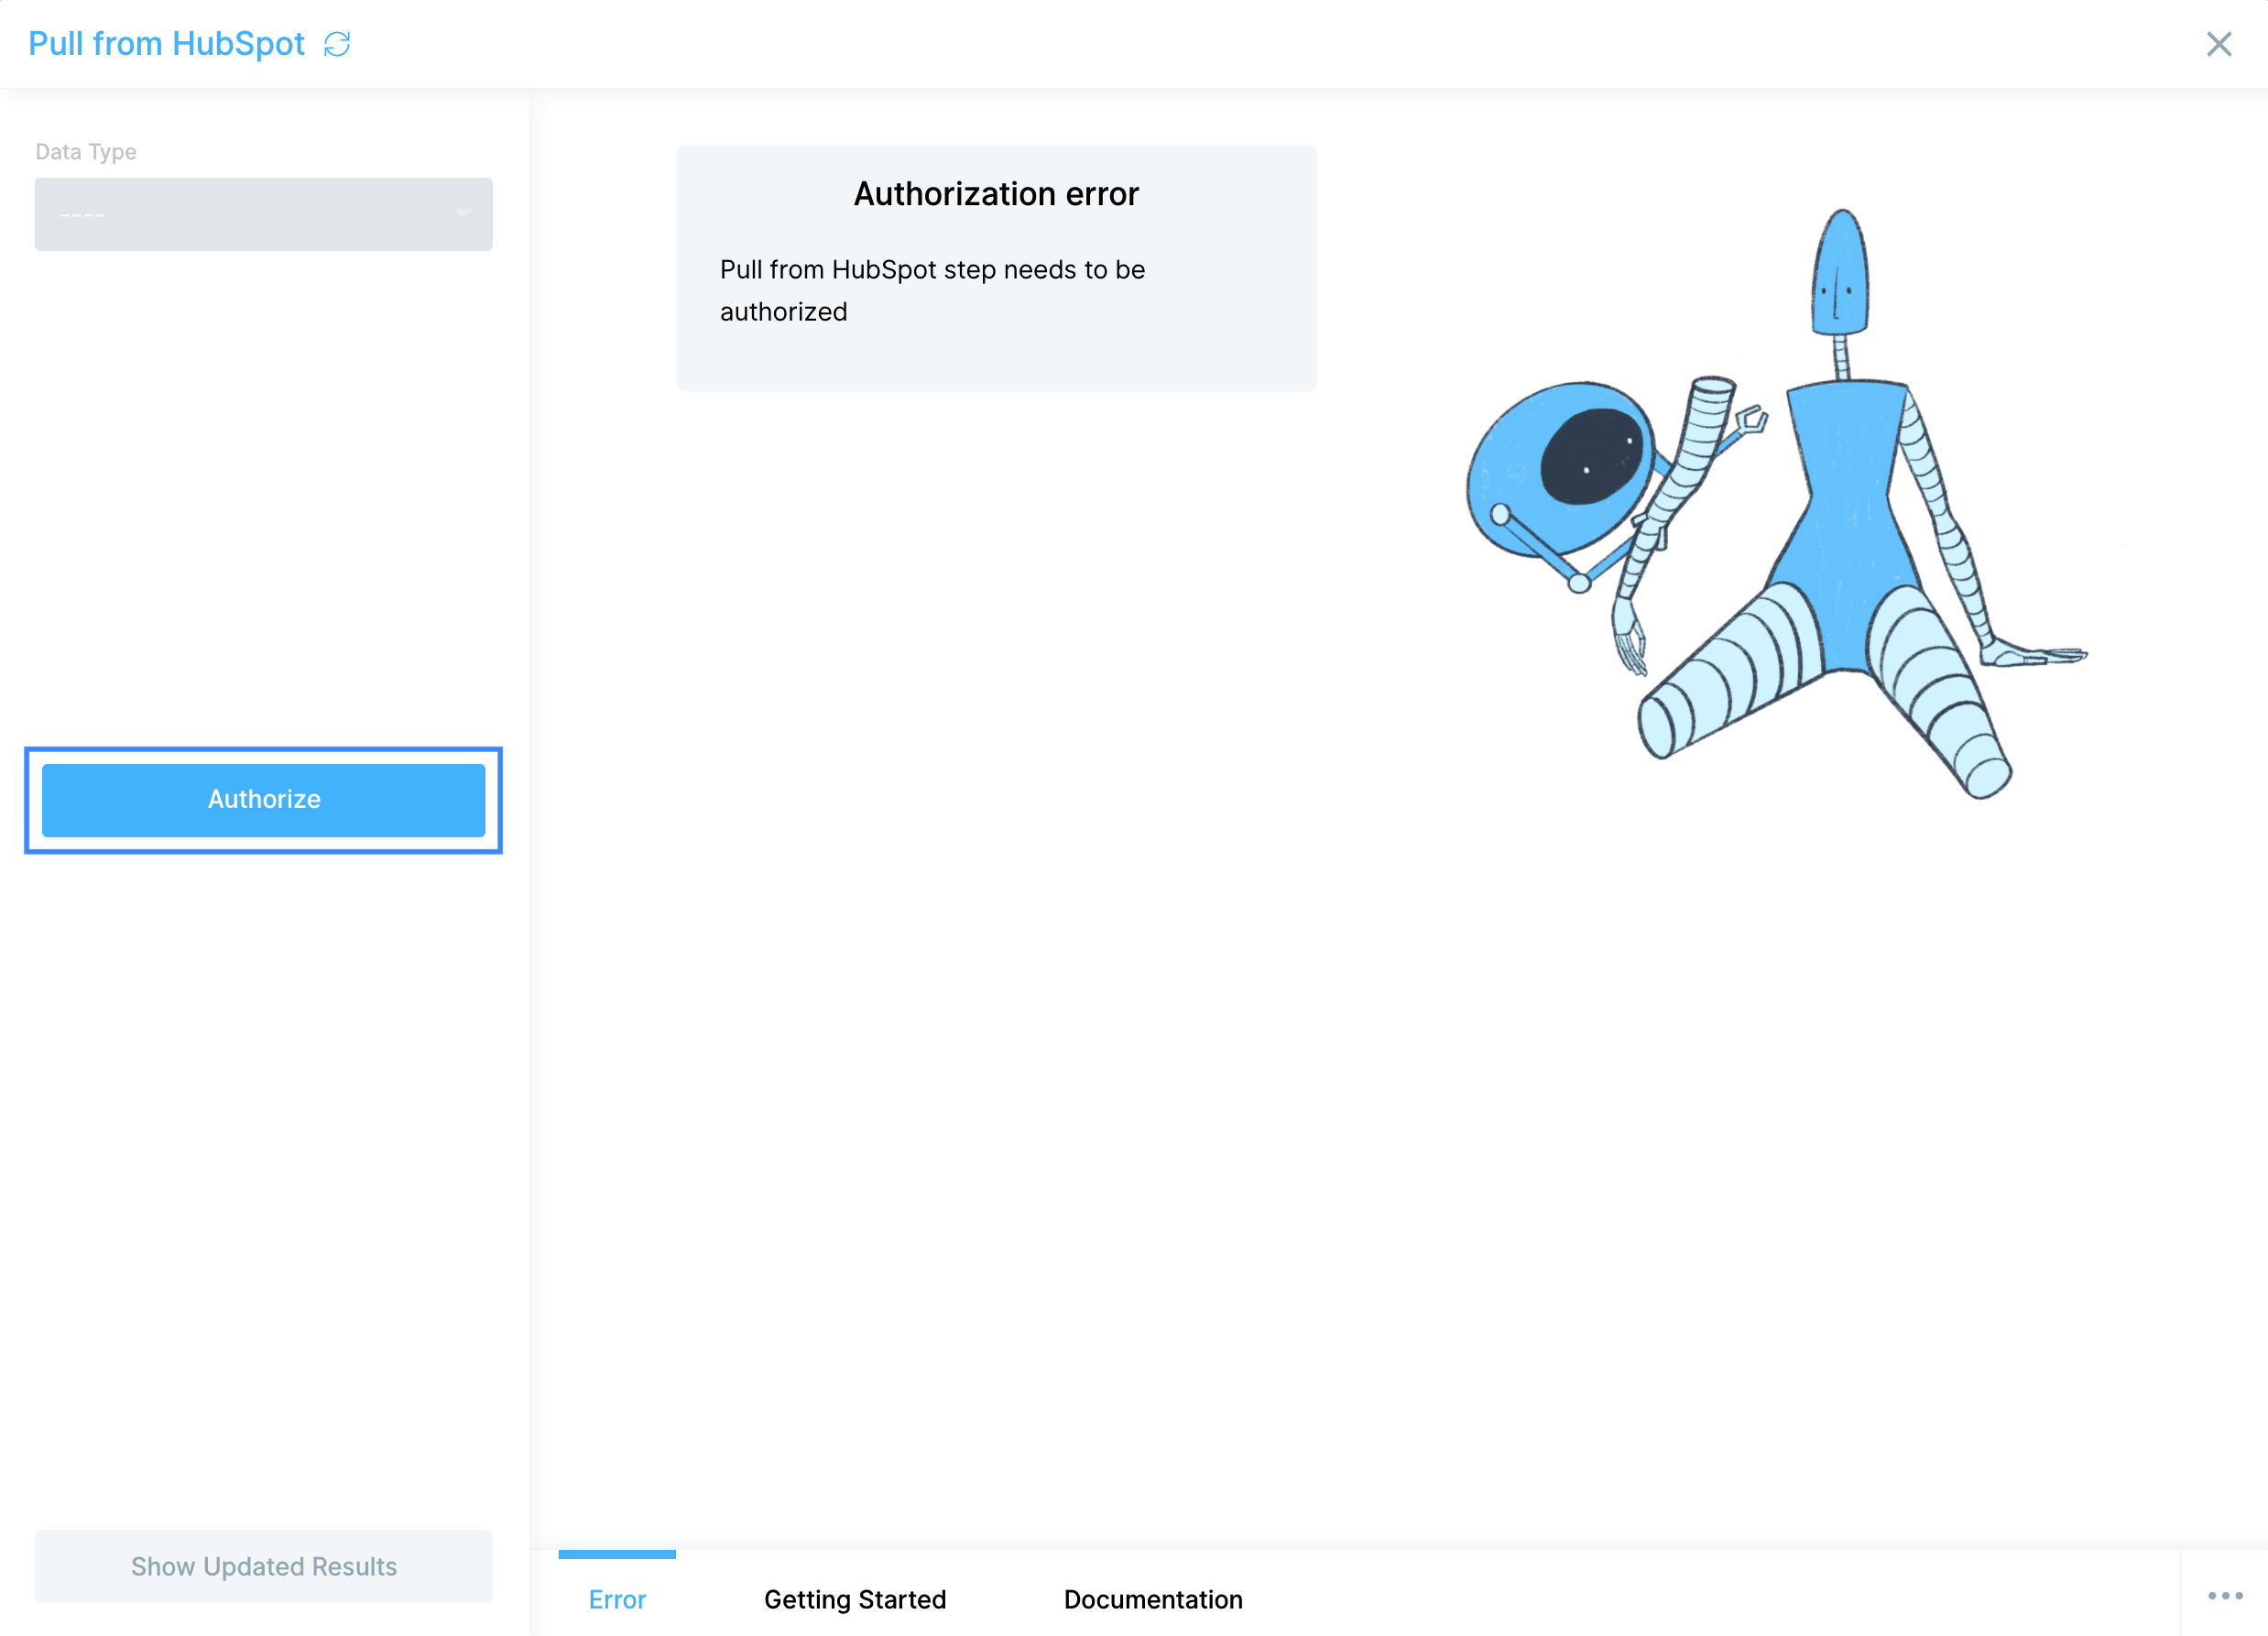
Custom settings
Once you've logged in and authorized your HubSpot account, you can begin to pull in data from your Contacts, Companies, Deals, and Engagements records in your CRM by selecting a Data Type.
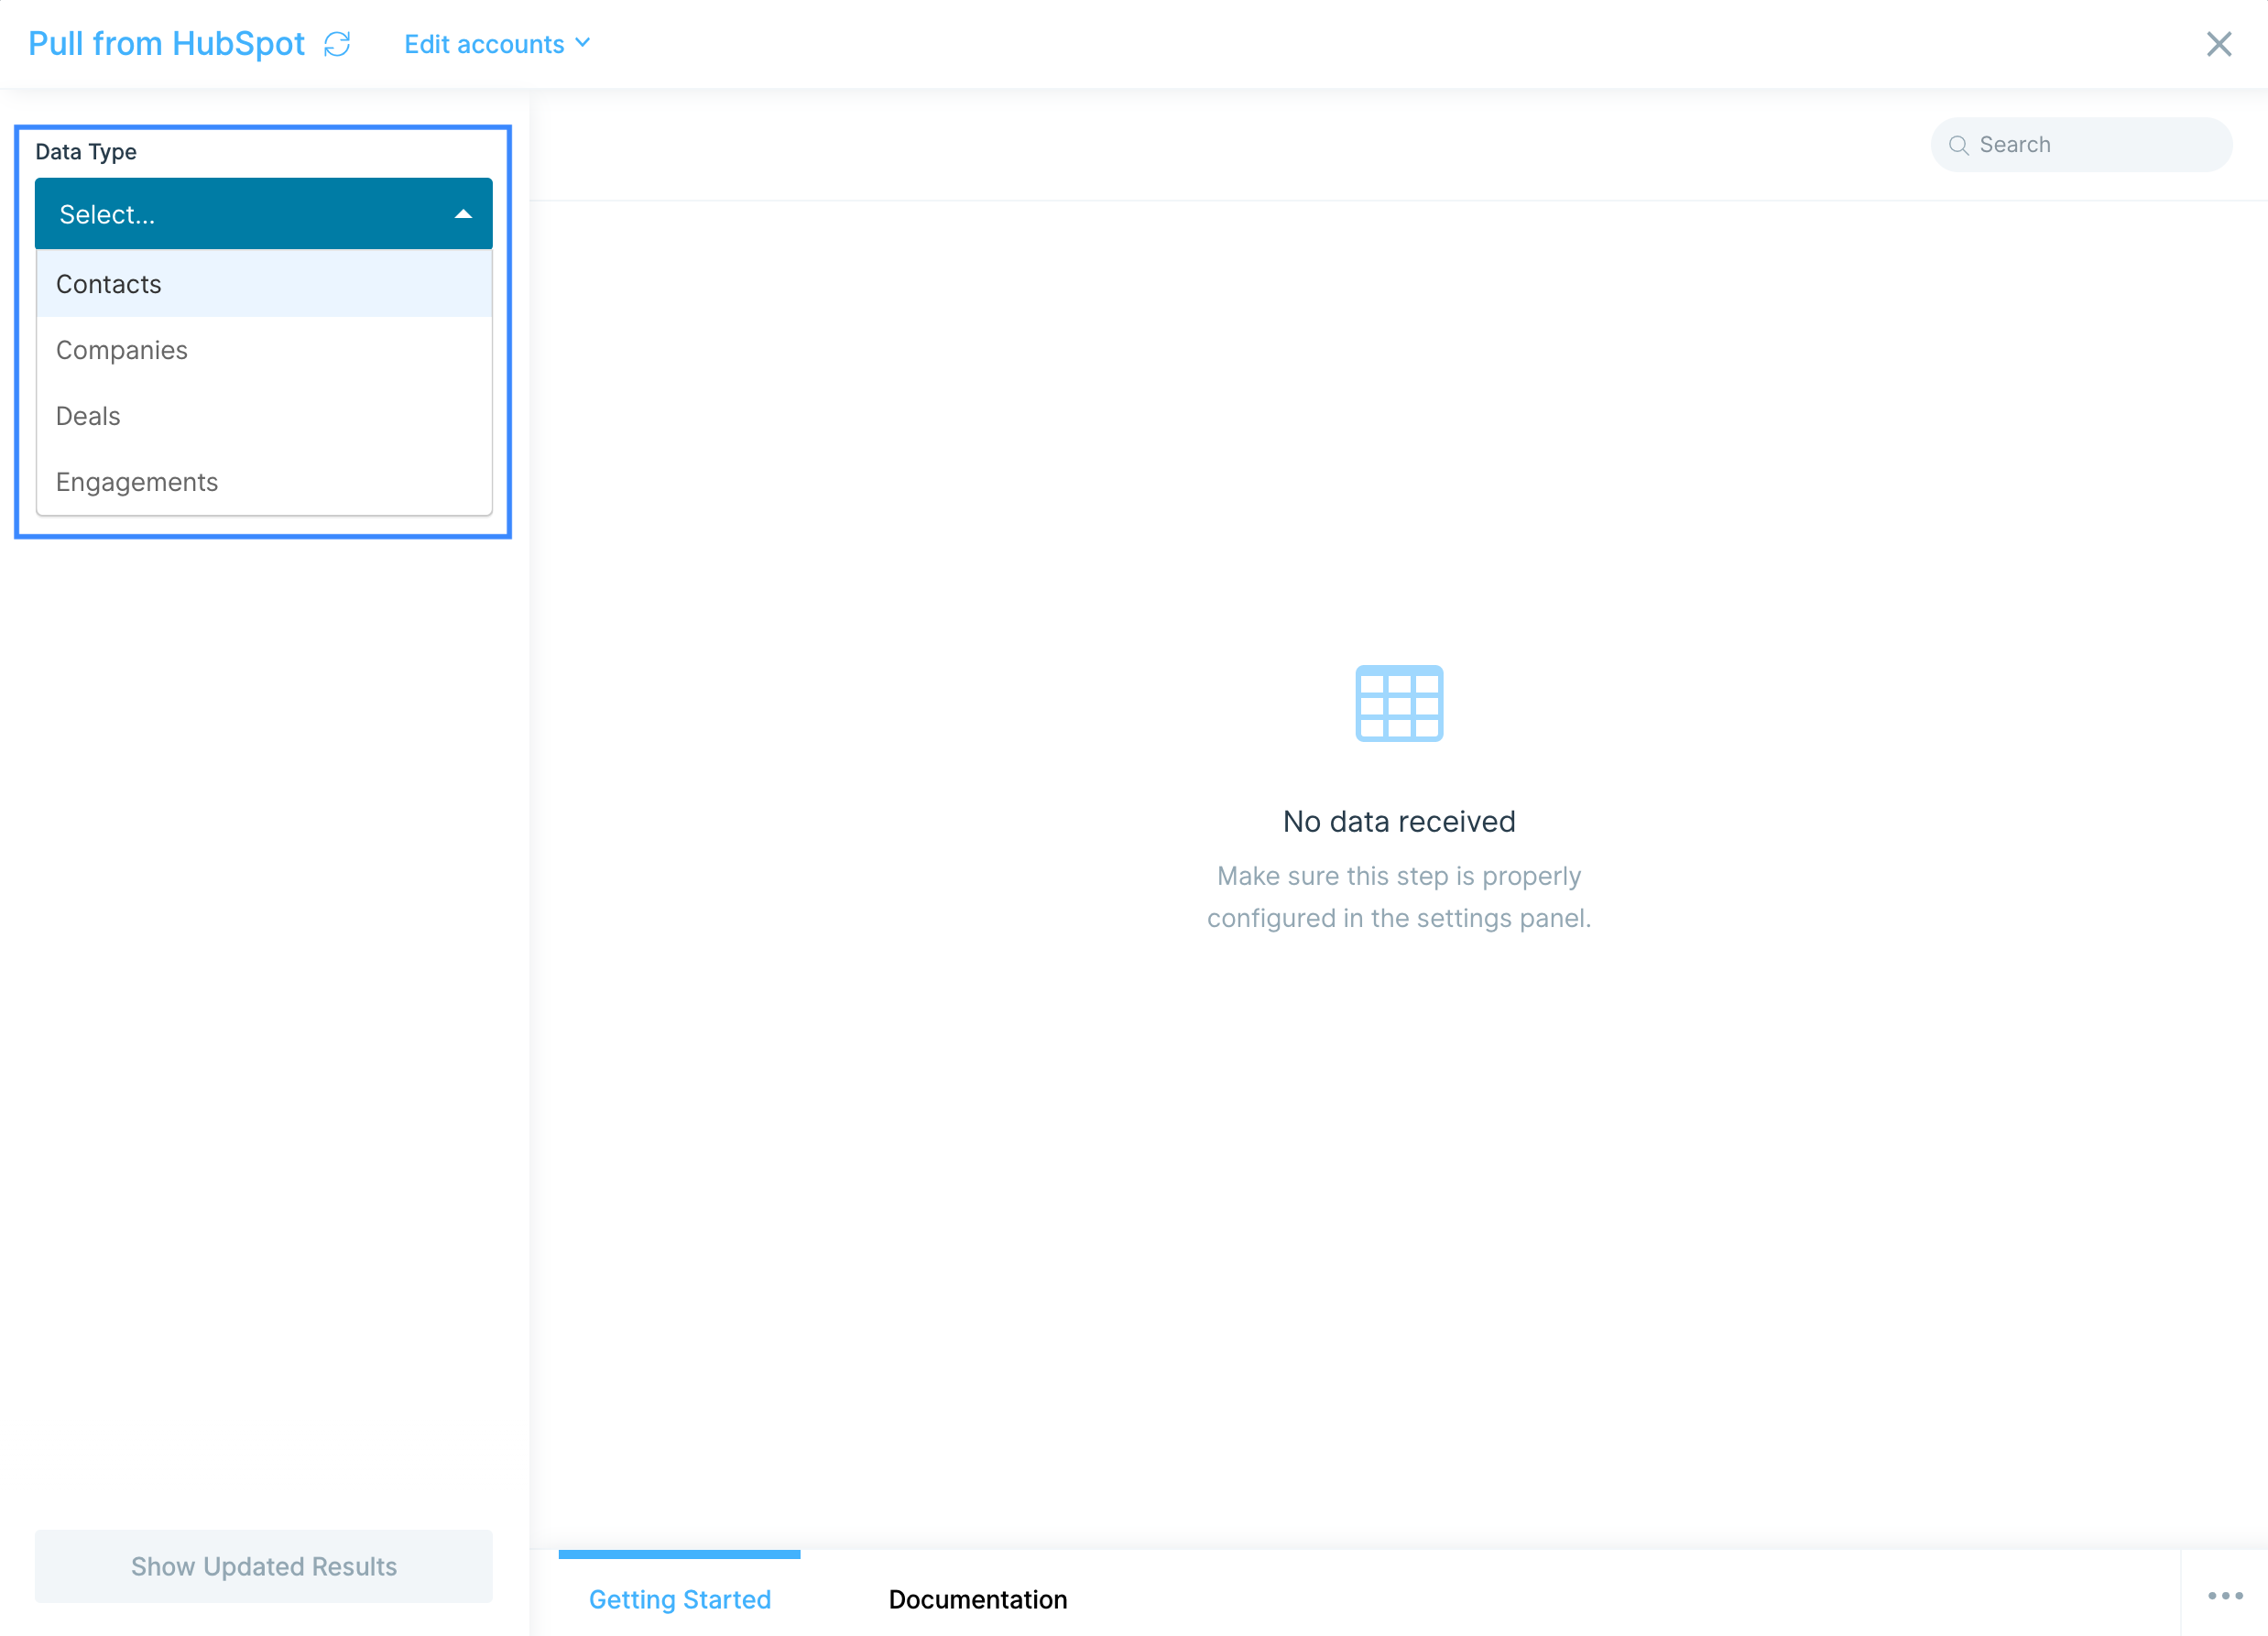
When selecting a Data Type, you'll see an additional Properties dropdown. Here, you can add or remove columns from your data set.
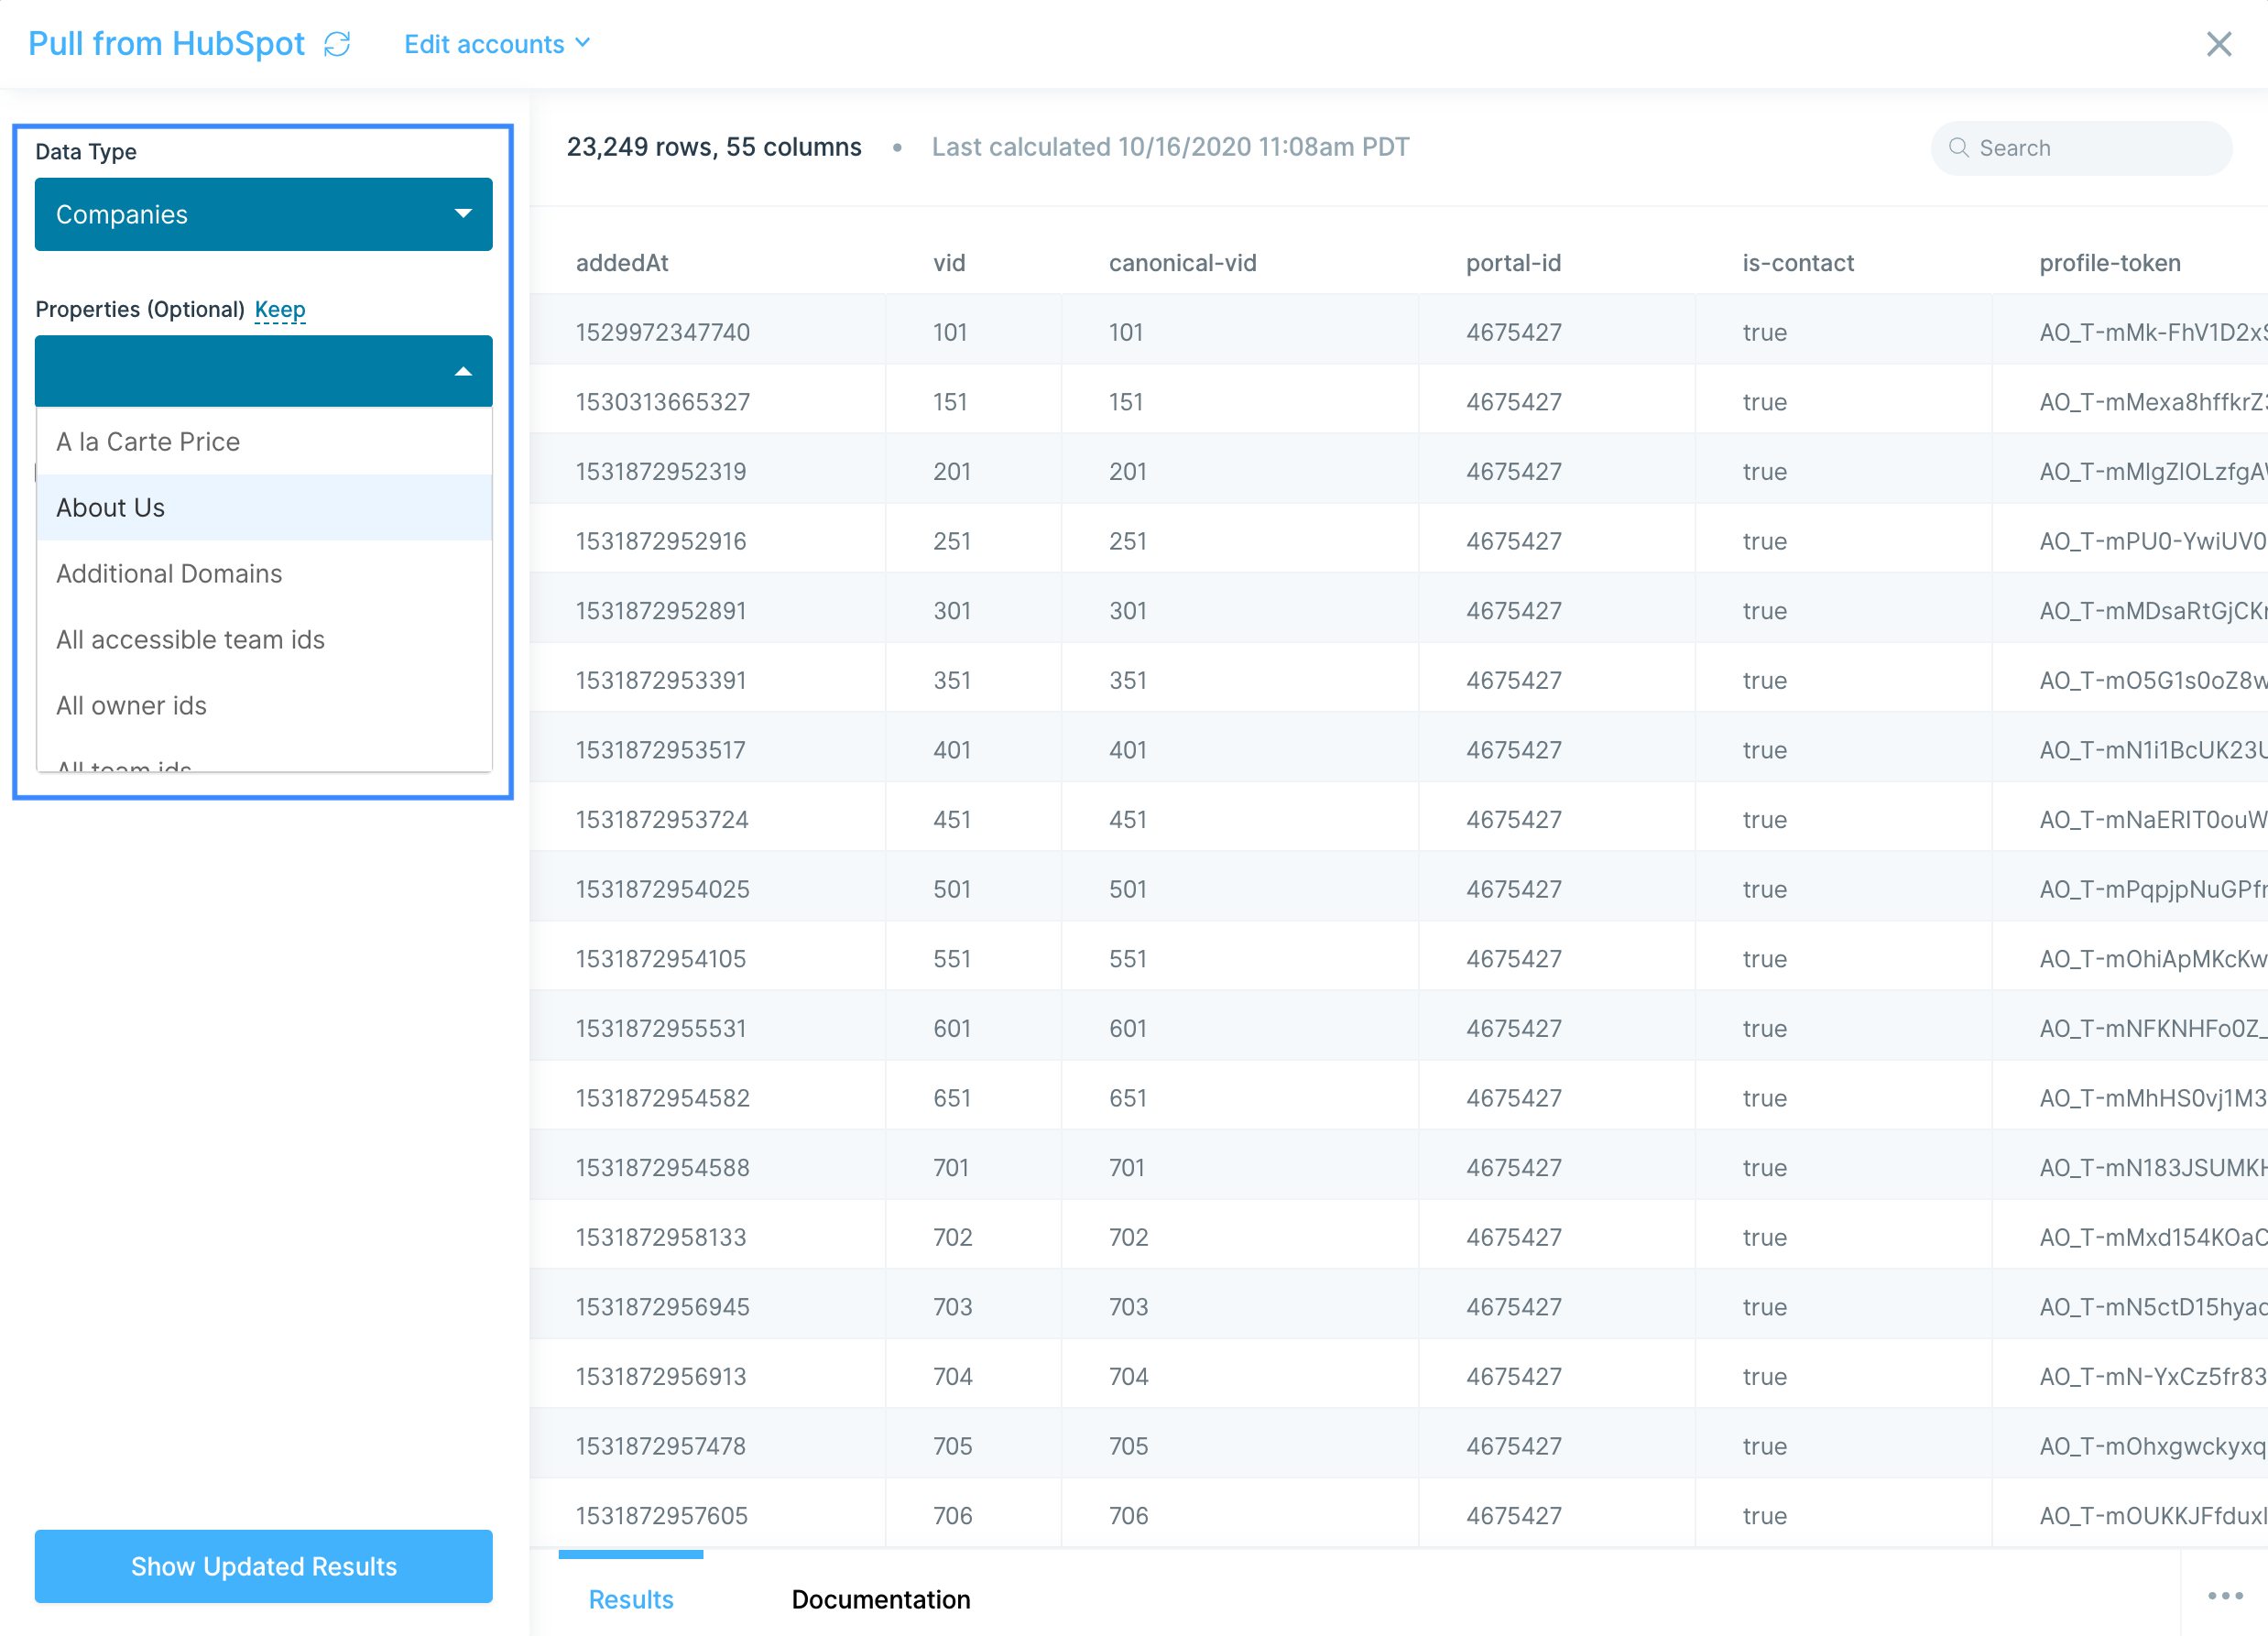
With the Contacts, Companies, and Deals datasets, you can also include historical data for all properties. This setting is not available for Engagements.
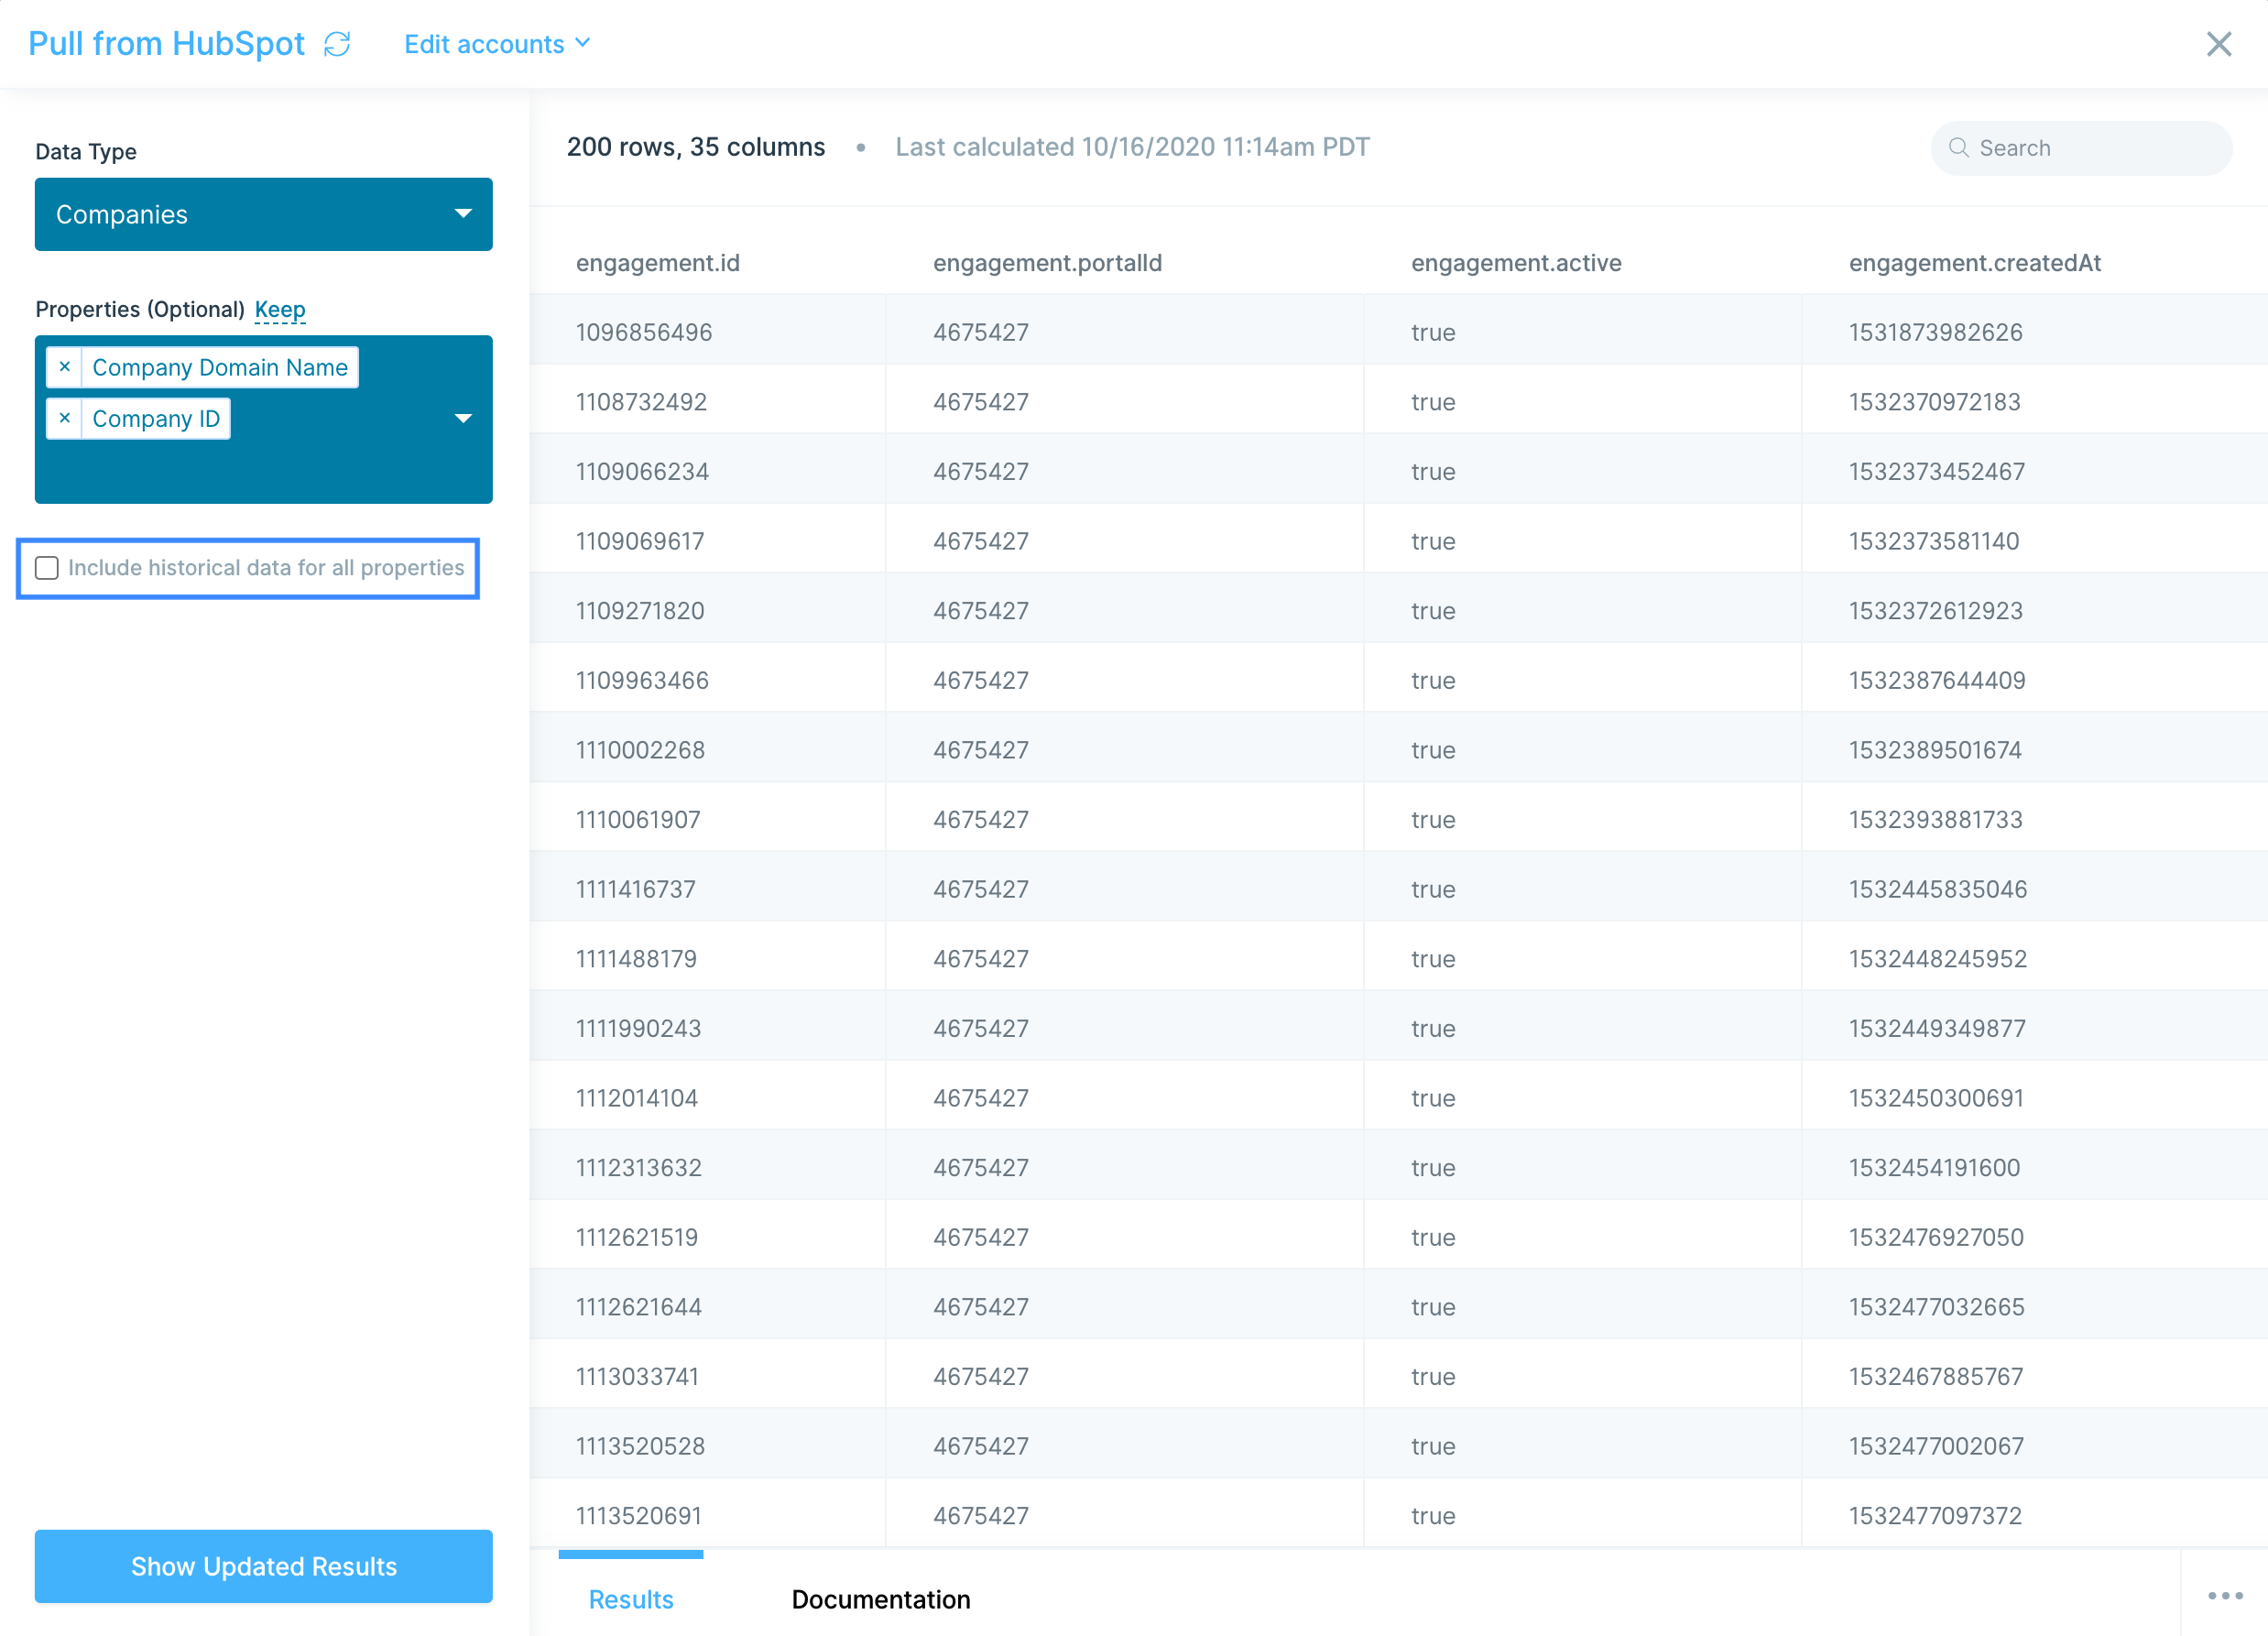
Helpful tips
- This step will only pull in the default fields. If you need a more custom pull, try using the Pull from an API step and connecting directly to HubSpot's API.
Use the Send to HubSpot step to send Contacts, Companies, and Deals data to your HubSpot CRM.
Connect your HubSpot account
To connect your HubSpot account, click Authorize.
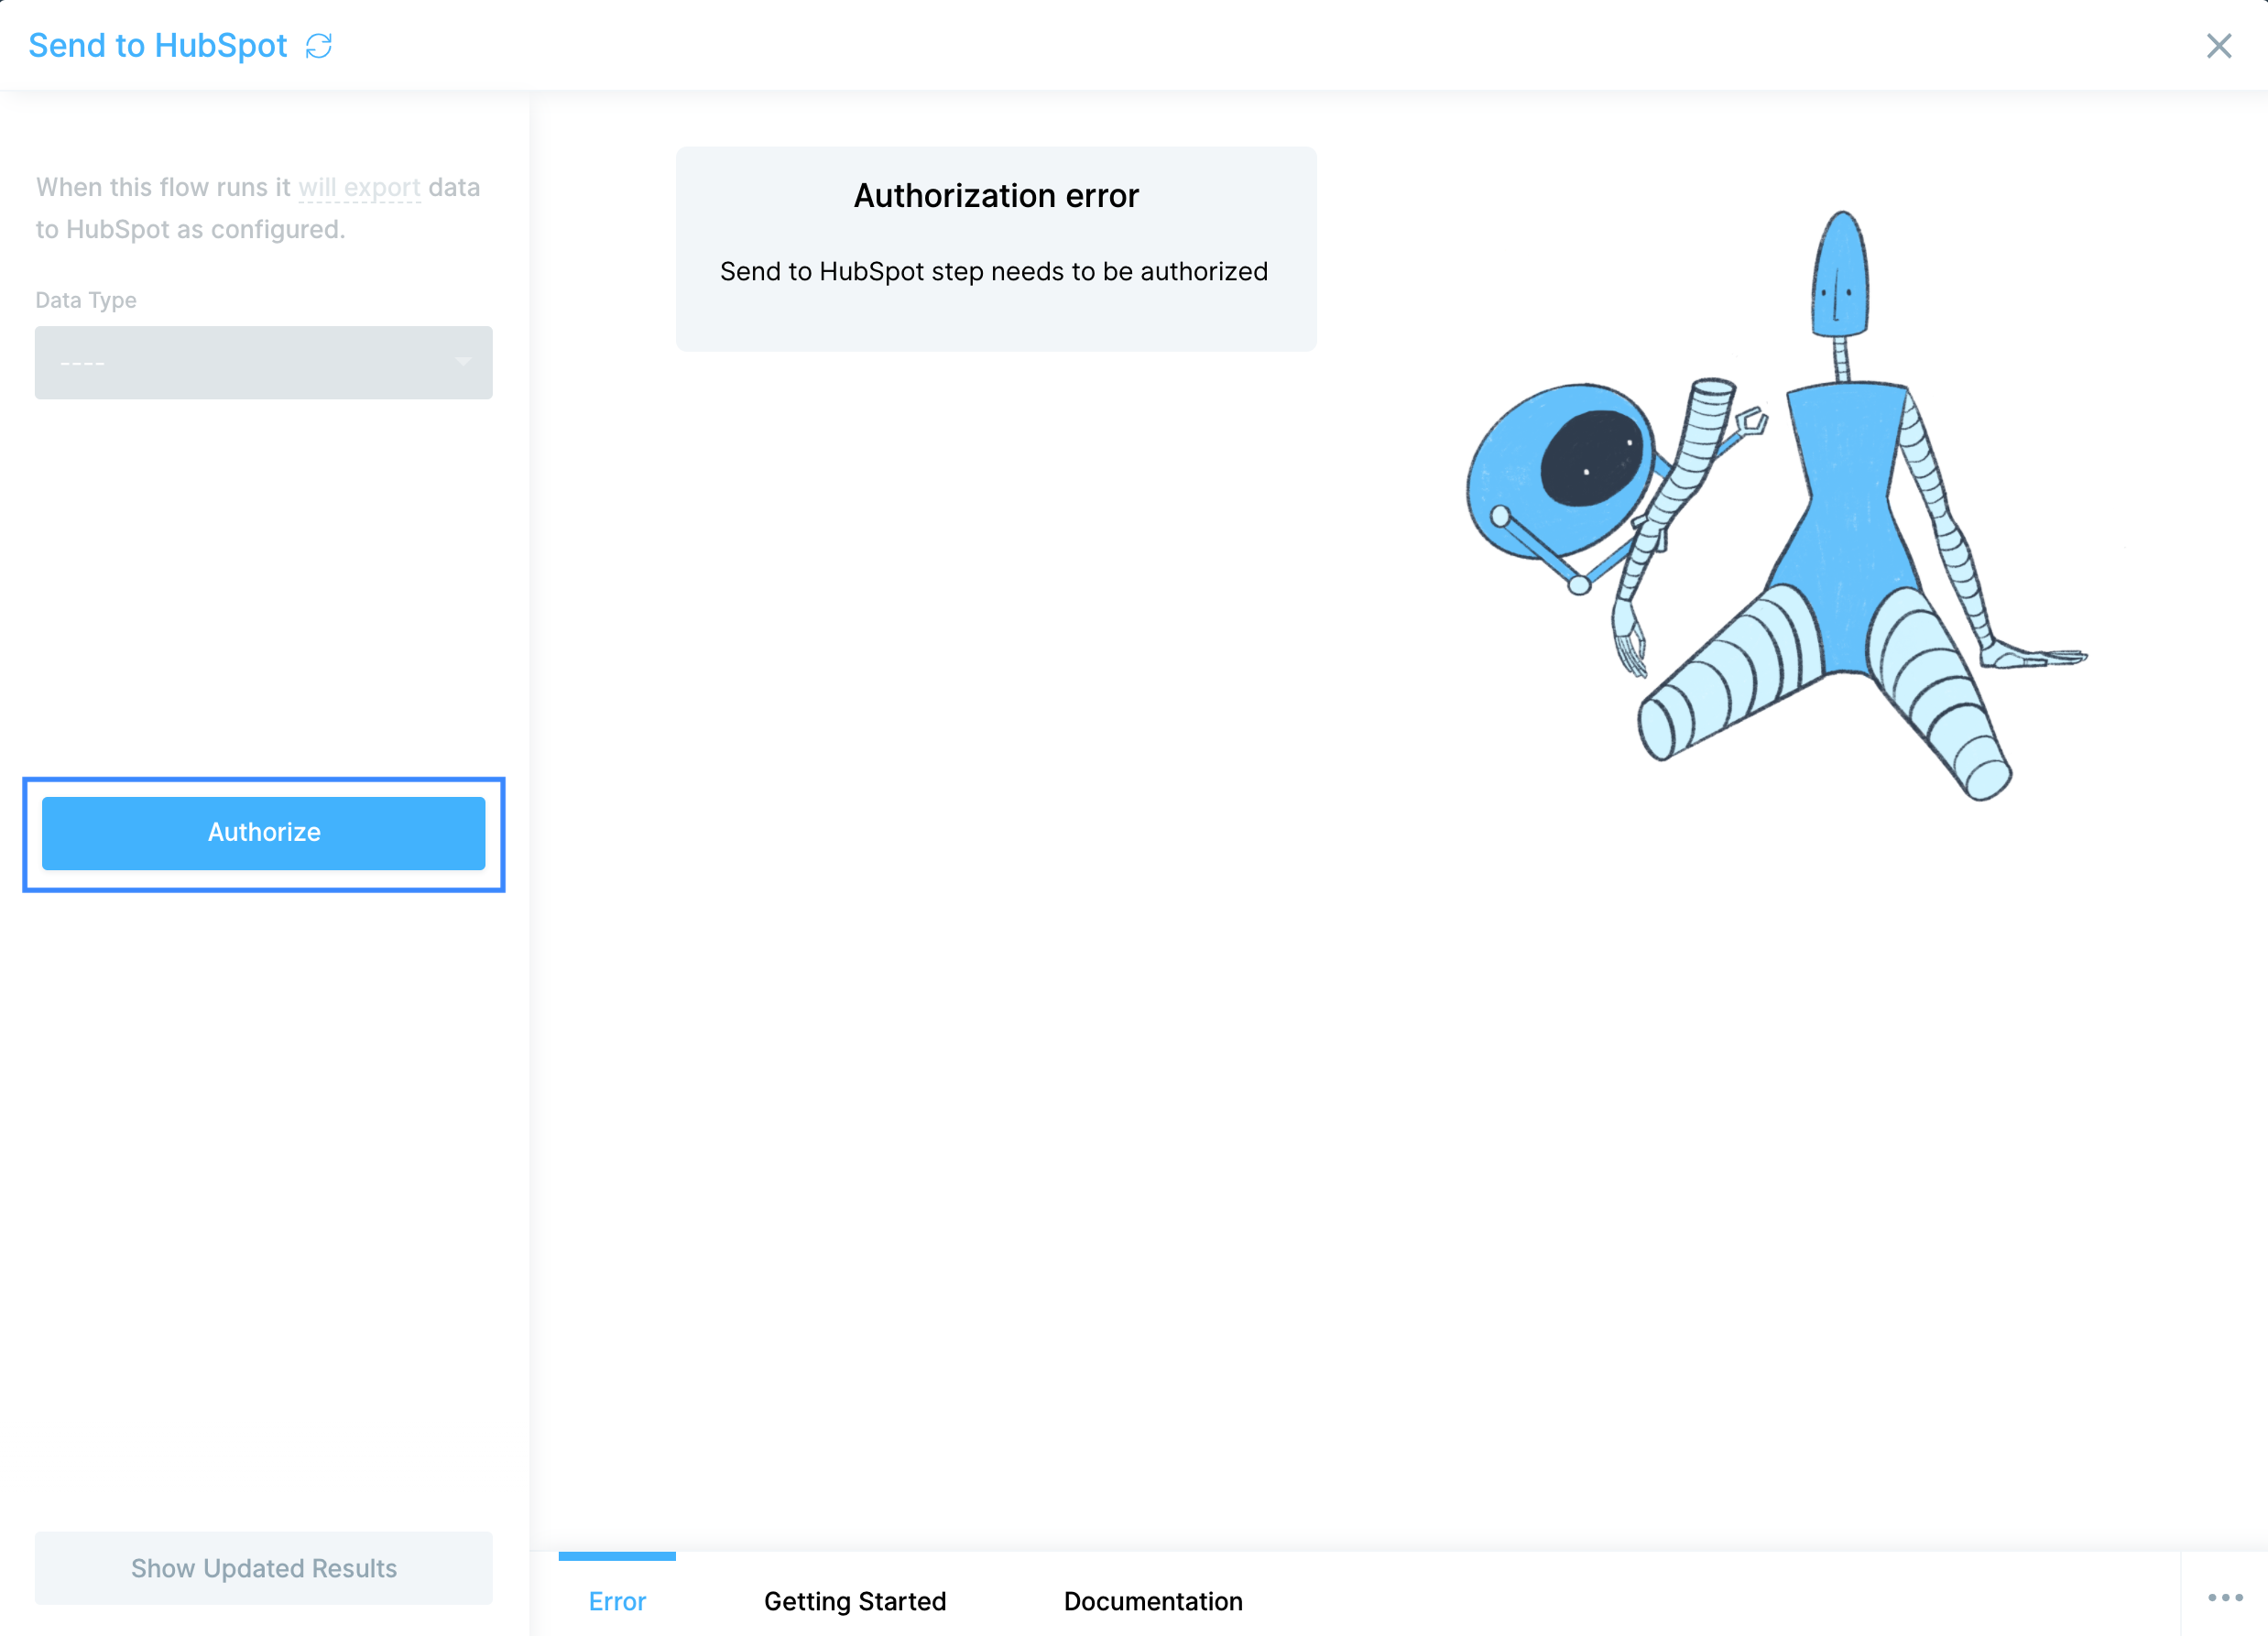
Custom settings
Select the Data Type you're looking to update in HubSpot.
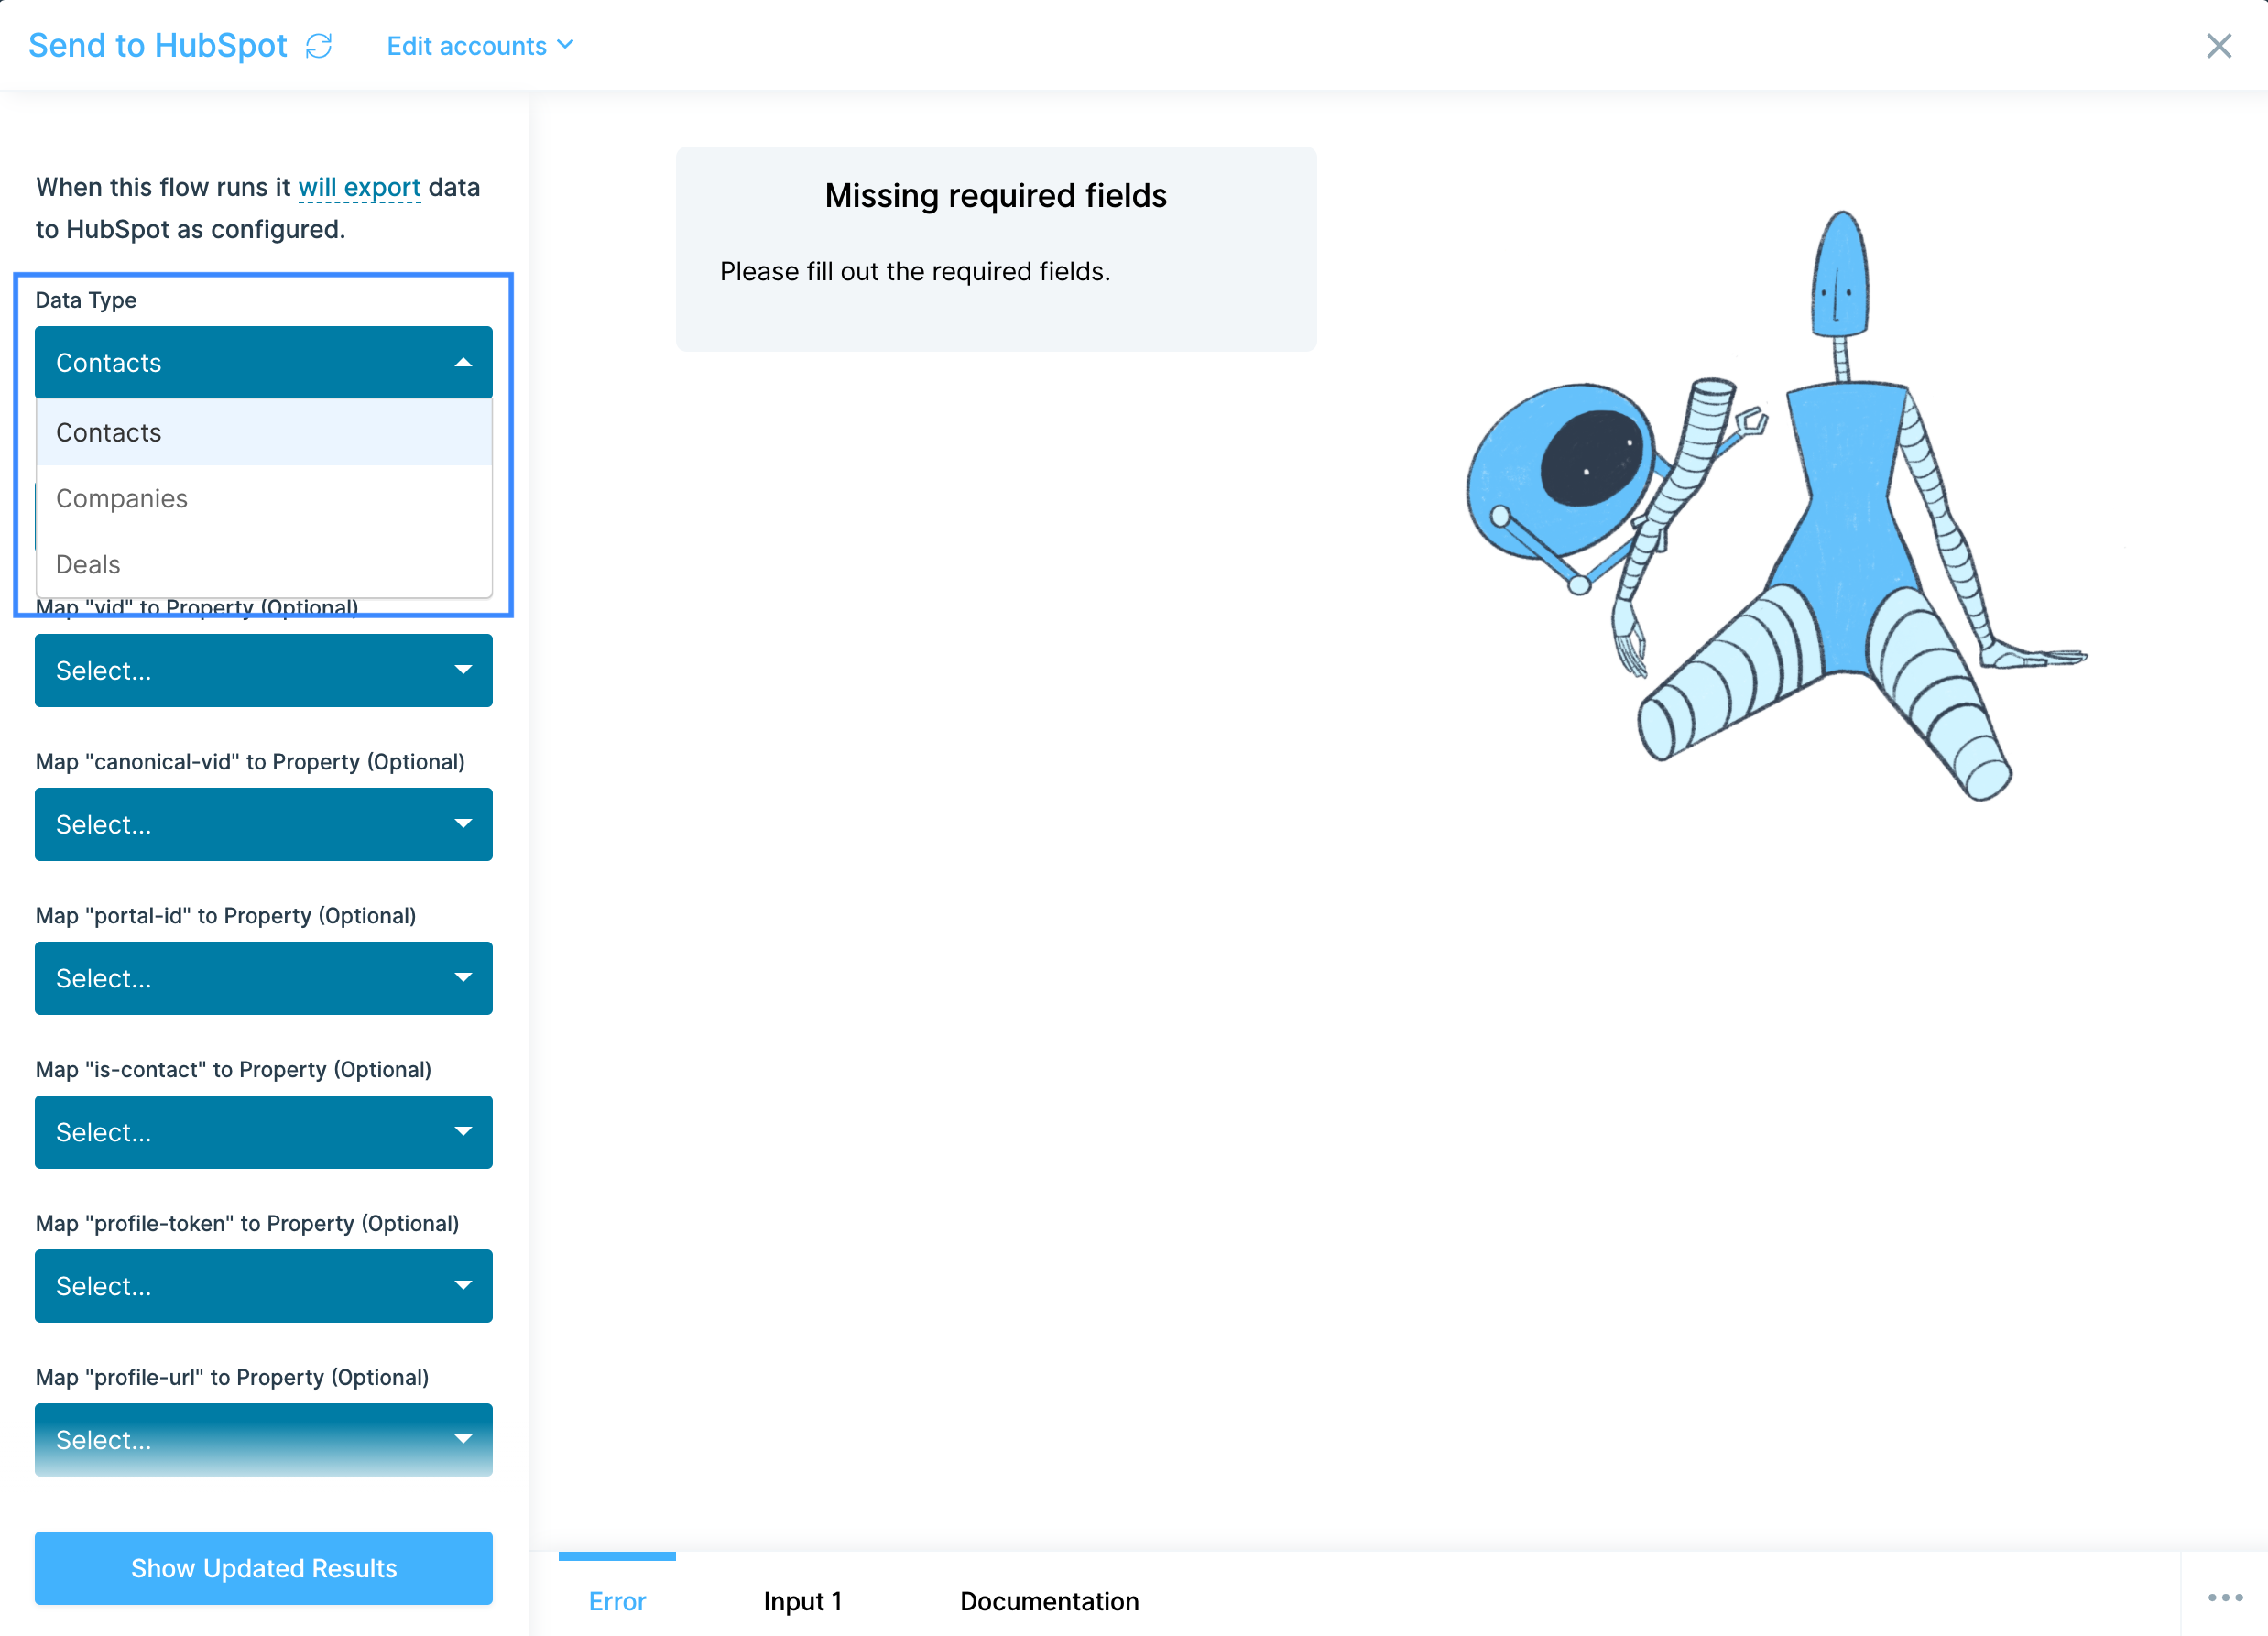
All Data Types must include a column that maps to an ID. For Contacts, you may use the "Email" column as a unique identifier. For Companies, only a "companyId" property will suffice.
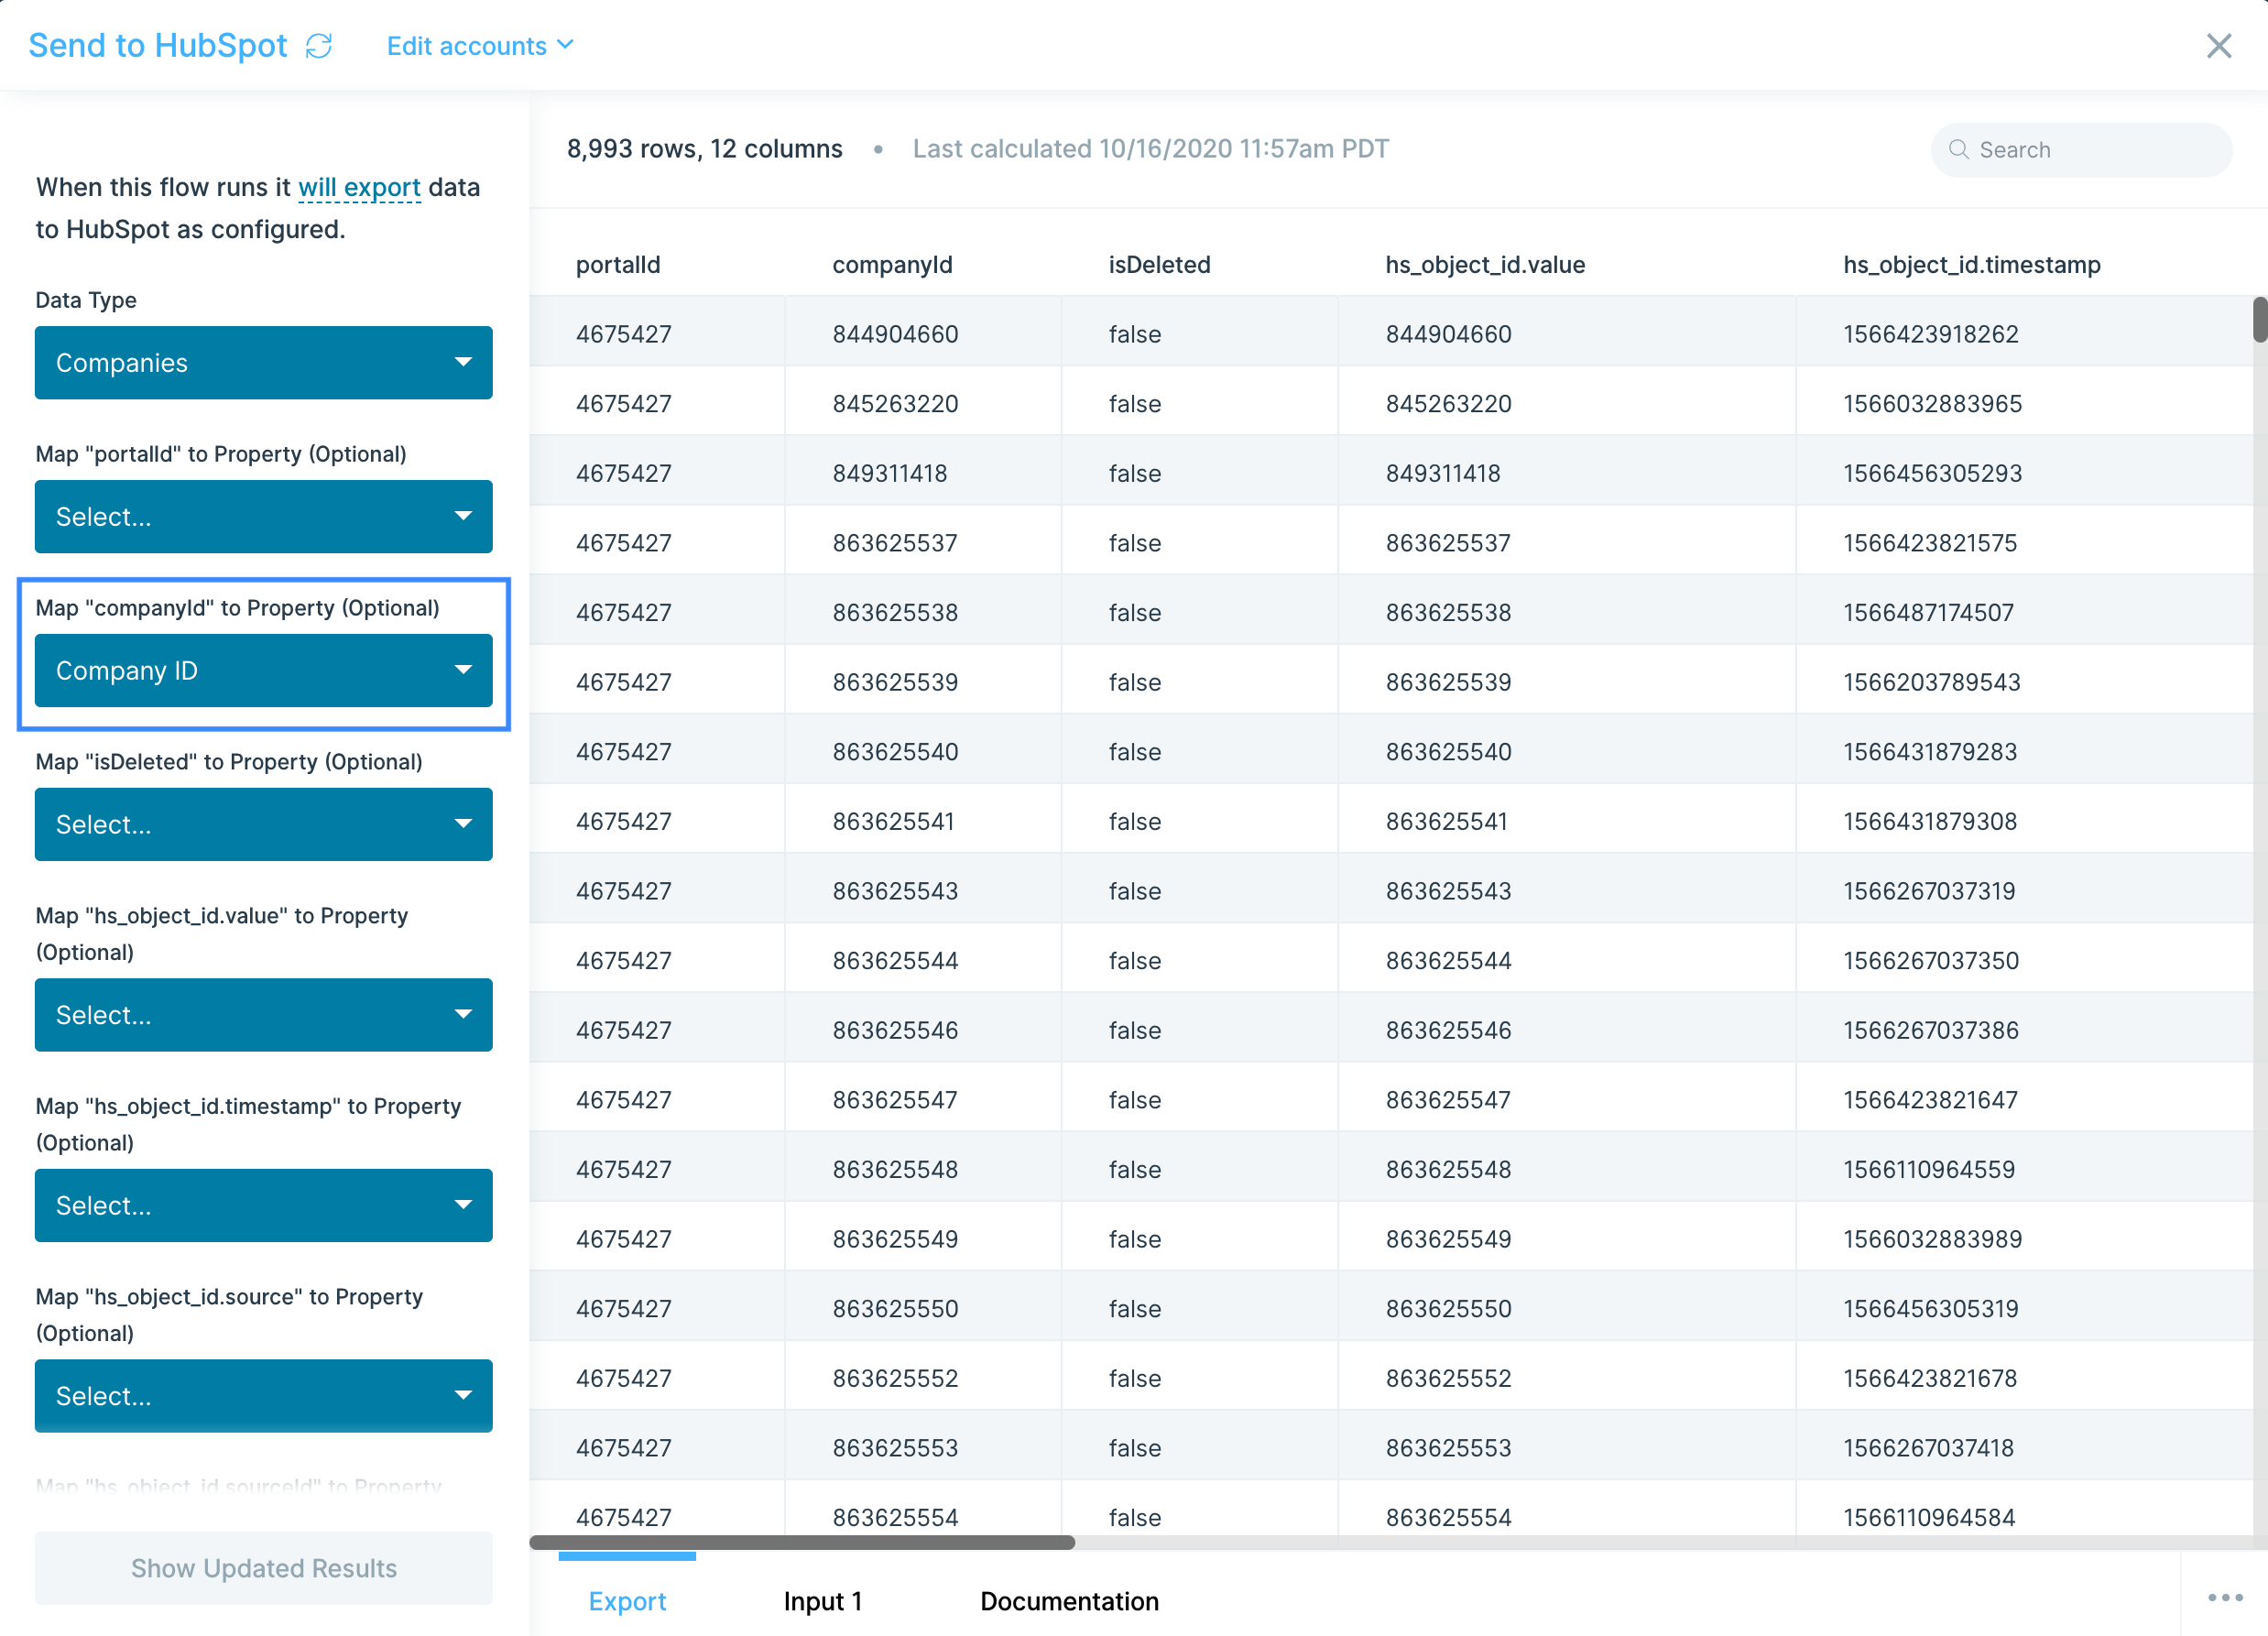
Similarly, for Deals, a "deal ID" will be required to correctly map your data to HubSpot's data.
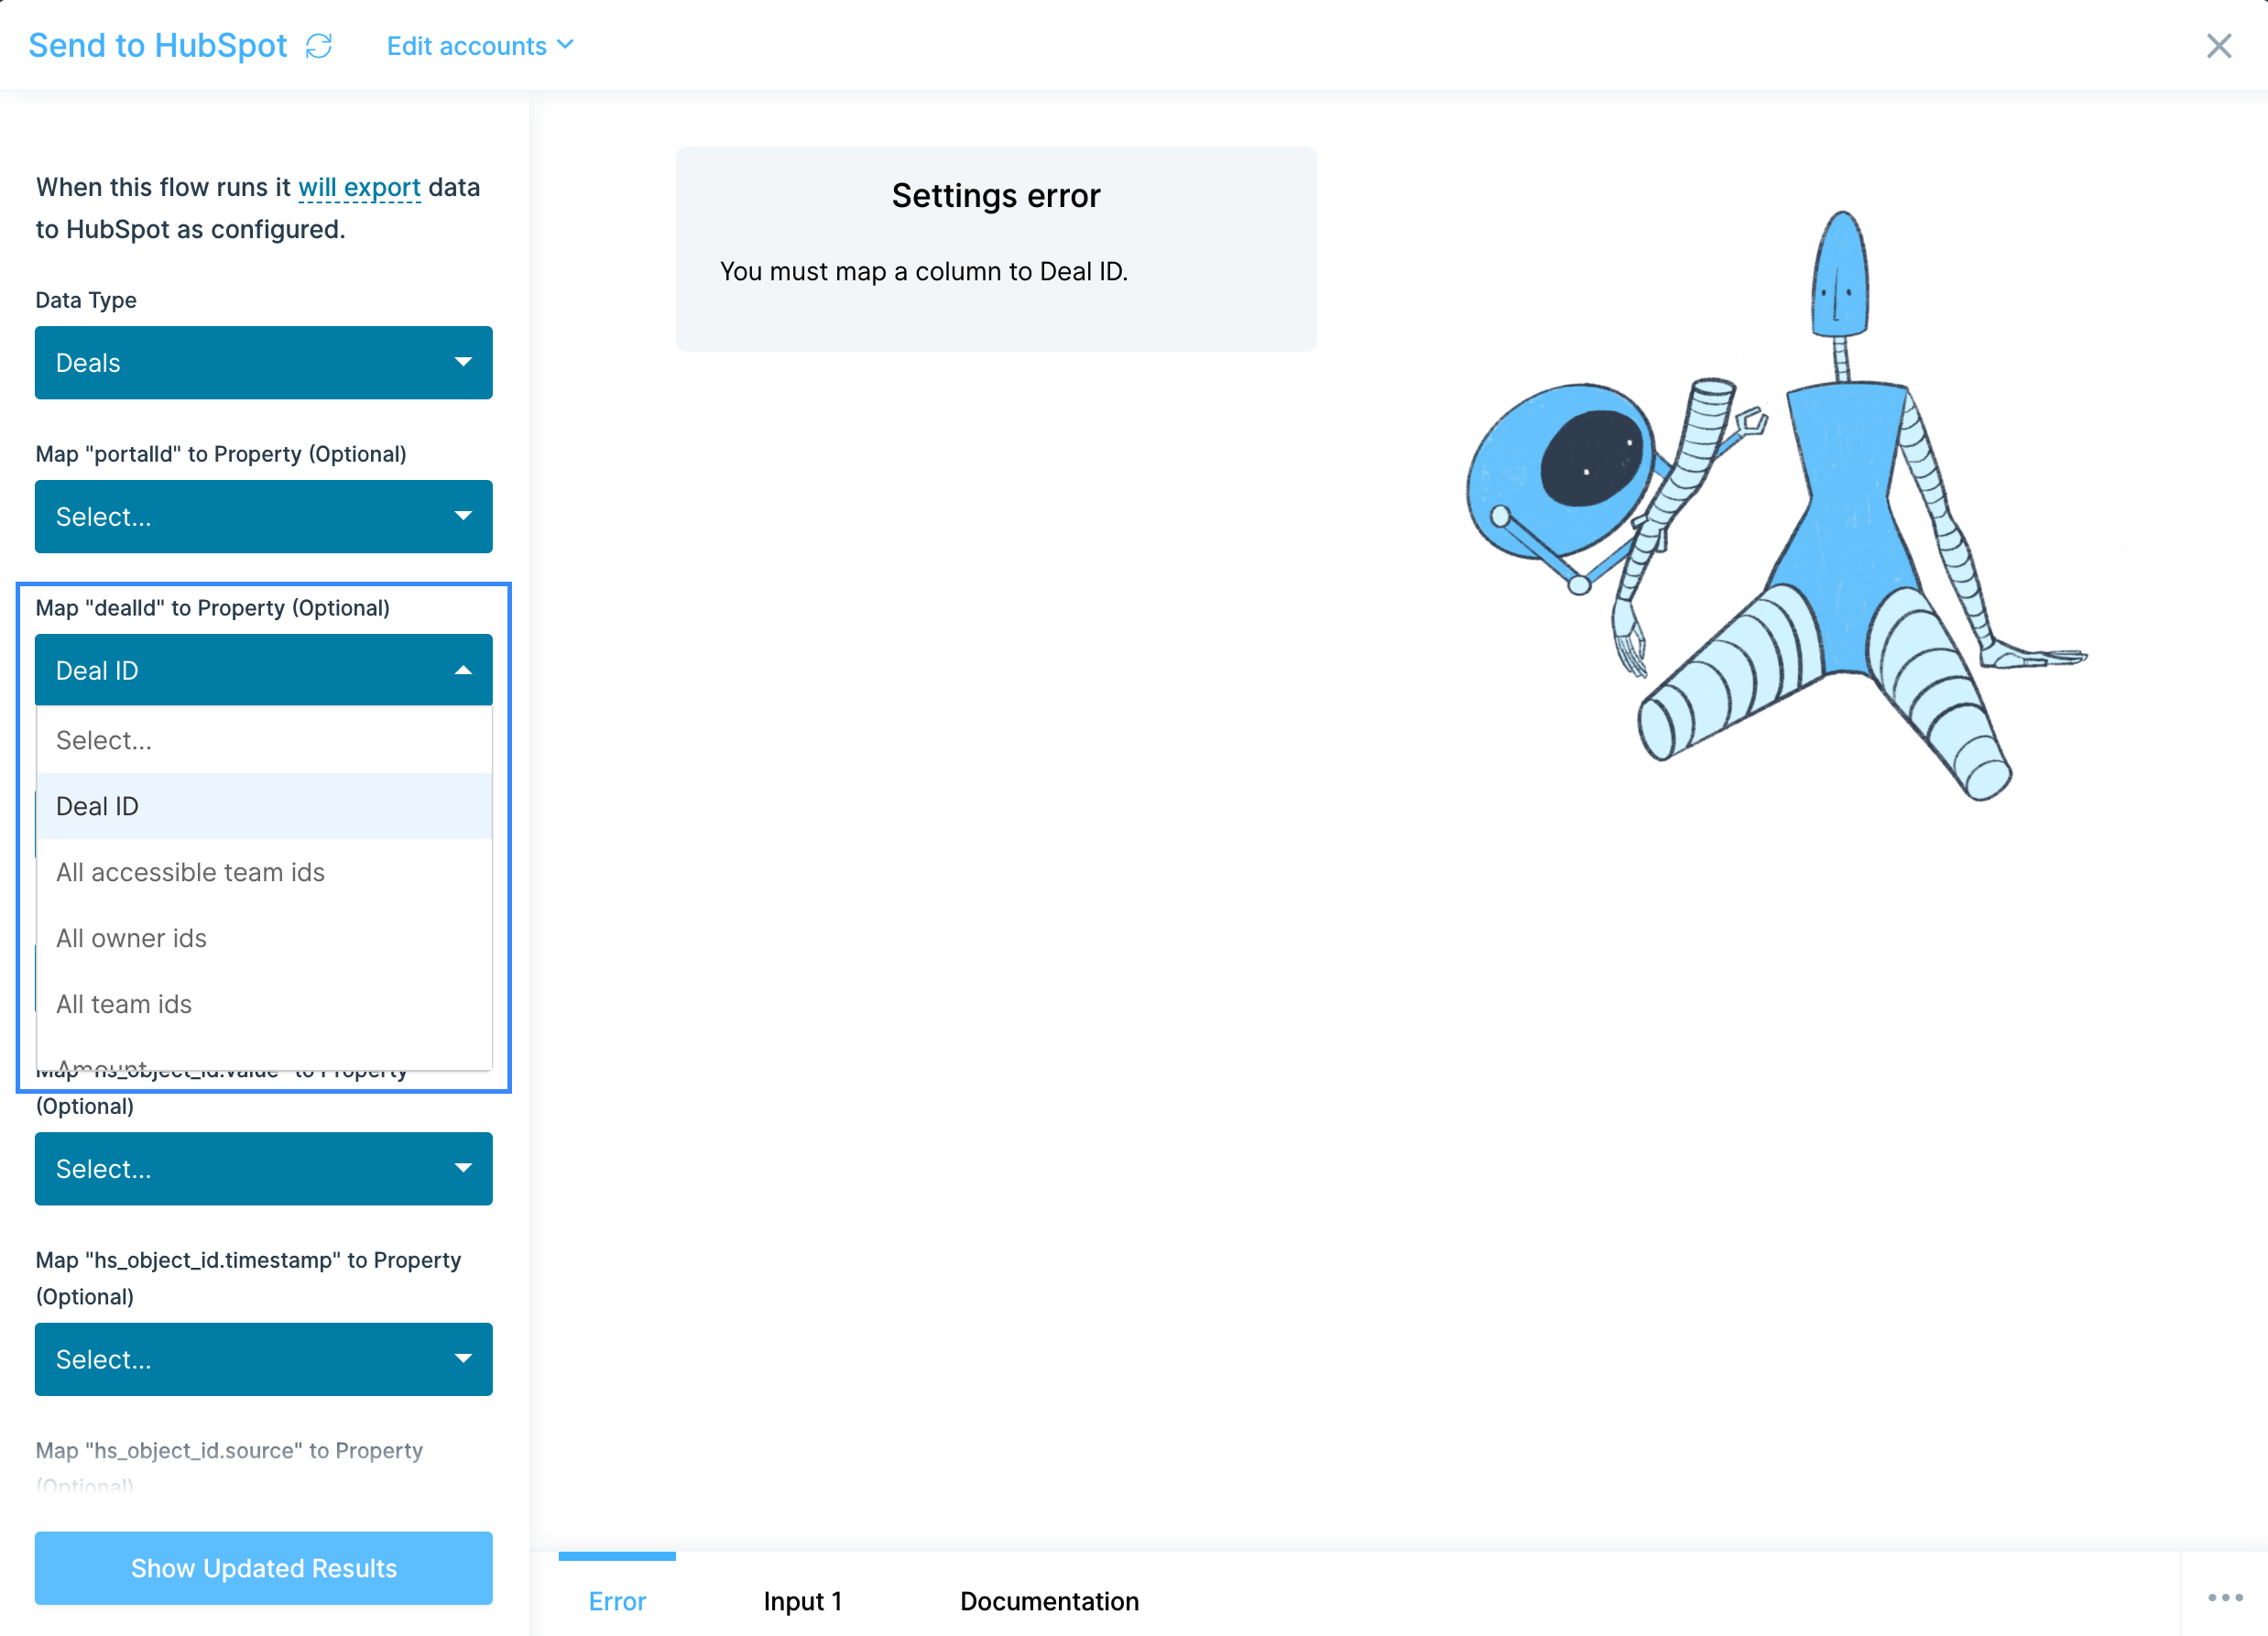
Additionally, in order to send your data successfully to HubSpot, you will need to map every column of your dataset to a property that exists in HubSpot. If there are columns you do not want to be sent to HubSpot, try using our Select columns step to remove them prior to connecting to this Send to HubSpot step.
All other properties not mapped to your data's columns are optional.
Helpful tips
- If the Send to HubSpot step fails, it will not provide you with an error. Please contact us if you are experiencing errors.
- If you need additional customization, try using the Send to an API step and connecting directly to HubSpot's API.
Integration:
InfoPlus
How to authenticate
InfoPlus uses API Key authentication. You'll need both an API key and your InfoPlus subdomain to connect.
- Get your credentials in InfoPlus
- In your InfoPlus account, press the period (dot) key on your keyboard. From the Quick Actions menu that appears, select User table.
- Locate the user record you want to create an API key for.
- In the API Key column, click the number button next to that user.
- From the dropdown menu, click Create API Key.
- A popup window will display your API key. Copy it immediately and save it somewhere safe; this is your only opportunity to record the key.
- Note your InfoPlus subdomain from your account URL (e.g., if your URL is mycompany.infopluswms.com, your subdomain is mycompany)
- Connect in Parabola
- In your flow, add a Pull from InfoPlus step.
- Click Authorize and enter your API key when prompted.
- Remember to add your subdomain and select the InfoPlus resource you want to pull (Orders, Inventory, Shipments, etc.).
Available data
Parabola can pull a wide range of InfoPlus records to support warehouse operations and fulfillment workflows. Here's what you can access:
- Orders: Complete order records with customer information, shipping and billing addresses, order lines (SKUs, quantities, pricing), order status, dates (order date, ship date, need-by date), carrier assignments, warehouse assignments, fulfillment status, SLA tracking, and custom fields
- Shipments: Shipment tracking and delivery data including tracking numbers, carrier information, shipping costs (charged, published, retail amounts), weights and dimensions, delivery dates and status, carton details, associated order numbers, residential delivery indicators, and freight zones
- Inventory Details: Granular inventory records by location including SKUs, quantities (on-hand, available, damaged, allocated, in-fulfillment), warehouse locations, lot numbers, production lots, PO numbers, expiration dates, receipt dates, case/pallet/inner pack counts, and custom fields
- Items (Products): Product master data with SKU details, descriptions, UPCs and barcodes, dimensions and weights, pricing information, vendor details, product codes and categories, inventory status by warehouse, alcohol-specific attributes, hazmat indicators, lot control settings, and custom fields
- Carriers: Carrier reference data including carrier identifiers, names, and SCAC codes for shipping and logistics operations
- Vendors: Vendor and supplier records with contact information, addresses, payment terms, lead times, FOB terms, product associations, and custom fields
Common use cases
- Reconcile orders across platforms such as Shopify, Amazon, or ERP records to identify missing orders, status mismatches, or fulfillment discrepancies before they impact customers.
- Monitor fulfillment SLAs from creation through shipment by combining order dates with ship dates and delivery windows, then flag orders at risk of missing SLA commitments to trigger proactive interventions.
- Audit shipping costs to validate freight charges, identify overcharges or billing errors, and analyze carrier performance across zones and service levels.
- Automate low-stock alerts via Slack or email notifications when stock falls below reorder thresholds, enabling faster replenishment and preventing stockouts
- Generate fulfillment dashboards with orders, shipments, and inventory data to create operational dashboards showing pick/pack velocity, order status distribution, warehouse utilization, and fulfillment accuracy
Tips for using Parabola with InfoPlus
- Schedule flows strategically to run hourly during peak fulfillment windows to monitor real-time performance, run nightly for inventory reconciliation and financial rollups, or run weekly for performance reporting.
- Use filters or sync incrementally to pull only recent or updated records, avoiding unnecessary reprocessing of historical data.
- Standardize key fields like Order No, SKU, and Warehouse ID at the top of your flow so downstream joins to Shopify, NetSuite, or carrier data stay consistent and reliable.
- Combine multiple sources with InfoPlus to create complete order-to-delivery views, or merge inventory data with purchase orders and receipts to track inventory flow from supplier to warehouse.
- Archive historical data to a data warehouse, Google Sheets archive, or Parabola table on a regular cadence so you can analyze trends, audit changes, and track performance over time without repeatedly querying the API.
That's it! Once connected, you can pull InfoPlus data into Parabola and combine it with your other systems to automate the workflows that keep your fulfillment operations running smoothly.
Integration:
Jira
How to authenticate
Jira offers two authentication methods to connect with Parabola. Choose the method that best fits your organization's security requirements.
Option 1: Basic Authentication (Recommended for simplicity)
- Log in to your Atlassian account at https://id.atlassian.com/manage-profile/security
- Navigate to Security → API tokens
- Click Create API token and give it a descriptive name
- Copy the generated token and store it securely (you'll only see it once)
- In Parabola, add a Pull from Jira step
- Click Authenticate and select Basic Auth
- Enter your Atlassian account email address as the username
- Paste your API token as the password
Option 2: OAuth 2.0 (For enhanced security)
- Go to the Atlassian Developer Console at https://developer.atlassian.com/console/myapps/
- Create a new OAuth 2.0 integration or select an existing one
- Note your Client ID and Client Secret
- Set the callback URL to:
https://parabola.io/api/steps/generic_api/callback - Configure the required OAuth scopes for your use case (e.g.,
read:jira-work,read:jira-user) - In Parabola, add a Pull from Jira step
- Click Authenticate and select OAuth 2.0
- Enter your Client ID and Client Secret
- Complete the OAuth authorization flow when prompted
Available data
Using the Jira integration in Parabola, you can bring in:
- Issues: Comprehensive issue details including summary, description, status, priority, assignee, reporter, dates, custom fields, comments, attachments, and work logs
- Issue search results: Flexible JQL-based queries to retrieve filtered sets of issues with customizable field selection and pagination
- Issue transitions: Available workflow transitions for issues and their associated screens and fields
- Projects: Project metadata including name, key, lead, description, issue types, components, versions, and project categories
- Project versions: Release versions with details on release dates, descriptions, archived status, and issue counts by status
- Users: User account information including display names, email addresses (subject to privacy settings), account IDs, active status, and avatar URLs
- Fields: System and custom field definitions with their schemas, allowed values, and configuration details
Common use cases
- Sprint and release reporting: Track issue completion rates, velocity metrics, and release progress by pulling issues filtered by sprint, version, or time period into automated dashboards
- Cross-system issue reconciliation: Combine Jira issue data with external systems like Zendesk, Salesforce, or internal databases to match customer tickets with engineering work and create unified views
- Team capacity and workload analysis: Pull assignee and issue status data to calculate team utilization, identify bottlenecks, and balance workload distribution across team members
- SLA compliance monitoring: Track time-to-resolution metrics by combining issue creation dates, status transitions, and resolution timestamps to ensure service level agreements are met
- Automated status updates: Query Jira for issues meeting specific criteria (e.g., stale tickets, overdue items) and trigger notifications via Slack or email to keep stakeholders informed
- Historical trend analysis: Extract issue data over time to analyze patterns in bug rates, feature delivery velocity, or support ticket volume for continuous improvement
Tips for using Parabola with Jira
- Use JQL for precise filtering: Leverage Jira Query Language in the search endpoint to filter issues precisely (e.g.,
project = PROJ AND status = "In Progress" AND updated >= -7d) rather than pulling all data and filtering afterward - Schedule flows to run automatically: Set your Parabola flow to refresh on a daily or hourly schedule to keep dashboards current without manual intervention
- Start with essential fields: When pulling issues, request only the fields you need (e.g.,
fields=summary,status,assignee,updated) to improve performance and reduce processing time - Combine multiple endpoints: Use separate steps to pull issues, then enrich them with user details or project information by joining on account IDs or project keys
- Leverage pagination: For large datasets, the Jira API returns results in pages—Parabola handles this automatically, but be mindful of API rate limits for very large queries
- Add alerts for anomalies: Set up Parabola alerts via Slack or email when your flow detects critical conditions, such as a spike in critical bugs or issues breaching SLA thresholds
Integration:
Jitsu
How to authenticate
- Get your API token in Jitsu
- In your Jitsu dashboard, go to API settings and generate or copy your API token.
- Connect in Parabola
- In Parabola, add a Pull from Jitsu step to the canvas.
- You’ll be prompted for a header called Authorization.
- Format matters: type the word
Token, then a space, then paste your token.- Example:
Token ofksldm9f834hgrefoids
- Example:
- Save the connection.
That’s it—Parabola will include this Authorization header on all Jitsu requests.
Available data
You can pull the following data from Jitsu into Parabola:
- Shipments: Core shipment details, customer info, pickup/dropoff addresses and windows, service level, tags, internal references, tracking code/url, timezone, workload, and computed display status. Includes flags like
asap,late,is_cancelled, and options such assignature_requiredordelivery_proof_photo_required. - Parcels (by shipment): Itemized parcel rows with dimensions, weight, type (e.g., box, tote), and client parcel IDs.
- Fees (by shipment): Delivery fee breakdowns, including base, pre-delivery, and post-delivery adjustments.
- Labels: Shipment-level labels (PDF/ZPL/PNG) and parcel-specific labels with format and type options.
- Proof of Delivery (POD): Time-stamped images and signature assets with secure URLs.
- Assignments: Driver and vehicle details tied to an assignment (driver name, phone, profile photo; vehicle make/model, color, license plate) and the set of shipment IDs on the run.
- Tracking Events (by tracking code): Time-sequenced events with signals (e.g., ASSIGNED, PICKUP_EN_ROUTE, DROPOFF_READY, DROPOFF_SUCCEEDED/FAILED), optional ETA values, next destination, driver remarks, and geo-coordinates.
Common use cases
- Consolidate live delivery statuses and ETAs to power customer notifications.
- Reconcile delivery fees (base and adjustments) against quotes or SLAs.
- Pull proof-of-delivery (photos/signatures) and attach them to order records.
- Monitor exceptions (late, failed, undeliverable) and trigger escalation workflows.
- Build a single view of shipments across warehouses/regions with tracking links.
- Analyze driver/vehicle assignment load to balance daily routes.
Tips for using Parabola with Jitsu
- Normalize timestamps: Jitsu uses ISO-8601 timestamps (UTC). Convert to your operating timezone for SLA checks and dashboards.
- Map statuses: Create a status mapping (e.g.,
DROPOFF_EN_ROUTE→ “Out for delivery”) for clearer stakeholder updates. - Store tracking links: Keep
tracking_urlwith each shipment so you can surface live tracking in emails or portals. - Automate exceptions: Filter for late/failed/undeliverable signals and send Alerts or route to a remediation queue.
- Attach POD to orders: Join shipments to POD assets (images/signatures) and push to your order system or ticketing tool.
- Schedule your flow: Run flows on a cadence (e.g., every 15 minutes during delivery windows; daily for fee reconciliation).
- Keep parcel granularity: Explode parcel arrays for accurate weight/dimension analytics and label generation.
- Document IDs: Persist
shipment_id,tracking_code, and anyinternal_idto simplify future joins and updates.
Integration:
JSON file
The Use JSON file step enables you to pull in datasets from JSON files.
Custom Settings
To get started, either drag a file into the outlined box or click on Click to upload a file.

After you upload the file, the step will automatically redirect you to the settings page with a display of your JSON blob data.

In the Advanced Settings, you can set a number of rows and a number of columns to skip when importing your data. This will skip rows from top-down and columns from left-to-right.
Helpful Tips
Security
The files you upload through this step are stored by Parabola. We store the data as a convenience, so that the next time you open the flow, the data is still loaded into it. Your data is stored securely in an Amazon S3 Bucket, and all connections are established over SSL and encrypted.
Limitations
Parabola can't pull in updates to this file from your computer automatically, so you must manually upload the file's updates if you change the original file. Formatting and formulas from a file will not be preserved. When you upload this file, all formulas are converted to their value and formatting is stripped.
Integration:
Klaviyo
How to authenticate
You will use your Klaviyo login credential to authenticate the Pull from Klaviyo step. To connect Klaviyo to Parabola:
- In your Parabola flow, add a Pull from Klaviyo step.
- Open the Authorize dropdown and click “Add klaviyo”.
- This will open a new window where you can authenticate with your Klaviyo account.
- After logging in to your account, you will be able to access your Klaviyo data in Parabola.
Available data
Using the Klaviyo integration in Parabola, you can pull in a wide range of marketing and customer data:
- Accounts: Your Klaviyo account information including account name, ID, contact details, timezone, and test account status.
- Campaigns: Email and SMS campaign details including names, subject lines, send dates, audience counts, campaign status, and associated lists or segments.
- Events: Customer behavioral data such as order placements, page views, email interactions, form submissions, and custom events tracked from your website or integrations.
- Profiles: Detailed information about customer profiles, including contact information, subscription status, custom properties, predictive analytics (CLV, churn probability), and full event history.
- Profiles for Segment: All customer profiles that belong to a specific segment, allowing you to export targeted audience lists based on your segmentation criteria.
- Campaign Values Report: Performance metrics and revenue data for your campaigns, including opens, clicks, conversions, revenue attributed, and other aggregate statistics over time.
- Flow Series Report: Time-series performance data for your automated flows, showing sends, opens, clicks, revenue, and conversion metrics across different flows and time periods.
Common use cases
- Consolidate marketing performance across channels: Pull campaign and flow metrics from Klaviyo alongside ad spend from Facebook, Google, and TikTok to create unified marketing dashboards that track ROI, attribution, and conversion rates across every channel.
- Reconcile customer data across systems: Sync Klaviyo profiles with your CRM, ERP, or data warehouse to ensure customer contact information, purchase history, and segmentation data stay consistent across all platforms.
- Automate recurring marketing reports: Schedule daily or weekly exports of campaign performance, list growth, deliverability metrics, and revenue attribution—then automatically send reports to stakeholders via email, Slack, or Google Sheets.
- Monitor list health and engagement trends: Track subscriber growth, churn rates, and engagement metrics over time. Set up alerts to flag sudden drops in open rates, spikes in unsubscribes, or deliverability issues that need immediate attention.
- Analyze cohort and retention performance: Combine Klaviyo's event and profile data with order history from Shopify or your ERP to build cohort analyses that show how different customer segments behave over time—identifying your most valuable segments and highest churn risks.
- Audit campaign targeting and segmentation: Export segment membership data and compare it against order data, inventory levels, or customer service records to ensure your campaigns are reaching the right audiences and driving the intended outcomes.
Tips for using Parabola with Klaviyo
- Schedule your flow to match your reporting cadence. For daily performance dashboards, run your flow every morning. For weekly marketing reviews, schedule it to run Monday mornings so reports are ready for team meetings.
- Filter and limit your data pulls strategically. Use date filters to pull only recent campaigns or events—this keeps your flows fast and avoids reprocessing historical data unnecessarily.
- Combine Klaviyo data with other sources for complete visibility. Join Klaviyo profiles with Shopify orders, NetSuite records, or fulfillment data from your 3PL to create unified views of customer behavior, campaign performance, and business impact.
- Use Alerts to catch issues early. Set up notifications in Parabola to flag when deliverability rates drop, when high-value segments shrink, or when key campaigns underperform—so you can take action before small issues become big problems.
- Leverage predictive analytics fields. Klaviyo's predictive properties (like churn probability, predicted CLV, and expected next order date) can be pulled into Parabola and used to trigger proactive workflows—like flagging at-risk customers for win-back campaigns or identifying high-value prospects for VIP treatment.
- Export enriched data back to your stack. After transforming and enriching your Klaviyo data in Parabola, push it to Google Sheets for team visibility, update records in your CRM, or sync it to your data warehouse for long-term analysis and reporting.
With Parabola and Klaviyo connected, you can automate the workflows that keep your marketing operations running smoothly—turning marketing data into actionable insights without the manual exports, spreadsheets, or engineering requests.
Integration:
Logiwa
Integration:
Looker
Use the Pull from Looker step to run Looks and pull in that data from Looker.
Connect your Looker account
To connect to Looker, you’ll need to enter your Looker Client ID and your Looker API Host URL before authenticating:
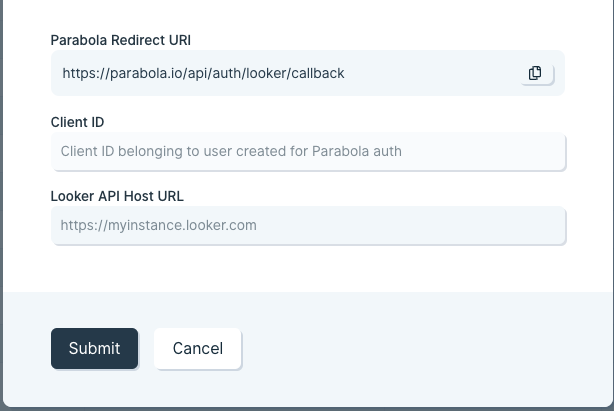
Finding your Client ID and Looker API Host URL
These steps only need to be followed once per Looker instance! If someone else on your team has done this, you can use the same Client ID that they have set up.
Your Looker permissions in Parabola will match the permissions of your connected Looker account. So you will only be able to view Looks that your connected Looker account can access.
- Create a new user in Looker dedicated to authenticating with Parabola. You can skip this step if you are going to use an existing user.
- The user will need to have User or Admin permissions in Looker in order to be able to find Looks and run them.
- Click on the Edit button next to the user entry and click on Edit Keys next to the API3 Keys header to generate credentials.
- Copy the Client ID, and go to the API Explorer in the Applications section of your Looker sidebar.
- In the API Explorer, search for the Register OAuth App API call, click on it, and then click Run it.
- In the API call run section, paste your Client ID in the first field, then set "redirect_uri" to the Parabola Redirect URI from this screen and “enabled” to true. It should look like this:
{
"redirect_uri": "https://parabola.io/api/auth/looker/callback", "display_name": "Parabola OAuth Connection",
"description": "",
"enabled": true,
"group_id": ""
} - Run the call, and it should return a 200 OK response.
- Paste your Client ID into the modal in Parabola.
- Find and paste your Looker API Host URL into Parabola. This is usually the base URL that you see when accessing Looker, such as: https://company.cloud.looker.com
- Click Submit and you will see a modal that will ask you to login to your Looker account and authenticate the connection the Parabola.
Custom settings
Once your step is set up, you can choose the Look that you want to run from the Run this Look dropdown:
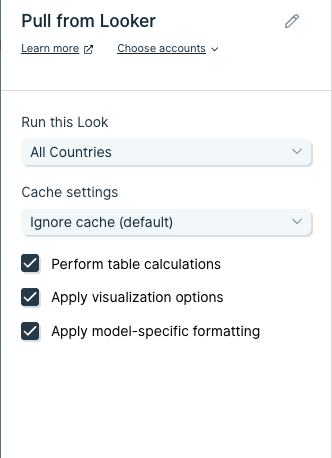
There are also Cache settings that you can adjust:
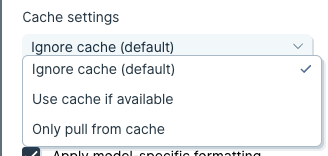
- Ignore cache (default) - Ignores the cache that Looker has and asks for new data every time.
- Use cache if available - Looker checks if the cache is recent enough and runs the Look if the data seems stale, otherwise it returns data from the Looker cache.
- Only pull from cache - Looker only gives data back from their cache even if the data is out of date.
There are also additional settings that you can adjust within the step:
Perform table calculations: Some columns in Looker are generated from user-entered Excel-like formulas. Those calculations are not run by default in the API, but are run by default within Looker. This setting tells Looker to run those calculations.
Apply visualization options: Enable if you want things like the column names to match the names given in the Look, as opposed to the actual names of the columns in the source data.
Apply model-specific formatting: Requests the data in a way that respects any formatting rules applied to the data model. This can be things like date and time formats.
Common issues and how to troubleshoot
You may sometimes see a 404 error from the Pull from Looker step. Some common reasons for that error are:
- The Look may not exist in the Production environment and needs to be pushed to production.
- The authenticated user may not have the right permissions to run the Look and needs to get access in Looker.
- The Look may have been deleted.
Integration:
Loop Returns
How to authenticate
Loop Returns uses API Key authentication for secure access.
- Generate your API key in Loop Returns:
- Log into your Loop Returns admin dashboard at https://admin.loopreturns.com
- Navigate to Returns Management > Tools & integrations > Developer Tools
- In the API keys section, click Generate API key
- Give your key a descriptive name (e.g., "Parabola Integration")
- Select the required scope: Returns (this is required to access return data)
- Copy your API key and store it securely
- Connect in Parabola:
- In your Parabola flow, add a Pull from Loop Returns step
- Click Authorize and paste your API key when prompted
Available data
Using the Loop Returns integration in Parabola, you can pull comprehensive return and shipping data:
- Detailed Returns List: Full return records including order information, customer details, line items with product and pricing data, exchange information, refund amounts, gift card details, label tracking, return methods, addresses, timestamps, and return states. Filter by date ranges (created or updated) and return status (open, closed, cancelled, expired, or review).
- Return Details: In-depth information on a specific return by return ID, order ID, or order name. Includes complete line item details with conditions and dispositions, exchange orders, labels with carrier and tracking data, refund processing information, Shopify refund objects, and all timestamps.
- Advanced Shipping Notice (ASN): Package-level tracking data including return line items, carrier details, tracking numbers and statuses, label rates and URLs, shipping destinations, product information (SKU, barcode, title), pricing and currency, order and return references, delivery dates, return reasons and outcomes, restock status, and consolidation tracking for multi-item shipments.
Common use cases
- Reconcile returns data across Shopify, Loop, and your warehouse to ensure return statuses, refunds, and inventory adjustments are aligned across all systems.
- Monitor return rates and reasons by product or SKU to identify quality issues, sizing problems, or products with high return rates that need attention.
- Track return processing performance and carrier SLAs by analyzing time from return creation to delivery, identifying bottlenecks, and monitoring which carriers perform best.
- Generate daily or weekly returns dashboards consolidating return volumes, exchange vs. refund rates, revenue retained, and operational KPIs for finance and operations teams.
- Audit return shipping costs against carrier invoices by comparing Loop's label rates with actual carrier charges to catch billing discrepancies and overcharges.
Tips for using Parabola with Loop Returns
- Schedule your flow to run daily or hourly to keep return data current and enable real-time monitoring of return operations.
- Use date filters strategically. The Detailed Returns List defaults to the last 24 hours if no dates are provided. For historical analysis, specify both from and to dates (maximum 120-day range).
- Filter by return state to focus on specific stages including "open" for active returns, "closed" for completed returns, or "review" for returns flagged for manual inspection.
- Combine with Shopify and 3PL data to create unified return-to-fulfillment reports that track the complete lifecycle from customer return initiation through warehouse processing.
- Add alerts via email or Slack to notify operations teams when return volumes spike, high-value returns are initiated, or returns remain in "open" state beyond acceptable thresholds.
- Export summaries to Google Sheets or your BI tool for team visibility and to power executive dashboards showing return trends and operational performance.
Integration:
Mailchimp
Use the Pull from Mailchimp step to retrieve data from your Mailchimp account. You can use Parabola to pull in List and Campaign data.
Connect your Mailchimp account
To connect your Mailchimp account, click Authorize to login with your Mailchimp credentials.

Custom settings
You can retrieve two different Data Type options from Mailchimp: List and Campaign.

Once you select a data type, you'll be prompted to select your dataset, which can be either a List or a Campaign.


A List pull will provide details in columns like "Email Address", "First Name", "Last Name", and so on from your Mailchimp Audience.

A Campaign pull will provide detailed results of your email campaigns, such as the action taken and timestamp.

Integration:
Metabase
How to authenticate
Metabase uses API key authentication to securely connect with Parabola. Here's how to set it up:
1. Generate an API key in Metabase
- Log in to your Metabase instance and click the gear icon in the upper right corner
- Select Admin settings
- Go to the Settings tab
- Click on the Authentication tab in the left menu
- Scroll down to API Keys and click Manage
- Click Create API Key
- Give your API key a descriptive name (e.g., "Parabola Integration")
- Assign the key to an appropriate group that has permission to access the Questions you want to pull
- Click Create and copy the generated API key immediately—Metabase won't show it again
💡 Tip: Store your API key somewhere safe. If you lose it, you'll need to generate a new one.
2. Connect in Parabola
- In your Parabola flow, add a Pull from Metabase step
- Click Authorize when prompted
- Enter your Metabase API key in the authentication field
- Enter your Metabase instance URL (e.g., https://acmeco.metabaseapp.com for cloud instances or your self-hosted URL)
- Once authenticated, you can start pulling data from your Saved Questions
Available data
Using the Metabase integration in Parabola, you can pull in any Saved Question results. Run any Saved Question (also called Cards) in your Metabase and retrieve the full result set as tabular data. Each column from your question becomes a field in Parabola, making it easy to work with metrics, aggregations, and custom queries you've already built in Metabase.
To use a Saved Question, you'll need its Card ID—this is the number in the URL when you open the question in Metabase. For example, if your URL is https://acmeco.metabaseapp.com/question/3609-sales-report, the Card ID is 3609.
Passing parameters to Saved Questions
If your Saved Question uses variables (also called template tags), you can pass values for those parameters when pulling data into Parabola. This allows you to dynamically filter the results based on your workflow needs.
Finding your variable names in Metabase:
- Open your Saved Question in Metabase
- Click Open Editor to view the query
- Click the Variables icon (looks like {{x}}) in the sidebar
- Look at the settings for each variable to find:
- The variable name (not the display label, but the actual name used in the query—e.g., if your query uses {{customer_email}}, the variable name is "customer_email")
- The variable type (e.g., text, number, date)
Configuring parameters in Parabola:
In the Pull from Metabase step, under Request Body, you'll find a parameters section. Click Add item for each parameter you want to pass:
- target: This identifies which variable to pass the value to. It requires two parts:
- First target identifier: variable
- Second target identifier (array of two strings):
- First string: template-tag (this tells Metabase you're passing a value to a template tag variable in the SQL query)
- Second string: Your variable name from Metabase (e.g., start_date, customer_email, order_status)—use the actual variable name, not the display label
- type: The variable type from Metabase (e.g., text, number, date)
- value: The actual value you want to pass to the parameter
Examples:
For a text parameter filtering by customer email:
- target:
- First target identifier: variable
- Second target identifier: template-tag, customer_email
- type: text
- value: jane.smith@example.com
For a number parameter filtering by product ID:
- target:
- First target identifier: variable
- Second target identifier: template-tag, product_id
- type: number
- value: 789
For date parameters filtering by date range, add two items:
First parameter:
- target:
- First target identifier: variable
- Second target identifier: template-tag, start_date
- type: date
- value: 2024-01-01
Second parameter:
- target:
- First target identifier: variable
- Second target identifier: template-tag, end_date
- type: date
- value: 2024-12-31
For a text parameter filtering by order status:
- target:
- First target identifier: variable
- Second target identifier: template-tag, order_status
- type: text
- value: completed
Common use cases
- Automate recurring reports: Pull your weekly sales dashboard or monthly KPI report from Metabase, format it in Parabola, and automatically send it via email or Slack—no more manual exports.
- Combine BI data with operational systems: Merge Metabase analytics (sales performance, customer metrics) with live data from your ERP, CRM, or warehouse management system to create comprehensive operational reports.
- Cross-platform reconciliation: Pull order data from Metabase and compare it against fulfillment records from ShipBob, inventory levels from your WMS, or invoices from your accounting system to catch discrepancies automatically.
- Create custom alerting workflows: Run a Metabase question that tracks critical metrics, then use Parabola to check for threshold breaches and trigger Slack or email alerts when action is needed.
- Feed data warehouses or dashboards: Pull curated datasets from Metabase and push them to Google Sheets, data warehouses, or other BI tools for additional analysis or team visibility.
- Multi-source data pipelines: Combine insights from Metabase with data from APIs, spreadsheets, emails, and PDFs to build end-to-end automated workflows that would otherwise require hours of manual work.
Tips for using Parabola with Metabase
- Schedule your flows to run automatically at the cadence your business needs—daily for operational reports, weekly for performance reviews, or hourly for time-sensitive metrics.
- Use descriptive names for your Saved Questions in Metabase so it's easy to identify which Card IDs to pull when building flows in Parabola.
- Set up proper permissions in Metabase by assigning your API key to a group that has access to exactly the questions you need—this keeps your data secure while enabling automation.
- Combine multiple Questions in a single flow by pulling from several Metabase Cards, then use Parabola's join and merge steps to create unified reports that span different data sources.
- Add data quality checks in Parabola after pulling from Metabase—use filters and formulas to flag unexpected values, missing data, or anomalies before pushing results downstream.
- Cache reference data by pulling relatively static Metabase queries (like product catalogs or customer lists) into a separate flow, then import that data into other flows to speed up execution.
- Document your Card IDs by keeping a simple reference list (in a Google Sheet or internal doc) that maps business-friendly names to Metabase Card IDs—this makes it easier for teammates to build and maintain flows.
With Metabase connected to Parabola, you can automate the reports and workflows that used to eat up your day, freeing your team to focus on analysis and action instead of manual data wrangling.
Integration:
Microsoft Dynamics Finance
Microsoft Dynamics Finance, also called D365 or Finance & Operations, is an enterprise resource planning (ERP) system used to manage financials, supply chain operations, and business performance. Use this step to connect your Parabola flow directly to your Dynamics Finance data and bring in key entities like customers, vendors, journals, and transactions.
Setup
Before using this step, you’ll need:
- A Microsoft Dynamics Finance account.
- Your Dynamics Finance instance URL (for example:
https://<yourtenant>.operations.dynamics.com). This can be any valid URL from your Dynamics instance.
If you’re unsure about these values, ask your Dynamics or IT administrator for help setting this up.
Compatibility and first-time setup
The first time Parabola connects to Dynamics, the Microsoft Dynamics ERP app within your organization’s Microsoft Entra (Azure AD) will be used to establish a connection.
If the connection fails or your organization does not have this app installed, contact your IT administrator to provision it.
Older Microsoft Dynamics Finance accounts that have not migrated to Power Platform may not include this app by default. Newer Dynamics Finance accounts created within Power Platform will already have it installed.
Add the Dynamics step to your Flow
- In your Parabola flow, use the top search bar
- Type "dynamics" to find the step
- Double-click the Dynamics step icon
Authentication
When authenticating, provide Parabola with the URL for your Dynamics Finance instance. Then sign in using the Microsoft account that you use to access Dynamics Finance.
The step will inherit the same permissions that your user has within Dynamics Finance.
Configuration
After connecting your account:
- Choose which legal entity you want to pull data from.
- Then choose the data entity you’d like to retrieve.
The names of data entities shown in Parabola may not always match what you see in Dynamics Finance. If you’re unsure which entity to select, you can:
- Use the AI chat sidebar within Parabola — it can help guide you to the correct entity
- Navigate to the data you're interested in and right-click on a specific field or line item (not the whole table) - use the entity name as a starting point to search in Parabola
Reachout to Parabola Support or your IT administrator.
When pulling data from an entity for the first time, the step will default to showing 10 rows. This helps the step run quickly as you confirm you’ve selected the right entity.
Once you’ve verified the correct entity, remove or update the row limit, and add any additional filters in the settings to further narrow the data you need.
Performance Considerations
- Be mindful of pulling large amount of data from heavy-use tables during peak business hours
- Consider using test environments for development and testing
- Monitor data volumes to avoid unexpected load on Dynamics
Integration:
Microsoft OneDrive
The Pull from OneDrive step gives you the ability to pull in datasets from your Microsoft OneDrive files.
Connect your OneDrive account
To connect your OneDrive account, click Authorize to login with your Microsoft account credentials.
Selecting a file
To select the specific file you want to work with:
- Select the drive - the dropdown will show all drives that you have access to
- Search for the specific file you’re looking for - you can enter a term or paste in the entire file name. The dropdown will show all matching files
- The first matching file will automatically appear in the Results view. You can select a specific sheet, for files with multiple
File types supported
- XLS, XLSX*
- CSV (comma (,) delimiter)
- TSV (tab delimiter)
- JSON
- XML
Helpful tips
- This step pulls data in exactly as it is shown in OneDrive. Formatted dates and numbers will be pulled in and shown in their formatted state. Visual formatting, such as colors, font changes, or sizing will not show up in Parabola.
- Any changes you make to the OneDrive file will be automatically updated when you run a Flow, or manually updated if you click the refresh icon to the right of the step's name.
- *The Microsoft API has a size limit for Excel workbooks of 100 MB. Attempting to pull an Excel workbook greater than 100 MB will result in an error, and you will be prompted to reduce the size of your workbook. This does not apply to .xls file extensions, only .xlsx.
The Send to Microsoft OneDrive step gives you the ability to automate sending custom datasets to OneDrive. You can create a new file or update a file by having the dataset overwrite or append (add on) to an existing file.
Connect your OneDrive account
To connect your OneDrive account, click Authorize to login with your Microsoft account credentials.
Custom settings
First, select whether to create a new file, or update an existing file.
Create a new file:
Select the file type, and enter a file name. Then, indicate which drive the file should be saved to. Within a drive, you can either save to the root of the drive (default), or search for a specific folder to save to.
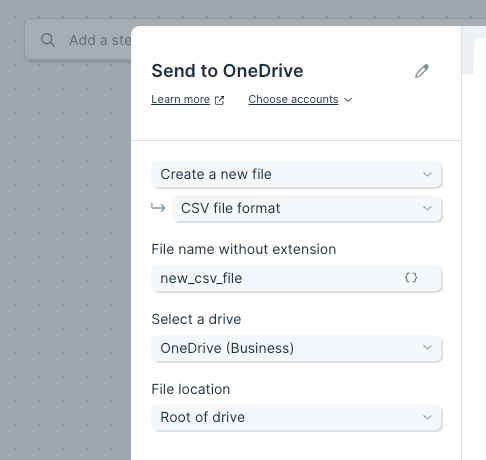
Update an existing file:
First, choose the file you want to update by selecting a drive. Then, search for the file by name.
Once your file is selected, you can decide how to update it:
- Replace entire file - all file types
- Append to bottom - Excel files only
(Note, you can specify which sheet of an Excel file to update.)
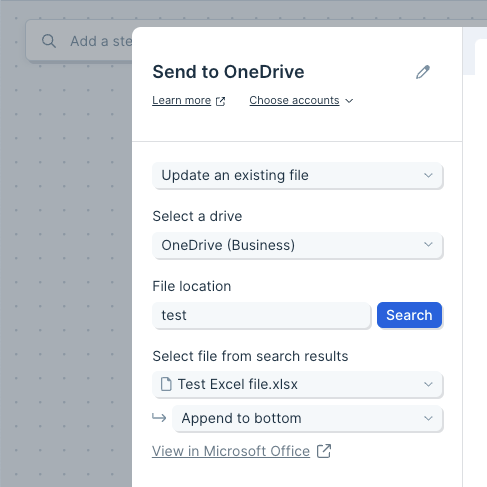
File types supported
- XLSX
- CSV (comma (,) delimiter)
- TSV (tab delimiter)
- JSON
- XML
Helpful tips
- Updates to Excel workbooks can take up to several minutes to be reflected in OneDrive.
- The Microsoft API has a size limit for Excel workbooks of 100 MB or 1,048,576 rows by 16,384 columns. (Read about other limits here.)
- If the size of the workbook you want to update already exceeds 100 MB or the max row and column limit, the API will return an error when Parabola attempts to fetch workbook metadata.
- If you are overwriting a worksheet and the data you're sending exceeds 100 MB or the max row and column limit, the Flow calculation will return an error. If you are appending to a worksheet and the data you're sending exceeds the remaining space of your workbook or will result in max row and column limit being exceeded, the Flow calculation will also return an error. In both cases you will be prompted to reduce the size of either your workbook or input data.
Integration:
Microsoft SharePoint
The Pull from SharePoint step gives you the ability to pull in datasets from your Microsoft SharePoint files.
Connect your SharePoint account
To connect your SharePoint account, click Authorize to login with your Microsoft account credentials.
Note: you may be asked to set up an authenticator app (for multi-factor authentication), or submit an authorization request to your IT administrator. This is dictated by your company’s Microsoft account settings.
Selecting a file
To select the specific file you want to work with:
- Select the site - the dropdown will show all SharePoint sites that you have access to
- Select the drive
- Search for the specific file you’re looking for - you can enter a term or paste in the entire file name. The dropdown will show all matching files
- The first matching file will automatically appear in the Results view. You can select a specific sheet, for files with multiple
File types supported
- XLS, XLSX*
- CSV (comma (,) delimiter)
- TSV (tab delimiter)
- JSON
- XML
Helpful tips
- This step pulls data in exactly as it is shown in SharePoint. Formatted dates and numbers will be pulled in and shown in their formatted state. Visual formatting, such as colors, font changes, or sizing will not show up in Parabola.
- Changes you make to the SharePoint file can take several minutes to appear in Parabola (between 10-30 minutes).
- There may be some delay between updating your SharePoint site permissions and seeing those sites available in your Parabola step.
- Updates to Excel workbooks can take up to several minutes to be reflected in SharePoint.
- *The Microsoft API has a size limit for Excel workbooks of 100 MB. Attempting to pull an Excel workbook greater than 100 MB will result in an error, and you will be prompted to reduce the size of your workbook. This does not apply to .xls file extensions, only .xlsx.
Microsoft Azure User Permission Settings
Parabola is a verified app publisher, meaning we've been verified as authentic by Microsoft. Parabola will only have access to the items in SharePoint/OneDrive that the account used to authorize Parabola has access to (that's on a per-user basis).
In order to enable a user to import data from Microsoft and/or send it to Microsoft, Parabola requests the following permissions:
- Permission to read, create, update and delete OneDrive files the signed in user has access to
- Permission to read, create, update and delete documents and list items in all SharePoint sites the signed in user has access to
- Permission to read profile of signed-in users (e.g., name, email)
- Note, the "write" permissions are for our Send to SharePoint/OneDrive steps, so that you can create or update a file.
If you see "Need admin approval" when authorizing Parabola, this means that your Microsoft Azure user consent settings are configured to require admin approval for approving any app. An IT admin on your team can check these settings in Microsoft Azure > Enterprise Applications > Consent and Permissions. If you toggle to Azure's recommended setting of only allowing members of your Microsoft org to consent apps from verified publishers, you should no longer require admin approval.
The Send to Microsoft SharePoint step gives you the ability to automate sending custom datasets to SharePoint drives. You can create a new file or update a file by having the dataset overwrite or append (add on) to an existing file.
Connect your SharePoint account
To connect your SharePoint account, click Authorize to login with your Microsoft account credentials.
Custom settings
First, select whether to create a new file, or update an existing file.
Create a new file
Select the file type, and enter a file name. Then, indicate where the file should be saved: select a site, and drive. Within a drive, you can either save to the root of the drive (default), or search for a specific folder to save to.
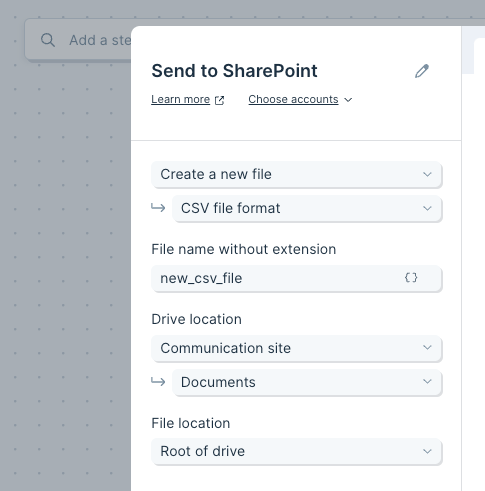
Update an existing file
First, choose the file you want to update by selecting a site, and drive. Then, search for the file by name.
Once your file is selected, you can decide how to update it:
- Replace entire file - all file types
- Append to bottom - Excel files only
(Note, you can specify which sheet of an Excel file to update.)
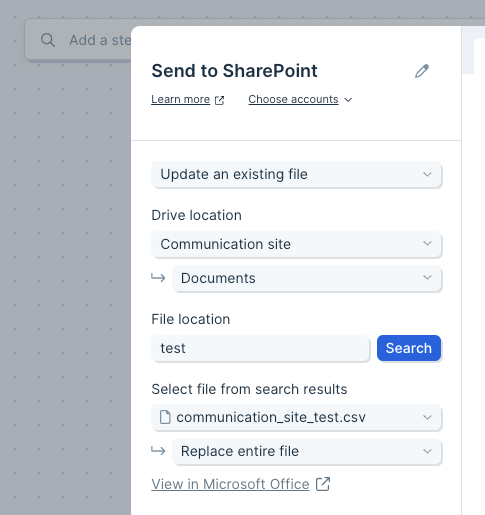
File types supported
- XLSX
- CSV (comma (,) delimiter)
- TSV (tab delimiter)
- JSON
- XML
Helpful tips
- Updates to Excel workbooks can take up to several minutes to be reflected in SharePoint.
- The Microsoft API has a size limit for Excel workbooks of 100 MB or 1,048,576 rows by 16,384 columns. (Read about other limits here.)
- If the size of the workbook you want to update already exceeds 100 MB or the max row and column limit, the API will return an error when Parabola attempts to fetch workbook metadata.
- If you are overwriting a worksheet and the data you're sending exceeds 100 MB or the max row and column limit, the Flow calculation will return an error. If you are appending to a worksheet and the data you're sending exceeds the remaining space of your workbook or will result in max row and column limit being exceeded, the Flow calculation will also return an error. In both cases you will be prompted to reduce the size of either your workbook or input data.
Integration:
MongoDB
The Pull from MongoDB step enables you to connect to your MongoDB database and access your NoSQL data in Parabola. MongoDB is a document-oriented database platform, also classified as a NoSQL database program.
Connect to your MongoDB account
Double-click on the Pull from MongoDB step and click on the blue button to Authorize. These are the following fields required to connect:
- Hostname
- Username
- Password
- Database
- Port
- Full URI (Optional) - You can opt to paste in the full URI instead of filling out the fields above.

Default settings
Once you are successfully connected to MongoDB, your first collection will be pulled in automatically. You can update the imported collection by clicking on the Collection dropdown.
Custom settings
Select your desired collection from the Collection dropdown menu.
Helpful tips
- Once your JSON blobs from MongoDB are pulled into Parabola, use the Expand JSON step or the Split column step to further query inside your JSON blobs.
Integration:
MS SQL
The Pull from MS SQL step connects to a remote Microsoft SQL Server and imports data into your flow. MS SQL is a relational database management system developed by Microsoft.
Connect your MS SQL server
Double-click on the Pull from MS SQL step and click Authorize. Enter the required connection details:
- Hostname
- Username
- Password
- Database
- Port(optional; defaults to 1433)
If your database does not require a value (for example, a password), you can leave that field blank. If you’re unsure where to find these values, check your connection string or ask your database administrator.
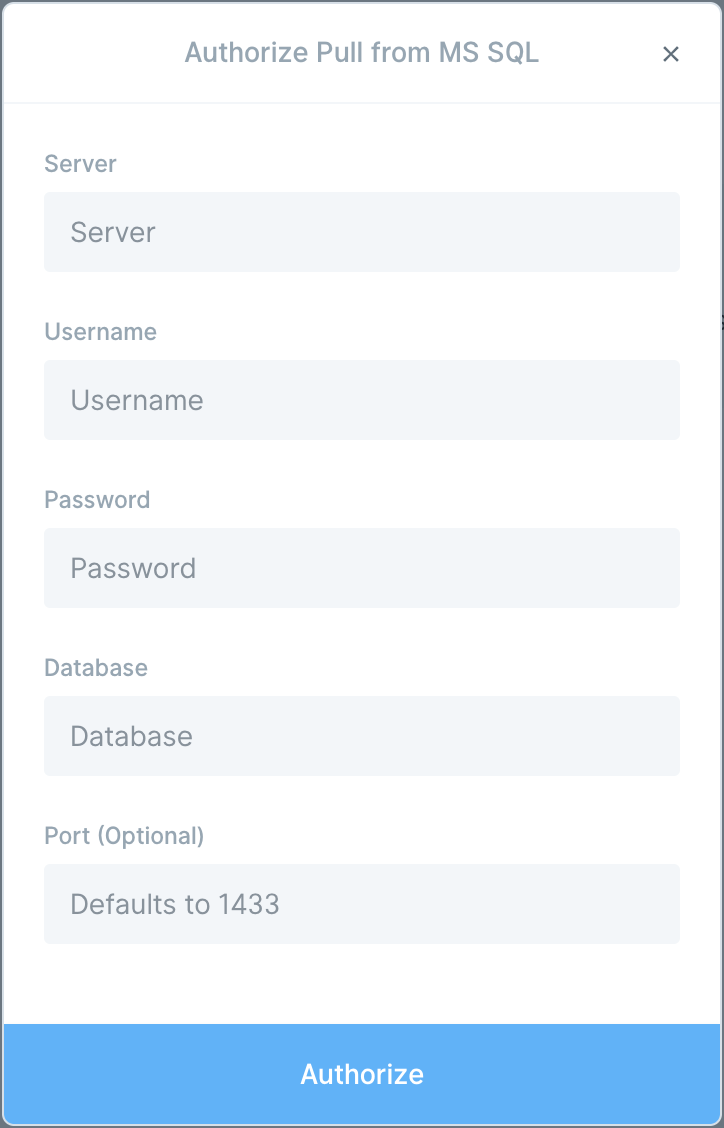
Choose what to import
After you connect, select a table. By default, the step runs select * to pull the entire table.
To narrow your results, enter a SQL statement in the ‘Query (optional)’ field. Writing a targeted query can make your imports faster and more reliable.
Get help from AI
When working in the ‘Query’ field, you’ll see two buttons that connect directly to AI chat:
- “Help write query”: Use this when you want AI to help you compose a query. Describe the data you want in plain language (for example, “Show me the last 30 days of shipped orders”), and AI will draft the SQL for you.
- “Optimize query”: Use this after you have a query. AI can help you fix errors, improve performance, or enhance the query based on more detailed instructions. This is especially useful if you run into SQL syntax errors.
Both buttons open the AI chat interface, where you can continue refining the query until it’s ready.
Tips for reliable imports
- Select only the columns you need. This reduces data size and speeds up the step.
- Add filters in your query(for example, by date) to avoid pulling entire historical tables.
- Use
top (N)while building. Remove or increase it when you’re ready to run on full data. - Include an
order byonly when you need a specific sort—sorting can slow large queries. You can always sort within Parabola by using the Sort rows step.
The Send to MS SQL step can insert and update rows in a remote Microsoft SQL server. MS SQL is a relational database management system developed by Microsoft.
Connect your MS SQL server
Double-click on the Pull from MS SQL step and click Authorize. These are the following fields required to connect:
- Hostname
- Username
- Password
- Database
- Port (Optional)
You should be able to find these fields by viewing your MS SQL profile.\

If no port is specified during authorization, this step will default to port 1433.
You can leave fields blank (like "Password") if they are not needed for the database to authorize connection.
Custom settings
Once you are successfully connected to your server, you'll first see a dropdown option to select the table you'd like to send data to.
Maximum Connections
By default, this field is set to 20, which should be safe for most databases. This setting controls how many connections Parabola generates to your database in order to write your changes faster. The number of rows you are trying to export will be divided across the connections pool, allowing for concurrent and fast updates.
Be aware, every database has its own maximum number of connections that it will accept. It is not advisable to set the Maximum Connections field in Parabola to the same number of connections that your database max is set at. If you do that, you will be using every connection when the flow runs, and nothing else will be able to connect to your database. 50% - 60% of the total available connections is as high as you should go. Talk to the whoever runs, manages, or set up your database to find out how many connections it can handle.
If you set this field to less than 1 or more than the total number allowed by your database, the step will error.
Operations
Next, you'll select an Operation. The available Operation options are:
- Insert: Inserts new rows in the database
- Upsert: Updates rows if possible, and inserts new rows if not
- Update: Only updates rows
Insert
The Insert option will insert new rows in the database. Once you select the "Insert" operation, you'll be asked to map your columns in Parabola to columns from your selected MS SQL table. You can leave some column mappings blank. If you're using the Insert operation, make sure that it's okay that Parabola create these new rows in your table. For example, you may want to check for possible duplicates.
Upsert
The Upsert option will updates rows if possible, and inserts new rows if not. The Upsert operation requires you to specify the primary key of the database table ("Unique Identifier Column in Database"), or the column that contains unique values in Parabola ("Unique Identifier Column in Results"). Mapping these columns is important so Parabola can use to figure out which rows to update versus insert new rows. A primary key / unique identifier must be configured on the database table in order for this dropdown to show any options.
Then, you need to map your columns in Parabola to columns from your selected MS SQL table.
Update
The Update option will only update rows. It will not insert any new rows. The Update operation requires you to specify the primary key of the database table ("Unique Identifier Column in Database"), or the column that contains unique values in Parabola ("Unique Identifier Column in Results"). Mapping these columns is important so Parabola can use to figure out which rows to update. A primary key / unique identifier must be configured on the database table in order for this dropdown to show any options.
Then, you need to map your columns in Parabola to columns from your selected MS SQL table.
How this step deals with errors
The Send to MS SQL step handles errors in a different way than other steps. When the flow runs, the step attempts to export each row, starting at the top of the table and processing down until every row has been attempted. Most exports in Parabola will halt all execution if a row fails, but this export will not halt. In the event that a row fails to export, this step will log the error, but will skip past the row and continue to attempt all rows. When the step finishes attempting every row, it will either be in a normal (successful) state if every row succeeded, or it will be in a error (failure) state if at least 1 row was skipped due to errors.
Helpful tips
- The Send to MS SQL step can only send strings. All values will be sent as a string. If you encounter an error when running the Send to MS SQL step, please double-check that the field in MS SQL is set to accept string values.
- Null (blank) values will create empty strings - meaning this step will not be able to send null values to your MS SQL database
- The names of your columns in Parabola must match the names of the fields in your database. Use a Rename columns step to accomplish this before sending.
- We recommend having all of your columns mapped. Any unmapped columns may cause issues during your export. If you need to remove any unmapped columns, you can utilize the Select Columns step.
- If the step is configured to map a particular column in Parabola to a column in your database, and during the export that column cannot be found or has been renamed, or cannot accept the value being sent, the step will not fail, but will instead skip trying to send that value for that row, and send a modified version of the row.
Integration:
MySQL
The Pull from MySQL step connects to and pulls data from a remote MySQL server. MySQL is an open-source relational database management system developed by Oracle.
Connect your MySQL
Double-click on the Pull from MySQL step and click Authorize. Enter the required connection details:
- Hostname
- Username
- Password (optional)
- Database
- Port (optional; defaults to 3306)
You should be able to find these fields by viewing your MySQL profile.
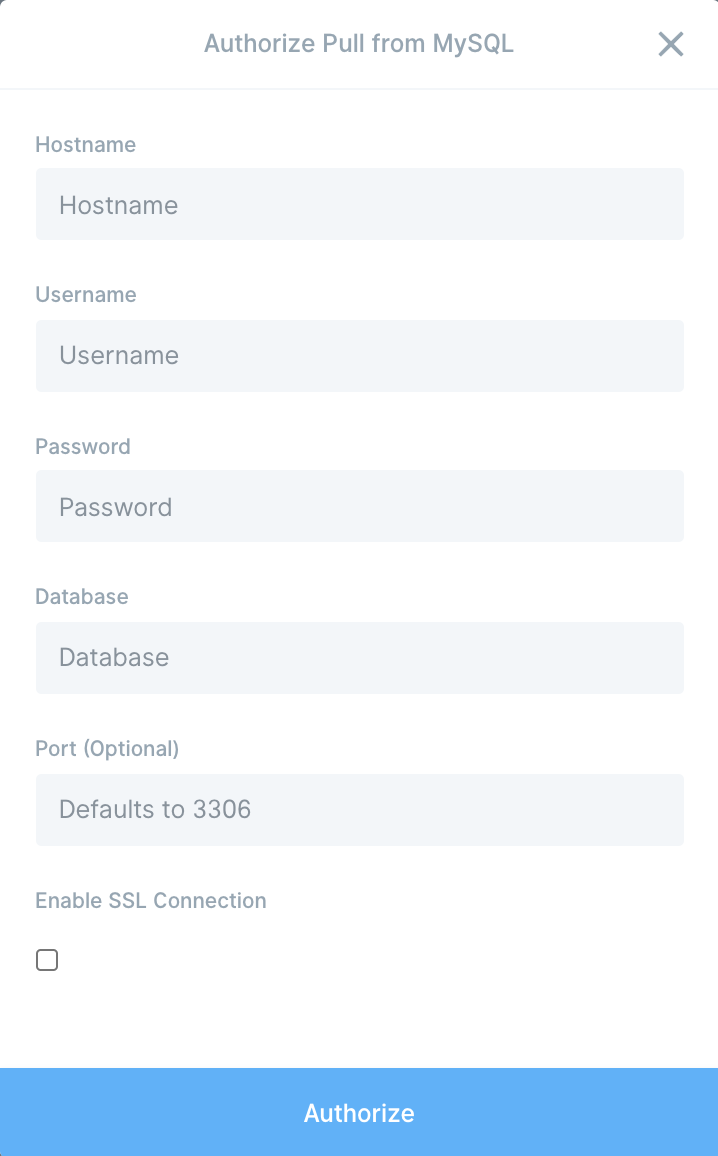
If your database does not require a value (for example, a password), you can leave that field blank. If you’re unsure where to find these values, check your connection string or ask your database administrator.
Choose what to import
After you connect, select a table. By default, the step runs the query below to pull the entire table:
select *
To narrow your results, enter a SQL statement in the ‘Query (optional)’ field. Writing a targeted query can make your imports faster and more reliable.
Get help from AI
When working in the ‘Query (optional)’ field, you’ll see two buttons that connect directly to AI chat:
- “Help write query”: Use this when you want AI to help you compose a query. Describe the data you want in plain language (for example, “Show me the last 30 days of shipped orders”), and AI will draft the SQL for you.
- “Optimize query”: Use this after you have a query. AI can help you fix errors, improve performance, or enhance the query based on more detailed instructions. This is especially useful if you run into SQL syntax errors.
Both buttons open the AI chat interface, where you can continue refining the query until it’s ready.
The Send to MySQL step can insert and update rows in a remote MySQL database. MySQL is an open-source relational database management system developed by Oracle.
Connect your MySQL server
Double-click on the Send to MySQL step and click on the blue button to Authorize. These are the following fields required to connect. You should be able to find these fields by viewing your MySQL profile.
If no port is specified during authorization, this step will default to port 3306.
You can leave fields blank (like password) if they are not needed for the database to authorize connection.
Custom settings
Once you are successfully connected to your server, you'll first see a dropdown option to select the table you'd like to send data to.
Maximum Connections
By default, this field is set to 20, which should be safe for most databases. This setting controls how many connections Parabola generates to your database in order to write your changes faster. The number of rows you are trying to export will be divided across the connections pool, allowing for concurrent and fast updates.
Be aware, every database has its own maximum number of connections that it will accept. It is not advisable to set the Maximum Connections field in Parabola to the same number of connections that your database max is set at. If you do that, you will be using every connection when the flow runs, and nothing else will be able to connect to your database. 50% - 60% of the total available connections is as high as you should go. Talk to the whoever runs, manages, or set up your database to find out how many connections it can handle.
If you set this field to less than 1 or more than the total number allowed by your database, the step will error.
Operations
Next, you'll select an Operation. The available Operation options are:
- Insert: Inserts new rows in the database
- Upsert: Updates rows if possible, and inserts new rows if not
- Update: Only updates rows
Insert
The Insert option will insert new rows in the database. Once you select the "Insert" operation, you'll be asked to map your columns in Parabola to columns from your selected MySQL table. You can leave some column mappings blank. If you're using the Insert operation, make sure that it's okay that Parabola create these new rows in your table. For example, you may want to check for possible duplicates.
Upsert
The Upsert option will updates rows if possible, and inserts new rows if not. The Upsert operation requires you to specify the primary key of the database table ("Unique Identifier Column in Database"), or the column that contains unique values in Parabola ("Unique Identifier Column in Results"). Mapping these columns is important so Parabola can use to figure out which rows to update versus insert new rows. A primary key / unique identifier must be configured on the database table in order for this dropdown to show any options.
Then, you need to map your columns in Parabola to columns from your selected MySQL table.
Update
The Update option will only update rows. It will not insert any new rows. The Update operation requires you to specify the primary key of the database table ("Unique Identifier Column in Database"), or the column that contains unique values in Parabola ("Unique Identifier Column in Results"). Mapping these columns is important so Parabola can use to figure out which rows to update. A primary key / unique identifier must be configured on the database table in order for this dropdown to show any options.
Then, you need to map your columns in Parabola to columns from your selected MySQL table.
How this step deals with errors
The Send to MySQL step handles errors in a different way than other steps. When the flow runs, the step attempts to export each row, starting at the top of the table and processing down until every row has been attempted. Most exports in Parabola will halt all execution if a row fails, but this export will not halt. In the event that a row fails to export, this step will log the error, but will skip past the row and continue to attempt all rows. When the step finishes attempting every row, it will either be in a normal (successful) state if every row succeeded, or it will be in a error (failure) state if at least 1 row was skipped due to errors.
Helpful tips
- The Send to MySQL step can only send strings. All values will be sent as a string. If you encounter an error when running the Send to MySQL step, please double-check that the field in MySQL is set to accept string values.
- Null (blank) values will create empty strings - meaning this step will not be able to send null values to your MySQL database
- The names of your columns in Parabola must match the names of the fields in your database. Use a Rename columns step to accomplish this before sending.
- We recommend having all of your columns mapped. Any unmapped columns may cause issues during your export. If you need to remove any unmapped columns, you can utilize the Select Columns step.
- If the step is configured to map a particular column in Parabola to a column in your database, and during the export that column cannot be found or has been renamed, or cannot accept the value being sent, the step will not fail, but will instead skip trying to send that value for that row, and send a modified version of the row.
Integration:
NetSuite
The Pull from NetSuite integration enables users to connect to any NetSuite account and pull in saved search results that have been built in the NetSuite UI. Multiple saved searches, across varying search types, can be configured in a single flow.
The following document outlines the configuration requirements in NetSuite for creating the integration credentials, defining relevant role permissions, and running the integration in Parabola.
NetSuite configuration process
The following configuration steps are required in NetSuite prior to leveraging the Parabola integration:
- Create or select a web services only role that can be used by Parabola
- Create or select a user that will be used for the integration in NetSuite. Ensure the role from the step above is applied to this user record
- Create a new integration in Netsuite
- This will result in the creation of your consumer key and consumer secret
- Create a new set of access tokens that reference the user, role, and integration specified above
- This will result in the creation of your token id and token secret
Once complete, you will enter the unique credentials generated in the steps above into the Pull from NetSuite step in Parabola. This will also require your account id, which is obtained from your NetSuite account’s url. Ex: https://ACCOUNTID.app.netsuite.com/
The following document will review how to create each of the items above.
Creating a NetSuite role
The permissions specified on the role applied to your integration will determine which saved searches, transactions, lists, and results you’ll be able to access in Parabola. It is important for you to confirm that the role you plan to use has access to all of the relevant objects as required.
The following permissions are recommended, in addition to any specific transaction/list/report specific you may require.
In addition to the below permissions, we also recommend adding the permissions listed in this document.
Transactions
- Any specific transaction types required: sales orders, purchase orders, transfer orders, etc.
- Find transaction
Reports
- Any specific report types required
Lists
- Any specific lists required: items, locations, companies, customers, etc.
- Perform search, persist search, and publish search
Setup
- Log in using Access Tokens
- SOAP Web Services
Custom Records:
- Any specific custom record objects required
Ensure the checkbox for the web services only role is selected.
Creating a NetSuite integration
Video walk-though of the setup process:
Follow the path below in the NetSuite UI to create a new integration record.
- Setup > Integration > Manage Integrations > New
- Specify an integration name, ensure the status is set to active, and select the token-based authentication option.
- Uncheck the TBA: Authorization Role and Authorization Code Grant checkboxes.
- Save the record.
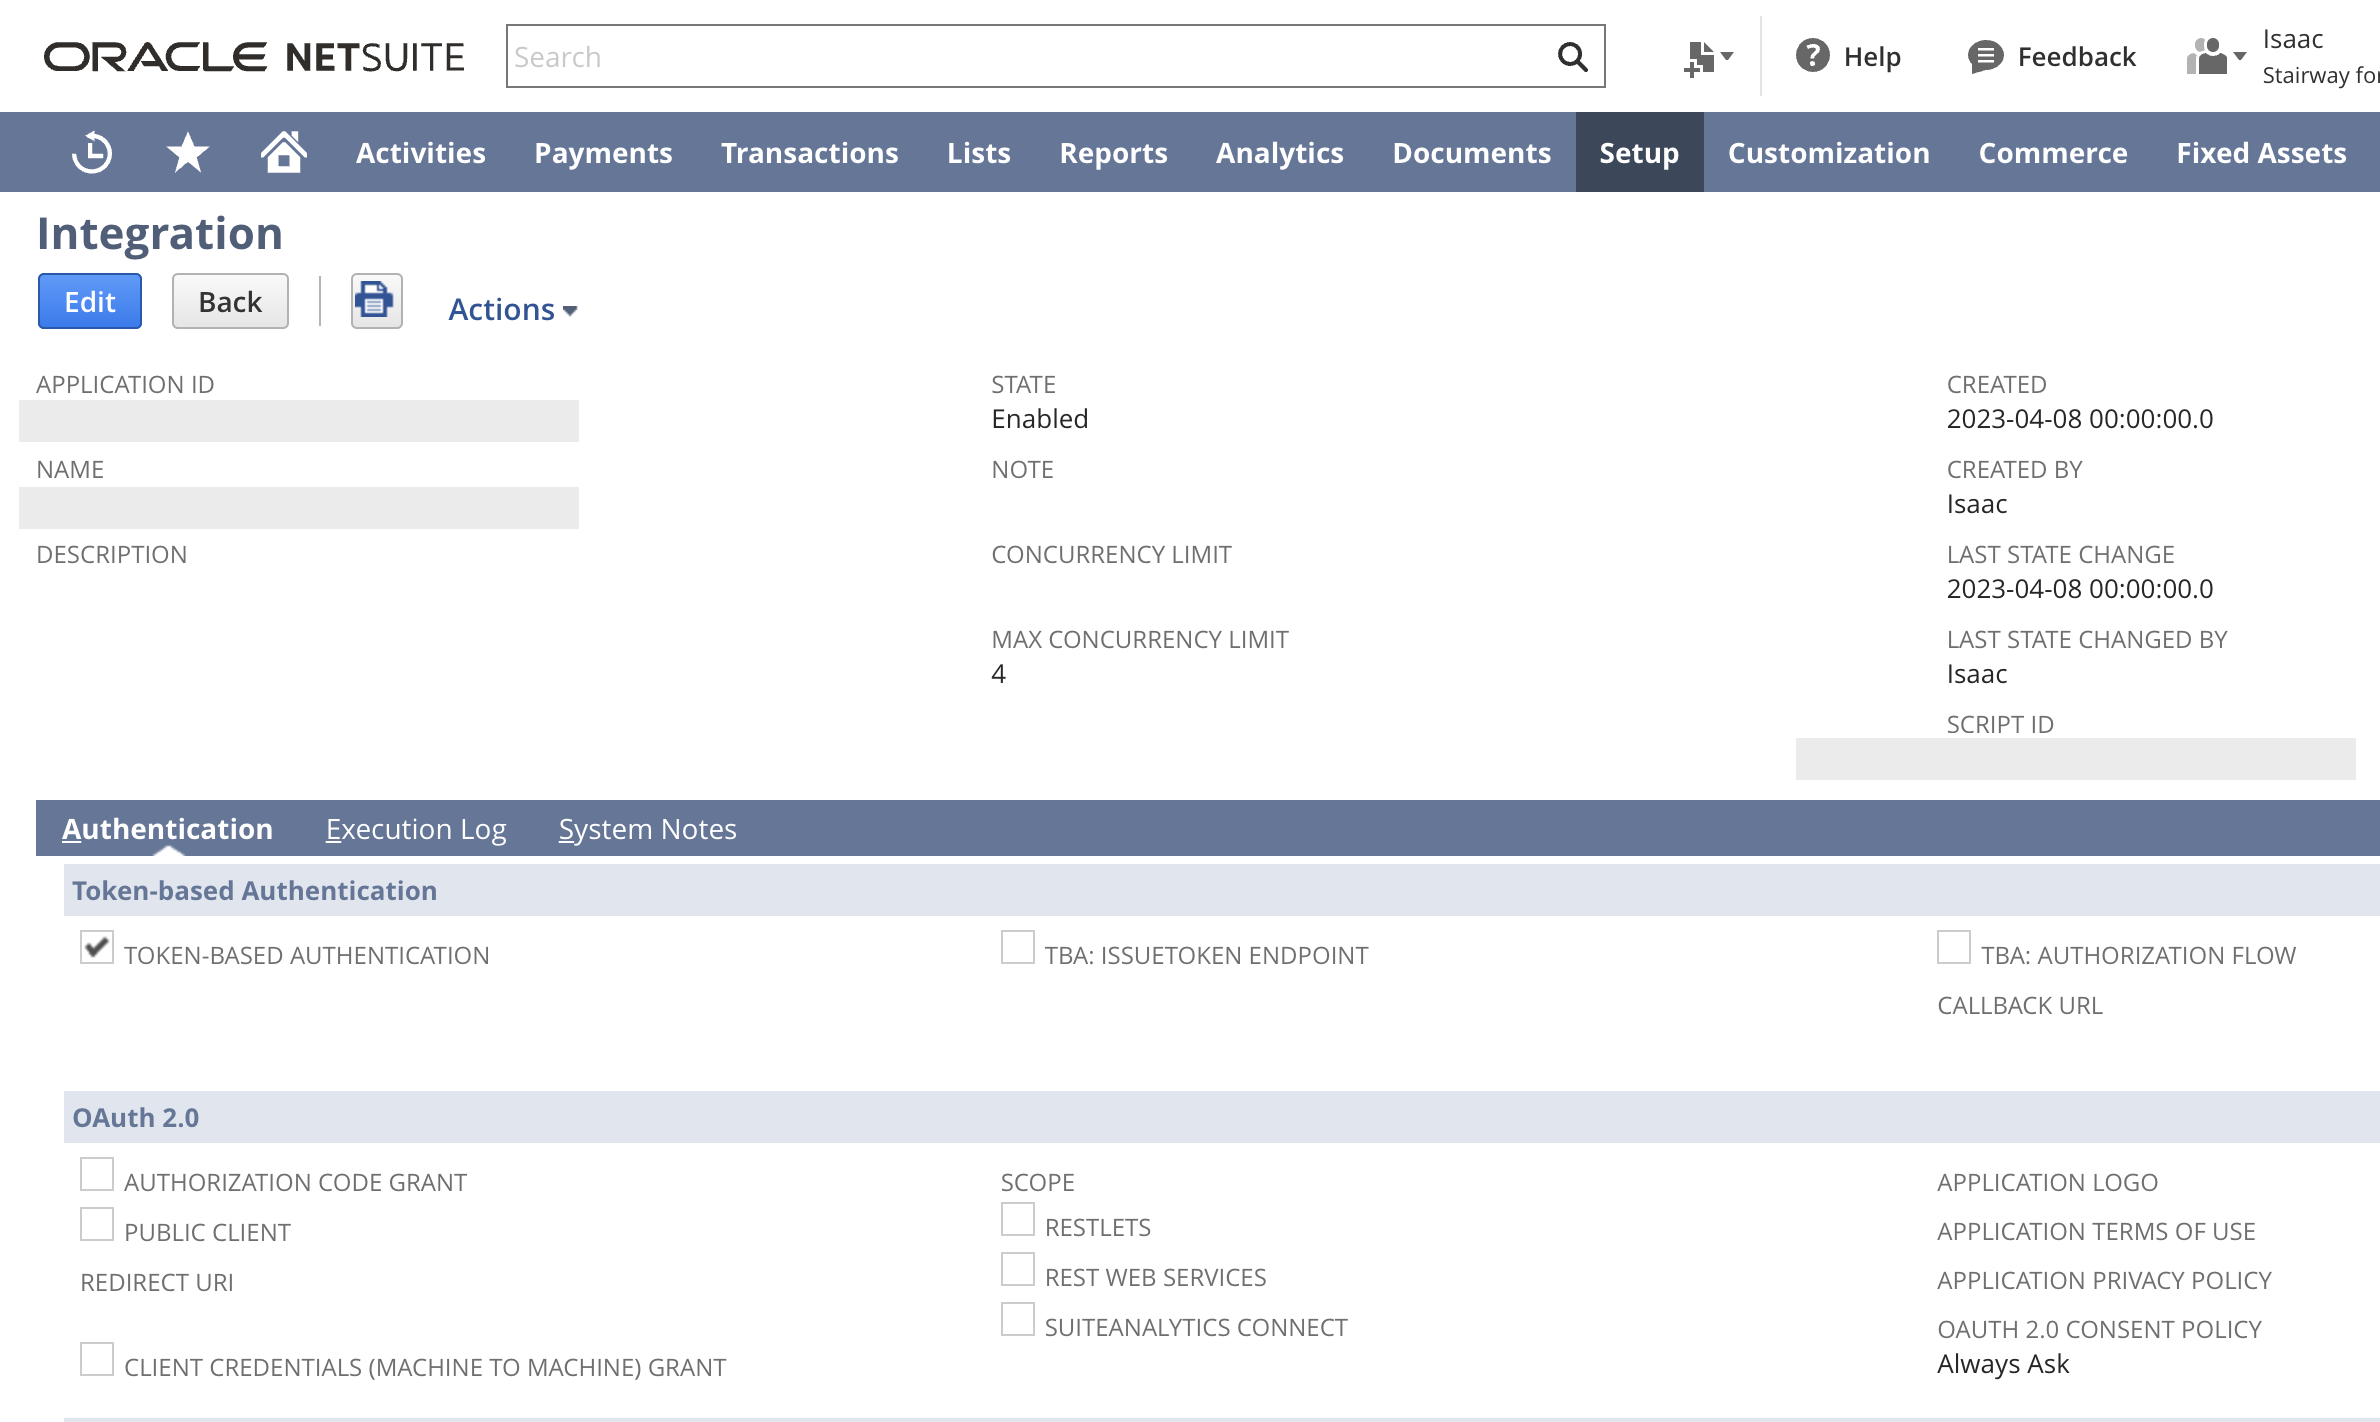
A consumer key and consumer secret will be generated upon saving the record. Record these items, as they will disappear once you leave this page.
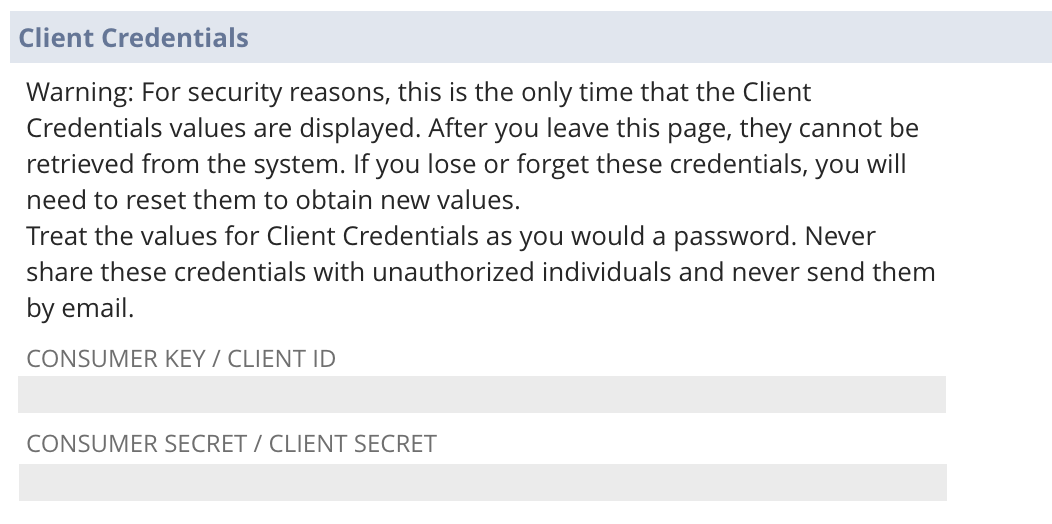
Creating a new access token
Once the role, user, and integration have been created, you’ll need to generate the tokens which are required for authentication in Parabola.
Follow the path below in the NetSuite UI to create a new token record.
- Setup > Users/Roles > Access Tokens > New Access Tokens
- Specify the integration created previously, the desired user, and role, and click save.
- The newly created token id and token secret will appear at the bottom of the page. Record these credentials, as they will disappear once you leave this page.
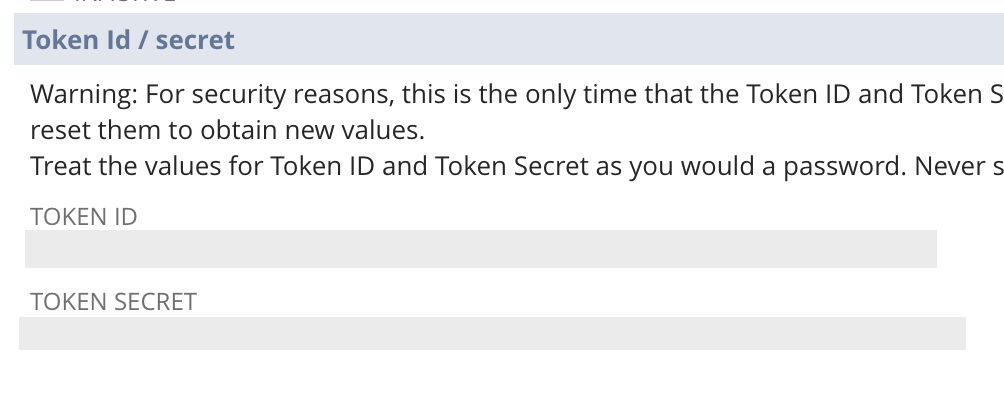
Configure your settings in Parabola
- Gather the credentials created from each step earlier in the process and navigate to the Pull from NetSuite step in Parabola.
- Open the Pull from NetSuite step and click Authorize or Edit Accounts
- Enter each applicable token and consumer key/secret and click authorize.
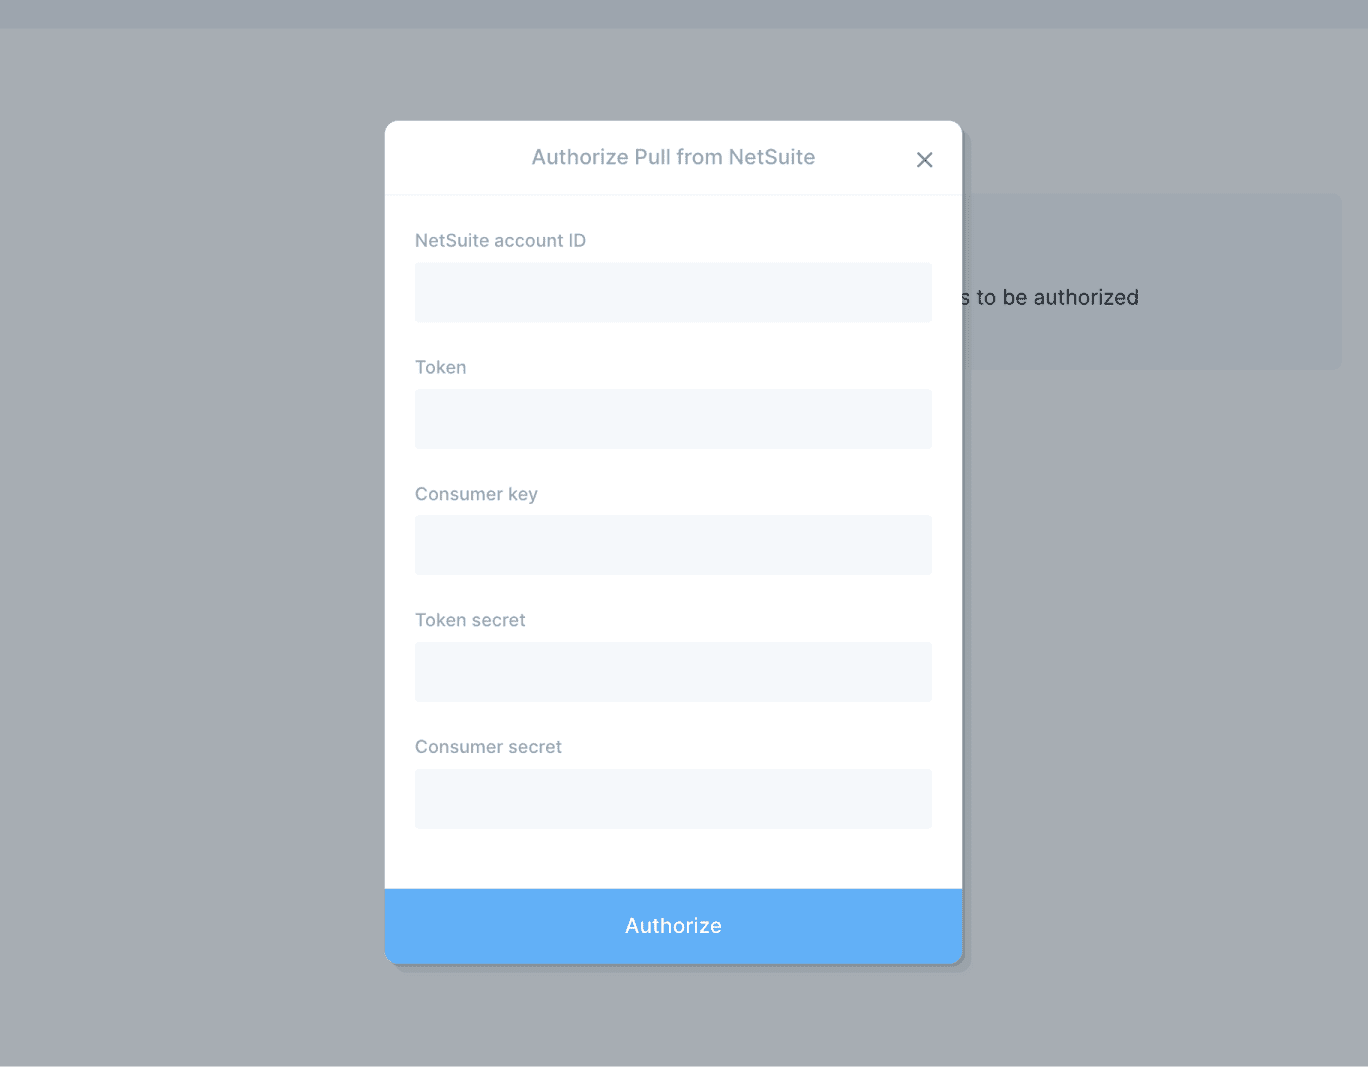
Once authorized, you’ll be prompted to select a search type and specific saved search to run. Click refresh and observe your results!
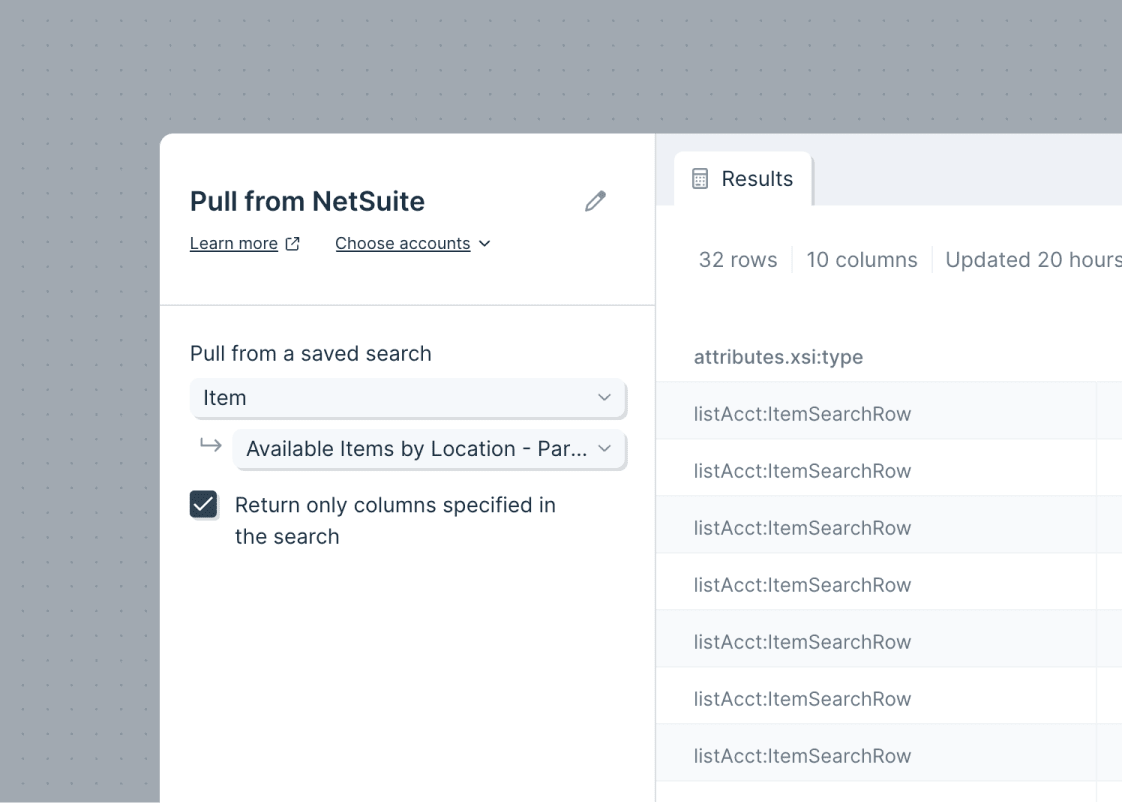
The Return only columns specified in the search checkbox enables a user to determine if all available columns, or only the columns included in the original search, should be returned. This setting is helpful if you’d like to return additional data elements for filtered records without having to update your search in NetSuite.
Helpful Tips
- The Pull from NetSuite step integrates directly with the saved search function. Based on permissions, users have the ability to access all saved searches from the NetSuite UI within Parabola.
- If no saved search options are returned for a specific transaction type, please validate your user and role have access to the specific object you’re attempting to access.
- Users will need permissions within NetSuite to create new integrations, manage access tokens, edit roles, etc. in order to generate the credentials required for this integration
- Formula fields within saved searches will not be returned
- Saved searches which include summary results are not supported
- Ensure the user/role configured for the integration has sufficient permissions to access all necessary saved searches and results
By default, the NetSuite API will only return the full data results from the underlying search record type (item, customer, transaction, etc) and only the internal ids of related record types (vendors, locations, etc) in a search.
For example, running the following search in Parabola would return all of the information as expected from the base record type (item in this scenario), and the internal id of the related object (vendor).
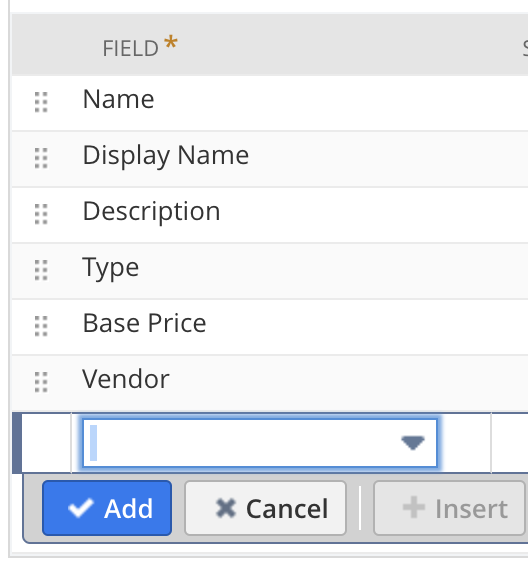
The best way to return additional details from related objects (vendor in this scenario) is by adding joined fields within the search. Multiple joined fields can be added to a single search to return data as necessary.
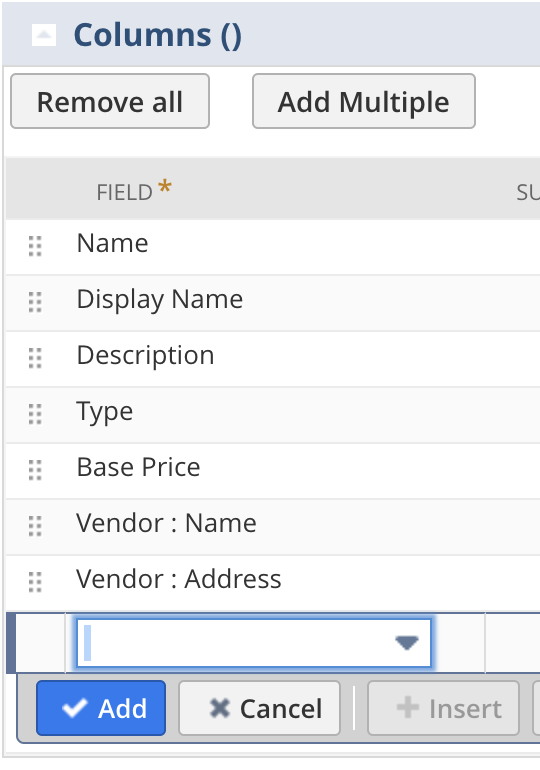
Alternatively, another solution would be running separate searches and joining the results by using a Combine Tables step within the flow. This is demonstrated below.
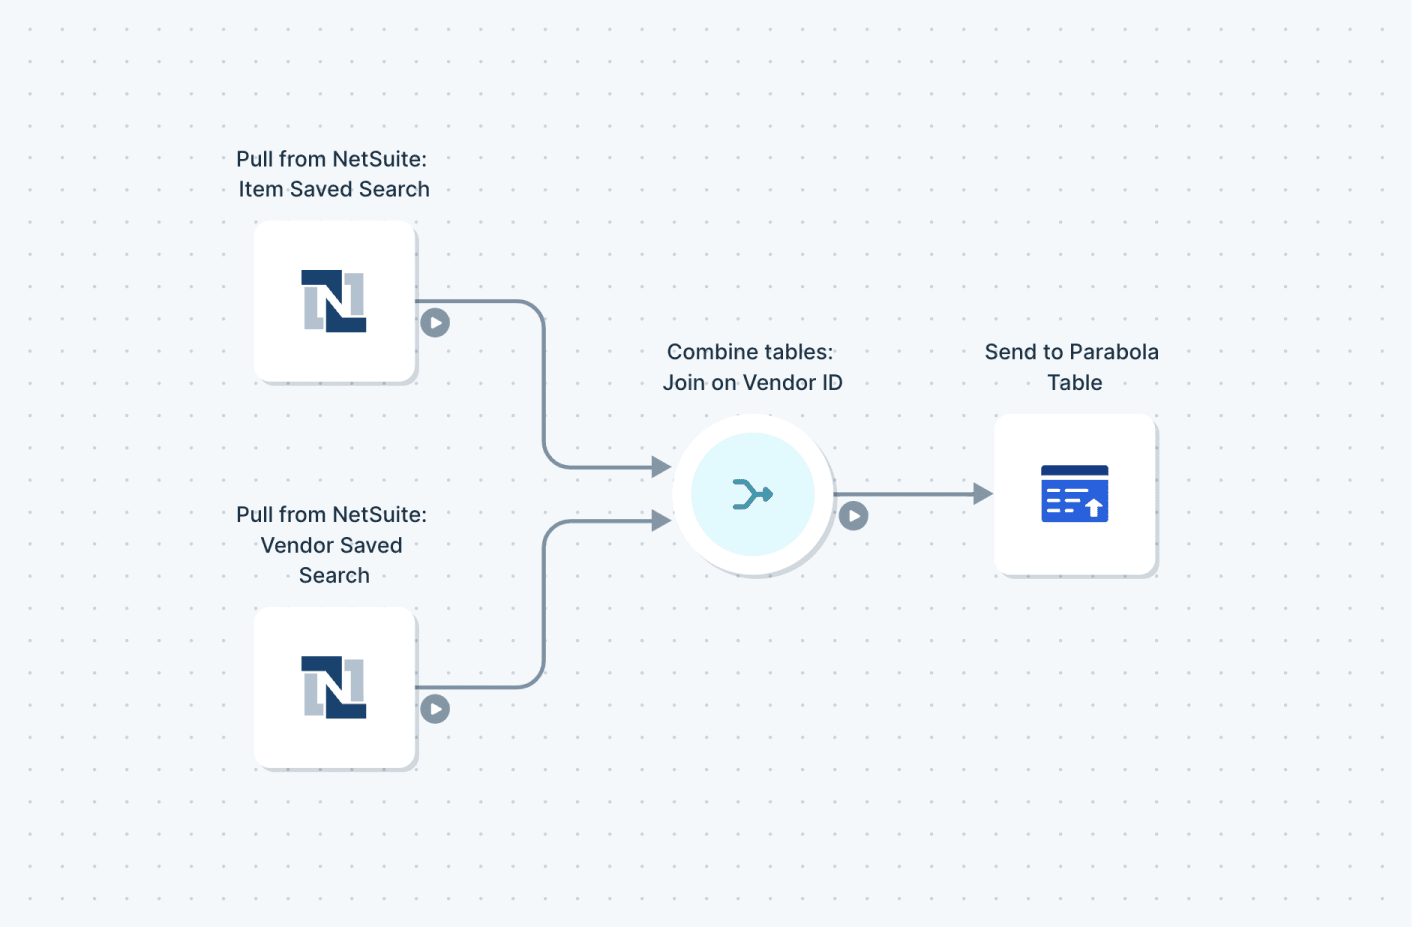
Usage notes
- Users will need permissions within NetSuite to create new integrations, manage access tokens, edit roles, etc. in order to generate the credentials required for this integration
- Formula fields within saved searches will not be returned
- Saved searches which include summary results are not supported
- Ensure the user/role configured for the integration has sufficient permissions to access all necessary saved searches and results
Connection
The same credentials and role configured for pulling data from NetSuite can be leveraged within Parabola’s Send to NetSuite step.
One key difference for posting data to NetSuite is ensuring the role has full access to REST Web Services
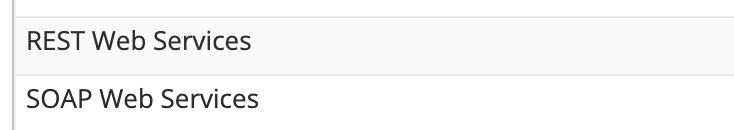
It also is important to confirm that the role has sufficient permissions enabled to create and/or update the relevant objects that are in scope for your team’s use cases.
This is completed by selecting the relevant permission and updating the access level to Full

As an example, the following permissions need to be enabled for use cases that involve creating & updating sales orders:
- Transactions > Sales Orders > Full Access
Using the step
Creating and updating fields within NetSuite requires providing the internal IDs for relevant objects (items, sales orders, customers, subsidiaries, etc) as opposed to providing the human readable names you’re familiar with (SKUs, order numbers, customer names, etc).
It is a best practice to leverage Pull from NetSuite step or reference file within your flows to gather the internal IDs for reference prior to using the Send to NetSuite step to prevent errors.
Use case example: Creating new sales orders based on a PDF Purchase Order from a customer
Flow inputs:
- An extract from email step that parses a new purchase order PDF from a customer
- This step extracts the order number, customer name & address, each ordered SKU, the quantity, and the relevant order/ship dates
- Pull from NetSuite steps that list master data references including name and internal ID:
- Customers
- Items
Transformation logic:
- Combine the parsed PDF data with the NetSuite reference searches based on the SKU name & Customer Name
- Your dataset should now include the relevant internal ID for each object (Item, Customer, Location)
Flow Outputs:
- Connect your data to a Send to NetSuite step
- Select the action “Create” and the object “Sales Order”
- Configure the mandatory fields for entity ID (customer), item internal ID, status, etc.
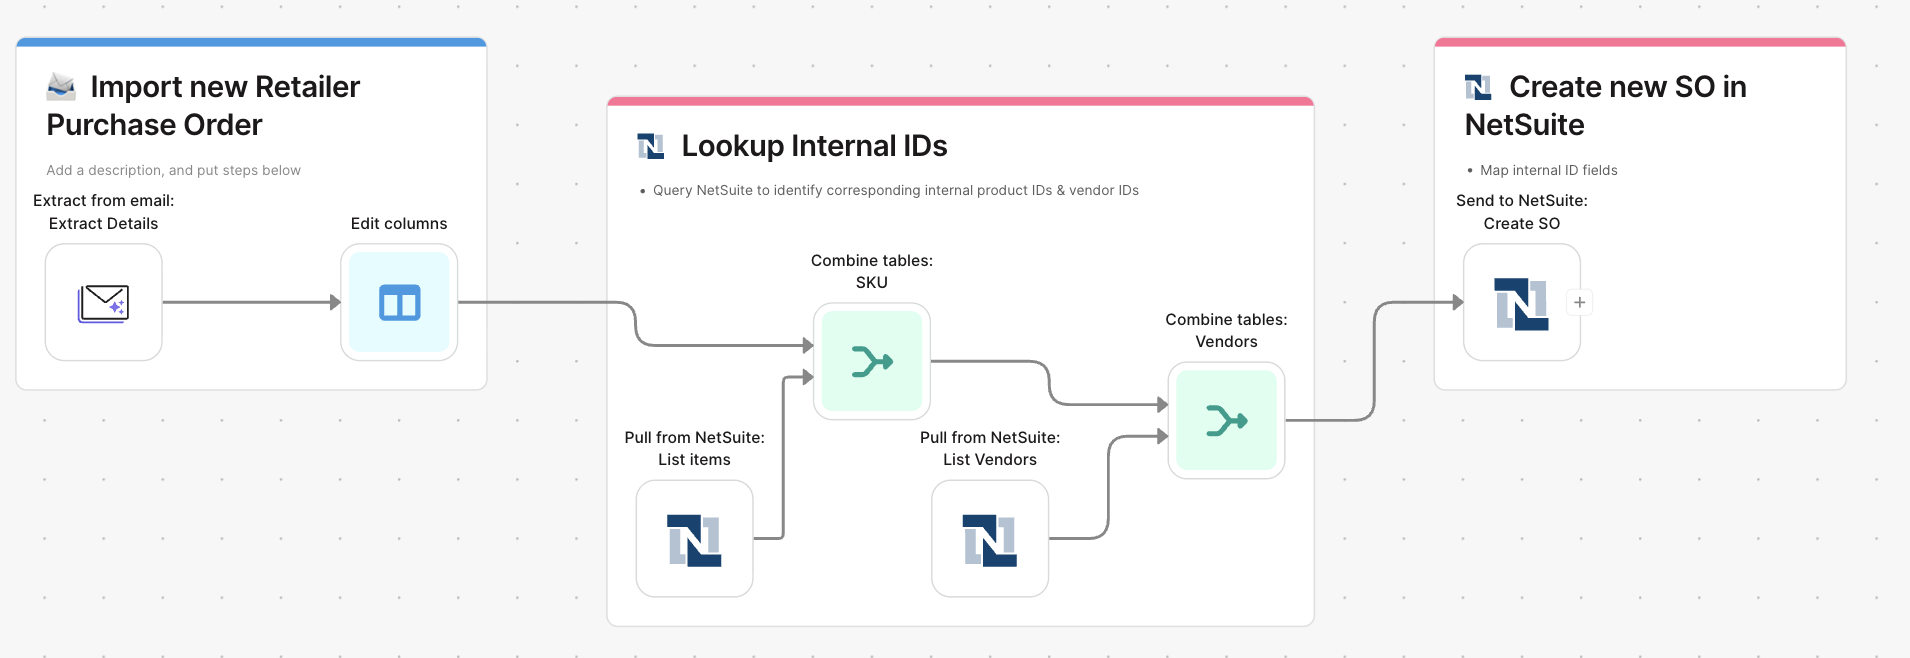
Record statuses
NetSuite requires data to be imported using the specific internal status codes. Specify a status by inserting a custom value with the Status Internal Identifier from the table below.
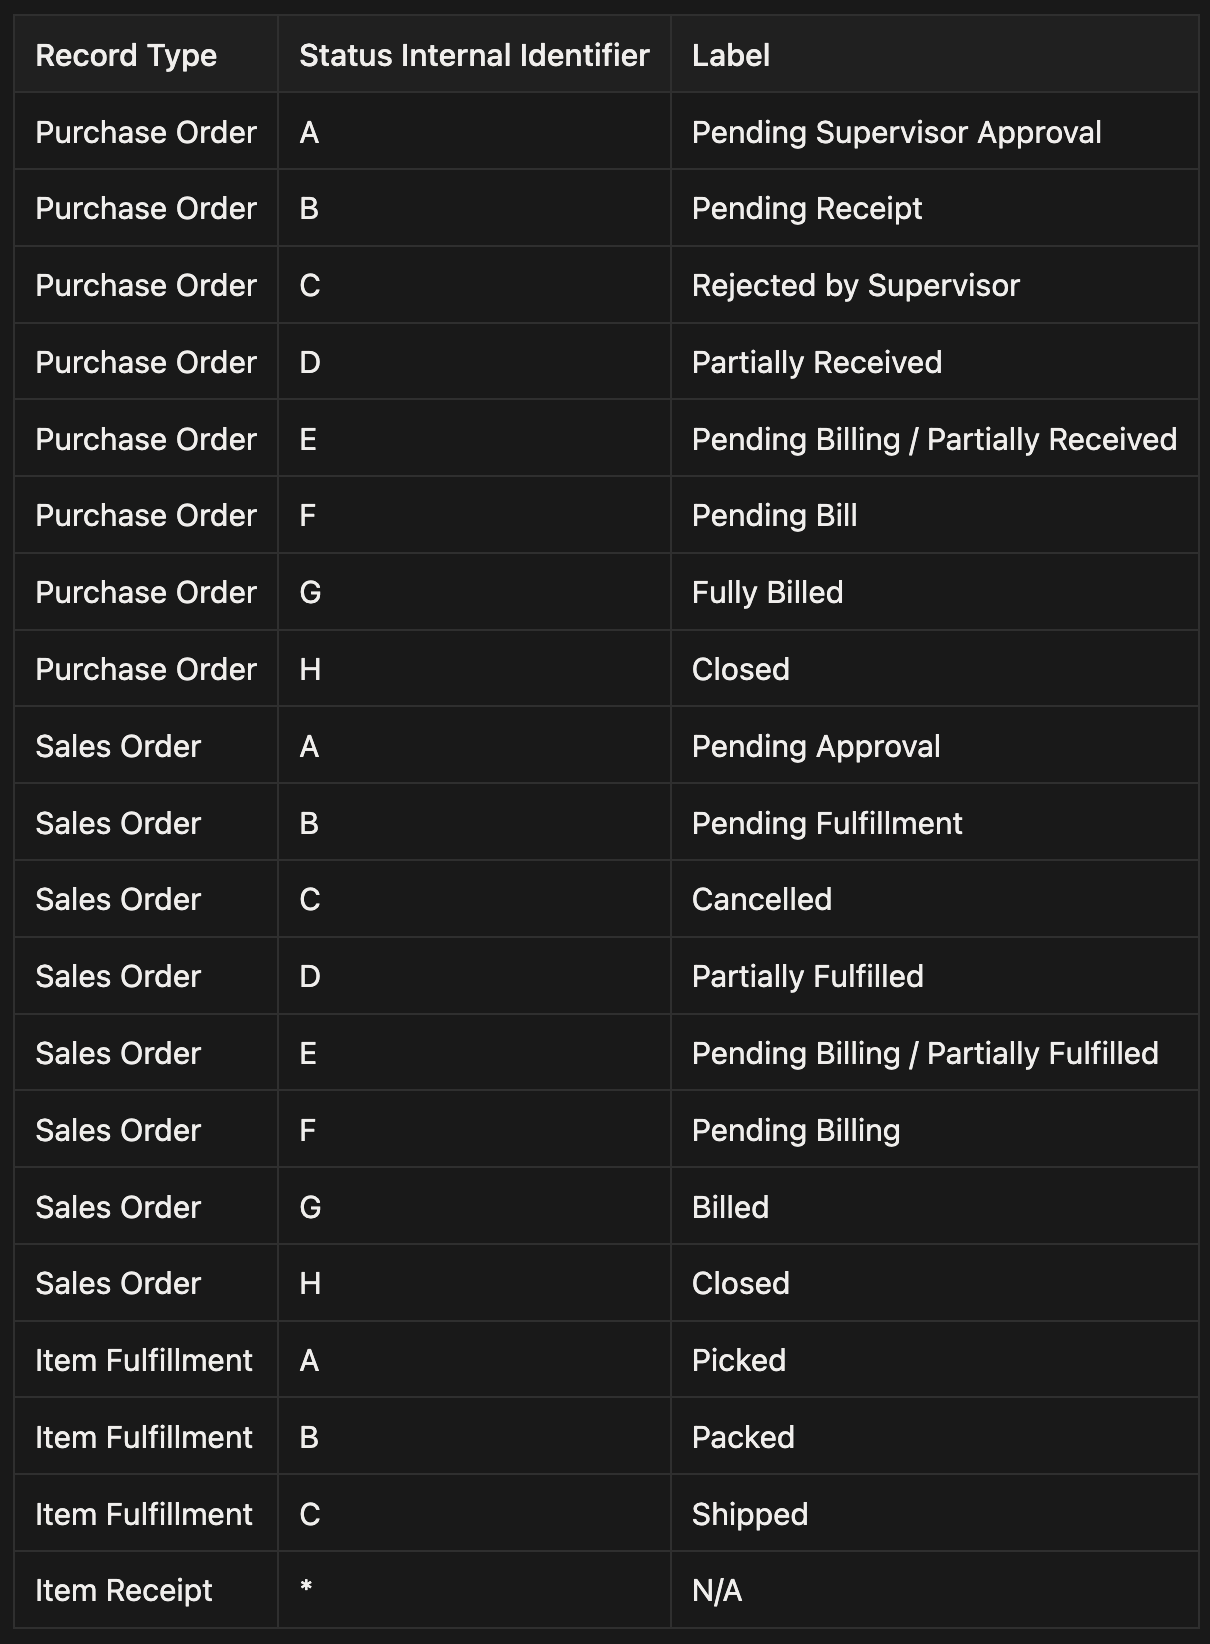
Bulk Creation
A single flow run can create multiple records within NetSuite. It’s important to leveraging the “grouping” function on the item level mapping to ensure sub-items are consolidated into the relevant parent level record.
An example is grouping sales order items by the sales order number to ensure each item is associated with the corresponding sales order.
Tips:
- Use Pull from NetSuite steps with saved searches for items, customers, vendors, or locations and reference them in flows to look up internal IDs
- The NetSuite Entity field relates to Vendor on POs and Customer on SOs
Integration:
Parabola Flows
The Run another Parabola Flow step gives you the ability to trigger runs of other Parabola flows within a flow.
Running other Flows
Select the flow you want to trigger during your current flow's run. No data will pass through this step. It's strictly a trigger to automatically begin a consecutive run of a secondary flow.
.png)
However, if you choose “Run once per row with a file URL”, data will be passed to the second Flow, which can be read using the Pull from file queue step.
Use the Run behavior setting to indicate how the other Flow should run. The options that include wait will cause the step to wait until the second Flow has finished before it can complete it’s calculation. The other options will not wait.
Using this step in a Flow
This step can be used with or without input arrows. If you place this step into a Flow without input arrows, it will be the first step to run. If it does have input arrows, then it will run according to the normal sequence of the Flow. Any per row options require input arrows.
Helpful tips
- This step is only available on our Advanced plan.
- It can be beneficial or necessary to split large and complex Parabola flows into multiple pieces. In order for your data to processed correctly, you may need a flow to run exactly after another flow. In this case, you can add the Run another Parabola flow step destination after the last step of your flow, and have it trigger the next flow in your sequence.
- The flow that you're trying to trigger must be published. If you're unable to find a flow in the drop-down list, make sure it is published (ie. a live version of the flow exists).
Integration:
Parabola Tables
The Pull from Parabola Table step is a source step used to pull data from a Parabola Table that you have access to. If you are an Editor or Viewer on a Flow, any Parabola Tables on that Flow will be available to be pulled in as a data source using this step.
Settings
The dropdown options for Tables to import will be located on the left-hand side. Tables that you have access to will be listed in the dropdown options. This step can access any Table in your Parabola account that you are authorized to access (whether as Viewer, Editor or owner).
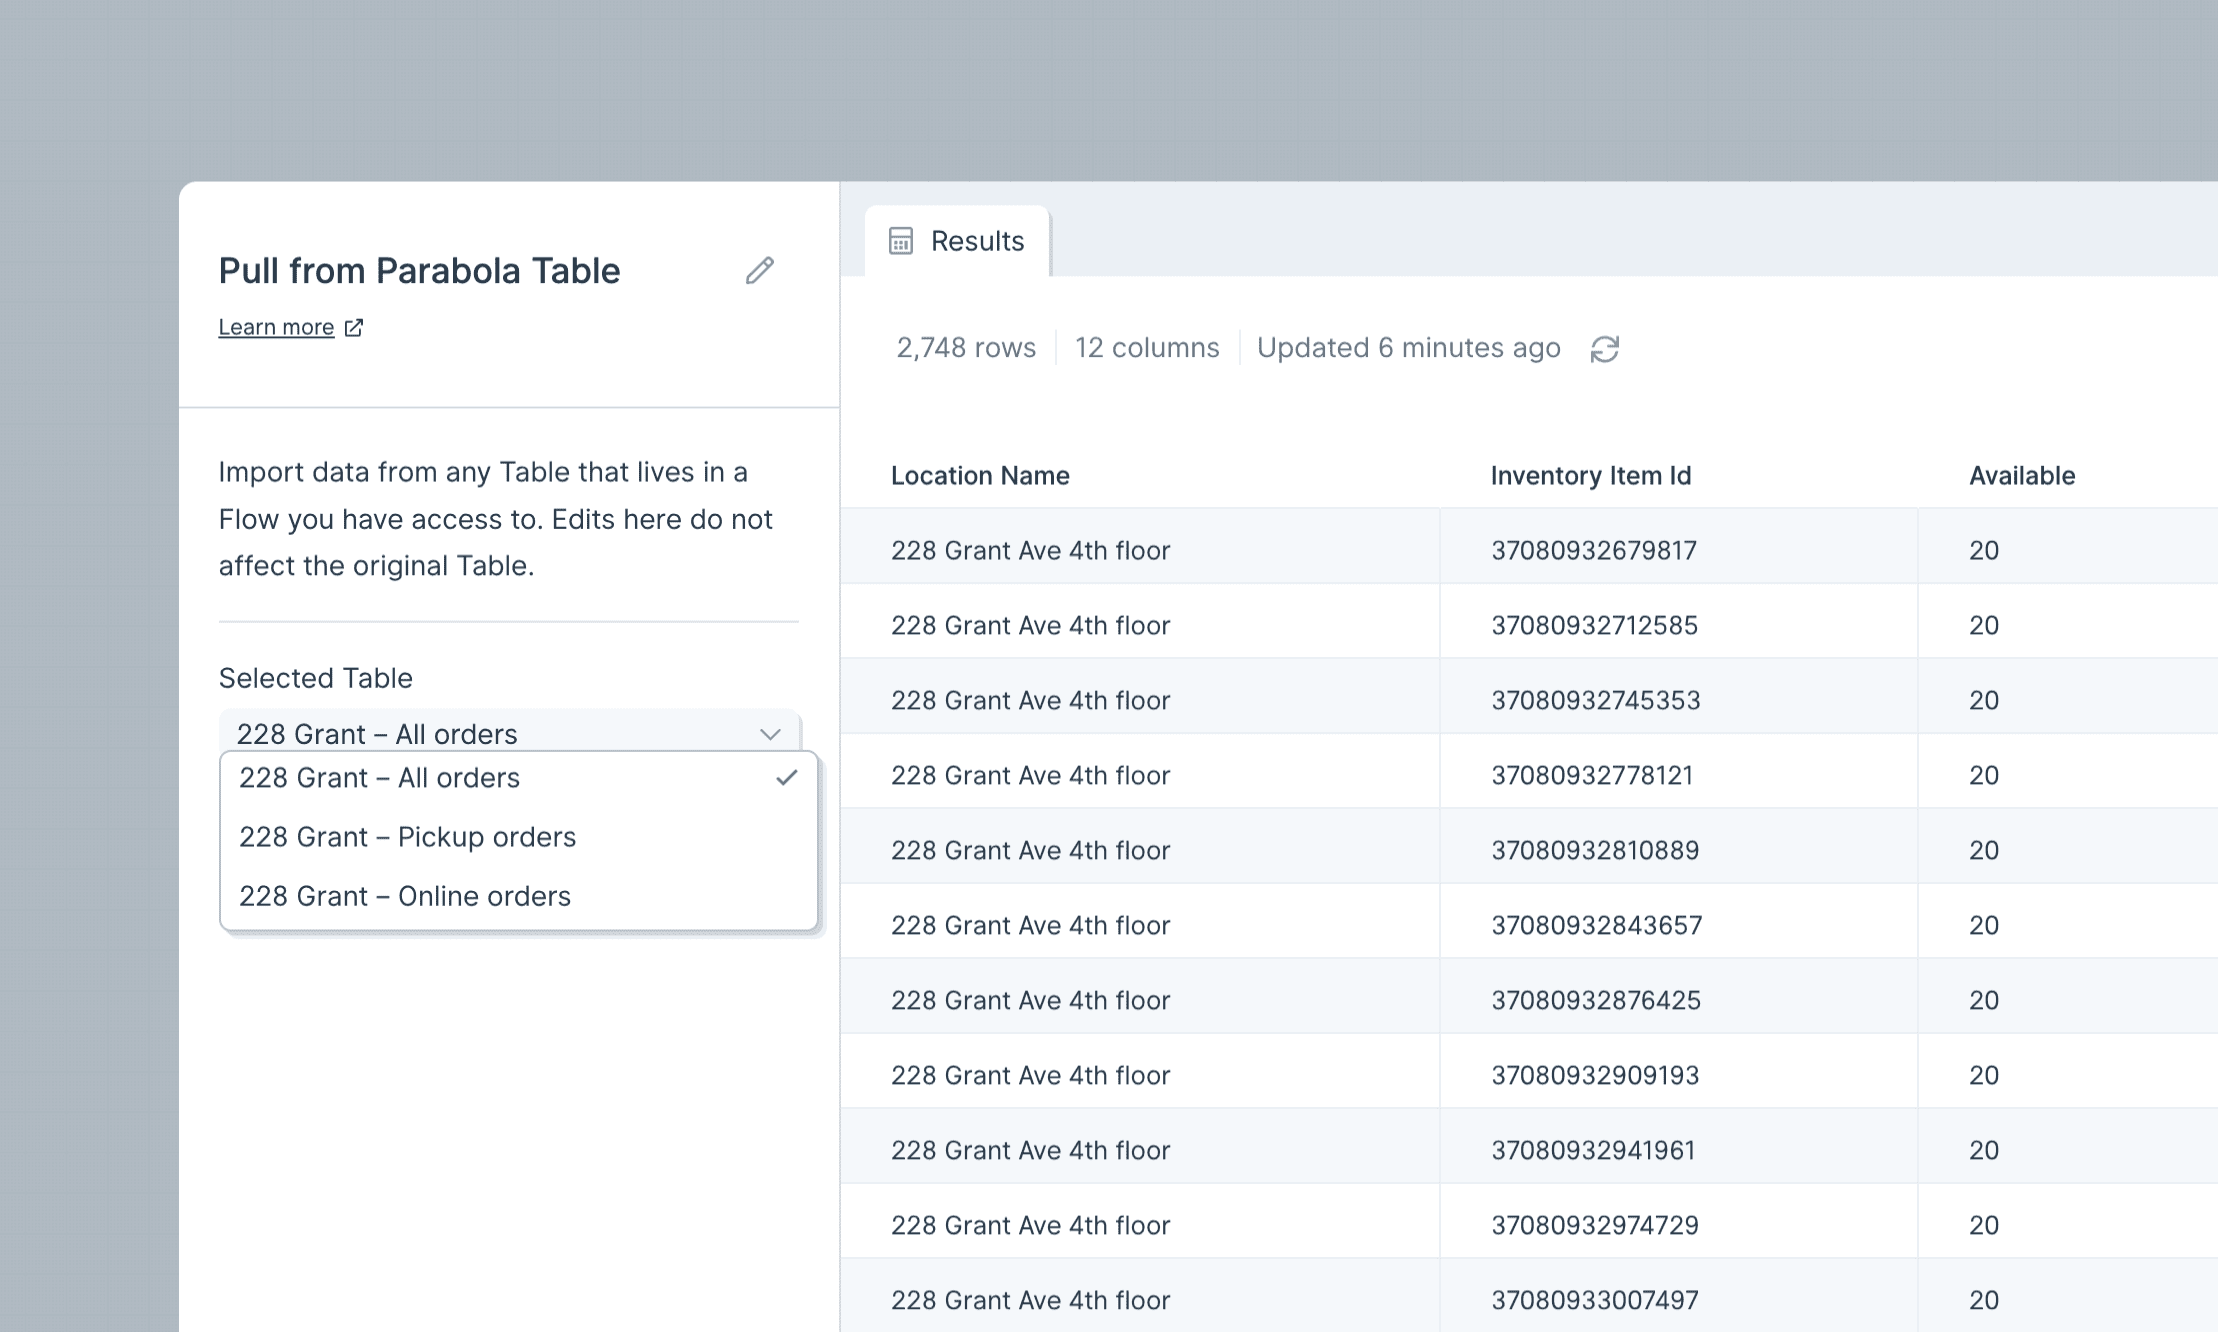
Helpful Tips
This step pulls the base data in your Parabola Table. Views applied on to your table, such as filters, sorts, aggregations, groups and visual formatting will not show up in this step.
If you do not see your Parabola Table in the dropdown, check to make sure the Allow other Flows to pull data from this table option is enabled on your Send to Parabola Table step.
If you need to bring in multiple Tables, use multiple Pull from Parabola Table steps to bring in the data. Then combine the dataset using a Stack tables or Combine tables step.
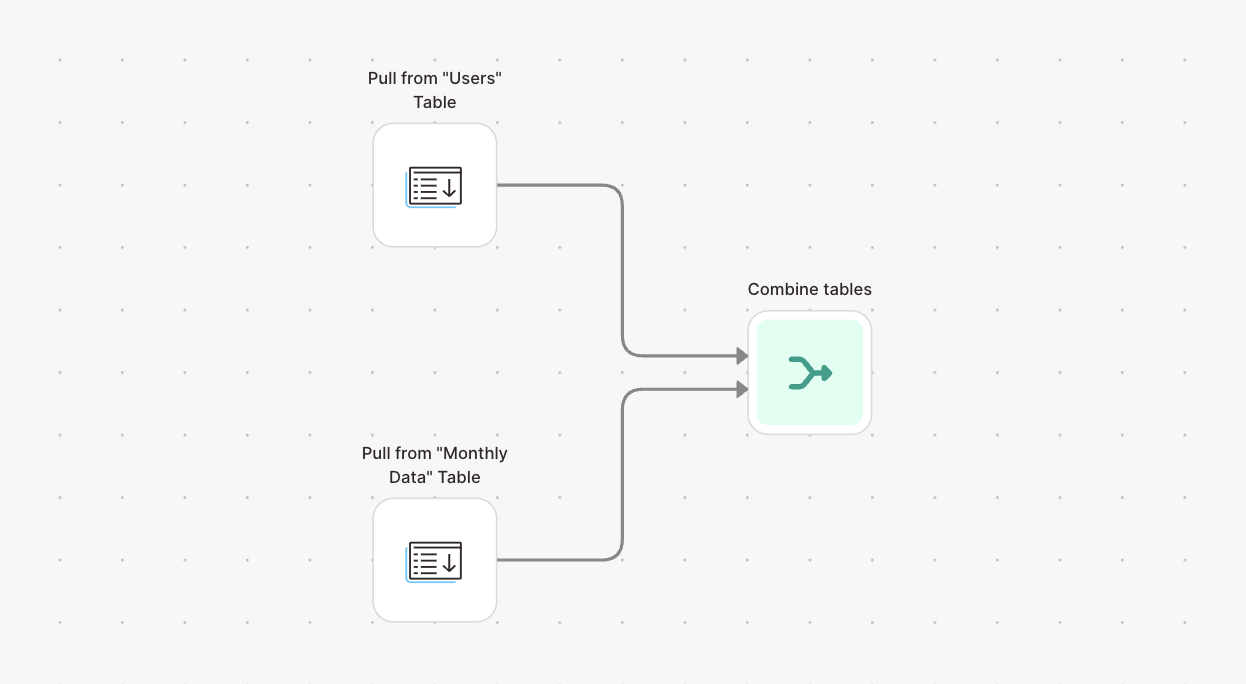
Limitations: when working across multiple Flows, the Pull from Tables step will only pull from a Table that has been published on a Flow with a successful run. When working within the same Flow, you can also pull from a draft (unpublished) table.
The Send to Parabola Table step is a destination step that lets you store your dataset in a Parabola Table. Data sent to that table will be visible to anyone with access to that Flow (Viewer, Editor or Owner).
Viewing your data
When configured, the Send to Parabola Table step has two tabs - an "Input" tab, and an "Existing Table" tab.
- The input tab will show you what data is currently flowing into this step. That is the data that would be sent to the Table to be stored, if you ran this Flow.
- The existing Table tab will show you the data that is currently stored in the Table from prior runs of the Flow. Any downstream steps that receive input data from this step will have access to the data represented in this tab. Any steps that receive input from this step will receive the data currently stored in the Table.
Settings
- After you connect your Flow to this export step, it will show a preview of the Table data. You must give your Table a name on this step (and you can edit the name from here at any time).
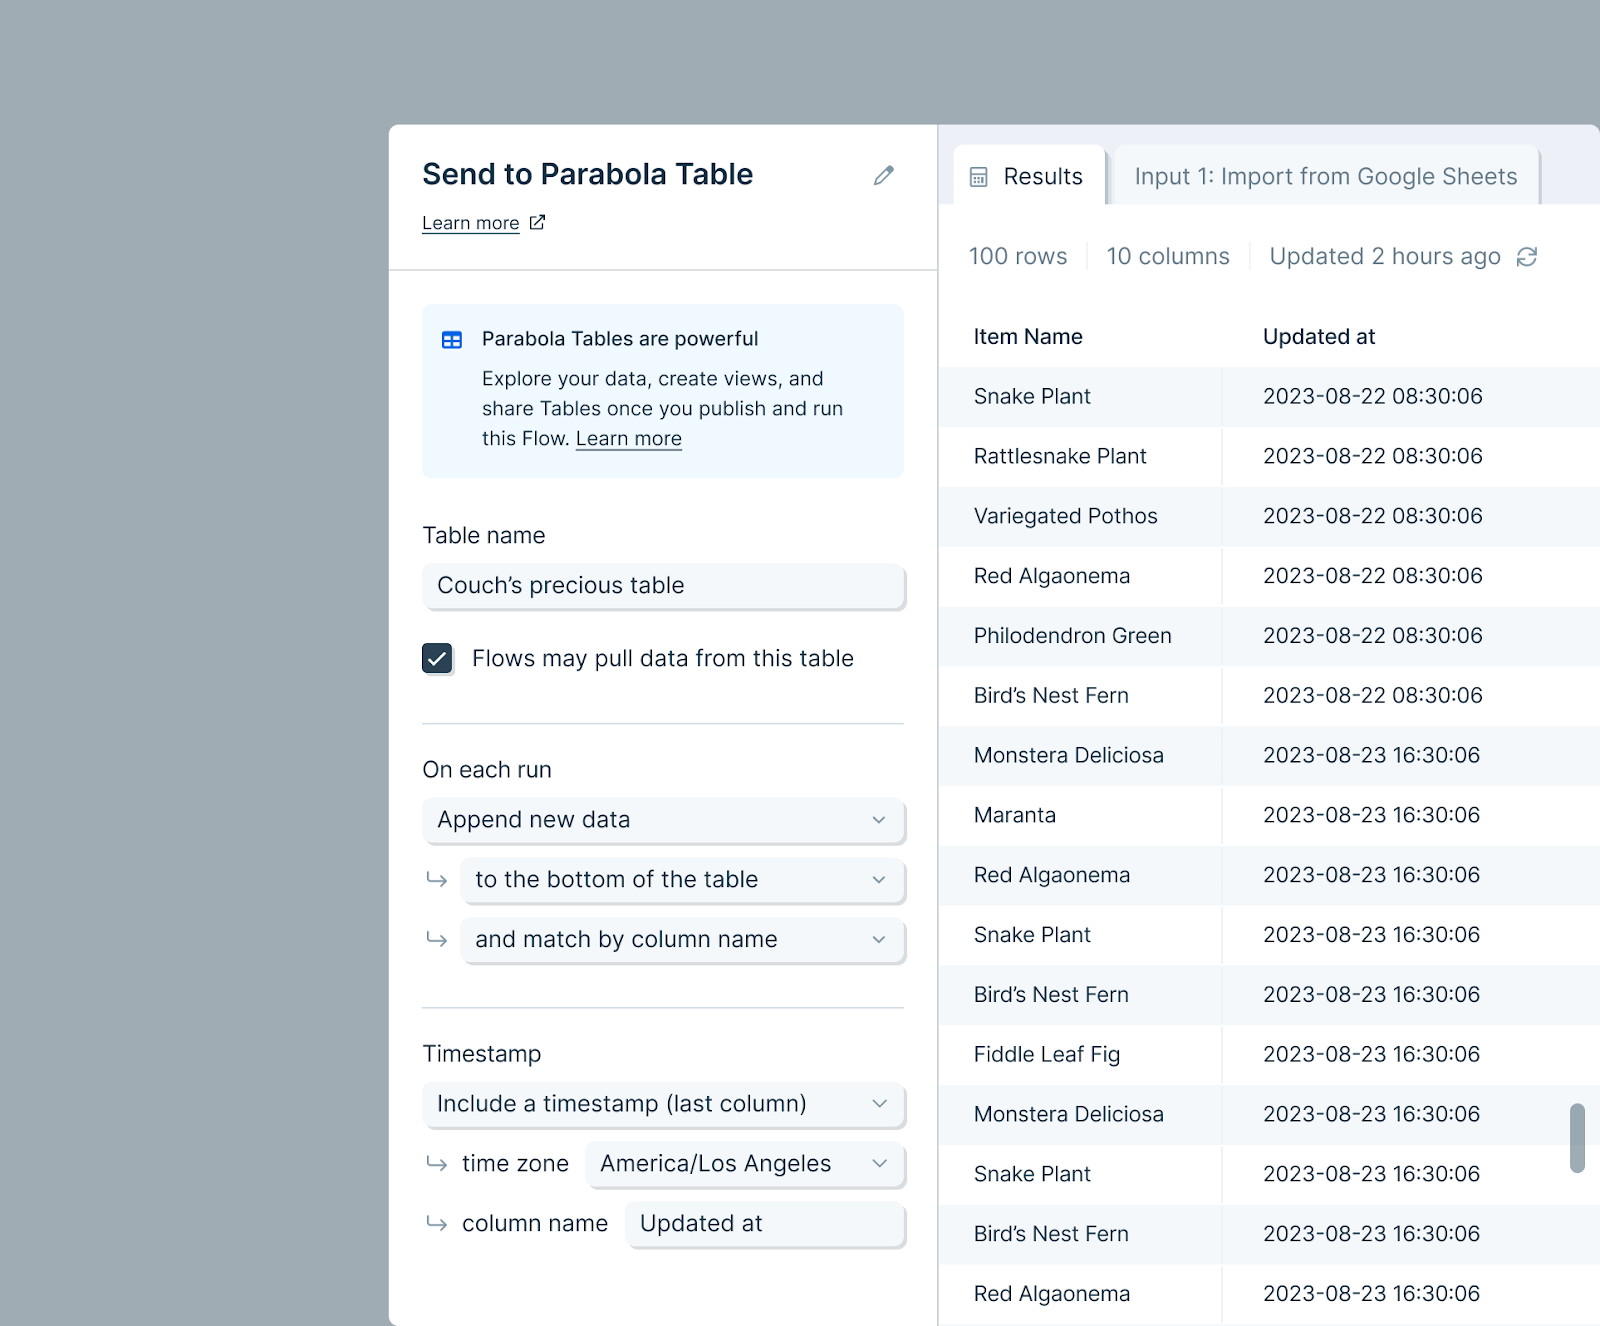
- By default, the Allow other Flows to pull data from this table option will be checked. When checked, teammates with any access to this Flow will be able to use this Table as source data in other Flows (using a Pull from Parabola Tables step). To prevent other Flows from pulling this Table, disable this option. Tables will still be visible in the Flow’s Live page, and can be pulled within the same Flow.
- Choose how the data will be added to the Table. Data can be overwritten on each run, appended to the bottom or top (prepend), or updated based on certain values (upsert).
Overwrite the table
- With this option, each run of your Flow will completely replace the data in the Table
- Note: To de-dupe a table, you'll need to overwrite the whole table.
Append new data
- With this option, each run of your Flow will add new rows either below, or above, the existing rows in the Table. All rows that are sent to this step will be added to the table
- Choose to match the columns in the input data in the step to the table by matching the position or name of each column in the table
- Optional: you can include a timestamp that indicates when each row was added to the table
Update existing rows
- With this option, each run of your Flow will attempt to update matching rows within the table
- Rows will be matched based on the combination of values in all columns selected. If duplicate matches exist, the step will error when the Flow runs. All matching column name must be present in both the data in the step and the table, and must be exact matches by name
- If a match is not found for a particular row in the step, it can be appended to the bottom of the table or discarded
- Optional: you can include a timestamp that indicates when each row was last updated
Storing data
Once you run your Flow, the Table will populate and update.Tables are useful to store data that can be accessed between Flows or to create reports when used in conjunction with the Visualize step. More info on how to visualize here.
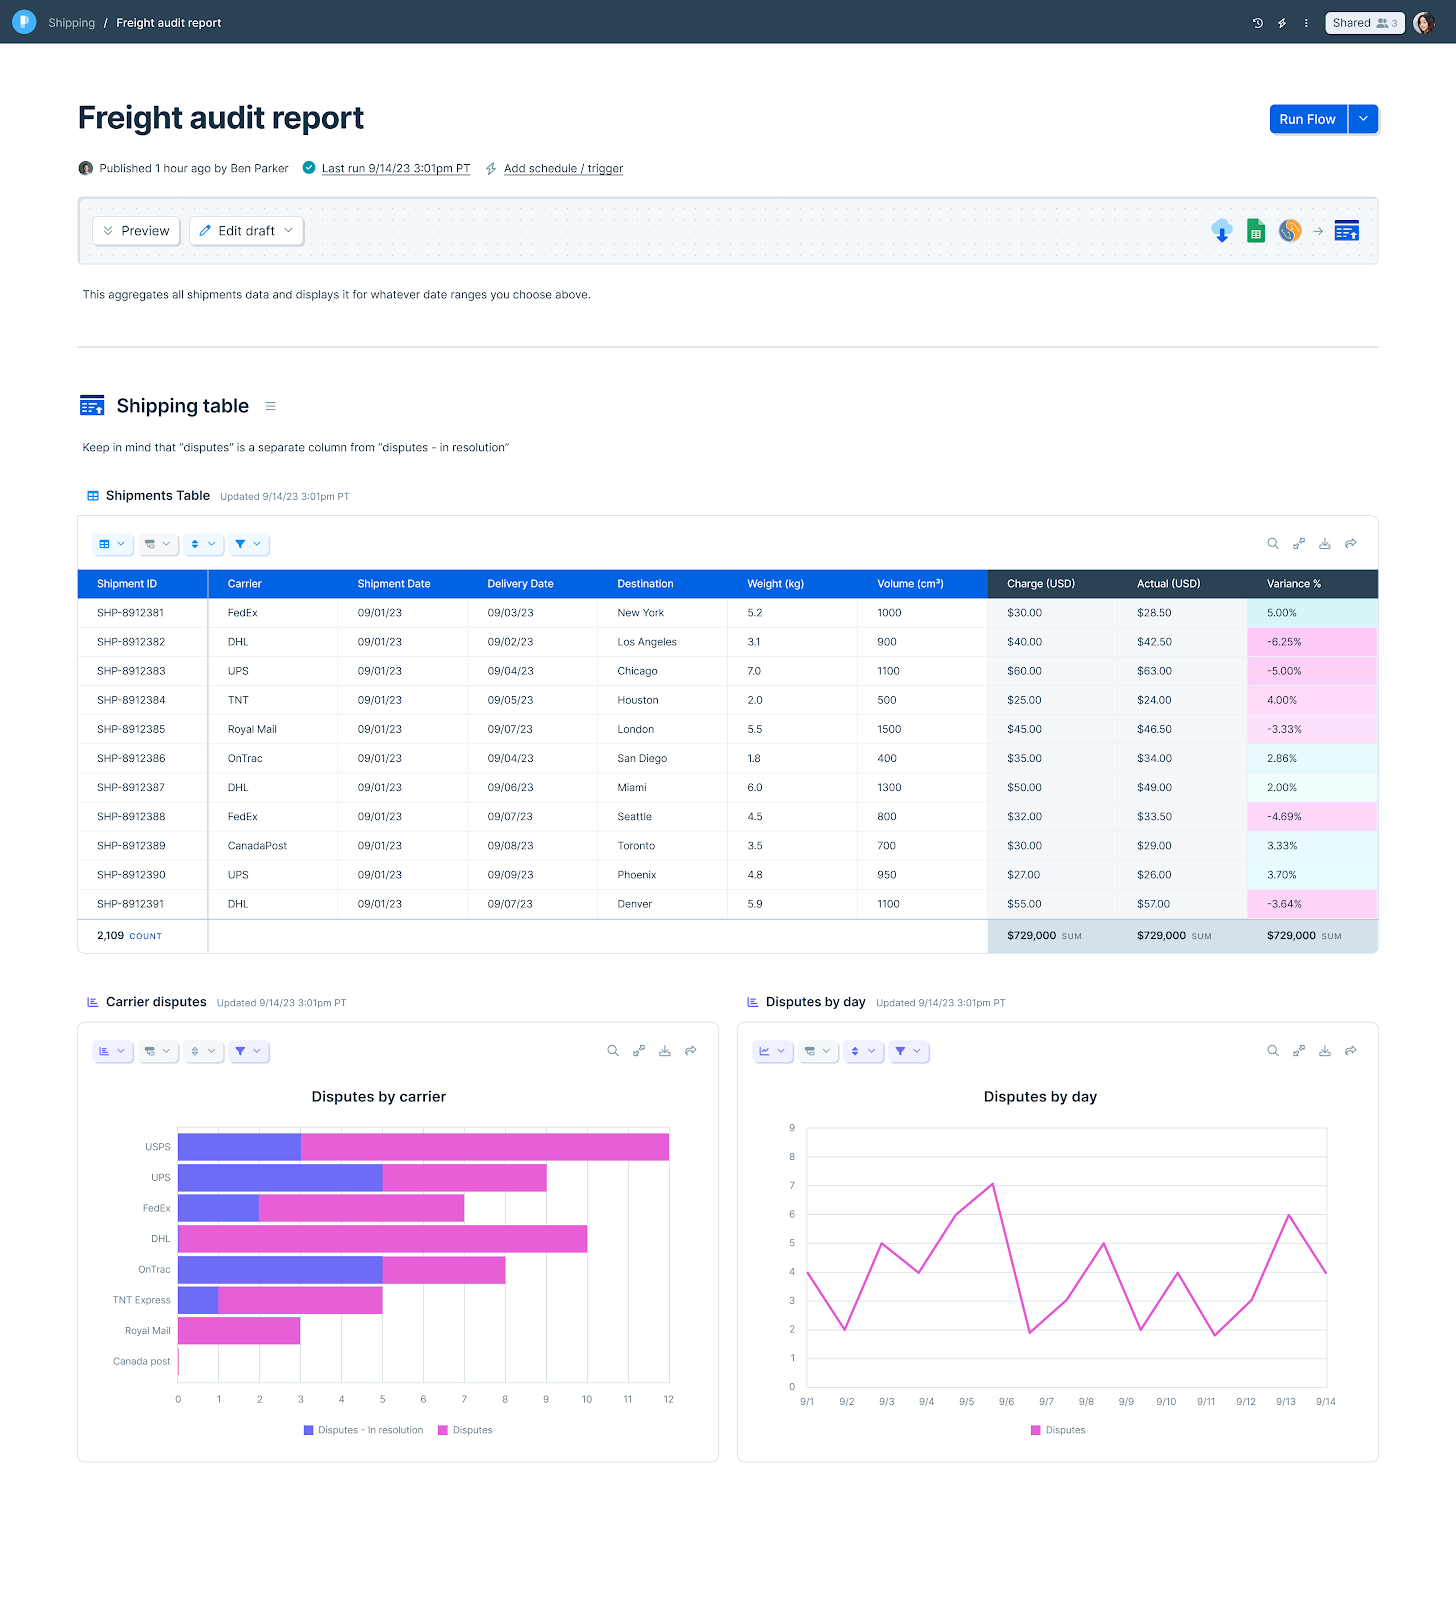
Running another Flow after updating a Table
Use an arrow to connect this step to other steps in a sequence. For example, you can connect this step to the Run another Flow step to first send data to a Table and then run a Flow that pulls data from that Table.
.png)
Helpful Tips
- The data you send through this step is stored by Parabola. We store the data as a convenience, so that the next time you open the Flow, the data is loaded into it. Your data is stored securely in an Amazon S3 Bucket, and all connections are established over SSL and encrypted.
- Your Table’s content is never discarded. To remove the data, you will need to delete the step from both draft and live versions of the flow (or delete the entire Flow).
- Parabola Tables will be limited to our current cell count limitation (described here).
- To clear a Table, we recommend adding a Limit rows step before your Send to Parabola Table step. Limit the dataset to 0 rows. Set the step to "Overwrite table". Run your Flow.
Integration:
PostgreSQL
The Pull from PostgreSQL step connects to and pulls from a PostgreSQL database and imports data into your flow. PostgreSQL is an open-source object-relational database management system.
Connect your PostgreSQL database
Double-click on the Pull from PostgreSQL step and click Authorize. These are the following fields required to connect:
- Hostname
- Username
- Password (optional)
- Database
- Port (optional; defaults to 5439)
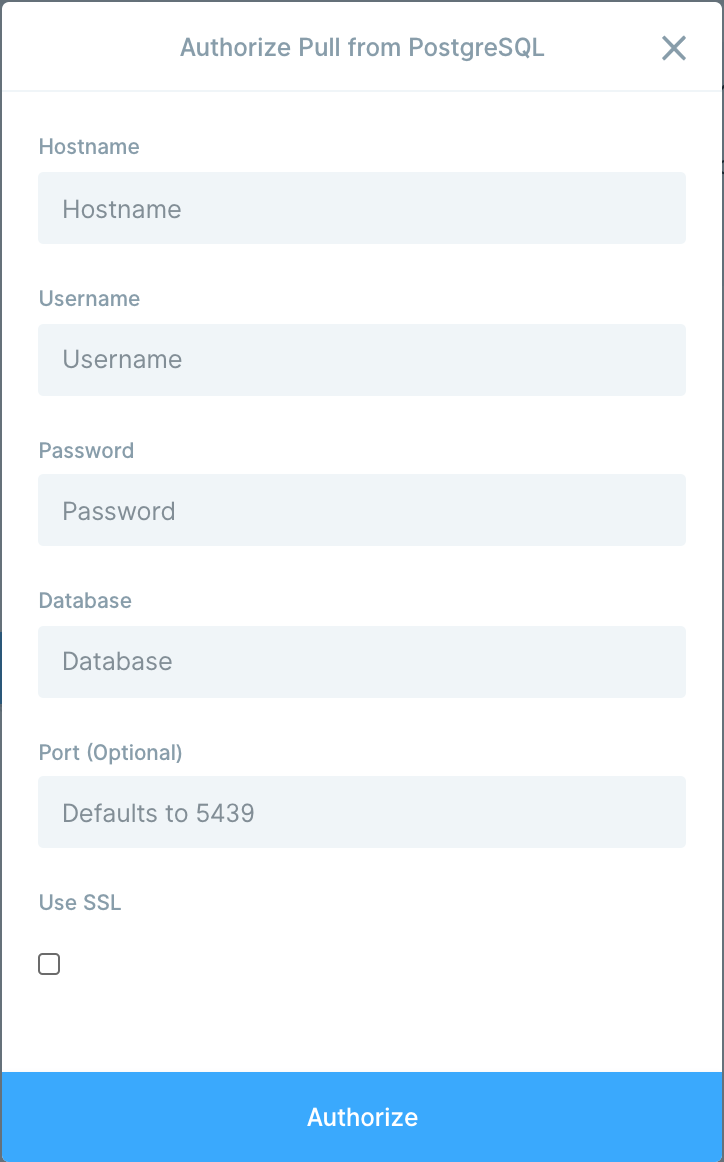
If your database does not require a value (for example, a password), you can leave that field blank. If you’re unsure where to find these values, check your connection string or ask your database administrator.
Choose what to import
After you connect, select a table. By default, the step runs the below query to pull the table:
select *
To narrow your results, enter a SQL statement in the ‘Query (optional)’ field. Writing a targeted query can make your imports faster and more reliable.
Get help from AI
When working in the ‘Query (optional)’ field, you’ll see two buttons that connect directly to AI chat:
- “Help write query”: Use this when you want AI to help you compose a query. Describe the data you want in plain language (for example, “Show me the last 30 days of shipped orders”), and AI will draft the SQL for you.
- “Optimize query”: Use this after you have a query. AI can help you fix errors, improve performance, or enhance the query based on more detailed instructions. This is especially useful if you run into SQL syntax errors.
Both buttons open the AI chat interface, where you can continue refining the query until it’s ready.
The Send to PostgreSQL step can insert and update rows in a remote PostgreSQL server. PostgreSQL is an open source relational database management system.
Connect your PostgreSQL server
Double-click on the Pull from PostgreSQL step and click Authorize. These are the following fields required to connect:
- Hostname
- Username
- Password
- Database
- Port (Optional)
You should be able to find these fields by viewing your PostgreSQL profile.
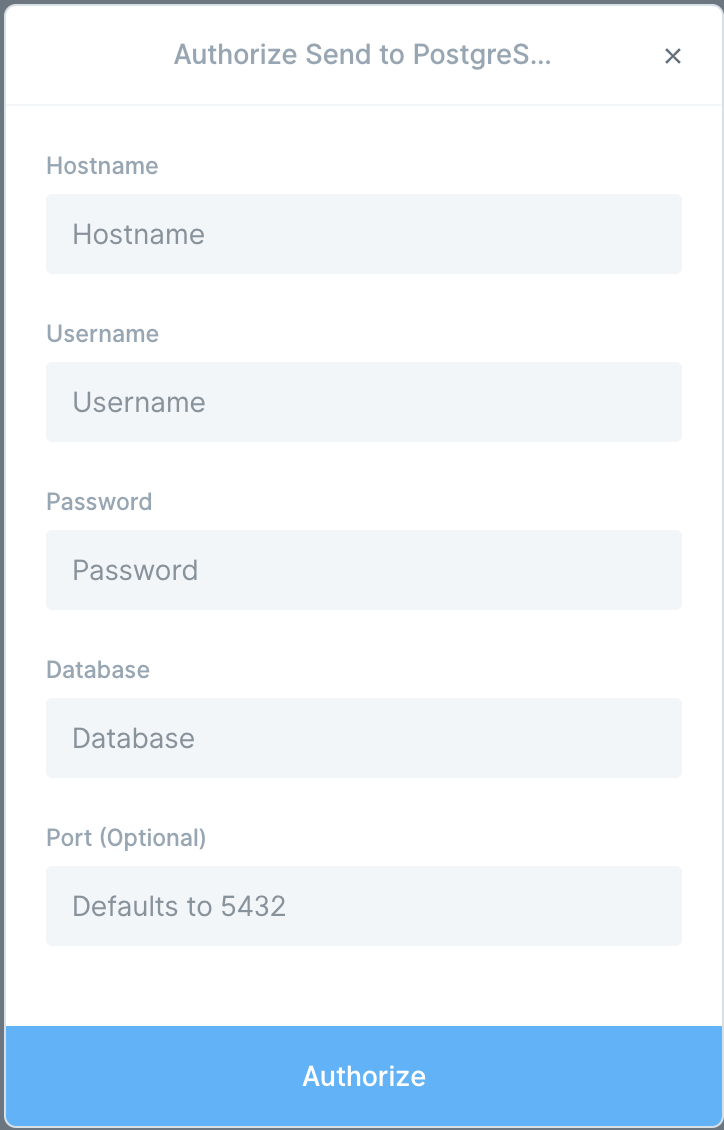
If no port is specified during authorization, this step will default to port 5432.
You can leave fields blank (like "Password") if they are not needed for the database to authorize connection.
Custom settings
Once you are successfully connected to your server, you'll first see a dropdown option to select the table you'd like to send data to.
Maximum Connections
By default, this field is set to 20, which should be safe for most databases. This setting controls how many connections Parabola generates to your database in order to write your changes faster. The number of rows you are trying to export will be divided across the connections pool, allowing for concurrent and fast updates.
Be aware, every database has its own maximum number of connections that it will accept. It is not advisable to set the Maximum Connections field in Parabola to the same number of connections that your database max is set at. If you do that, you will be using every connection when the flow runs, and nothing else will be able to connect to your database. 50% - 60% of the total available connections is as high as you should go. Talk to the whoever runs, manages, or set up your database to find out how many connections it can handle.
If you set this field to less than 1 or more than the total number allowed by your database, the step will error.
Operations
Next, you'll select an Operation. The available Operation options are:
- Insert: Inserts new rows in the database
- Upsert: Updates rows if possible, and inserts new rows if not
- Update: Only updates rows
Insert
The Insert option will insert new rows in the database. Once you select the "Insert" operation, you'll be asked to map your columns in Parabola to columns from your selected PostgreSQL table. You can leave some column mappings blank. If you're using the Insert operation, make sure that it's okay that Parabola create these new rows in your table. For example, you may want to check for possible duplicates.
Upsert
The Upsert option will updates rows if possible, and inserts new rows if not. The Upsert operation requires you to specify the primary key of the database table ("Unique Identifier Column in Database"), or the column that contains unique values in Parabola ("Unique Identifier Column in Results"). Mapping these columns is important so Parabola can use to figure out which rows to update versus insert new rows. A primary key / unique identifier must be configured on the database table in order for this dropdown to show any options.
Then, you need to map your columns in Parabola to columns from your selected PostgreSQL table.
Update
The Update option will only update rows. It will not insert any new rows. The Update operation requires you to specify the primary key of the database table ("Unique Identifier Column in Database"), or the column that contains unique values in Parabola ("Unique Identifier Column in Results"). Mapping these columns is important so Parabola can use to figure out which rows to update. A primary key / unique identifier must be configured on the database table in order for this dropdown to show any options.
Then, you need to map your columns in Parabola to columns from your selected PostgreSQL table.
How this step deals with errors
The Send to PostgreSQL step handles errors in a different way than other steps. When the flow runs, the step attempts to export each row, starting at the top of the table and processing down until every row has been attempted. Most exports in Parabola will halt all execution if a row fails, but this export will not halt. In the event that a row fails to export, this step will log the error, but will skip past the row and continue to attempt all rows. When the step finishes attempting every row, it will either be in a normal (successful) state if every row succeeded, or it will be in a error (failure) state if at least 1 row was skipped due to errors.
Helpful tips
- The Send to PostgreSQL step can only send strings. All values will be sent as a string. If you encounter an error when running the Send to PostgreSQL step, please double-check that the field in PostgreSQL is set to accept string values.
- Null (blank) values will create empty strings - meaning this step will not be able to send null values to your PostgreSQL database
- The names of your columns in Parabola must match the names of the fields in your database. Use a Rename columns step to accomplish this before sending.
- We recommend having all of your columns mapped. Any unmapped columns may cause issues during your export. If you need to remove any unmapped columns, you can utilize the Select Columns step.
Integration:
Ramp
Integration:
Recharge
How to authenticate
Recharge uses API token authentication for secure access to your subscription data. For more information, check out the Recharge API Token documentation.
Generate your API token in Recharge
- Log in to your Recharge merchant portal.
- In the left navigation menu, select Tools & apps.
- Click on API tokens.
- Click Create an API token.
- Fill in the required fields:
- Name: Give your token a descriptive name (e.g., "Parabola Integration").
- Contact email: Enter an email address for notifications about this token.
- Set the permission scopes for your token:
- Configure each resource with at least Read access (or Read and Write access if you plan to update data in the future).
- Parabola typically only needs Read access to pull data for reporting and analysis.
- Click Save to generate your token.
- Copy your API token immediately and store it securely—you won't be able to view it again.
Note: Only store owners can create and view API tokens by default. Store owners can grant additional staff access to the API Tokens page if needed.
Connect in Parabola
- In your Parabola flow, add a Pull from Recharge step.
- Click Authorize in the step settings.
- Paste your Recharge API token when prompted.
Parabola will securely store your credentials and use them to authenticate each request to Recharge.
Available data
Using the Recharge integration in Parabola, you can pull the following data from your subscription store:
- Customers: Customer records including names, email addresses, Shopify customer IDs, and account creation dates.
- Subscriptions: Active, cancelled, and expired subscriptions with billing frequency, next charge dates, order intervals, customer associations, and status information.
- Orders: Subscription orders with statuses (success, queued, error, cancelled), processing details, scheduled dates, and subscription linkages.
- Charges: Payment transactions including charge amounts, currencies, statuses (success, error, refunded, pending), and associated orders and subscriptions.
- Products: Product catalog data with titles, external product IDs (such as Shopify product IDs), and creation timestamps.
- Plans: Subscription plans and pricing details including billing intervals, plan names, and price points.
- Addresses: Customer shipping addresses with full location details, country information, and customer associations.
- Payment methods: Payment method records linked to customers, including payment types and creation dates.
Common use cases
- Track active, cancelled, and expired subscriptions to identify churn patterns, calculate retention rates, and flag at-risk subscribers for proactive intervention.
- Reconcile data from Charges, Orders, and Subscriptions to validate billing accuracy, track payment failures, and reconcile Recharge revenue with your accounting system or ERP.
- Pull Plans and Subscriptions data to compare performance across different billing intervals, pricing tiers, and product offerings—helping you optimize your subscription catalog.
- Identify charges with "error" or "pending" statuses and trigger automated workflows to notify customers, retry payments, or alert your customer success team.
- Pull Subscriptions with next charge dates to forecast upcoming revenue, plan inventory needs, and project cash flow for financial planning.
Tips for using Parabola with Recharge
- Set your Parabola flow to refresh daily or hourly to keep subscription metrics current. Use scheduled runs to monitor new subscriptions, track payment failures, or generate daily performance summaries.
- Use filters to focus on actionable data, such as subscriptions by status (active, cancelled, expired) or charges by status (error, pending), to isolate records that need immediate attention.
- Join related data for complete insights to see subscriber details or link charges with orders to validate payment processing.
- Add email or Slack alerts in Parabola to notify your team when payment failures spike, cancellation rates increase, or high-value subscriptions are cancelled.
- Join Recharge data with other systems, including Shopify orders, fulfillment data from your 3PL, or financial records from NetSuite to create end-to-end subscription lifecycle reports and reconciliations.
- Export cleaned and transformed Recharge data to a Visualization, Google Sheets, Airtable, or your data warehouse to power live dashboards and executive reporting.
By connecting Recharge with Parabola, you automate the manual work of pulling subscription data, building reports, and monitoring performance—freeing your team to focus on growing your subscriber base and improving retention.
Integration:
Redshift
The Pull from Redshift step connects to and pulls data that is stored in your Amazon Redshift database. Amazon Redshift is a data warehouse product within the AWS ecosystem.
Connect your Amazon Redshift database
Double-click on the Pull from Redshift step and click Authorize. Enter the following connection details:
- Hostname
- Username
- Password (optional)
- Database
- Port (optional; defaults to 5439)
You can leave optional fields (like password) blank if they aren’t required to authorize the connection.

Troubleshooting authentication errors
Here are some common error messages you might see when authorizing the Redshift integration, along with steps to resolve them.
Error:
Error occurred fetching tables:connect ECONNREFUSED <ip address>:5439
What it means:
Your Redshift cluster is not publicly accessible.
How to fix it:
Parabola requires network access to your Redshift cluster. You’ll need to update your Redshift configuration to make it a public cluster or ensure that Parabola’s IP addresses are whitelisted in your VPC security group.
Error:
Error occurred fetching tables: getaddrinfo EAI_AGAIN testdata123
What it means:
Your Redshift credentials are incorrect.
How to fix it:
Double-check that you entered the correct username and password for your Redshift database. If you use IAM authentication or rotating credentials, confirm that the credentials are still valid.
Error:
Error occurred fetching tables: getaddrinfo ENOTFOUND testdata123
What it means:
The hostname provided is invalid or unreachable.
How to fix it:
Verify that you entered the full and correct Redshift endpoint, which should look like:
example-cluster.abc123xyz.us-east-1.redshift.amazonaws.com
Do not include the database name or protocol (for example, https://) in the hostname field.
Choose what to import
Once connected, you’ll see a dropdown menu where you can select a table from your Redshift database.
By default, Parabola pulls the entire table using the query:
select *
If you’d like to pull in more specific data—or reduce the size of your import—you can write your own SQL statement.
Enter your custom query in the ‘Query (optional)’ field.
Get help from AI
When working in the ‘Query (optional)’ field, you’ll see two buttons that connect directly to AI chat:
- “Help write query”: Use this when you want AI to draft a query for you. Describe the data you want in plain language (for example, “Show me the last 30 days of shipped orders”), and AI will write the SQL.
- “Optimize query”: Use this after you’ve written a query. AI can help fix errors, improve performance, or enhance the query based on your instructions. This is especially useful if you run into SQL syntax errors.
Both buttons open the AI chat interface, where you can refine the query until it’s ready to use.
The Send to Redshift step lets you insert, update, upsert, or replace entire tables in your Amazon Redshift database.
Connect your Amazon Redshift database
Double-click on the Send to Redshift step and click “Authorize”.
Enter the following connection details:
- Hostname
- Username
- Password (optional)
- Database
- Port (optional; defaults to 5439)
You can leave optional fields (like password) blank if they aren’t required to authorize the connection.
You can find these fields in your Redshift connection settings within the AWS console or your database client.
Troubleshooting authentication errors
Here are some common error messages you might see when authorizing the Redshift integration, along with steps to resolve them.
Error:
Error occurred fetching tables: connect ECONNREFUSED <ip address>:5439
What it means:
Your Redshift cluster is not publicly accessible.
How to fix it:
Parabola requires network access to your Redshift cluster. You’ll need to update your Redshift configuration to make it a public cluster or ensure that Parabola’s IP addresses are whitelisted in your VPC security group.
Error:
Error occurred fetching tables: getaddrinfo EAI_AGAIN testdata123
What it means:
Your Redshift credentials are incorrect.
How to fix it:
Double-check that you entered the correct username and password for your Redshift database. If you use IAM authentication or rotating credentials, confirm that the credentials are still valid.
Error:
Error occurred fetching tables: getaddrinfo ENOTFOUND testdata123
What it means:
The hostname provided is invalid or unreachable.
How to fix it:
Verify that you entered the full and correct Redshift endpoint, which should look like:
example-cluster.abc123xyz.us-east-1.redshift.amazonaws.com
Do not include the database name or protocol (for example, https://) in the hostname field.
Configuring your step
Once connected, you’ll see two dropdown menus:
- Select the desired operation: Create records, Update records, Create or Update (Upsert), Replace entire table
- Select the table you’d like to send data to.
Operations
Choose an operation to define how your data is written to Redshift.
The available options are:
- Create records — Inserts new rows
- Update records — Updates existing rows and inserts new ones as needed
- Create or Update (Upsert) — Updates existing rows only
- Replace entire table — Deletes all rows in the selected table, then inserts new ones below the header row.
Create records
The Create records operation creates new rows in your Redshift table.
After selecting Create records, you’ll be prompted to map your Parabola columns to columns in your Redshift table.
You can leave some column mappings blank.
Before running the flow, ensure it’s acceptable to insert new rows—especially if your table does not enforce unique keys.
Update records
The Update records operation modifies existing rows without inserting new ones.
You’ll need to specify:
- The Unique Identifier Column in Database — the primary key in Redshift
- The Unique Identifier Column in Results — the column in Parabola that contains matching unique values
Mapping these columns allows Parabola to determine which rows to update versus insert.
Your Redshift table must have a primary key defined for this dropdown to appear.
Create or Update (Upsert)
The Create or Update (Upsert) operation updates rows if a match is found, and inserts new rows if not.
Just like Update, you’ll need to define both the Unique Identifier Column in Database and the Unique Identifier Column in Results so Parabola can match rows to update.
Replace entire table
The Replace entire table operation clears all rows in your target table and replaces them with new rows from your flow.
The table schema (your header columns) remains intact.
This option is useful when you need to fully refresh your dataset (for example, daily aggregates or full snapshot loads).
Tip: Parabola executes this operation as a transaction by deleting all rows from the table, then performing a bulk insert.
If any part of the operation fails, the transaction will be reversed, leaving your table unchanged.
How this step handles data types
Unlike other database exports that send all values as strings, Send to Redshift automatically casts each value according to your target table’s schema.
This ensures that numeric, boolean, and date fields are inserted with the correct types—reducing errors during data loads.
If a value cannot be cast correctly, the step will error and the flow run will fail.
Troubleshooting
Amazon Redshift can sometimes produce error messages that are vague or hard to interpret—especially when inserting data with mismatched types.
Below are some real-world examples you might encounter:
Error running insert operation: invalid input syntax for type real: "Test Product"
Error running insert operation: value "1000000" is out of range for type smallint
Error running insert operation: function 2937 returned NULL
If you encounter these errors:
- Check your column mappings. Make sure each column in Parabola maps to a compatible Redshift field type.
- Inspect column types directly in Redshift. Use a query like SELECT column_name, data_type FROM information_schema.columns WHERE table_name = 'your_table';
- Convert data types in advance. Use steps like Format numbers, Format dates, or Add text column to match the schema before export.
- Run smaller test batches to pinpoint which rows are failing.
Tip: These Redshift errors can be hard to decode—even for experienced users. If you’re not sure what an error means, you can ask Parabola’s AI chat. It’s designed to help you interpret SQL errors and suggest fixes. If the AI chat also cannot determine the meaning of the error message, it will still try to guide you toward checking data types, mappings, and schema consistency.
How this step handles errors
When your flow runs, the step attempts to export all rows in batches.
If a row fails to export, the entire export will fail! Any rows that were created/updated before the failure are undone so that you can safely try the entire flow run again.
After processing all rows, the step will show:
- Success — if every row was exported successfully
- Error — if one or more rows failed
If it errors, we will return the error message directly from Redshift.
Helpful tips
- The names of your columns in Parabola must match the field names in your Redshift table. Use a Rename columns step beforehand if needed.
- Null (blank) values are sent as NULL.
- We recommend mapping all columns to avoid schema mismatches.
- To remove unmapped columns, use an Edit columns step before exporting.
Integration:
Sage Supply Chain Intelligence
How to authenticate
- Get your credentials from Sage Supply Chain Intelligence.
- Log in to Sage Supply Chain Intelligence and click on your avatar
- Click My Account
- On the Your Account page, click the GENERATE API KEY button
- The API Key will appear as a string of characters consisting of numbers, letters, and symbols. We recommend copying this string as it will be hidden from view on subsequent visits to this page
- Connect in Parabola.
- Add a Pull from Sage Supply Chain Intelligence (Anvyl) integration to your flow in Parabola.
- Click Authorize and enter your API key/token in the credentials form. Parabola will use this key to authorize requests and let you choose which Sage Supply Chain Intelligence resources (purchase orders, shipments, parts, etc.) to pull.
Available data
- Purchase orders & lines: Purchase order number, supplier, status, ship-to/location, shipping method, target/expected ship and delivery dates, currency, created/updated timestamps, and line items (SKU/part, quantity ordered, quantity received, unit price, UOM, notes/tags).
- Shipments & tracking: Shipment identifiers (containers, bills of lading, airway bills), carrier/mode, ship-from/ship-to locations, estimated and actual pickup/departure/arrival/delivery timestamps, milestone statuses (to be shipped, in transit, delivered, received, closed), and quantities by line/SKU.
- Products/parts: SKU/part number, name/description, category/tags, default UOM, supplier relationships, commercial identifiers (e.g., UPC/ASIN if present), HTS/tariff classification fields, pricing brackets (currency, unit price, minimum order quantity), and lead-time days by supplier or break point.
Common use cases
- Three-way match and discrepancy detection
Identify delivery and invoicing discrepancies by comparing Sage Supply Chain Intelligence purchase orders against delivery receipts and invoices. Flag discrepancies in real time with automatic Slack, Teams, or email alerts. - Purchase order tracking and reporting
Pull detailed purchase order, supplier, and shipment data from Sage Supply Chain Intelligence to generate unified reports enriched with real-time statuses, milestones, and delivery estimates. Use stored expected lead time estimates to help fill in expected milestones and schedules within Sage Supply Chain Intelligence. - Landed cost and lead time analysis
Combine Sage Supply Chain Intelligence purchase order data with freight, duty, and cost files to calculate true landed costs per SKU or shipment. Combine production and transit lead times for more accurate expected lead times. - Split shipment management
Combine demand and shipping availability data to intelligently split orders. Automate tracking and creation of split shipments by matching Sage Supply Chain Intelligence order data with delivery updates, ensuring quantities and shipment statuses remain accurate across systems. - HTS classification
Extract product and supplier data from Sage Supply Chain Intelligence to classify SKUs by HTS code and standardize tariff data for customs and compliance. - Supplier scorecarding
Monitor supplier lead times, milestone completion, and on-time delivery rates using automated reports and dashboards. - Delayed order and exception alerting
Trigger Slack or email notifications and update systems when orders are delayed, shipments miss milestones, quantities don’t reconcile, or supplier timelines deviate from plan. - Order and product data enrichment
Use product data and attributes from systems like NetSuite or your PLM to fill in necessary order and line-item fields within Sage Supply Chain Intelligence.
Tips for using Parabola with Sage Supply Chain Intelligence
- Normalize identifiers early by mapping purchase order numbers, SKUs, and supplier IDs to your ERP/PLM keys so joins are reliable across systems.
- Blend shipments with purchase orders to compute real-time status, expected vs. actual dates, and exceptions.
- Automate exception alerts to send your team a Slack or email alert from Parabola after calculating mismatches (price/quantity/dates).
- Schedule your flow to run hourly or daily so dashboards and alerts stay current.
- Keep costs accurate by joining line-item prices and quantities with freight, duty, and accessorials to calculate landed cost per SKU, order, and shipment.
- Make lead times transparent by storing expected production and transit lead-time rules in Parabola tables so they’re easy to adjust as suppliers or lanes change.
Integration:
Salesforce
The Pull from Salesforce step gives you the ability to bring data from your Salesforce CRM into Parabola by object type and fields. You can also filter your results by a selected View which can be set within Salesforce.
Connect your Salesforce account
Connect your Salesforce account by clicking Authorize and following the prompts to log in with your Salesforce details.

Custom settings
When pulling in data from Salesforce, you can select the Object Type and View. Object Types are based upon the objects you would find in Salesforce, for example, Accounts, Opportunities, and Contacts.
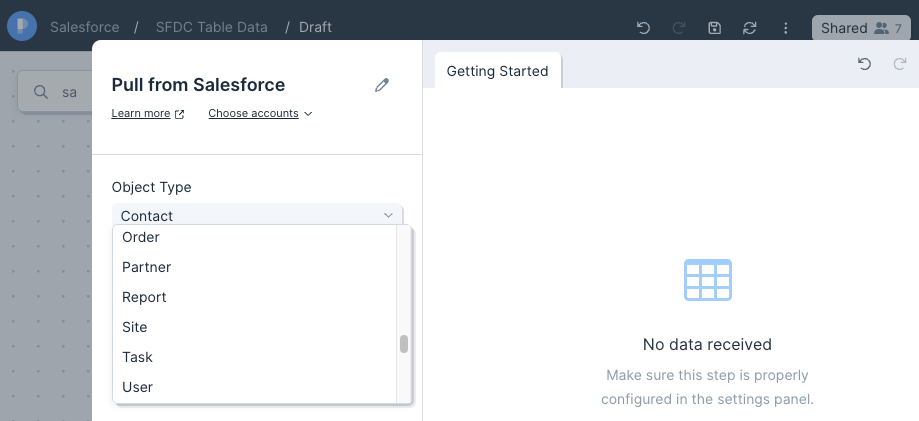
Views give you the ability to trim down the results of your pull using Salesforce's native View criteria as a filter.
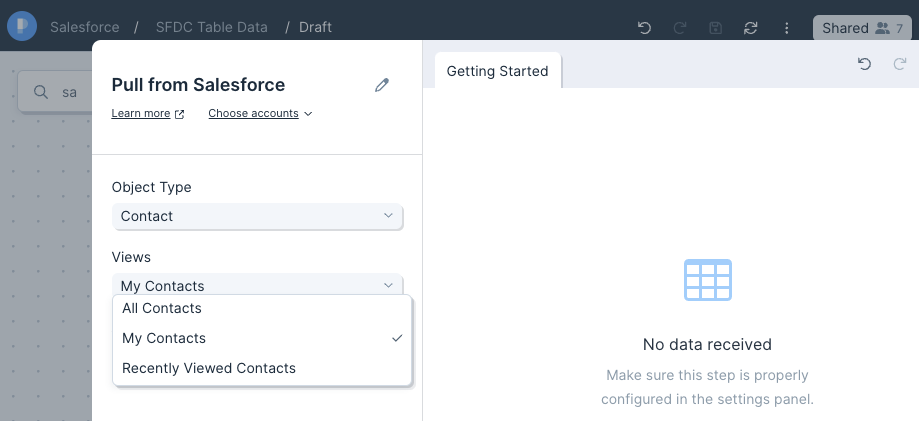
Your data will return in the same structure as your View within Salesforce. Under "Advanced Settings", you'll see the ability to choose the Fields that return with your data. This will override the default structure set from your selected View.

Helpful tips
- The Pull from Salesforce step will not connect to Salesforce Essential accounts.
- Reports are limited to 2000 rows by the Salesforce API. To overcome it, you need to pull in the underlying objects into Parabola with Pull from Salesforce step and recreate the logic of the view.
Use the Send to Salesforce step to add or update data from Parabola to your Salesforce CRM.
Connect your Salesforce account
Connect your Salesforce account by clicking Authorize and following the prompts to log in with your Salesforce details.
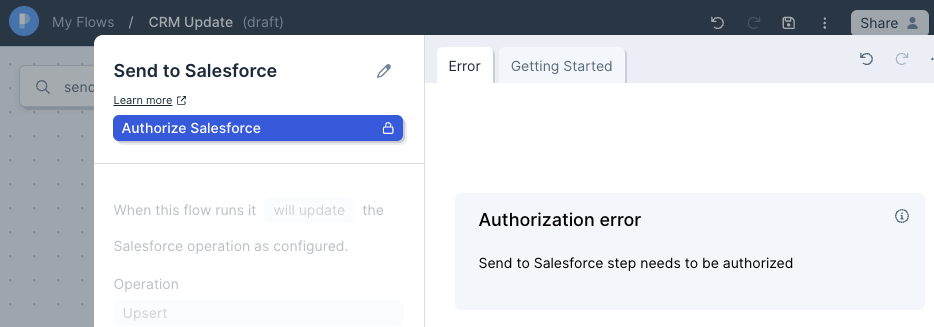
Default settings
The default Operation will be to Upsert, which will map your data to existing records and create new records if there is no match. You can also select Insert, which will only create new records, but this may create duplicate records.
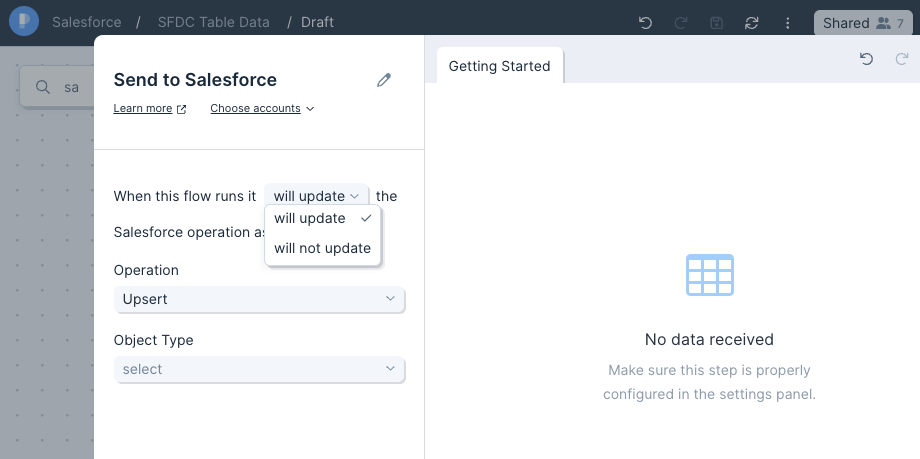
Custom settings
Select the appropriate Object Type to ensure your records are correctly mapping to your CRM. These Object Types are similar to the Pull from Salesforce step, and include Account, Opportunities, Contact, amongst others.
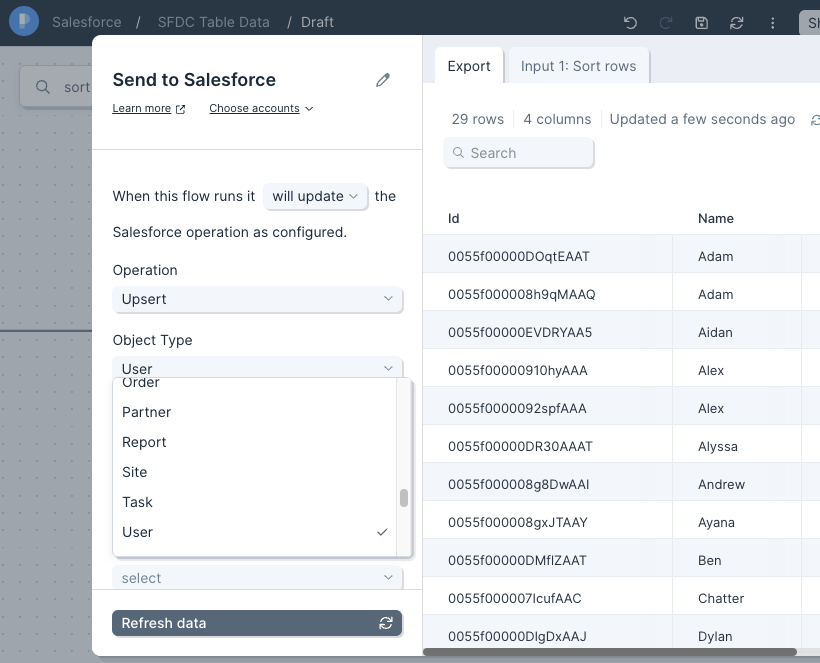
All columns must be mapped to their corresponding Salesforce fields, and the Upsert operation requires a column to be apped to "Id". This is the Id of the object you are targeting, such as lead or contact. To map your columns, click the dropdown menus and select each matching Salesforce field. The names of your columns do not need to match the fields.

Helpful tips
- The Send to Salesforce step will not connect to Salesforce Essential accounts.
- Salesforce ignores empty values when updating records. To upsert (replace) existing values with blank values, replace your blank field values with #N/A. You can use the Find and replace step to accomplish this.
- The Salesforce API may send back a "success" response, even if there were errors in the request. If you're able to access SF Setup Page -> Bulk Data Load Jobs, you'll be able to see the data loads from the last 7 days. Find the Job related to the Parabola upload to view the result of the upload, along with error messaging to get a better understanding of any upload errors.
Integration:
Sample data
The Use sample data step allows you to quickly begin building a Flow leveraging sample datasets. This is particularly useful when you want to test Parabola’s data transformation and visualization features, but don’t necessarily want to integrate your live data sources yet.

This step provides both generic data, such as US census and stock market data, as well as data that resembles specific tools like Shopify, ShipHero, Salesforce, and NetSuite.
Using the step
Simply drag a Use sample data step from the Integrations tab of the search bar onto the canvas to immediately begin seeing data in Parabola. Double-click the step to view and modify the sample data that you’re working with.
Sample data options
This step includes both generic datasets as well as tool-specific datasets.
Beyond generic datasets like census and stock market data, the step also includes datasets that resemble what the data will actually look like when you pull it from another system.
For instance, if you select the “Shopify: Orders” sample data, the table returned will actually resemble the Pull from Shopify step’s output.
Next steps
Once you have your sample data loaded up, imagine what you might do if you were working with that data in a spreadsheet. Would you do any filtering? What math calculations might you apply? Do the dates need to be reformatted?
Once you know how you want the data to be transformed, then you can shift focus to what step you need to use to apply that transformation. Check out the Transformations section of the search bar (and search for keywords) to find the right step for the job.
Integration:
SAP S/4HANA
Integration:
Send emails by rows
The Send emails by row step sends one email per row in your dataset using the email address listed in a specific column. This is useful for sending personalized messages to a list of recipients. The step supports up to 75 emails per run and all messages are sent from team@parabolamail.io, with a footer that says "Powered by Parabola."
Setting Up the Step
- Add the step to your Flow by dragging it onto the canvas.
- Connect it to the last step that contains your column of email addresses.
- Open the step to configure its settings.
- Recipients: Choose the column with the email addresses.
- Body Format: Choose between plain text and HTML.
- Subject and Body: These are required fields. You can personalize them by merging values from other columns using
{curly braces}. - Reply To: Enter the email address where replies should be sent.
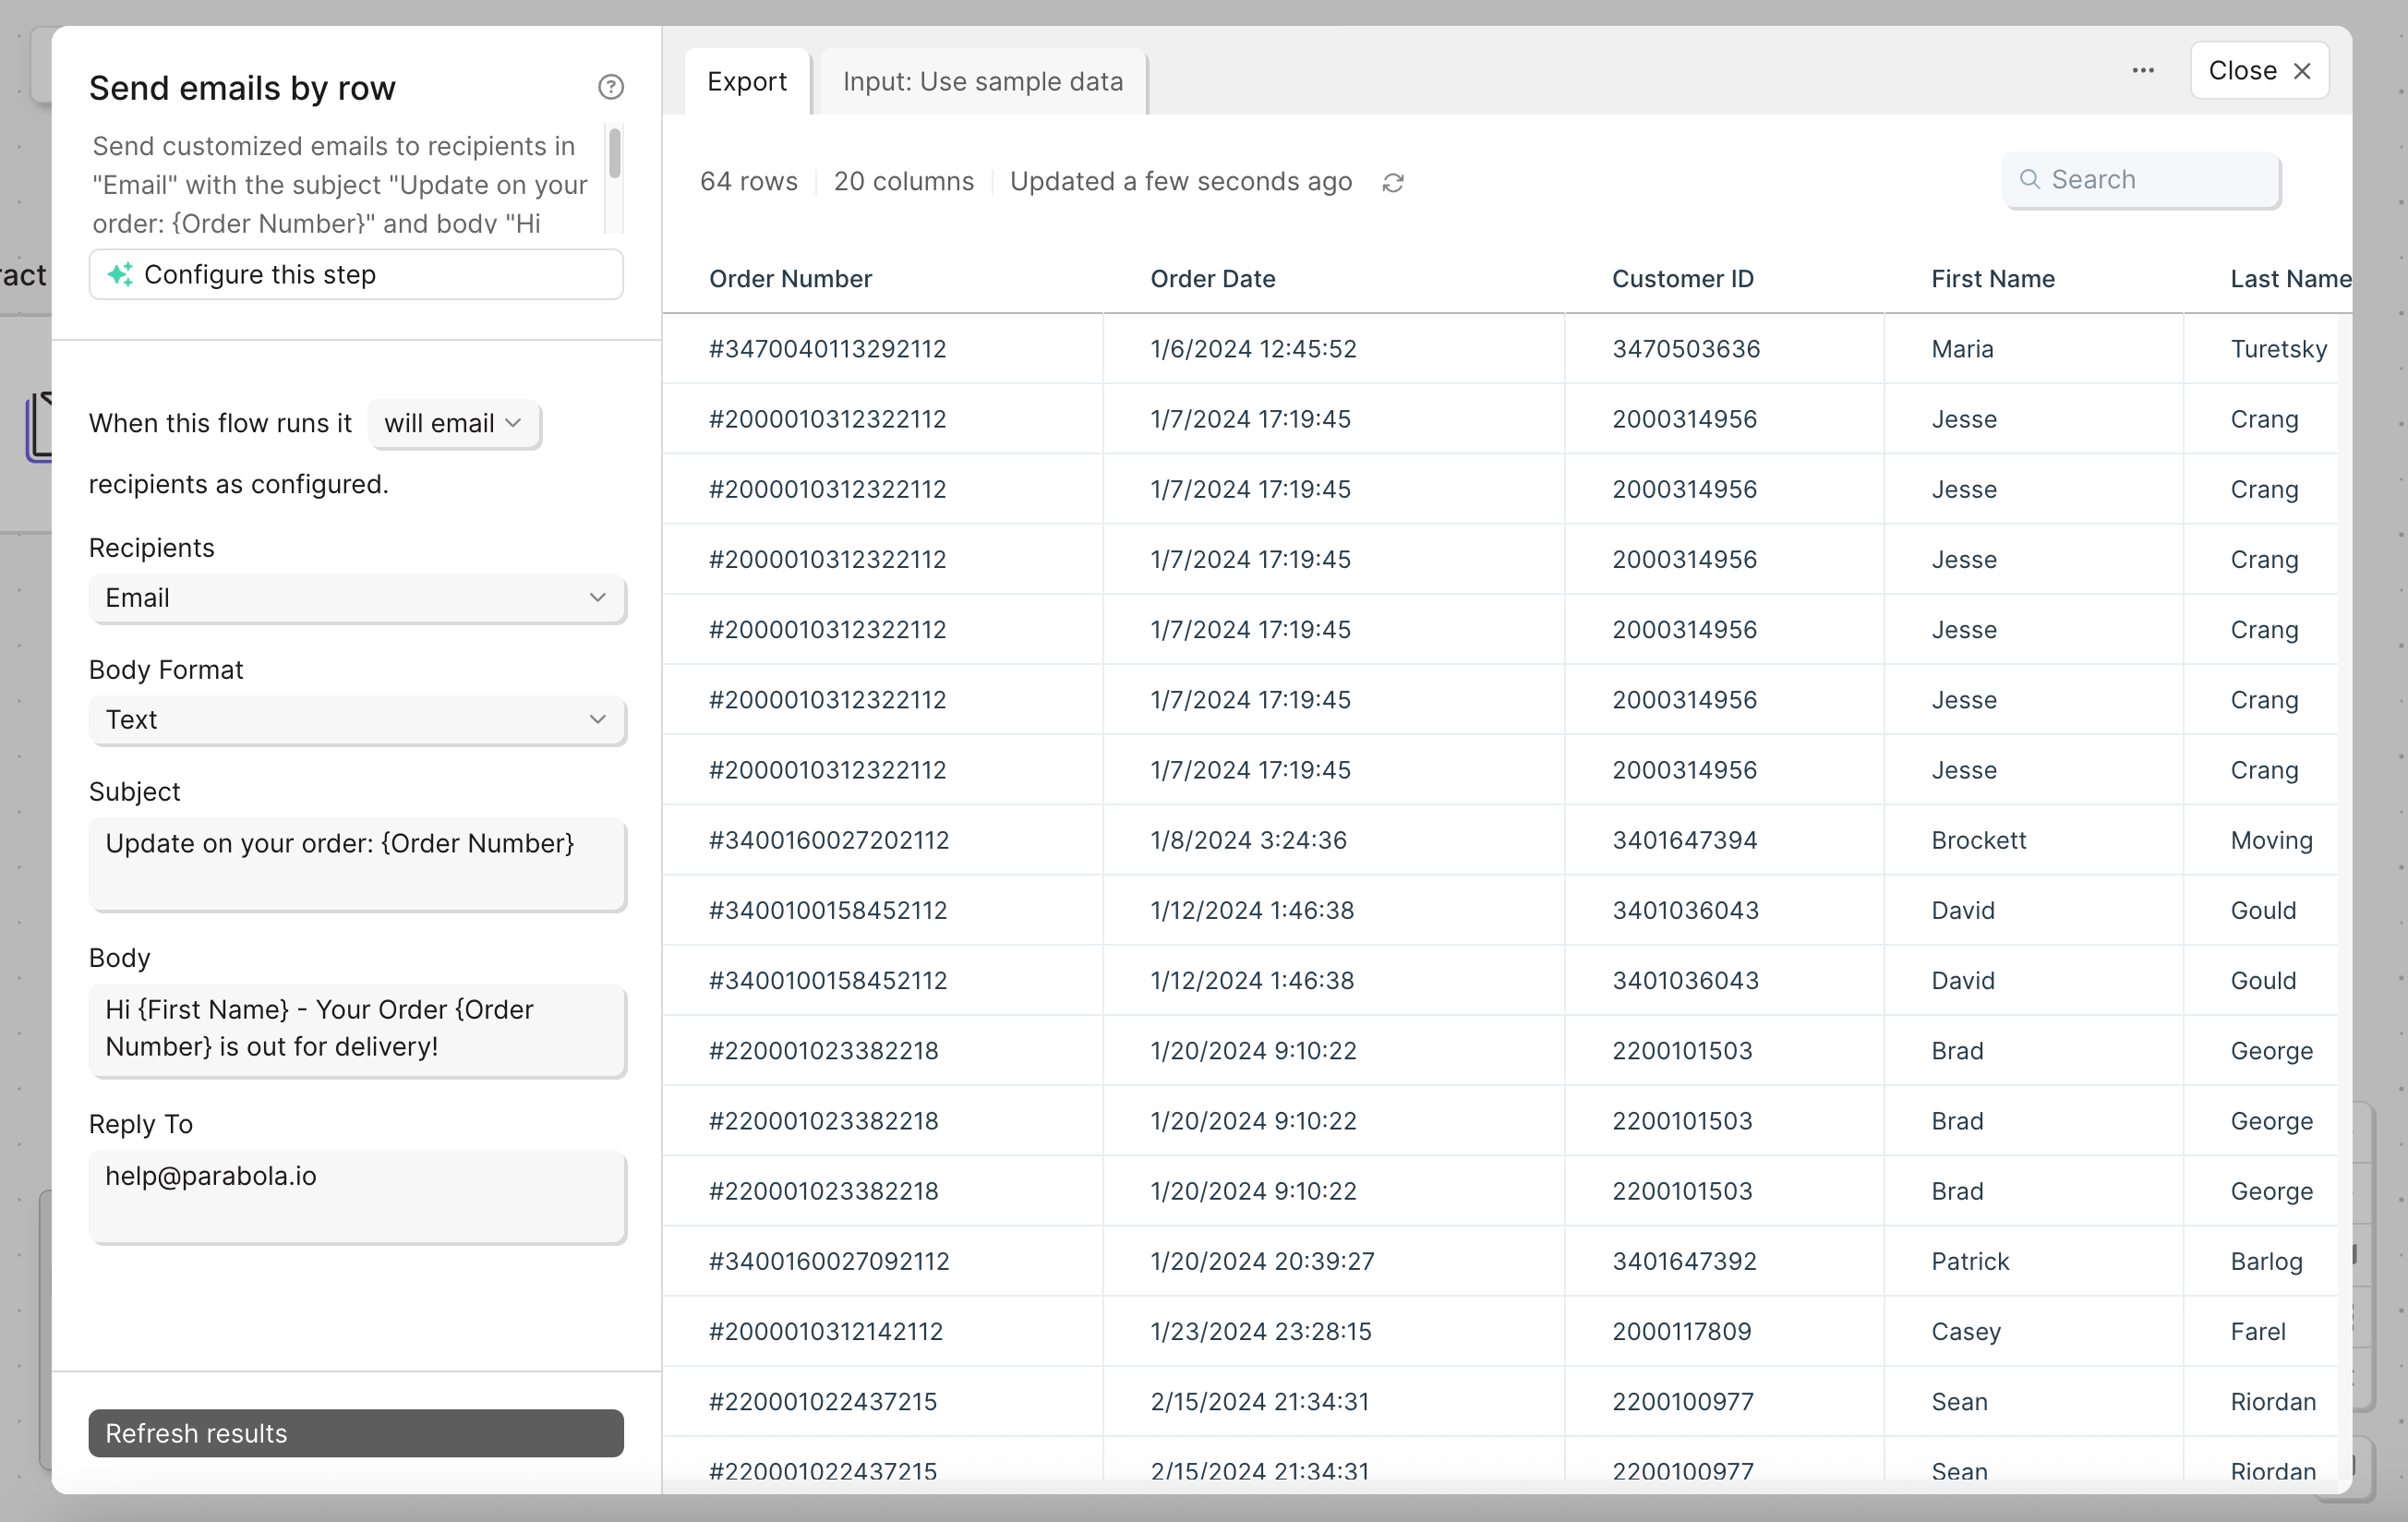
Helpful tips
- Use HTML formatting in the Body field by selecting HTML as the format.
- Common HTML tags like
<br>,<b>, and<a>are supported. - Avoid exceeding the 75-recipient limit per run to prevent errors.
- If you need to send a single email with a file attached, use the “Email a file attachment” step instead. Unlike “Send emails by row,” which sends one email per row, the "Email a file attachment" step sends one email total with a file attachment—ideal for sharing reports or exports with a fixed list of recipients.
Integration:
Sendgrid
The Send to SendGrid step gives you the ability to automatically send emails through SendGrid without code. Quickly build and iterate sales, marketing, and internal solutions without tying up engineering resources.
Connect your SendGrid account
To begin, click Authorize and login with your credentials.
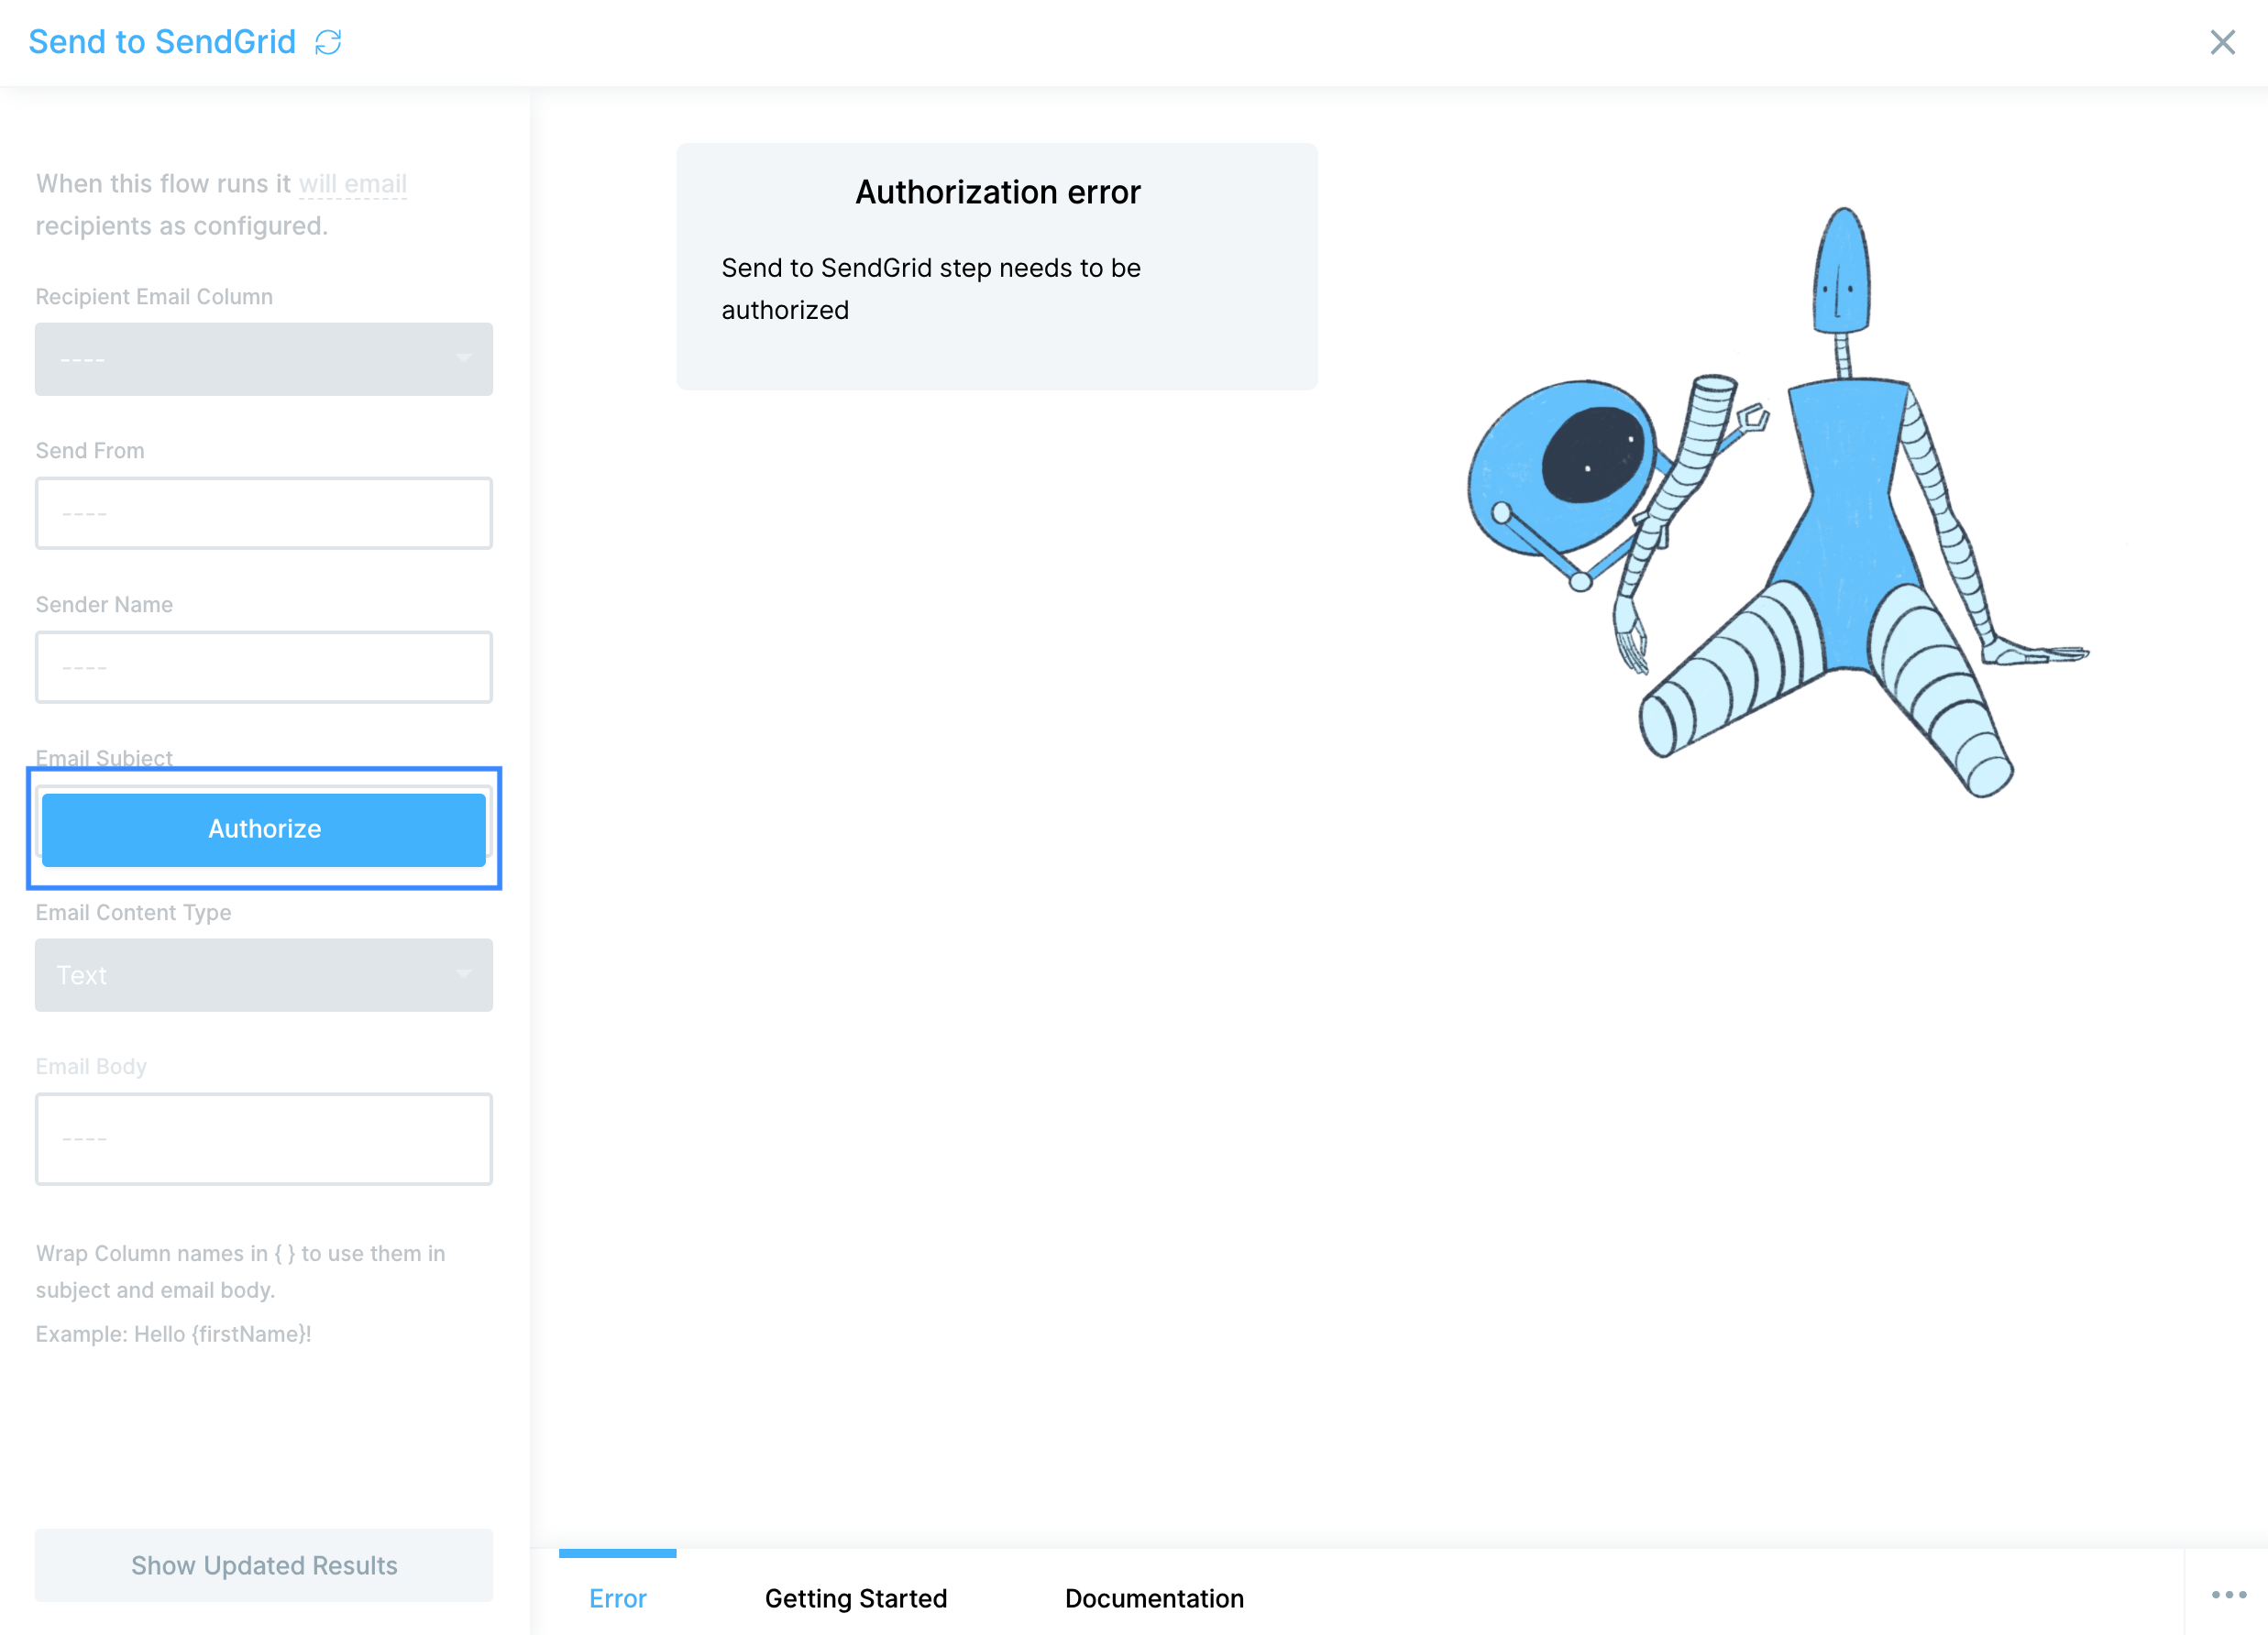
You will need your API Key to link your SendGrid account to Parabola. You can find that on your SendGrid account's Settings API Keys page.
The API Key will be obfuscated by a row of dots, but you can just select the dots and copy and paste into Parabola and your key will be added.
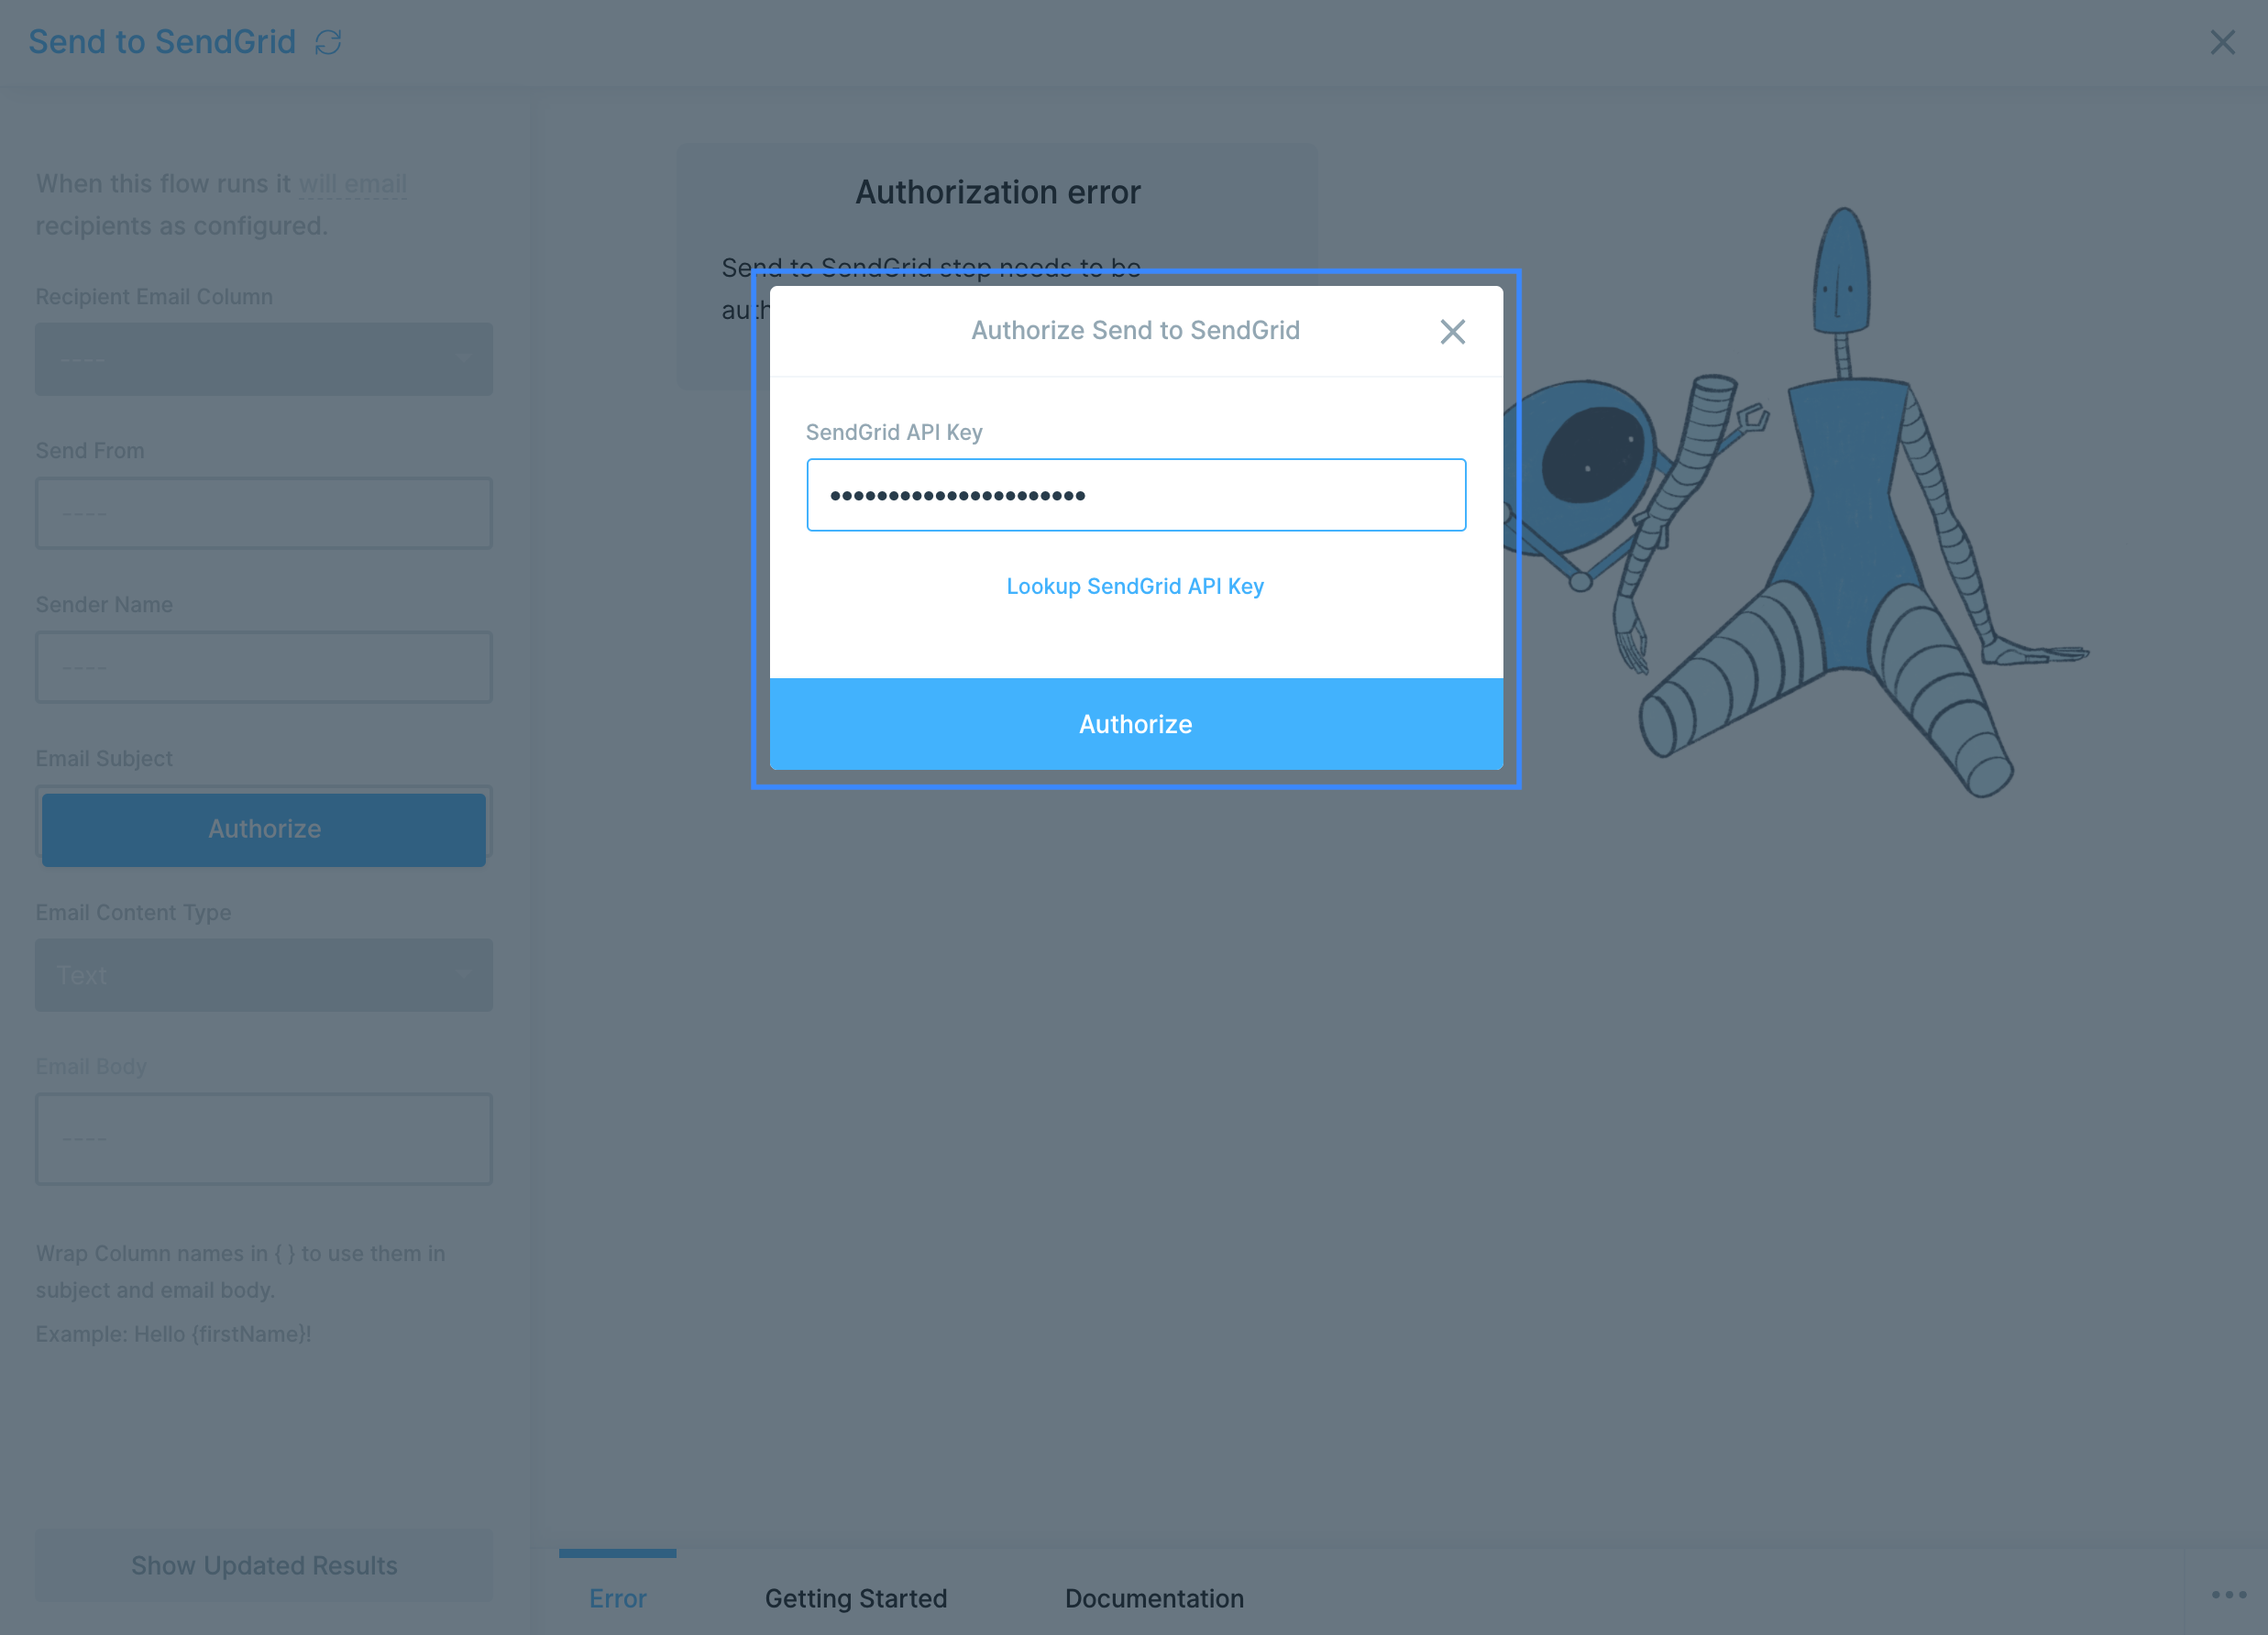
Custom settings
First, select your column of recipient email addresses. Each row will receive one email. If you have duplicate email addresses, they will receive multiple emails. Try using our Remove duplicate rows step to remove for duplicate addresses prior to connecting the data to the this step.

Enter the email address that you'd like emails to be set from in the Send From field. The Send to SendGrid step can only send from a single address.
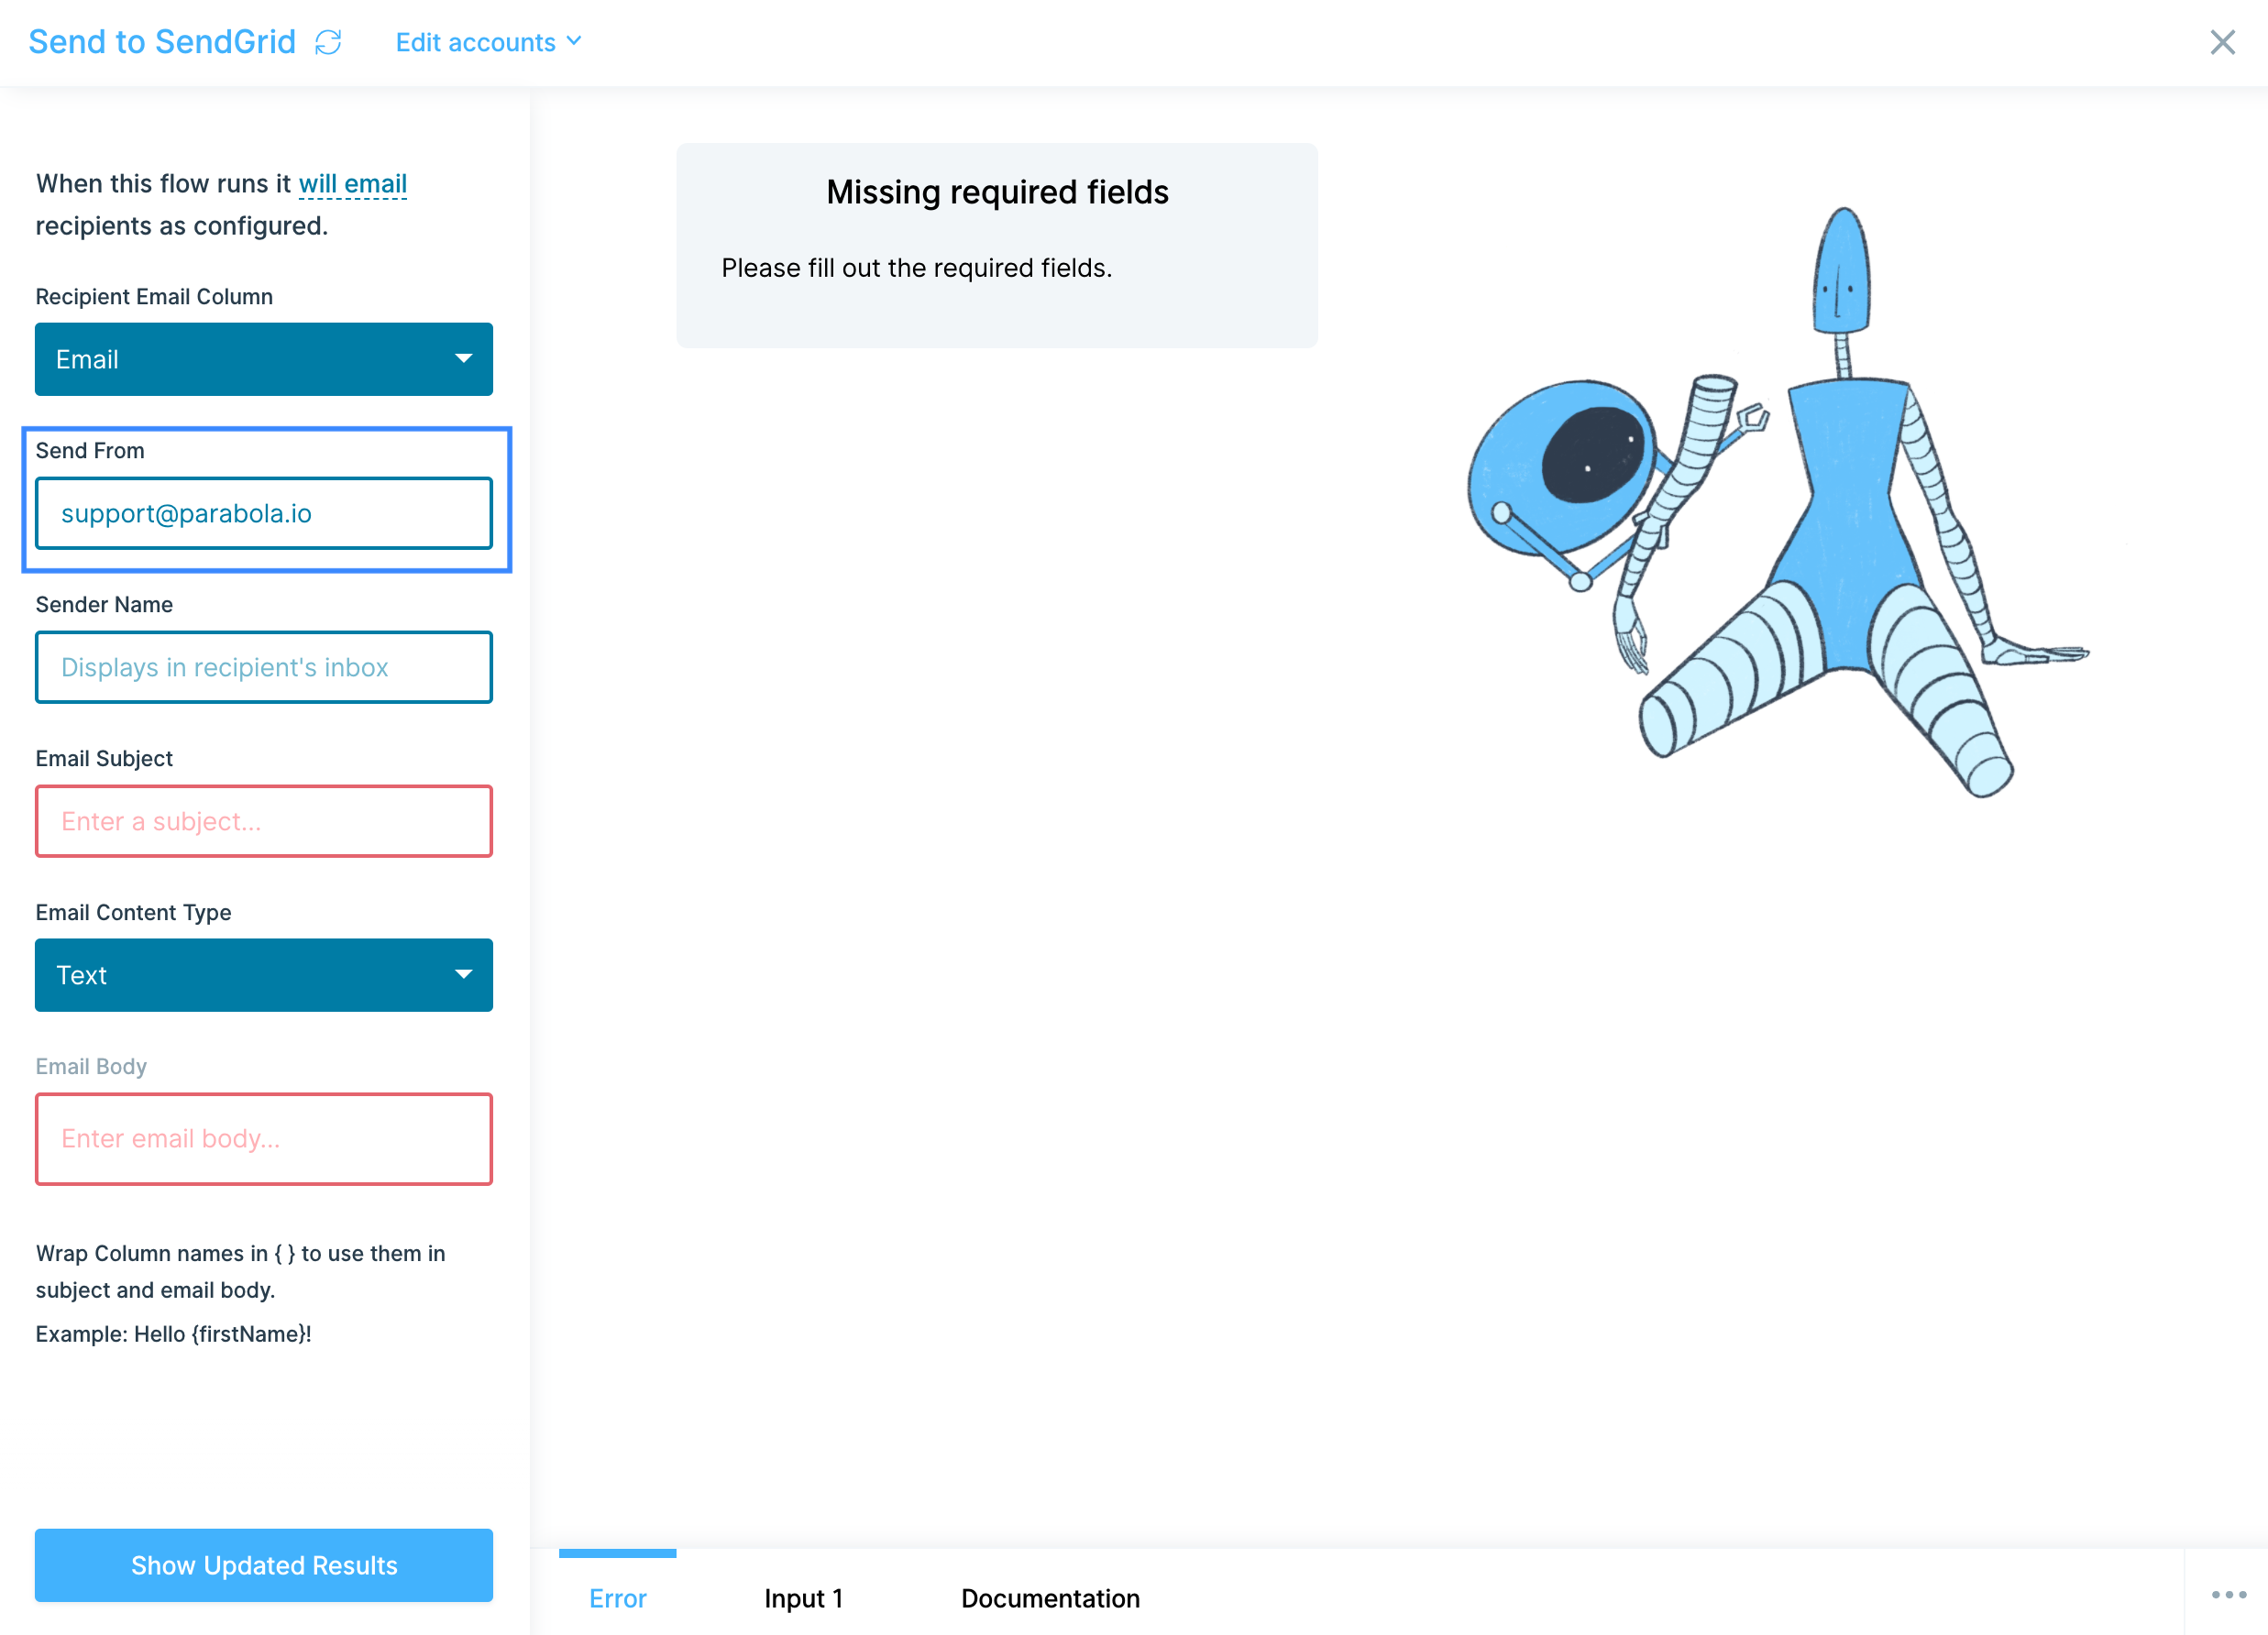
Next, enter your Sender Name and Email Subject.
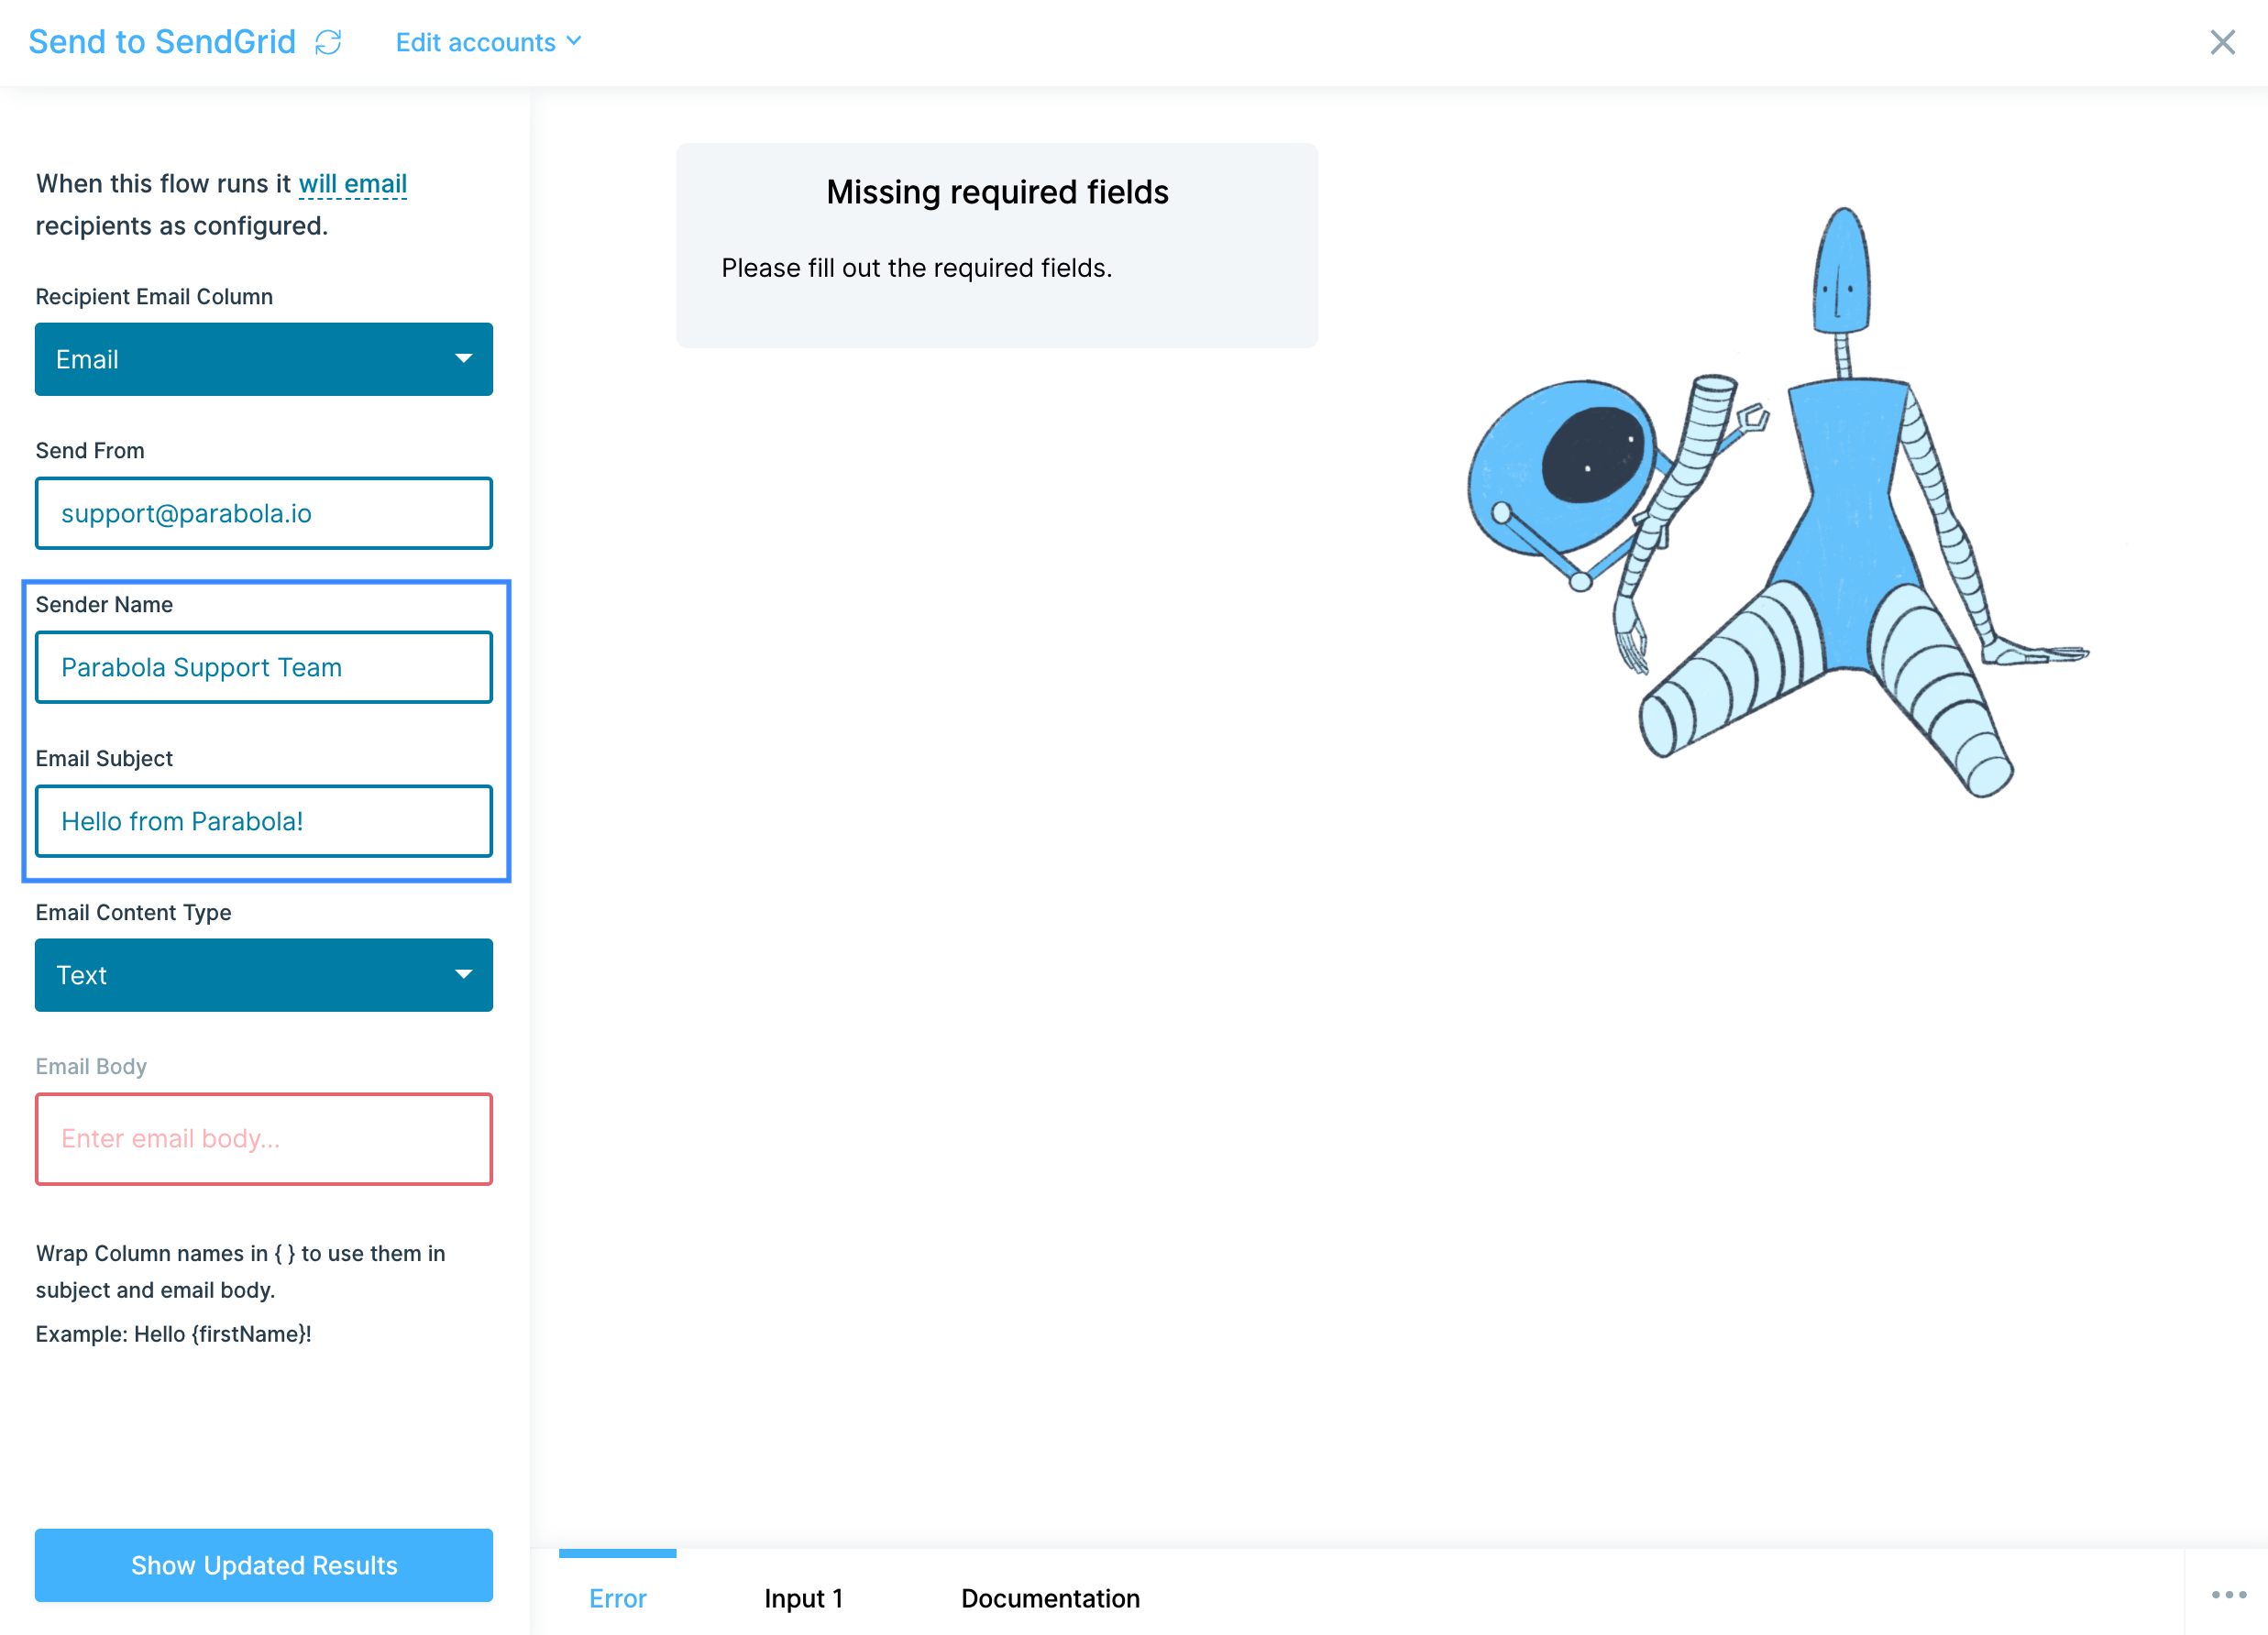
Now you can select your Email Content Type. You can choose between Text and HTML. To use Text, your email will appear in plain text, which can be written out in the Email Body field directly. To use HTML, you can also enter your formatted HTML in the Email Body field.
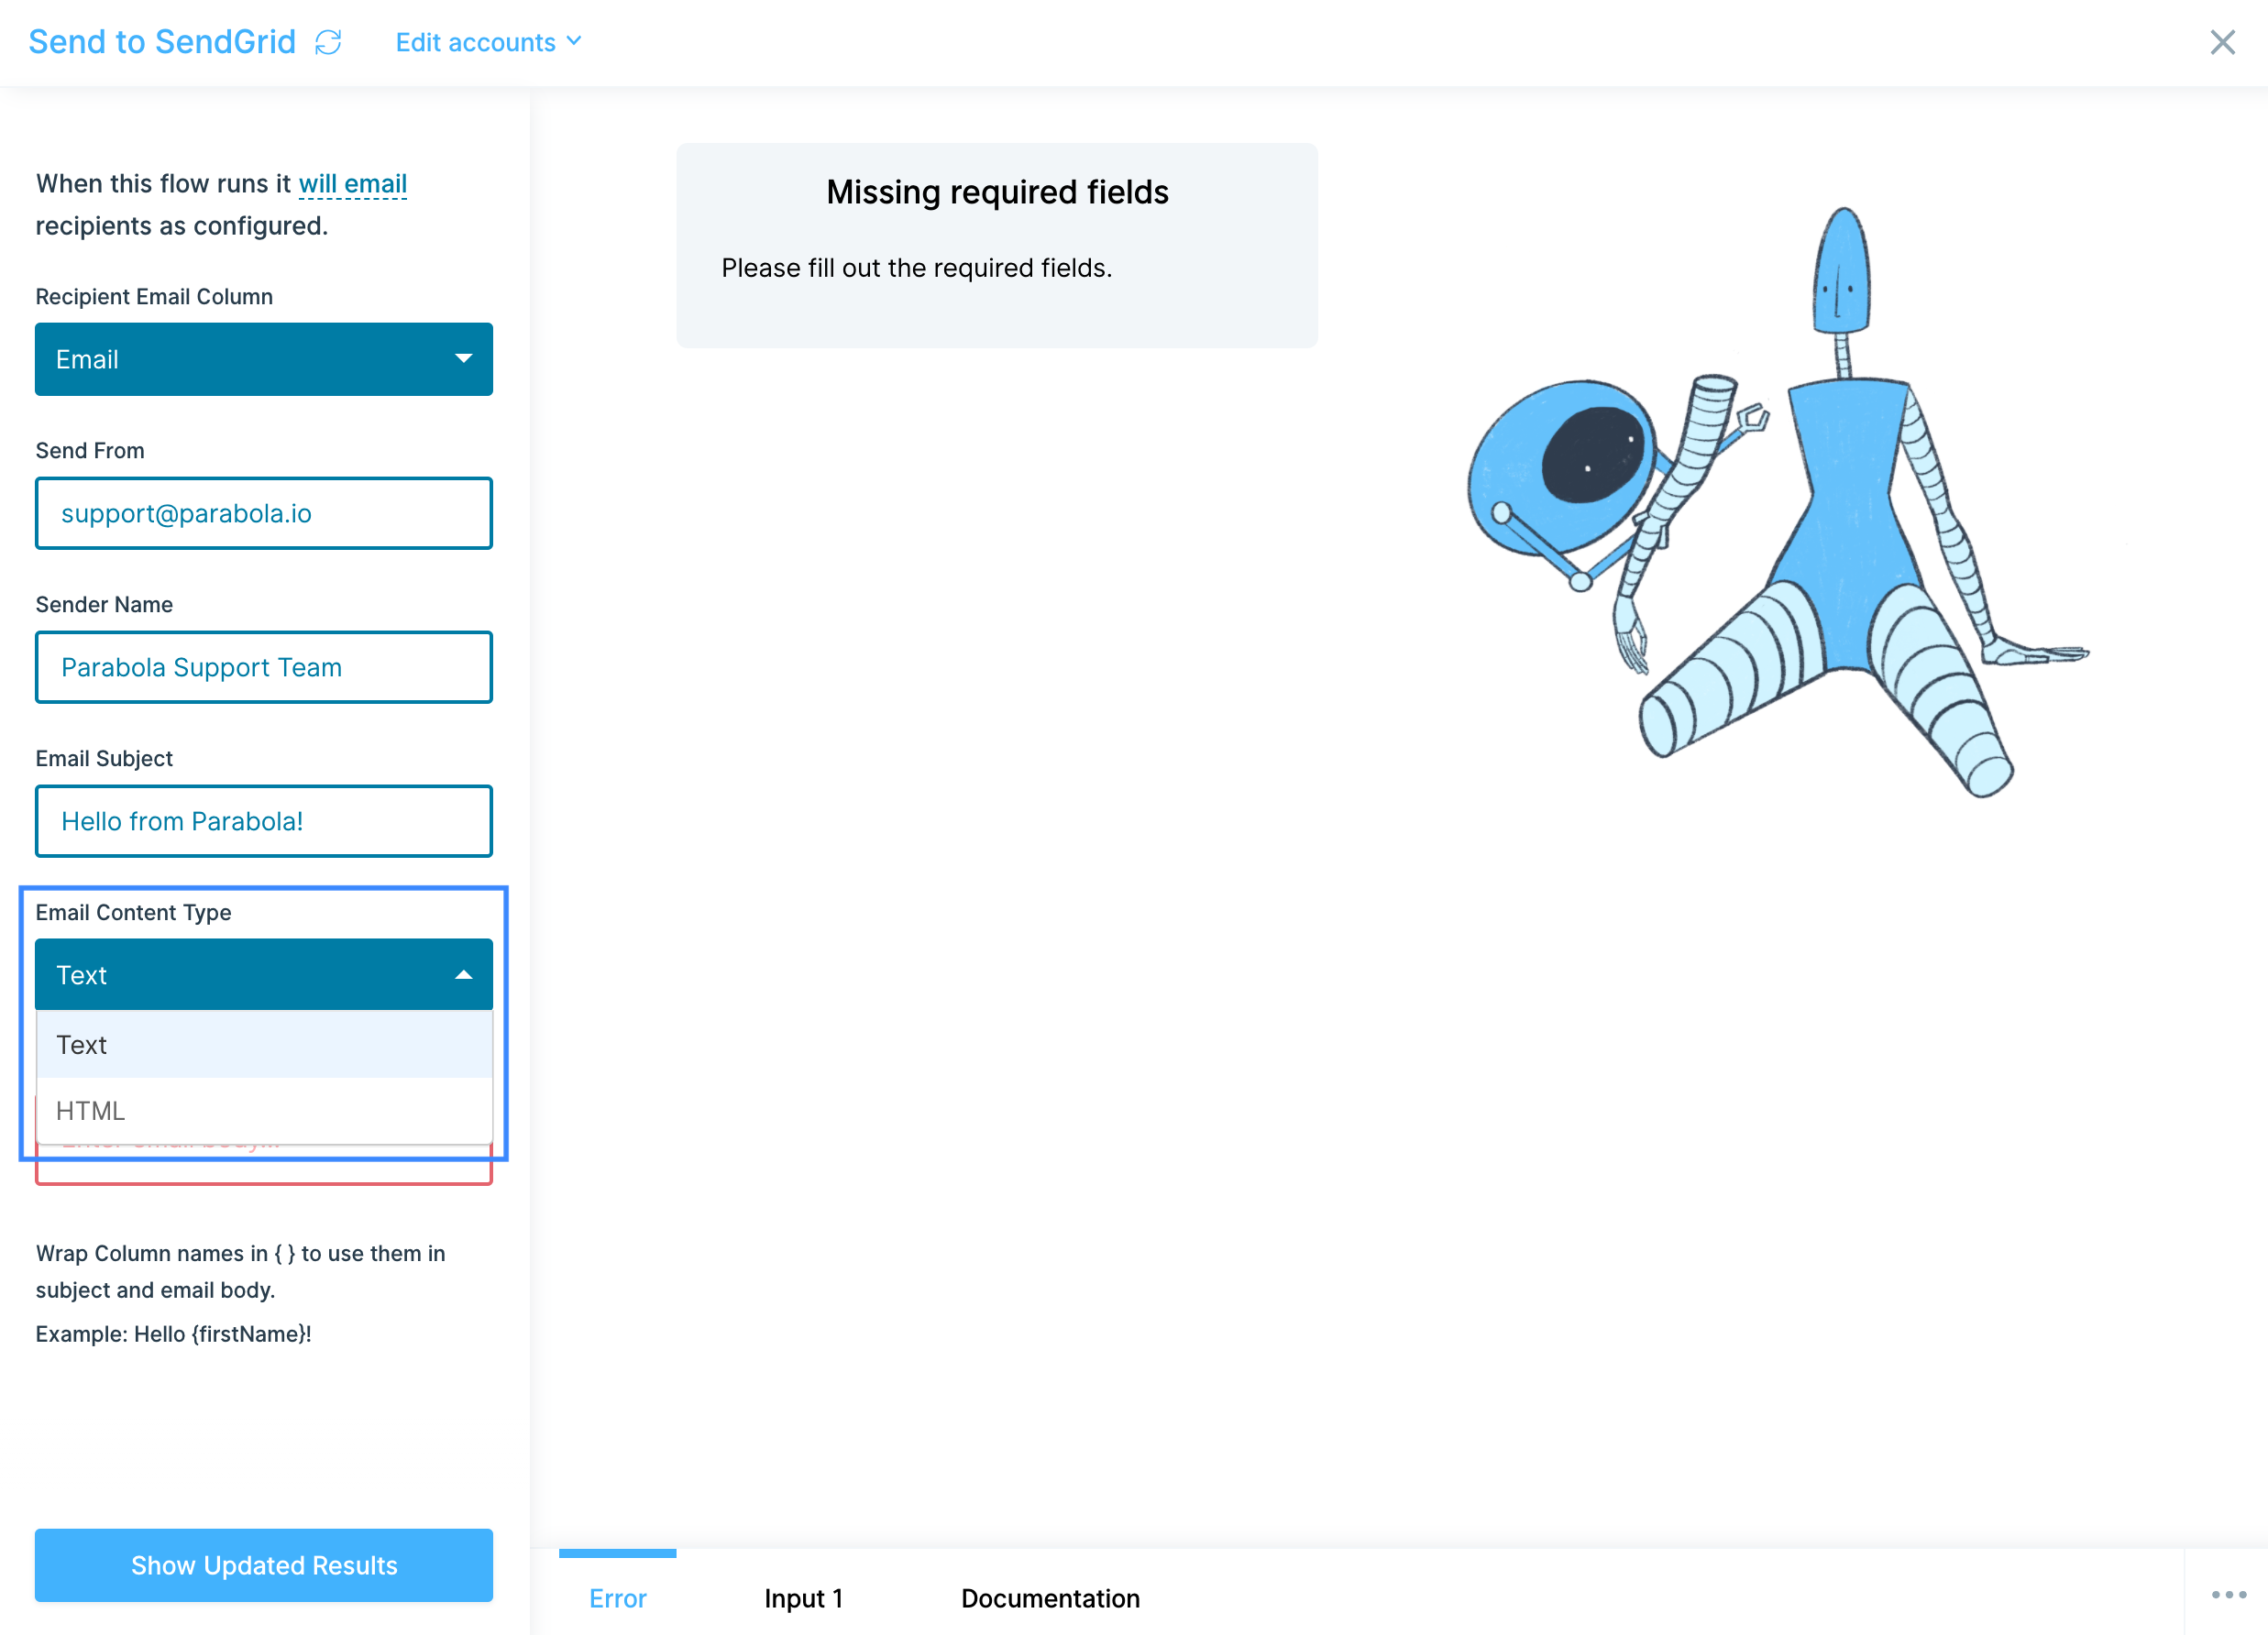
Enter your text in the Email Body field. You can reference column data to use as a mail merge in both the Email Subject and Email Body by wrapping the column names in {curly braces}. If the body of your email is already in a column, simply reference that column with a merge value. Be aware that if your email body column itself includes merge fields, those fields will need to be merged prior to this step. All merges used in the Email Body and Email Subject fields will appear in the email as they do in the column.
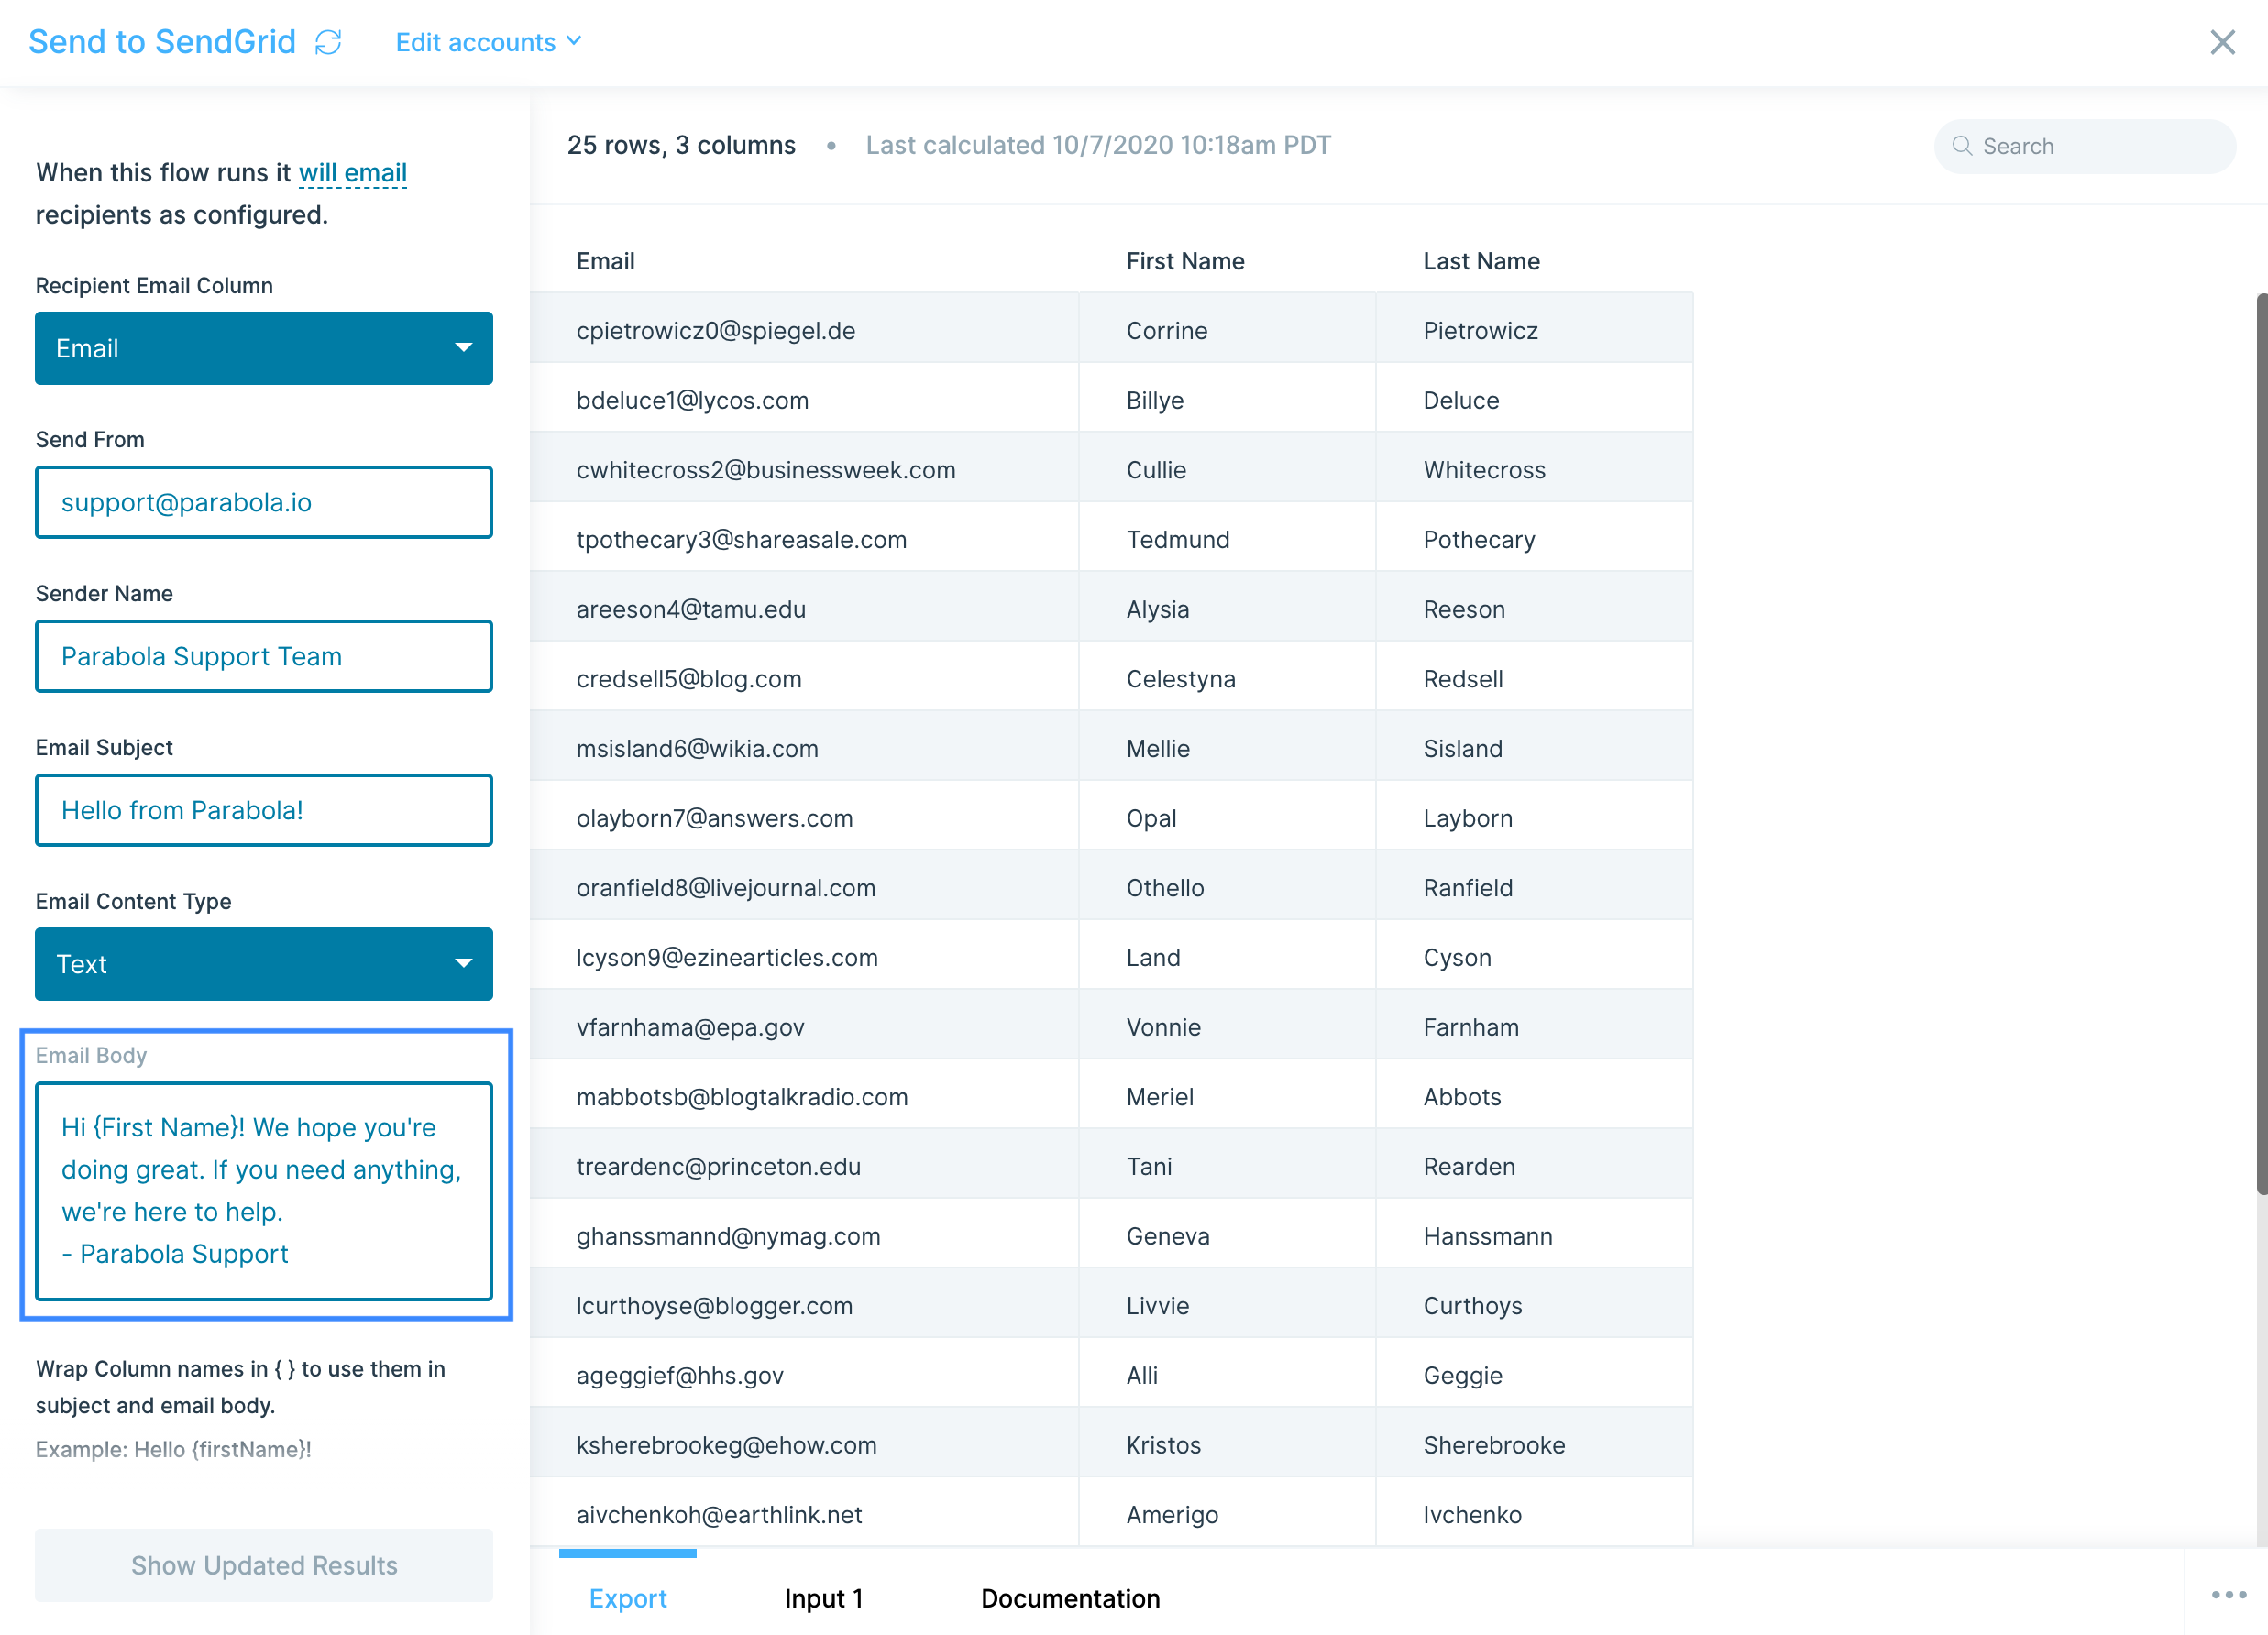
Helpful tips
- Try using dummy data when building a flow using this destination. Use a recipient email address that you control so that you can send test emails and ensure that your merge values appear as intended and that the email looks free of errors in an email client like Gmail or Outlook.
Integration:
ShipBob
How to authenticate
Use the ShipBob integration in Parabola.
- Open the Pull from ShipBob step
- Click the blue Authorize button, then click Add ShipBob account
- A pop-up window will appear where you can securely authorize the app with your ShipBob credentials. After entering your credentials, scroll to the bottom of the page and click, Allow and Install
- Once you're returned to Parabola, you're ready to start pulling in data
- Recommended: Save your account to use it across flows without re-authenticating each time by clicking "Edit accounts" ➡️ "..." ➡️ "Set as default."
- We also recommend clicking "..." ➡️ "Sharing settings" ➡️ "Team can edit"
- Recommended: Save your account to use it across flows without re-authenticating each time by clicking "Edit accounts" ➡️ "..." ➡️ "Set as default."
Available data
You can bring the following ShipBob objects into Parabola (names may vary slightly from your ShipBob account terminology):
- Orders & Order Items: customer, line items, fulfillment status, totals, timestamps.
- Shipments & Tracking: carriers, tracking numbers, statuses, delivery dates, costs.
- Products / Variants (SKUs): identifiers, titles, barcodes, dimensions, weights.
- Inventory Levels: on-hand, available, allocated, backordered by fulfillment center/location.
- Receivings / Inbounds: ASNs, received quantities, discrepancies, timestamps.
- Returns & Return Items: reasons, dispositions, quantities, restock outcomes.
- Taxonomy / Categorization: product categories, tags, collections for reporting.
Common use cases
- Reconcile order data across Shopify, NetSuite, and ShipBob to spot mismatches in fulfillment status, tracking, or completion.
- Three-way match purchase orders, receipts, and invoices using ShipBob data to catch quantity and pricing variances.
- Pull real-time product and inventory data from ShipBob and your ERP to refresh daily dashboards and flag location-level discrepancies.
- Monitor pick/pack/ship times, missed SLAs, and delayed shipments to generate internal and partner reports.
- Combine ShipBob data with PO and transportation feeds for end-to-end visibility into inbound shipments, customs progress, and receiving accuracy.
Tips for using Parabola with ShipBob
- Schedule your flow to run on the cadence your team needs (e.g., hourly for SLAs, nightly for reconciliations).
- Normalize IDs early (Order ID, SKU, Location) so downstream joins to Shopify/ERP data are consistent.
- Create data quality checks with Filters and Formula steps—flag negative inventory, missing tracking, or delayed receipts.
- Use Branches to route exceptions (e.g., shipments missing costs) to separate review queues.
- Send alerts via Email or Slack exports when thresholds are breached (missed SLA, ASN discrepancy, return spike).
- Cache reference tables (Products, Locations) in a separate flow and Import from another flow to speed up runs.
That’s it! Once connected, you can mix ShipBob data with your other systems to automate the workflows that keep fulfillment humming.
Integration:
Shipfusion
Integration:
ShipHero
Pull data from ShipHero to create custom reports, alerts, and processes to track key metrics and provide a great customer experience.
ShipHero is a beta integration which requires a more involved setup process than our native integrations (like Shopify and Google Analytics). Following the guidance in this doc (along with our video walkthrough) should help even those without technical experience pull data from ShipHero.
If you run into any questions, feel free to reach out to support@parabola.io.
Access the ShipHero integration
Inside your flow, search for "ShipHero" in the right sidebar. When you drag the step onto the canvas, a card containing 'snippets' will appear on the canvas. To start pulling in data from ShipHero, copy a snippet and paste it onto the canvas (how to paste a snippet).
Connect your ShipHero account
We must start by authorizing ShipHero's API. In the "Pull from ShipHero" step's Authentication section, select "Expiring Access Token". For the Access Token Request URL, you can paste: https://public-api.shiphero.com/auth/token
In the Request Body Parameters section, you can "+add" username and password then enter your ShipHero login credentials. A second Request Header called "Accept" will exists by default – this can be deleted. Once completed, step authorization window should look as so:
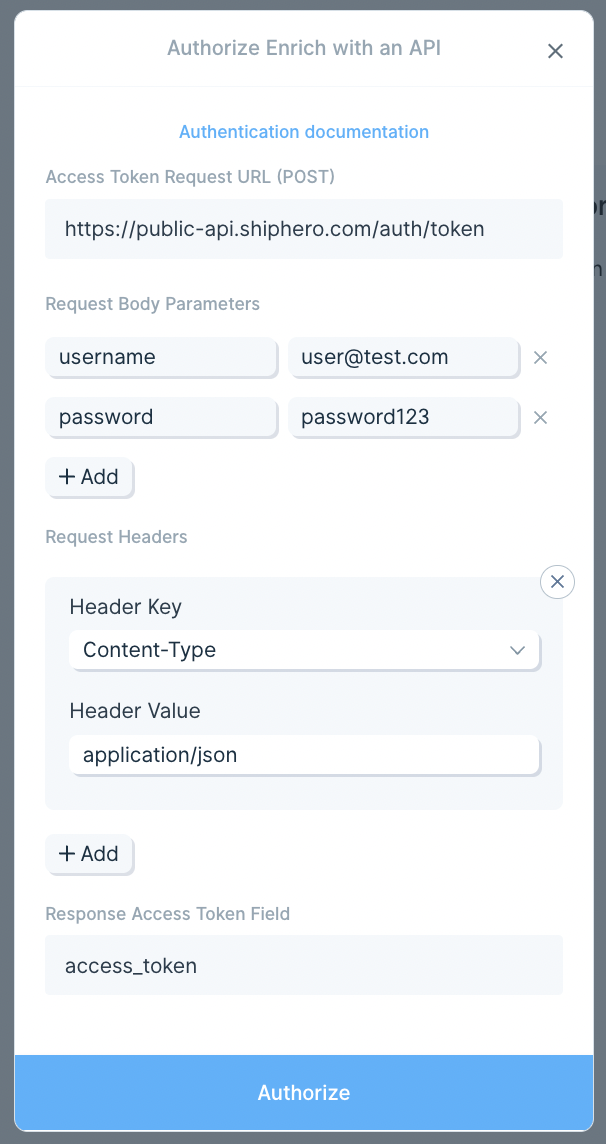
Custom Settings
When you drag the ShipHero step onto the canvas, there will be 5 pre-built snippets available:
- Shipments
- Orders
- Returns
- Purchase Orders
- Products
For everything besides Products, it's common to pull in data for a specific date range (ex. previous day or week). This is why the card begins with steps that specify a dynamic date range. For example, if you put -2 as the Start Date and -1 as the End Date, you will pull orders from the previous full day.
If you're wanting to pull data from ShipHero that is not captured by these pre-built connections, you can modify the GraphQL Query and/or add Mutations by referencing ShipHero's GraphQL Primer.
Troubleshooting missing data
By default, we pull in 20 pages of data (2,000 records). To increase this value, visit the "Pull from ShipHero" step and go to "Rate Limiting" --> "Maximum pages to fetch
" and increase the value until all of your data is pulled in.
Helpful Tips
- Calculation Errors: The more complex your query is, the more likely the request is to fail. If you're receiving a "Calculation error", this is likely because of the complexity of your query. These results can be unstable once you begin hitting that error. To reduce the complexity of your query, eliminate any columns that you don't need from your request body, and check out ShipHero's documentation.
- GraphQL: To learn more about making GraphQL API calls in Parabola, check out our API docs
Integration:
ShipMonk
How to authenticate
ShipMonk uses API Key authentication.
- Generate a Store
- Within the ShipMonk app, navigate to Account Settings > General Settings > Stores
- Click on the Integrate Another Store graphic and fill out the Typeform. After filling out the form, an integrations team member from ShipMonk will reach out within 48 hours to complete your request.
- Create API Key
- Once your store has been authorized, navigate to Account Settings > Stores > Integration API Keys and create an API key. You can also grab your store's unique ID here.
- Make sure you save your API key somewhere secure. If you lose your API key, you can always generate a new one.
- Once your store has been authorized, navigate to Account Settings > Stores > Integration API Keys and create an API key. You can also grab your store's unique ID here.
- In Parabola, add a new Pull from ShipMonk step.
- Open the step settings and Authorize the step. Enter your API key when prompted and give it a name; this will authenticate your account and allow Parabola to access your ShipMonk data securely.
Available data
Using the ShipMonk integration in Parabola, you can bring in:
- Orders: Full details on each order including order number, customer info, items, quantities, pricing, and timestamps.
- Order items: Line-level product details including SKUs, lot numbers, quantities, prices, and fulfillment status.
- Packages and shipments: Tracking numbers, weights, carton and pallet data, shipping carriers, and methods.
- Warehouses: Identifiers and names for each fulfillment center handling your inventory.
- Trading partners and stores: Linked sales channels or retail partners associated with each order.
- Special requirements: Shipping instructions, delivery windows, or special labeling notes tied to orders.
- Returns and RMAs: Returned order information and related product identifiers.
- Shipping costs and tax data: Paid amounts and calculated totals for each order or shipment.
Common use cases
- Consolidate order data from ShipMonk, Shopify, and Amazon into a single dashboard.
- Track fulfillment and shipping performance by comparing processing times, costs, and carrier data.
- Audit carrier invoices against ShipMonk’s recorded shipping costs.
- Automate inventory reconciliation across multiple warehouses or channels.
- Monitor delayed or at-risk orders and trigger alerts when shipments don’t move on time.
- Generate daily fulfillment summaries for finance or operations reporting.
Tips for using Parabola with ShipMonk
- Schedule your flow to run daily or hourly to keep fulfillment data current.
- Use filters to isolate recent orders or specific warehouses.
- Add Alerts via email or Slack to flag unfulfilled or delayed orders automatically.
- Join with sales data from Shopify or Amazon to create complete order lifecycle reports.
- Export summaries back to Google Sheets or your BI tool for team visibility.
Integration:
ShipStation
The Pull from ShipStation step allows you to pull in orders, shipments, and fulfillments from your ShipsStation account.
Connect your ShipStation account
After clicking Authorize, you'll need to get your API Key and Secret and add them, which will enable this flow to pull from your ShipStation account. You can find your API Key and Secret here: https://ship11.shipstation.com/settings/api.
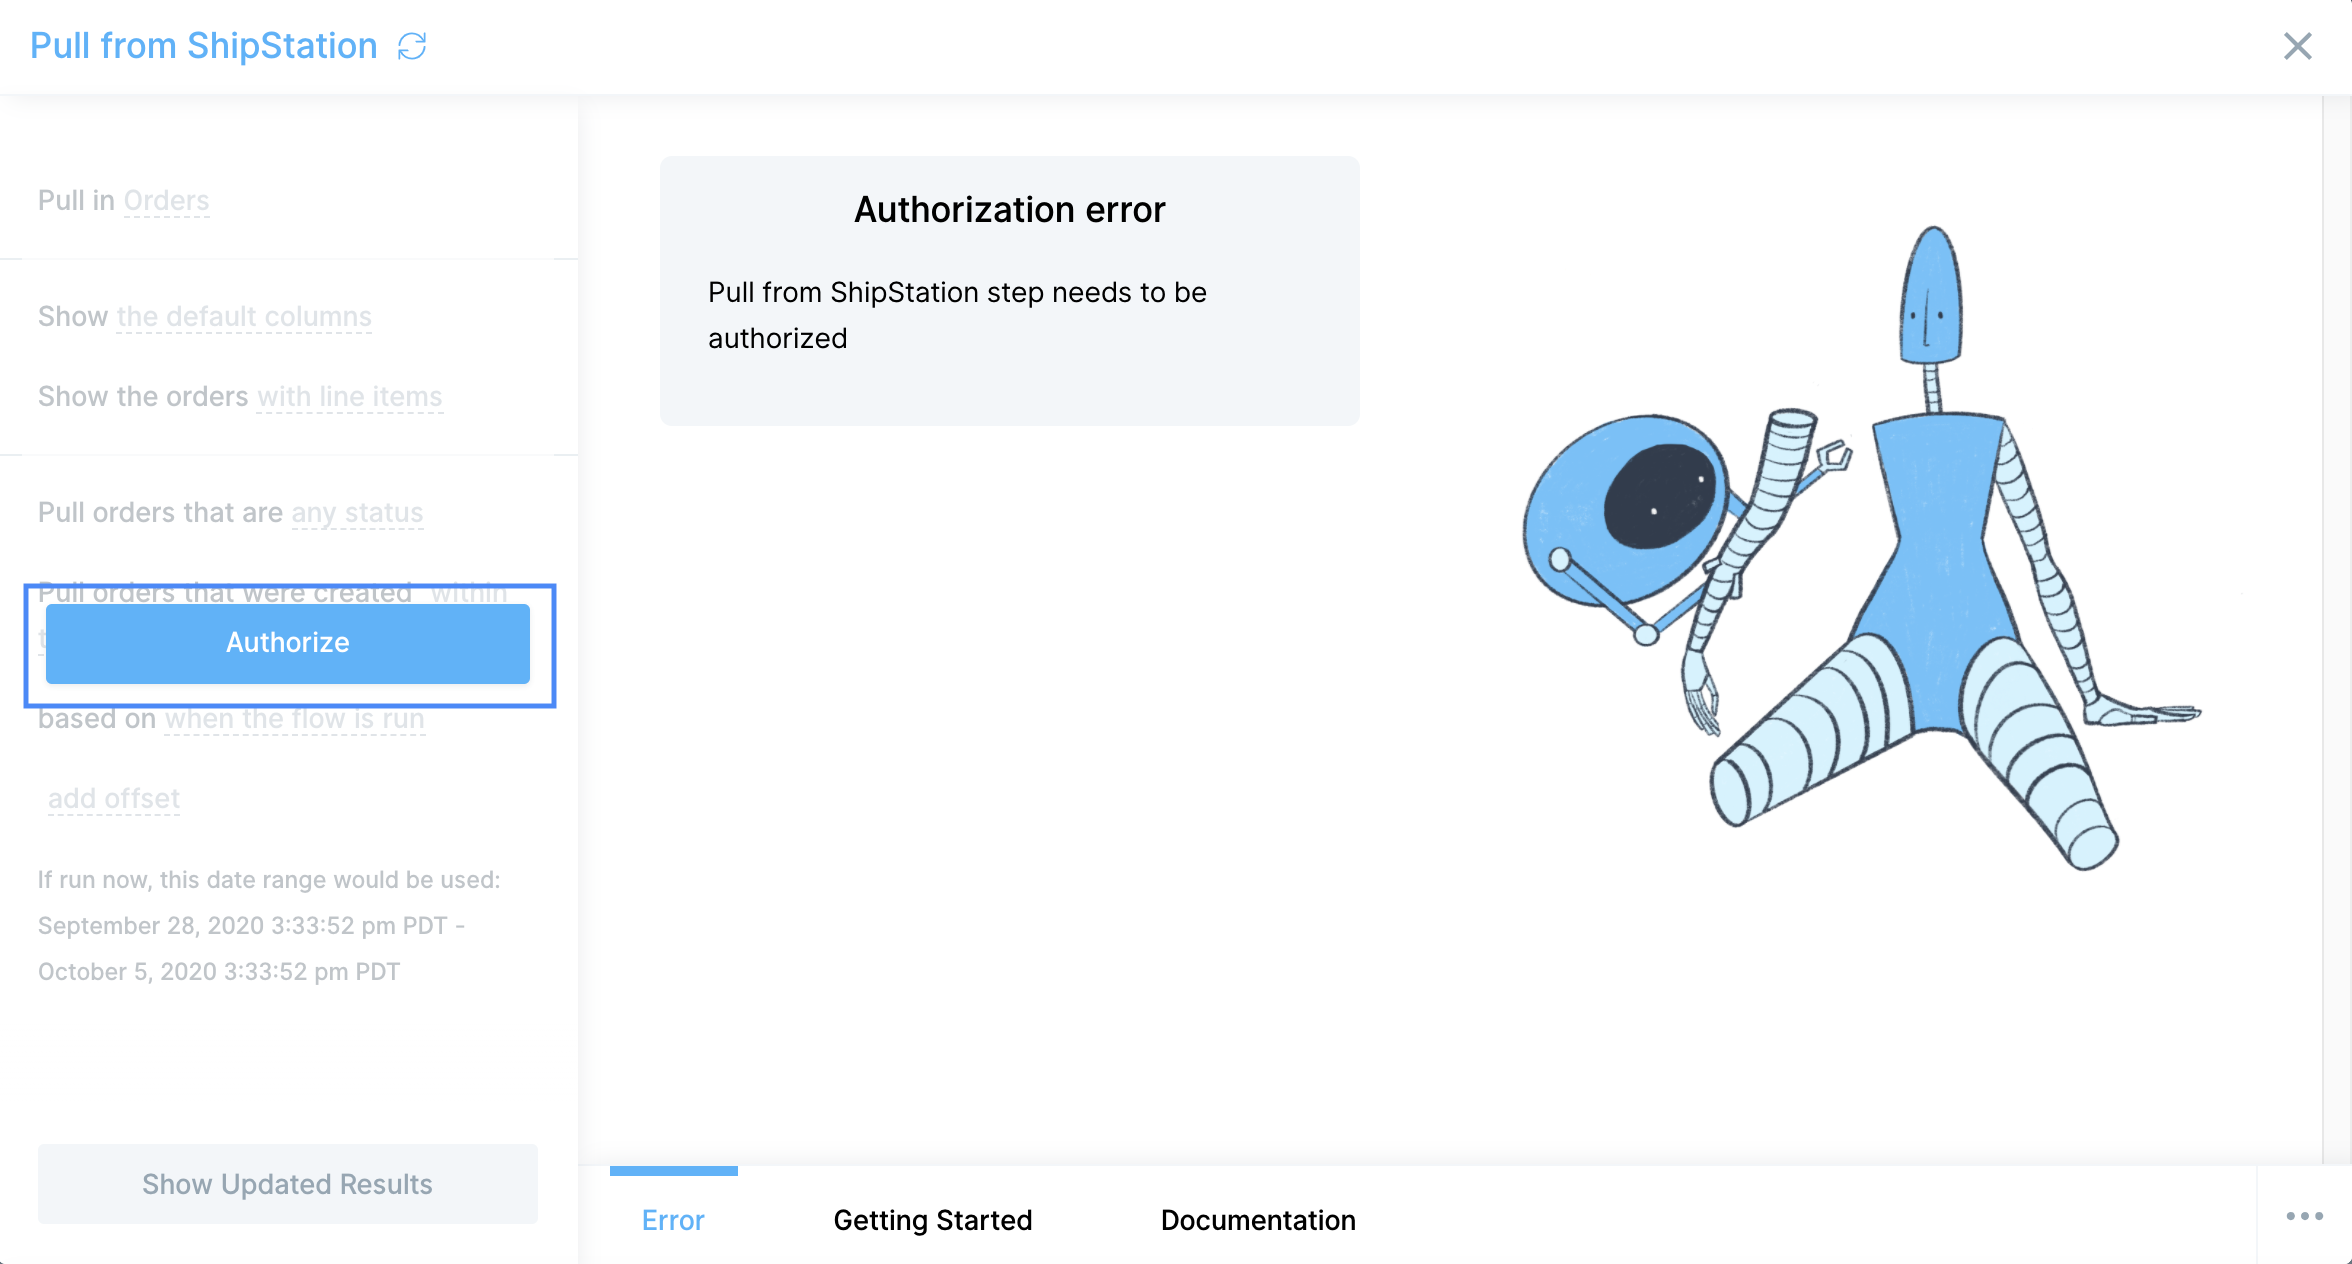
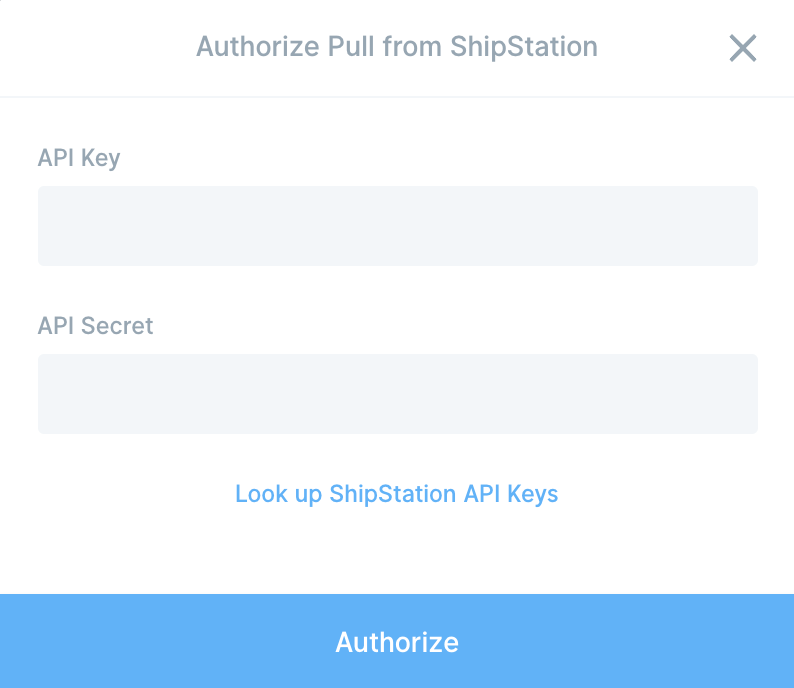
Default settings
By default, thstep will pull in Orders that were created within the last week. The orders pull defaults to also pulling in the line items for each order. This means that each row represents an item in an order. You can also pull in Shipments and Fulfillments.
Across Orders, Shipments, and Fulfillments, you can modify the time frame, default or all columns, and you can filter based on things like status and carrier.
Custom settings
Orders
When pulling in shipments, you can select to pull in the default column set or all columns. By default, the Orders pull includes line items. You can change this by updating the settings to show orders without line items
Orders can be filtered in this step to only include those with order status (i.e. Awaiting Shipment).
Orders can also be filtered down by the date they were created.
Shipments
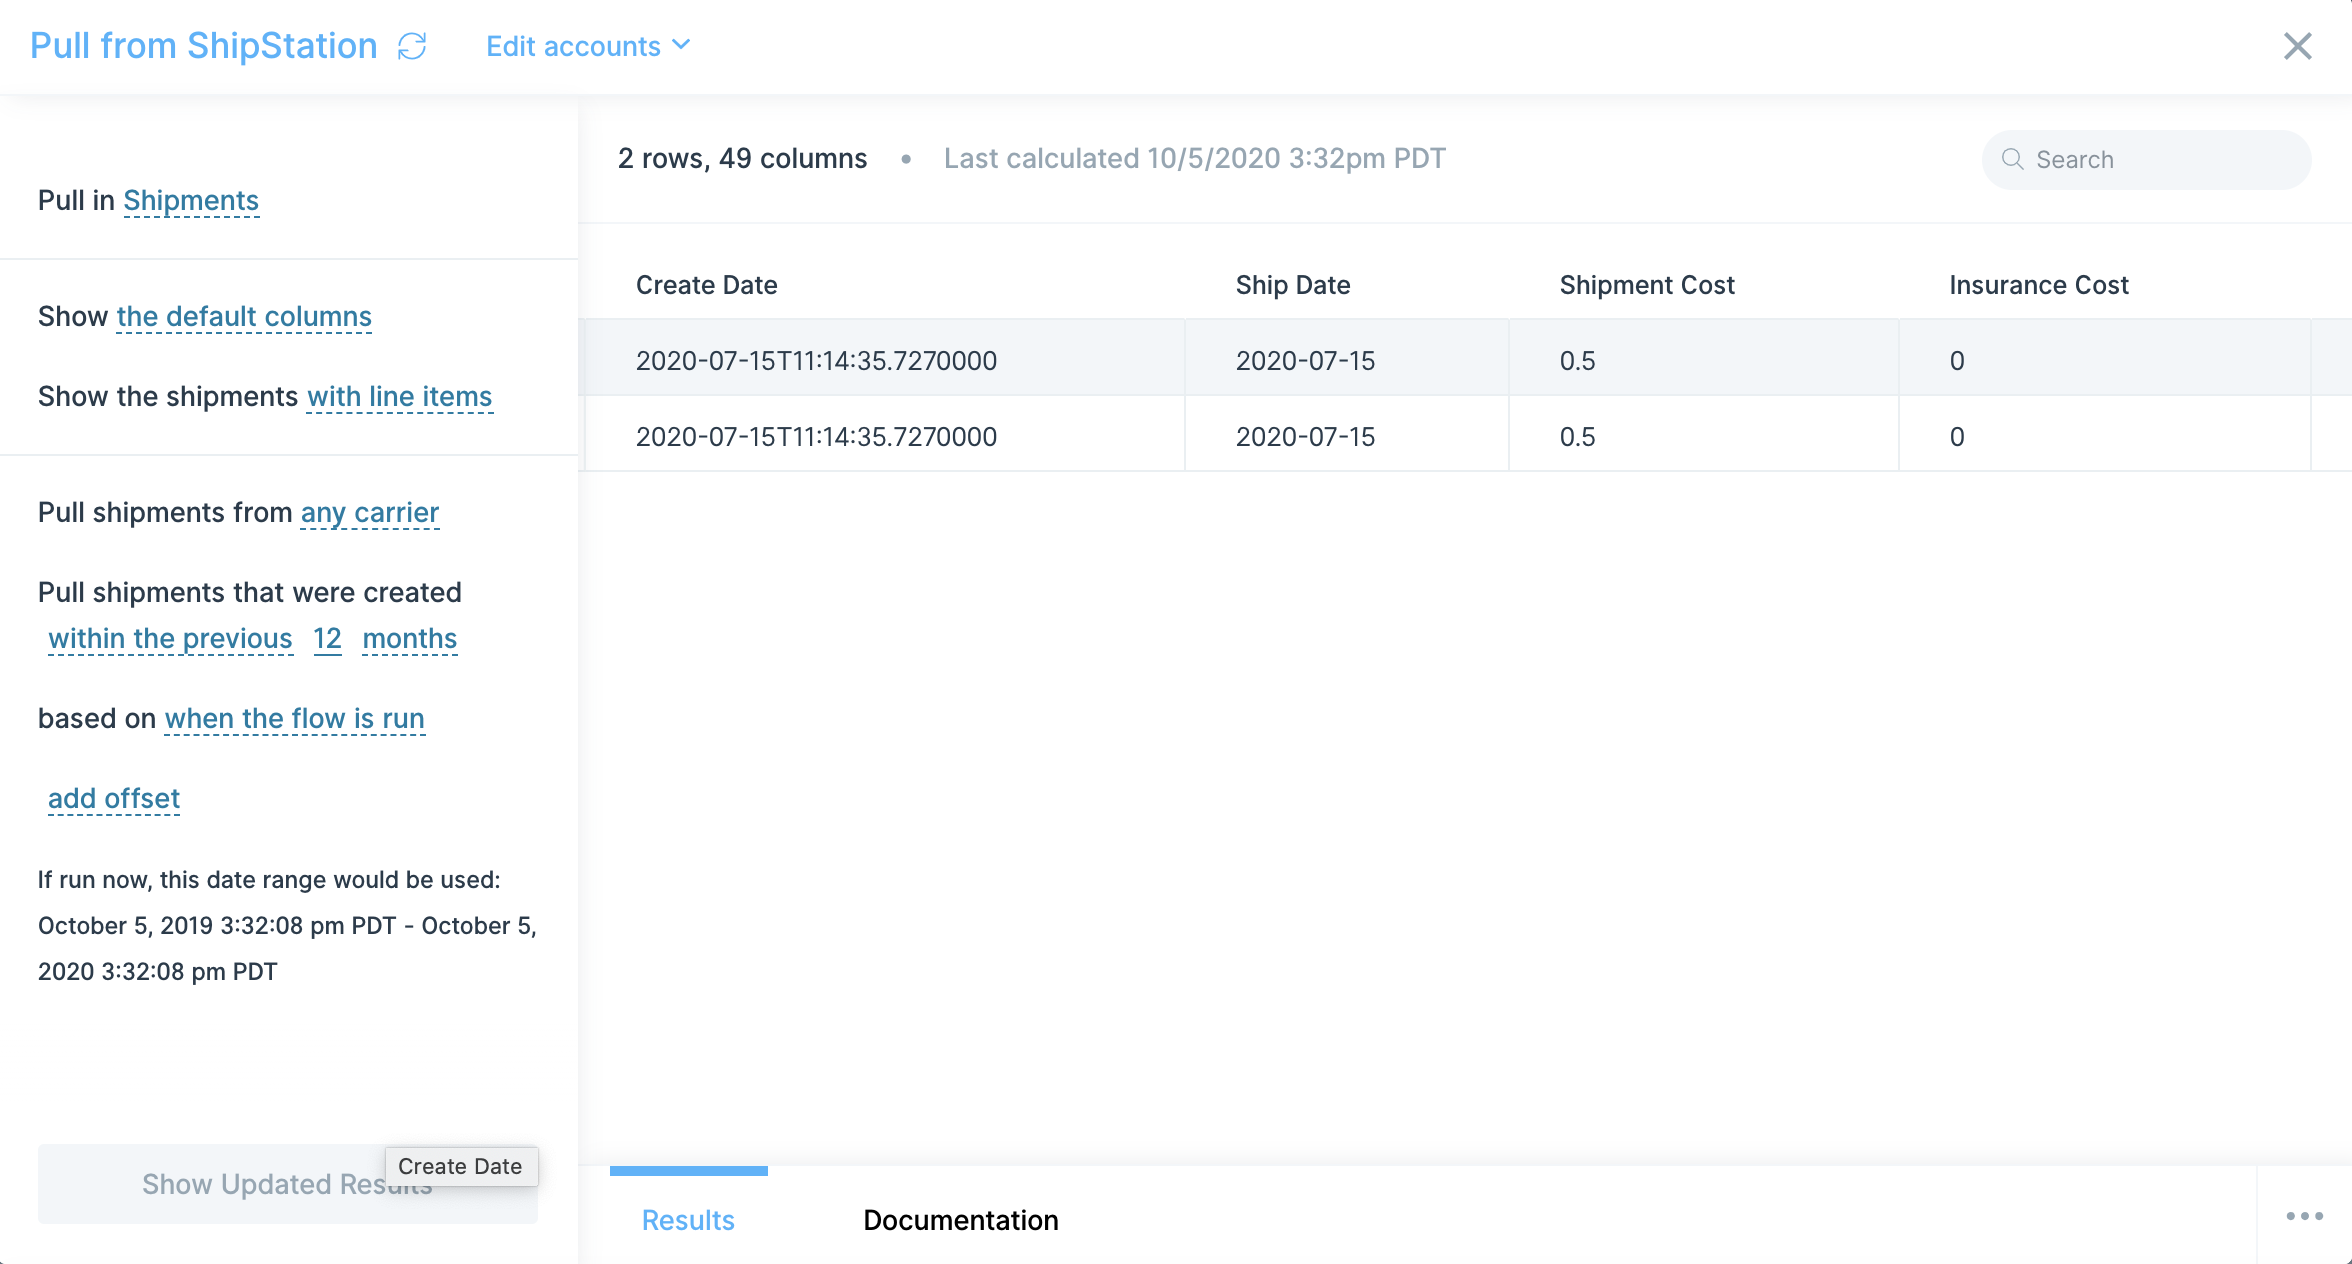
When pulling in shipments, you can select to pull in the default column set or all columns. By default, the Shipments pull includes line items. You can change this by updating the settings to show shipments without line items. Shipments can be filtered in this step to only include those sent via a certain carrier (i.e. UPS). Shipments can also be filtered down by the date they were created.
Fulfillments
When pulling in fulfillments, you can select to pull in the default column set or all columns. Fulfillments can also be filtered down by the date they were created.
Helpful tips
- This step is available starting at our Plus plan.
The ShipStation API is used for managing and automating shipping tasks, integrating with e-commerce platforms, and streamlining order fulfillment and shipment processes.
ShipStation is a beta integration which requires a slightly more involved setup process than our native integrations. Following the guidance in this document should help even those without technical experience pull data from ShipStation. If you run into any questions, shoot our team an email at support@parabola.io.
Use Cases
🤝 ShipStation | Integration configuration
📖 ShipStation API reference docs:
https://www.shipstation.com/docs/api/
🔐 ShipStation Authentication docs:
https://www.shipstation.com/docs/api/requirements/#authentication
Instructions
1. Navigate to your ShipStation settings in your account.
2. In the API Keys section, create or regenerate your API Key and API Secret.
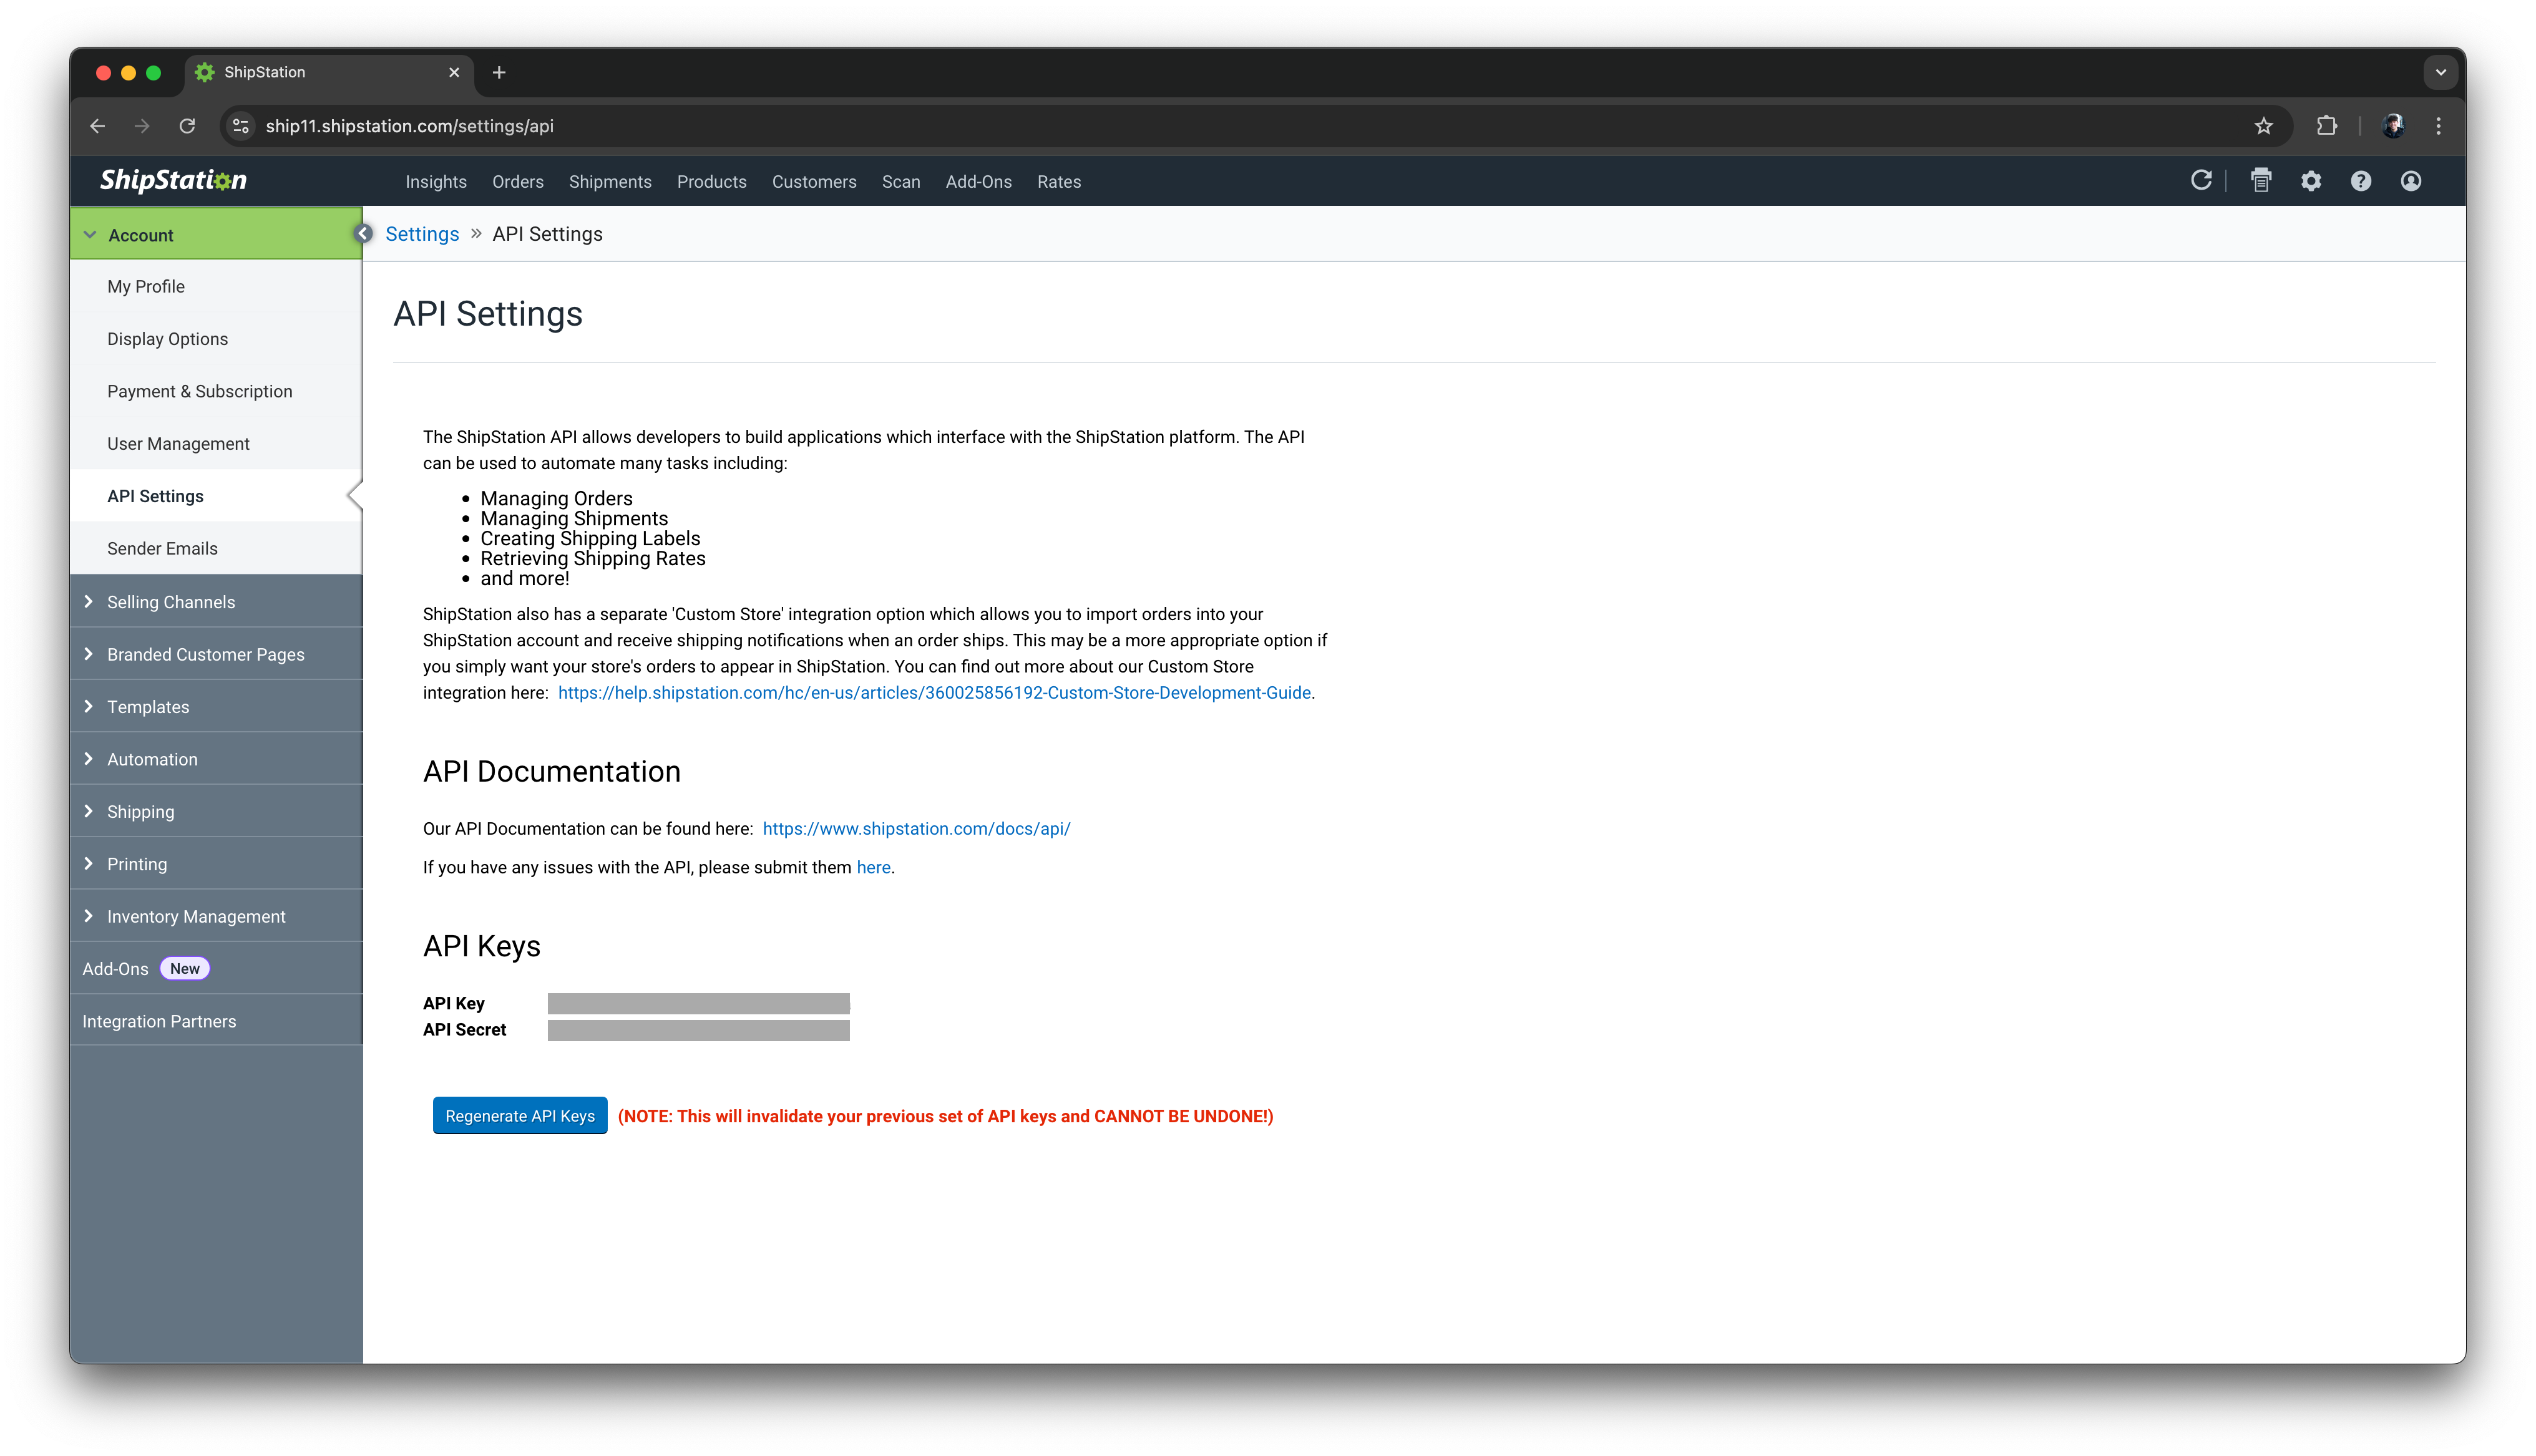
3. Save your credentials before connecting to Parabola.
🔐 Parabola | Authentication
1. Add a Pull carrier rates from ShipStation step template to your canvas.
2. Click into the Pull from API: Carriers step to configure your authentication.
3. Under the Authentication Type, select None.
4. Click into the Request Settings to configure your request using the format below:
Request Headers
💡 Tip: You can configure an Authorization Header Value using a base-64 encoder. Encode your Client ID and Client Secret separated by a colon: Client ID:Client Secret.
In Parabola, use the Header Value field to type Basic , followed by a space, and paste in your encoded credentials: Basic {encoded credentials here}.
5. Click into the Enrich with API: ShipStation Rates step and apply the same authentication settings used in steps 1-4.
Example Screenshot
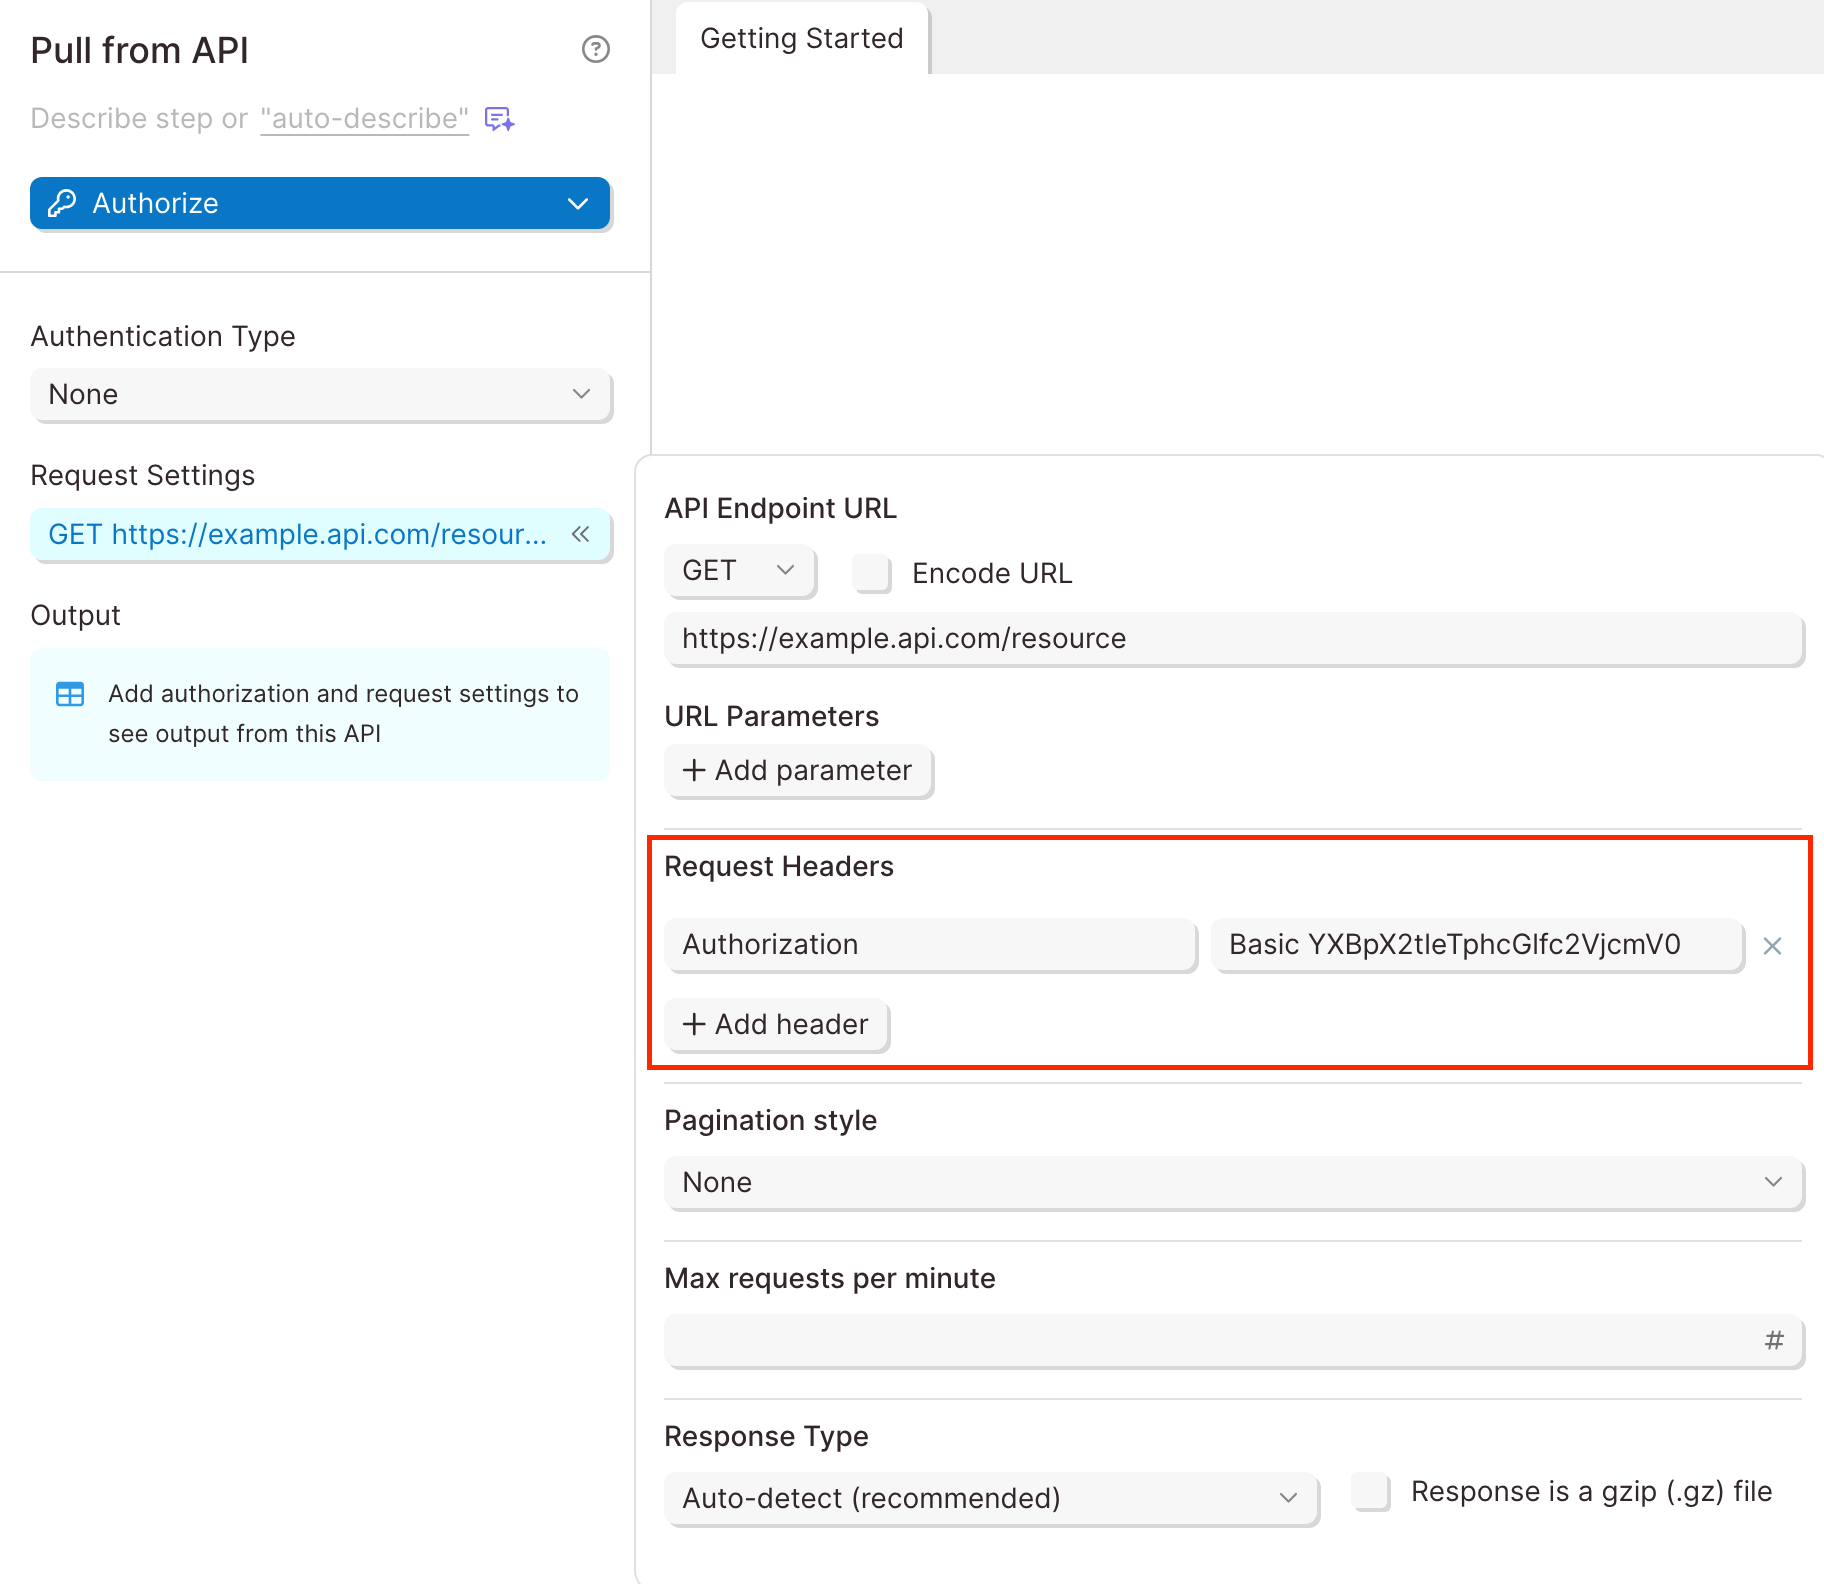
⚠️ Note: In this example, the API Key isapi_key. The API Secret isapi_secret.
Base-64 encoding the API Key and API Secret, separated by a colon, generates the following string:YXBpX2tleTphcGlfc2VjcmV0
🌐 ShipStation | Sample API Requests
Calculate shipping rates by ShipStation carriers
Get started with this template.
Load sample orders
1. Add a Use Sample data step to your canvas. You also can import a dataset with tracking numbers into your Flow (Pull from Excel File, Pull from Google Drive, Pull from API, etc.)
2. Select the Ecommerce: Orders dataset and click Refresh Data.
💡 Tip: Connect the sample data to a Limit rows step to get rates for 1 sample order.
3. Use an Add text columns step to generate a new column Merge.
- Set the column value to
1.
List all Shipstation carriers
4. Add a Pull from API step beneath the Use sample data step.
5. Click into the step. Under Authentication Type, select None.
6. Click into the Request Settings and configure a request to list all carriers in your ShipStation account:
API Endpoint URL
Request Headers
7. Click Refresh data to display the results.
8. Select orders as a Nested Key.
9. Click Refresh data once more to expand the order data into a table.
Example Screenshot
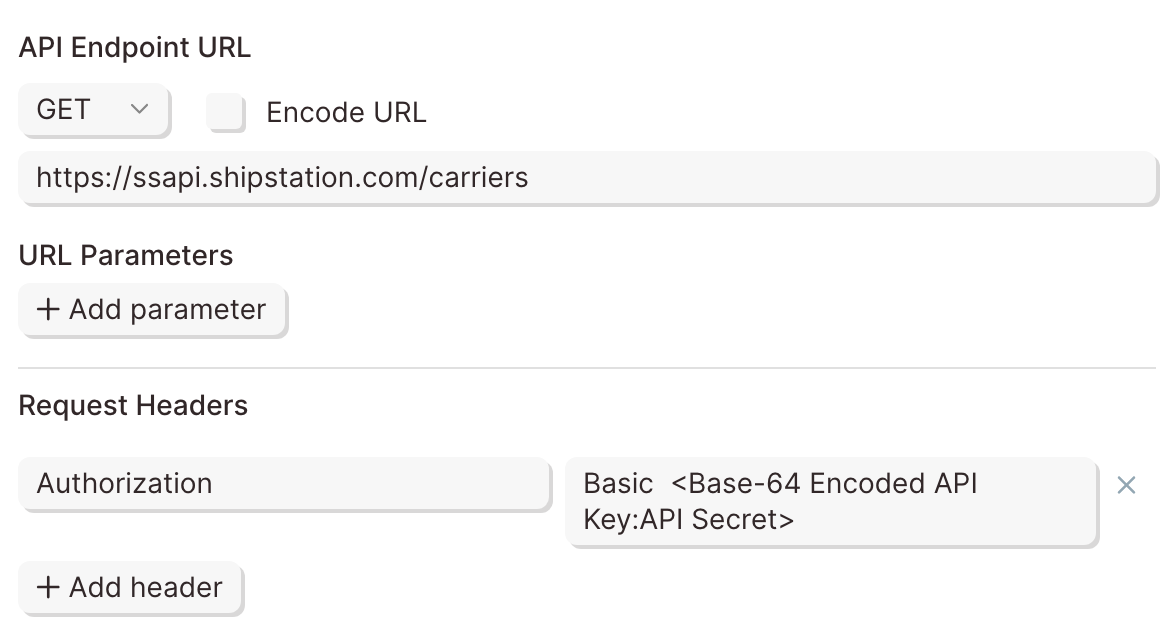
10. Connect this step to Edit columns step.
11. In the Edit columns step, keep the name and code columns.
12. Use an Add text columns step to generate a new column Merge.
- Set the column value to
1.
Map ShipStation carriers to sample orders
13. Use a Combine tables step and connect these steps:
- Input 1: Add text column (Load sample data)
- Input 2: Add text column (Import ShipStation carriers)
14. Click into the step to configure the settings.
- Keep all rows from Add text column (Load sample data)
- Keep only matching rows from Add text column (Import ShipStation carriers)
- Where the
Mergecolumn matches.
Merge product weight and dimensions
15. Copy and paste the Products - Weight and dimensions.csv file snippet into your flow: parabola:cb:86331de2-e00b-4634-b629-d37098bbbdfe
16. Use another Combine tables step and connect these steps:
- Input 1: Combine tables
- Input 2: Pull from CSV file
17. Click into the step to configure the settings.
- Input 1: Combine tables
- Input 2: Pull from CSV file
- Where the
Product TitleandProductcolumns match
Get carrier shipping rates for sample orders
18. Connect the dataset to an Enrich with API step.
19. Click into the step. Under Authentication Type, select None.
30. Click into the Request Settings to configure a request to get shipping rates for the specified shipping details:
API Endpoint URL
Request Body
Request Headers
Example Screenshots
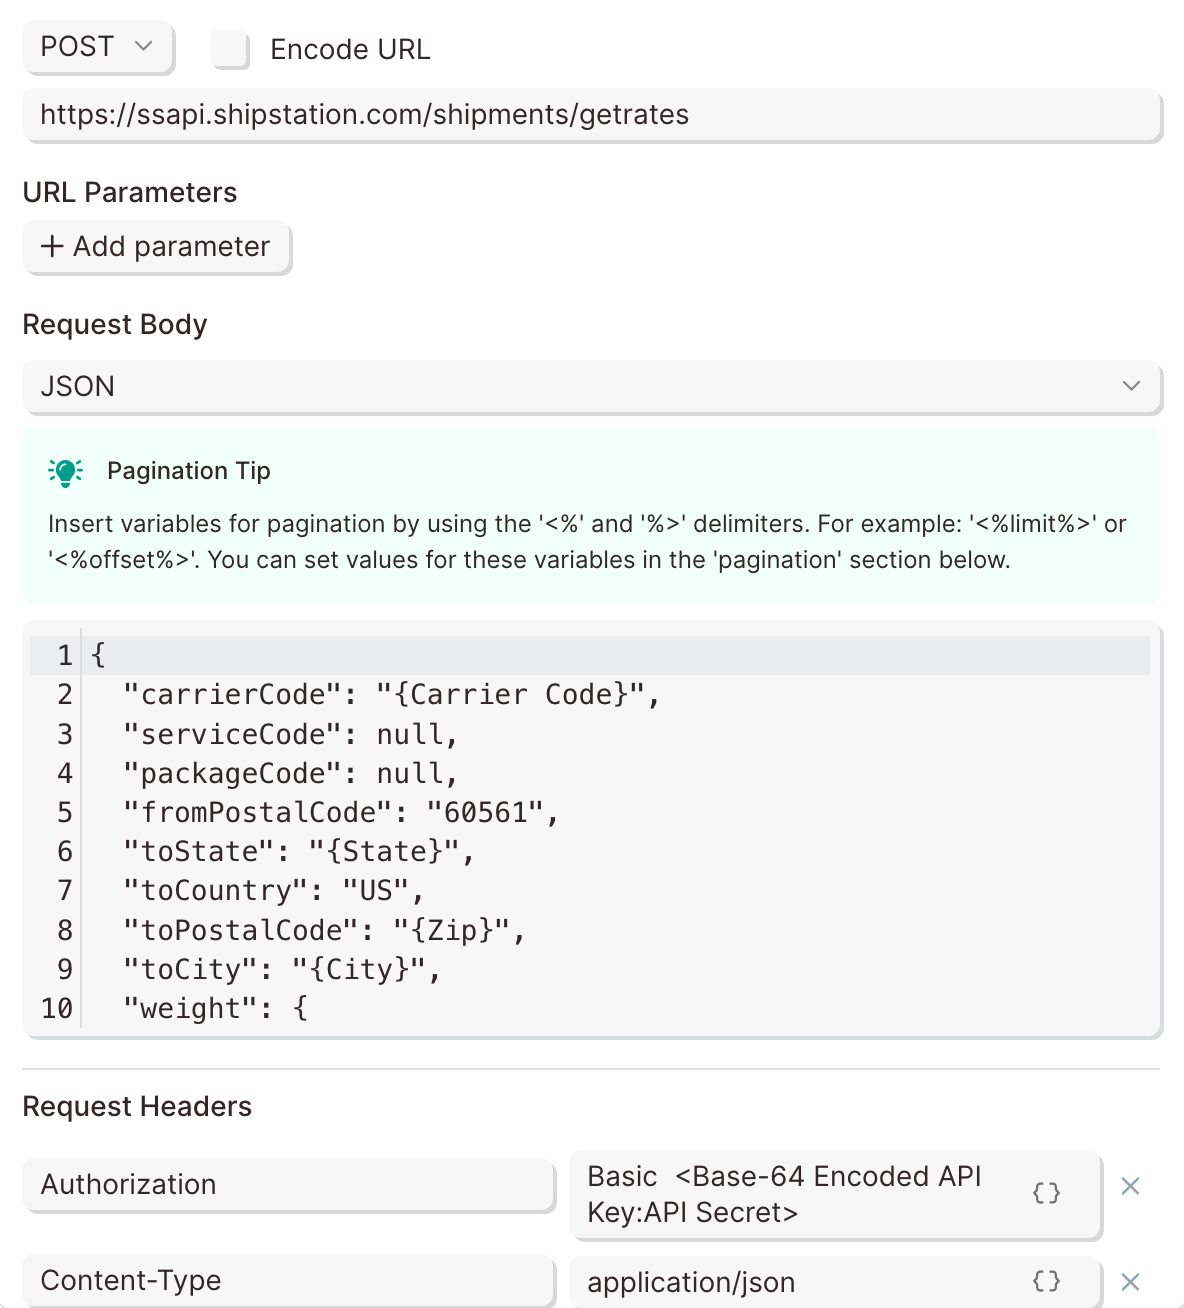
Template Screenshot
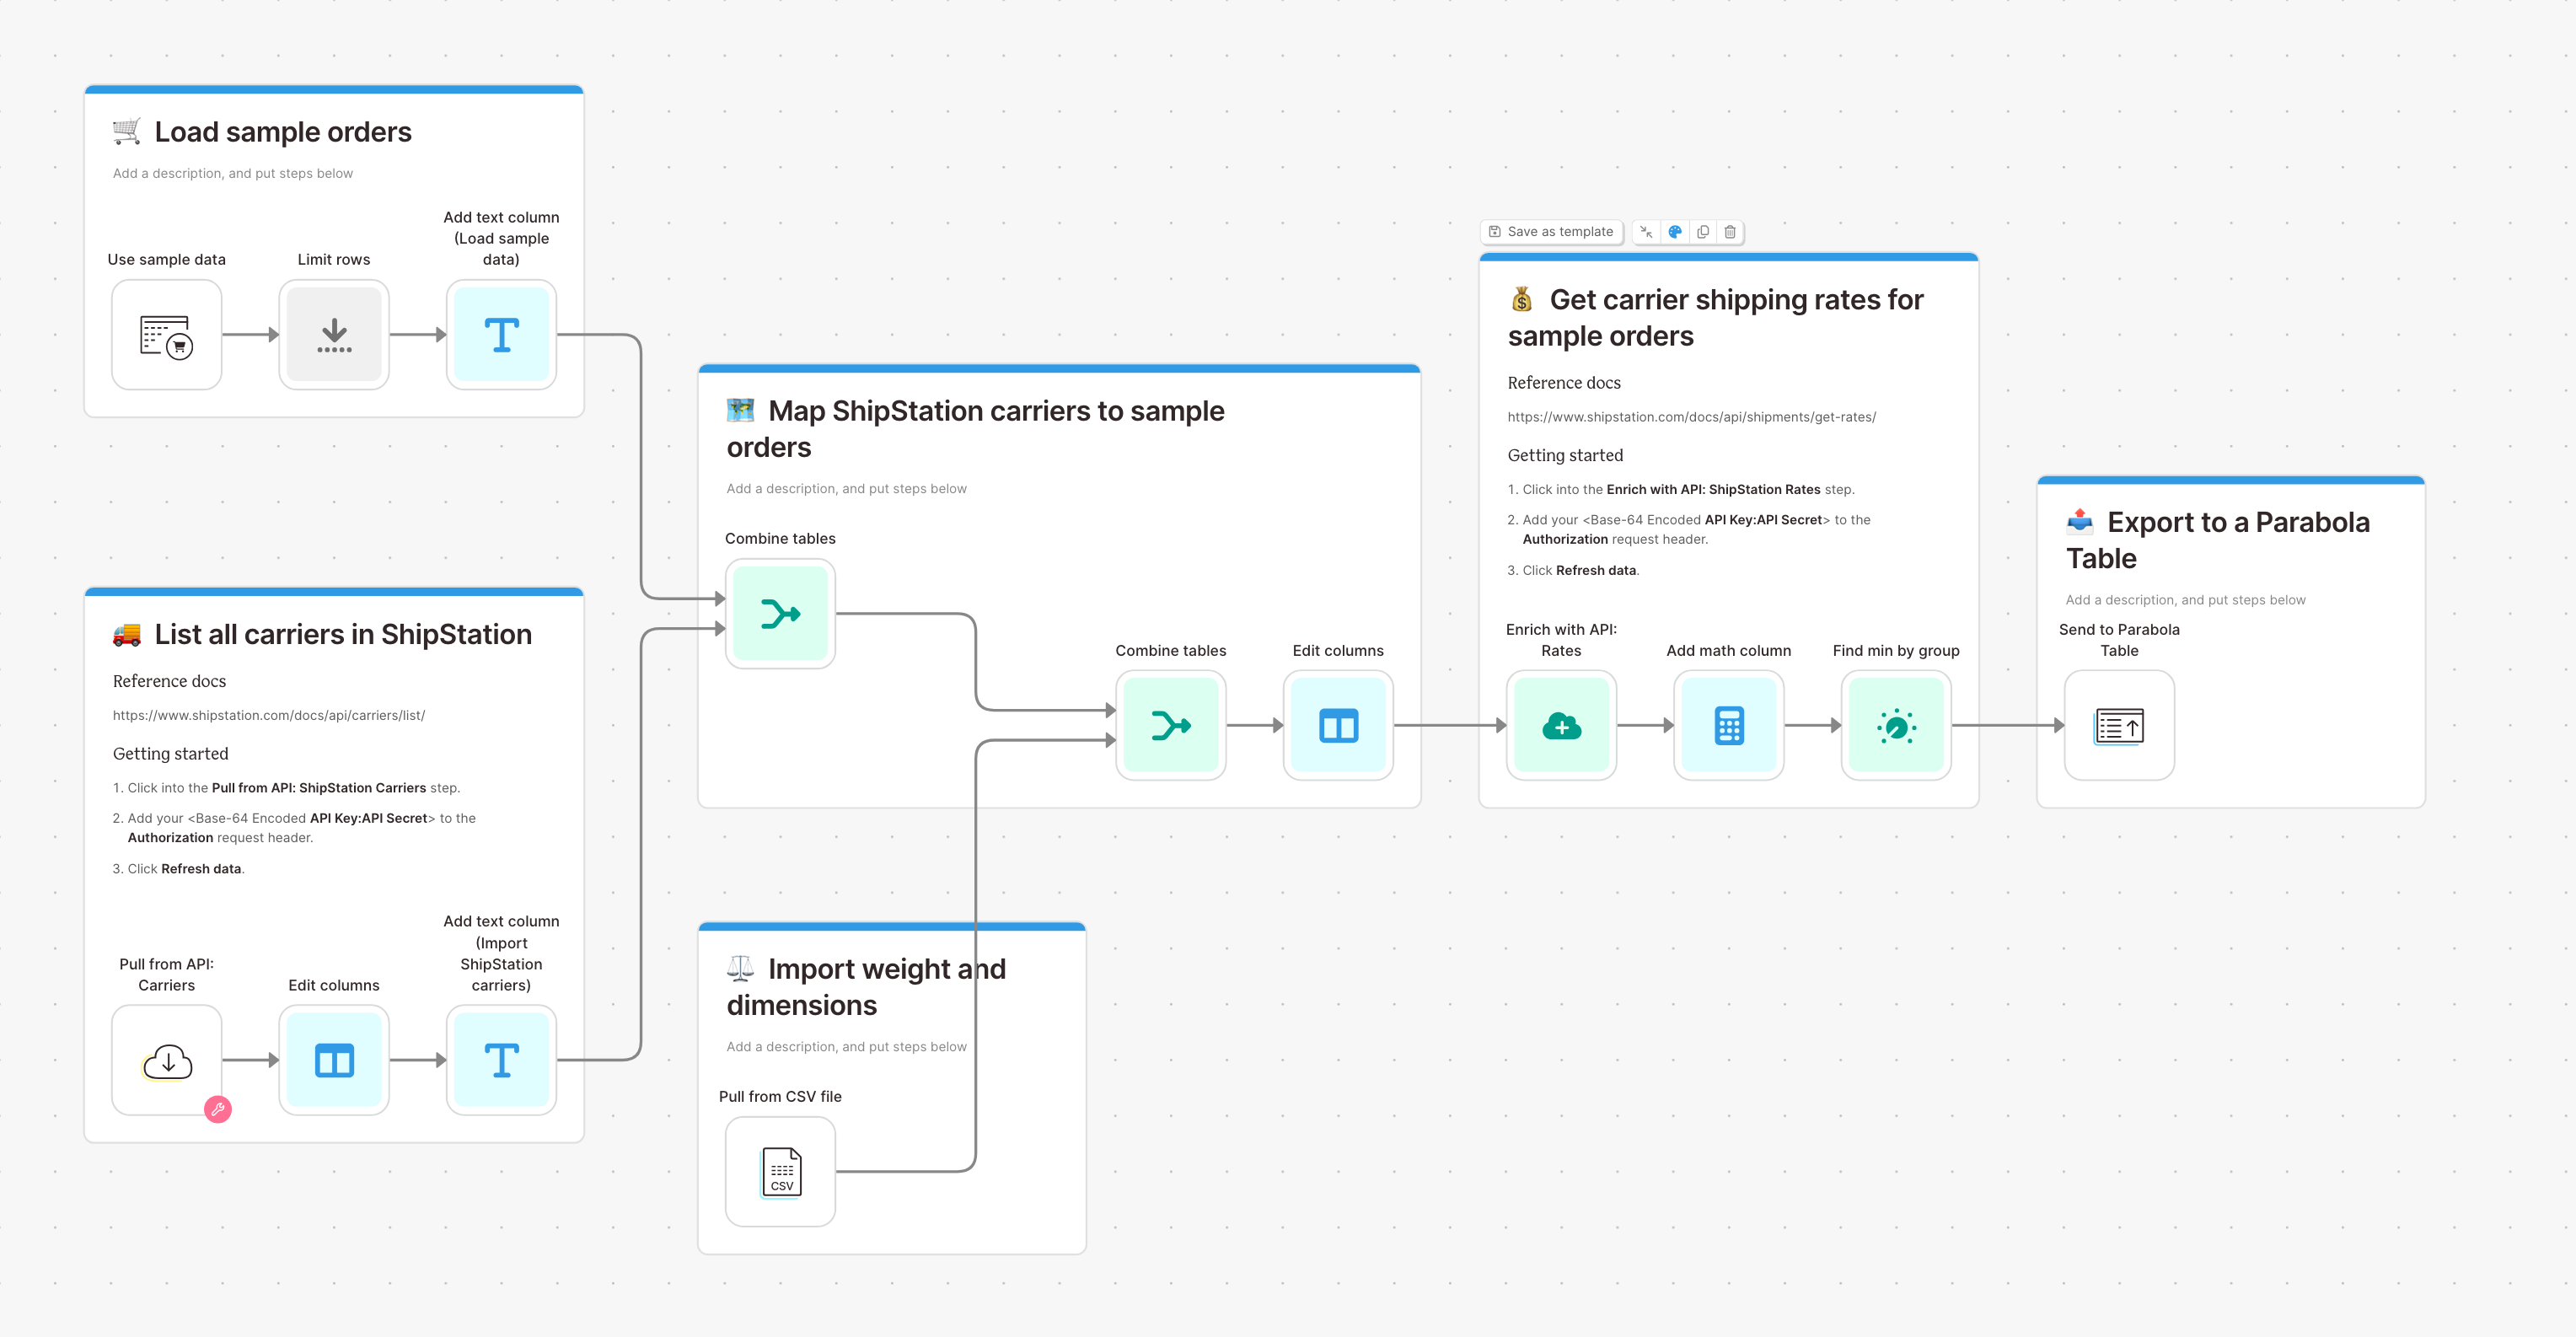
📣 Callouts
Note: The weight of the order must be provided in the API request. The dimensions are optional. Consider using an Add math column and Sum by group steps to calculate weight and dimension values by order and quantity.
Integration:
Shopify
The Pull from Shopify step can connect directly to your Shopify store and pull in orders, line item, customer, product data and much more!
This step can pull in the following information from Shopify:
- A list of Orders with the following details: Orders, a list of Line Items sold for each order, with refunds and fulfillment included, a list of Shipping Lines for each order, and Discount Applications that have been applied to your orders
- Your Shop Balance
- A list of your shop Customers
- A list of shop Disputes
- Your Product Inventory Levels per location
- A list of Location Details associated with your shop
- A list of shop Payouts
- A list of all Collections with their associated products
- A list of Products
Connect your Shopify account
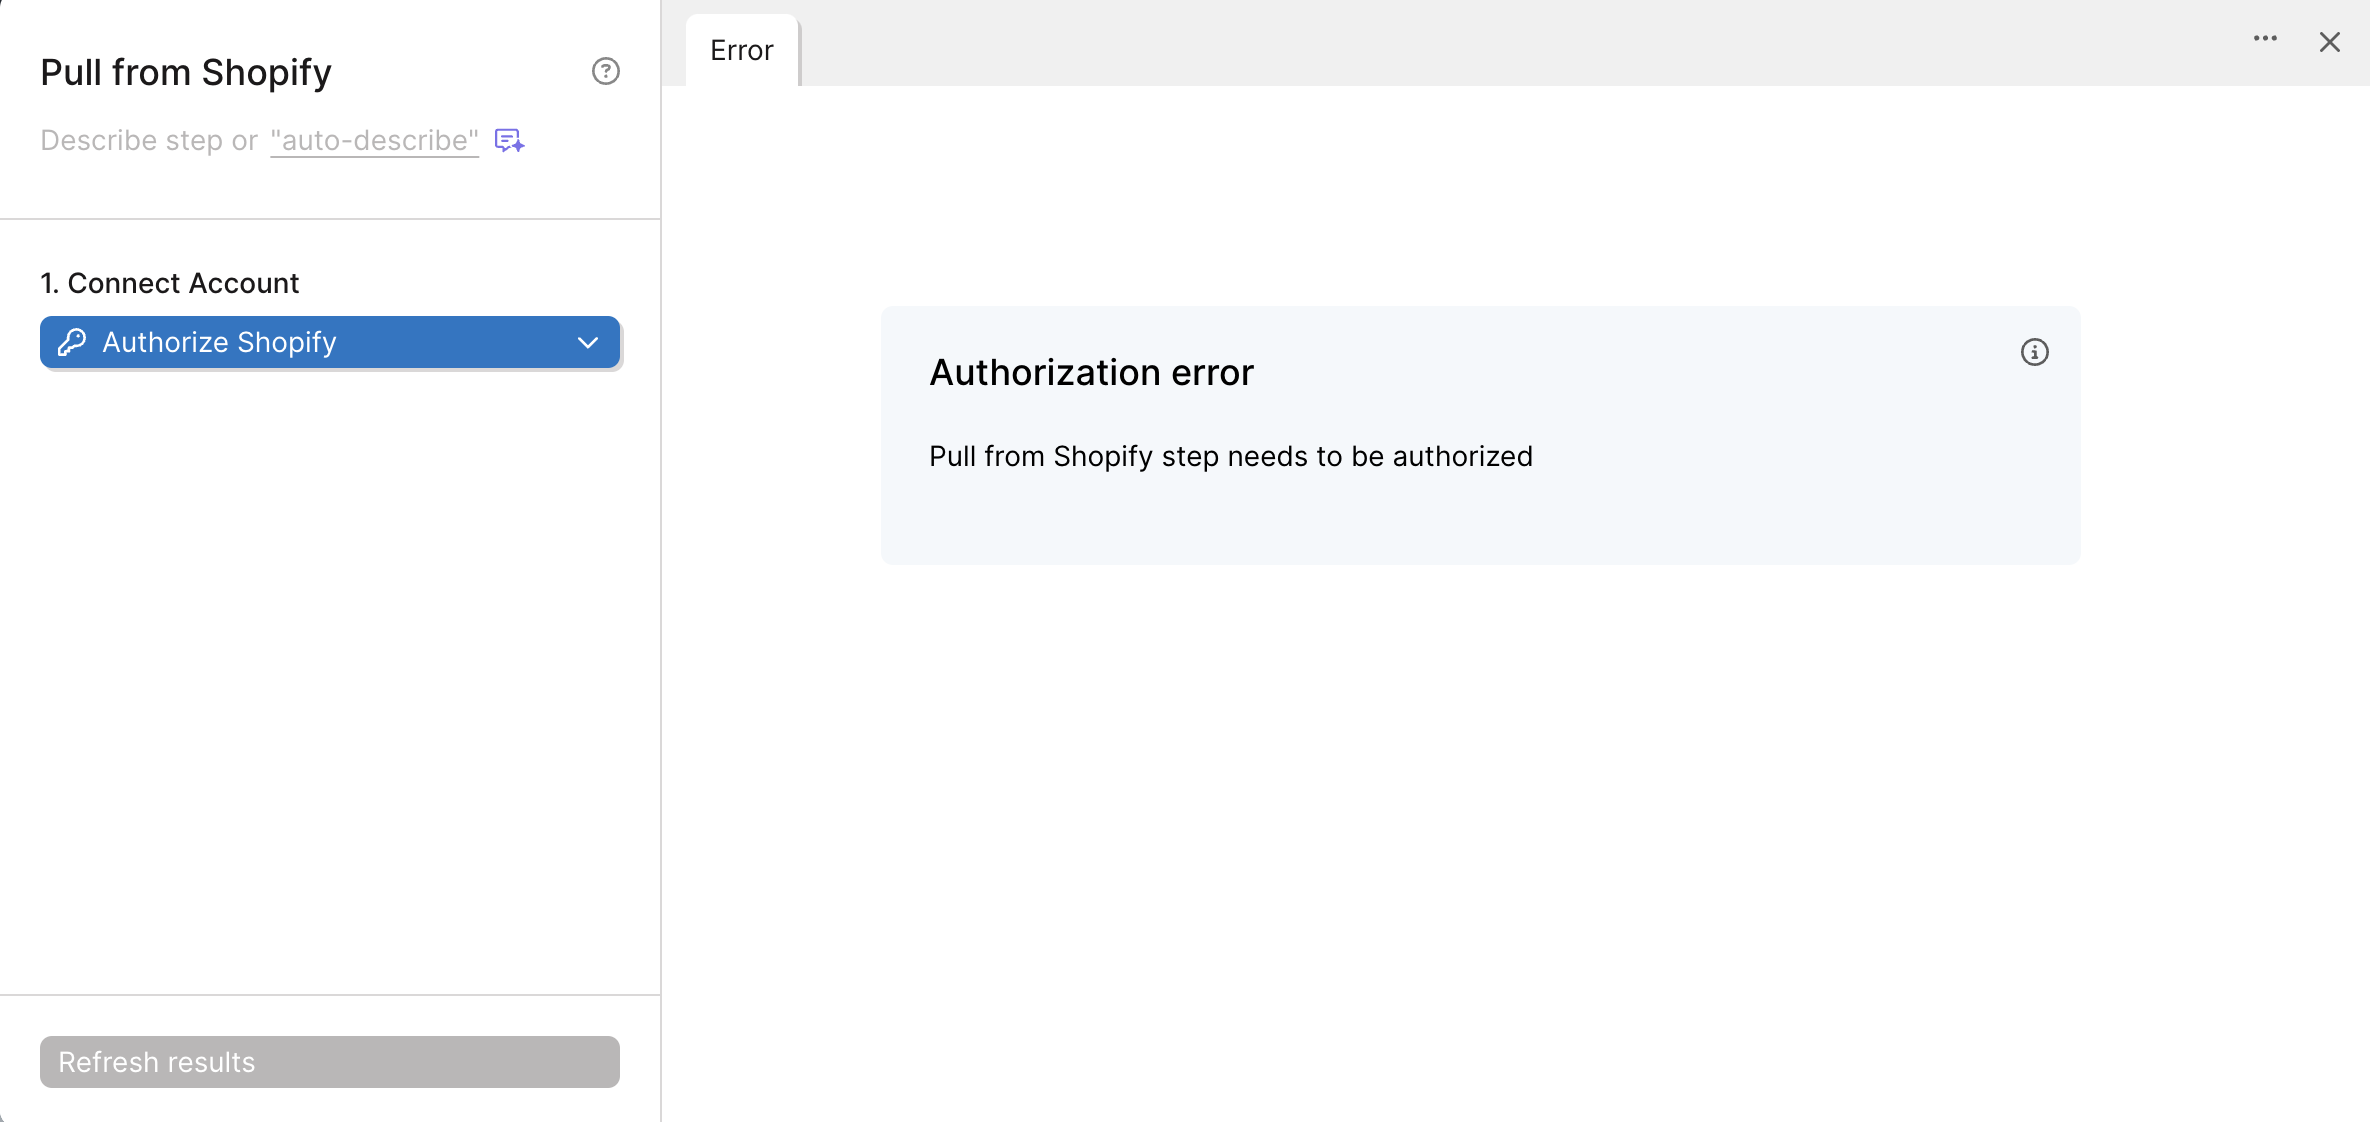
Select the blue Authorize button. If you're coming to Parabola from the Shopify App Store, you should see an already-connected Pull from Shopify step on your flow.
Default settings
By default, once you connect your Shopify account, we'll import your Orders data with Line Items detail for the last day. From here, you can customize the settings based on the data you'd like to access within Parabola.
Custom settings
This section will explain all the different ways you can customize the data being pulled in from Shopify. To customize these settings, start by clicking the dropdown in part 2 of the step.
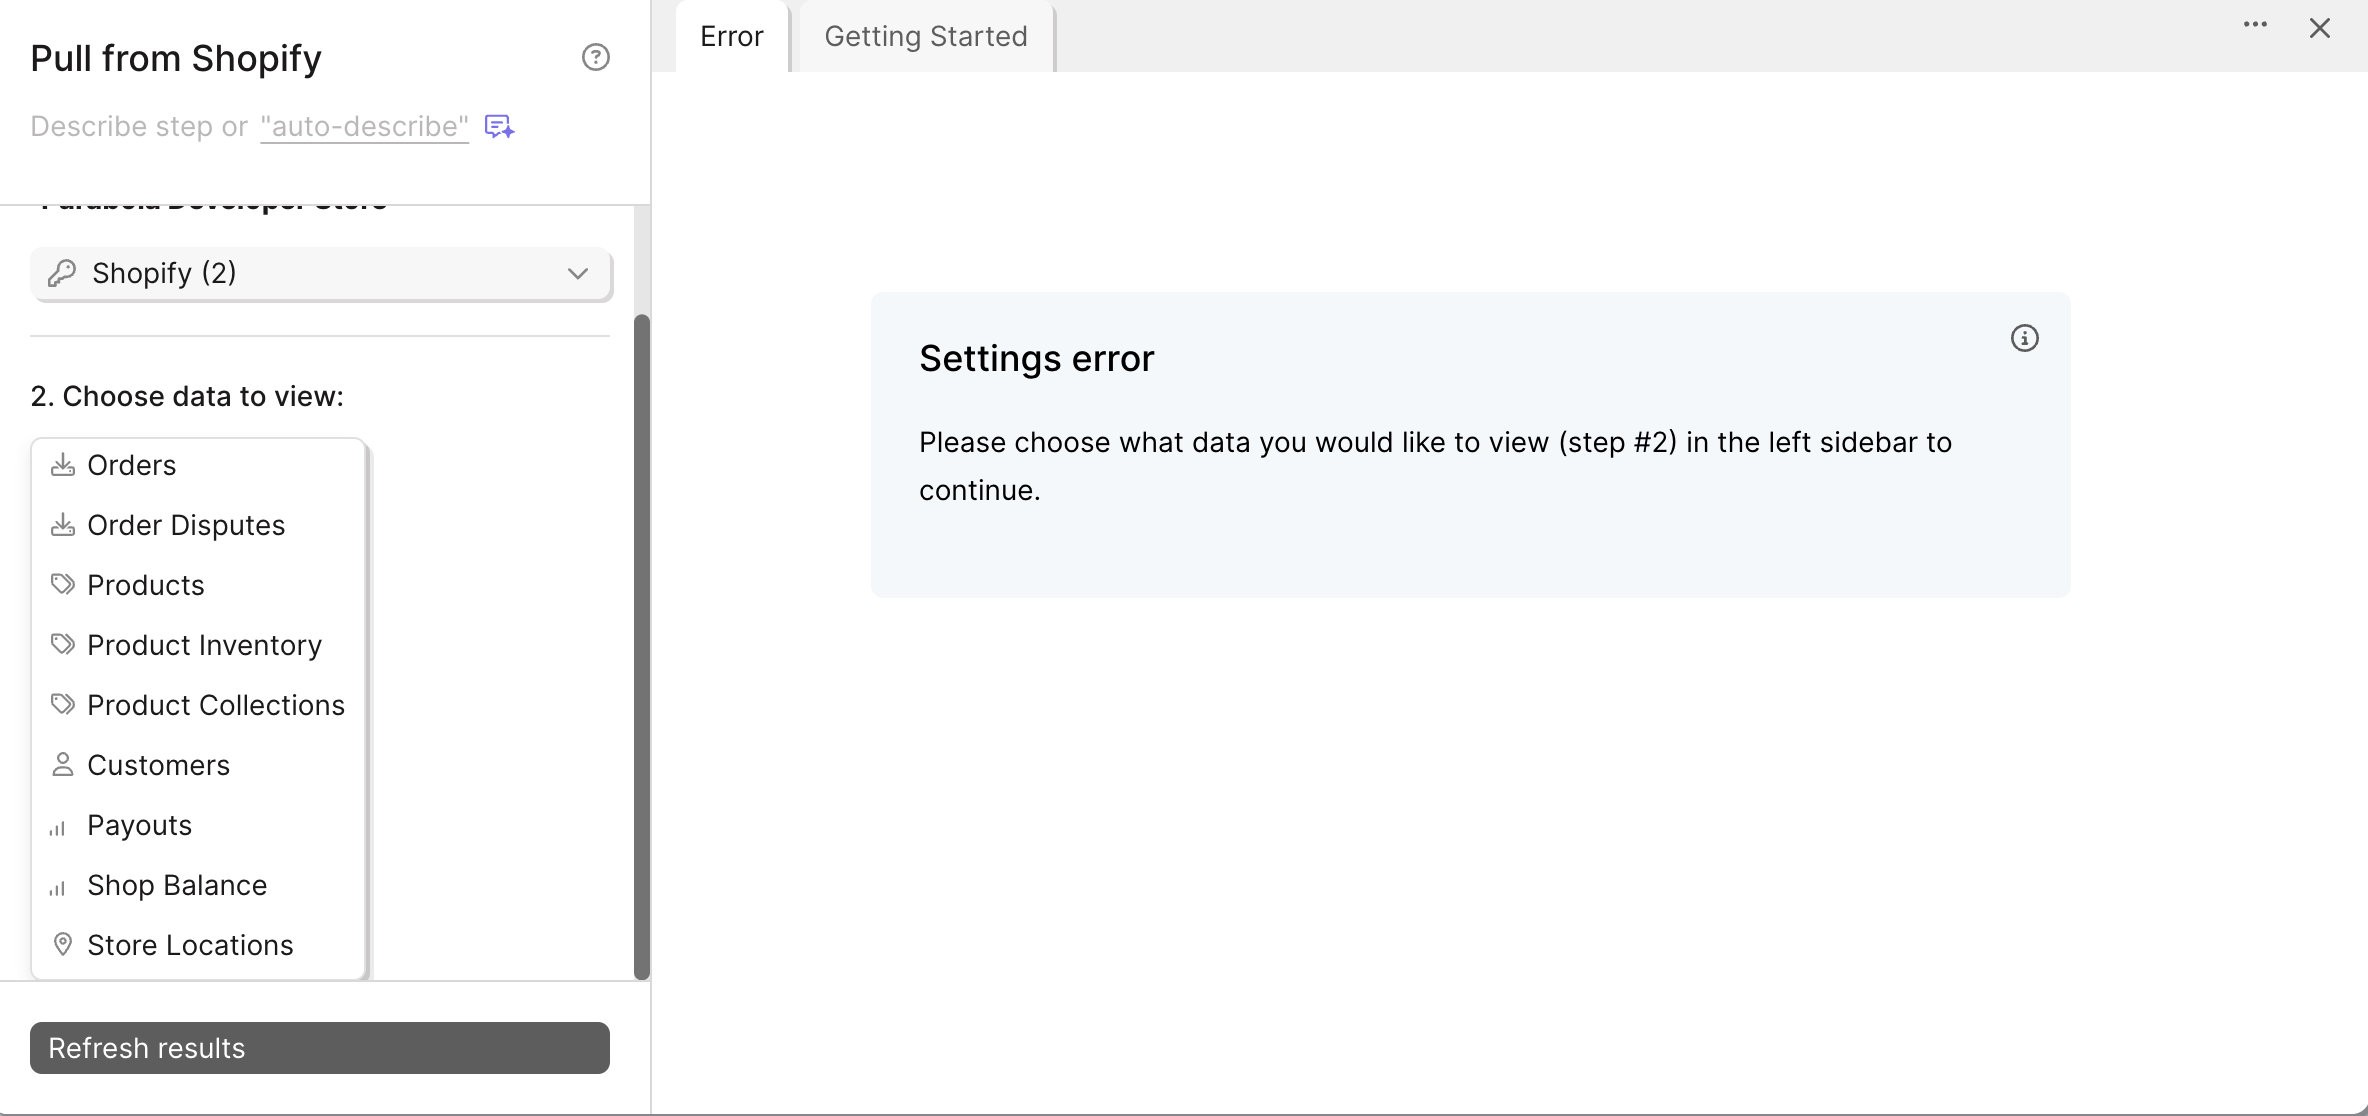
Pulling your Orders
Shopify orders contain all of the information about each order that your shop has received. You can see totals associated with an order, as well as customer information and more. The default settings will pull in any Order with the Orders detail happened in the last day. This will include information like the order total, customer information, and even the inventory location the order is being shipped from.
If you need more granular information about what products were sold, fulfilled, or returned, view your Orders with Line Items detail. This can be useful if you want relevant product data associated with each line item in the order.
Available filters for orders, line items, shipping lines, and discount applications
- Choose to include the default columns (most commonly used) or include all columns (every field that your orders contain).
- Choose to include or not include test orders
- Filter by order status: any, cancelled, closed, open, open and closed
- Filter by financial status: any, authorized, paid, partially_paid, partially_refunded, pending, refunded, unpaid, voided
- Filter by fulfillment status: any, shipped, partial, unshipped, unfulfilled (partial + unshipped)
Date filters for orders, line items, shipping lines, and discount applications
- Choose to filter your data by order processed date or refund processed date
- within the previous # day, hour, week, or month
- based on when the flow is run or the most recently completed day
- You can also add an offset to the previous period or previous year. We have a handy helper to confirm the date range we'll use to filter in the step:
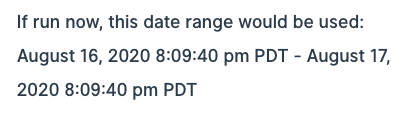
- within the current day to date, week to date, month to date, year to date
- You can add an offset to the previous period or previous year.
- after x date
- between x and y dates
Pulling your Line Items, with refunds and fulfillments
Each order placed with your shop contains line items - products that were purchased. Each order could have many line items included in it. Each row of pulled data will represent a single item from an order, so you may see that orders span across many rows, since they may have many line items.
There are 4 types of columns that show up in this pull: "Orders", "Line Items", "Refunds", and "Fulfillment columns". When looking at a single line item (a single row), you can scroll left and right to see information about the line item, about its parent order, refund information if it was refunded, and fulfillment information if that line item was fulfilled.
Pulling your Shipping Lines
As your orders are fulfilled, shipments are created and sent out. Each shipment for an order is represented as a row in this pull. Because an order may be spread across a few shipments, each order may show up more than one time in this pull. There are columns referring to information about the order, and columns referring to information about the shipment that the row represents.
Pulling your Discounts
Every order the passes through your shop may have some discounts associated with it. A shopper may use a few discount codes on their order. Since each order can have any number discount codes applied to it, each row in this pull represents a discount applied to an order. Orders may not show up in this table if they have none, or they may show up a few times! There are columns referring to information about the order, and columns referring to information about the discount that was applied.
Pulling your Shop Balance
This is a simple option that pulls in 1 row, containing the balance of your shop, and the currency that it is set to.
Pulling your Customers
This option will pull in 1 row for every customer that you have in your Shopify store records.
Available filters:
- Choose to include the default columns (most commonly used) or include all columns (every field that your orders contain).
- By default, we will only pull in the default address for each customer. Because customers may have more than one address, you can select the checkbox to "Expand rows to include all addresses". If you select this option, any customer with more than a single address will show up on multiple rows. For example, if your customer Juanita has 3 addresses in your system, then you will see 3 rows for Juanita, with the address information being the only data that is different for each of her rows.
Date filters for customer data:
- Choose to filter your data by order processed date or refund processed date
- Within the previous # day, hour, week, or month
- Based on when the flow is run or the most recently completed day
- You can also add an offset to the previous period or previous year. We have a handy helper to confirm the date range we'll use to filter in the step:
- Within the current day to date, week to date, month to date, year to date
- You can add an offset to the previous period or previous year.
- After x date
Pulling your Disputes
Retrieve all disputes ordered by the date when it was initiated, with the most recent being first. Disputes occur when a buyer questions the legitimacy of a charge with their financial institution. Each row will represent 1 dispute.
Pulling your Product Inventory
An inventory level represents the available quantity of an inventory item at a specific location. Each inventory level belongs to one inventory item and has one location. For every location where an inventory item is available, there's an inventory level that represents the inventory item's quantity at that location.
This includes product inventory item information as well, such as the cost field.
You can choose any combination of locations to pull the inventory for, but you must choose at least one. Each row will contain a product that exists in a location, along with its quantity.
Toggle "with product information" to see relevant product data in the same view as the Product Inventory.
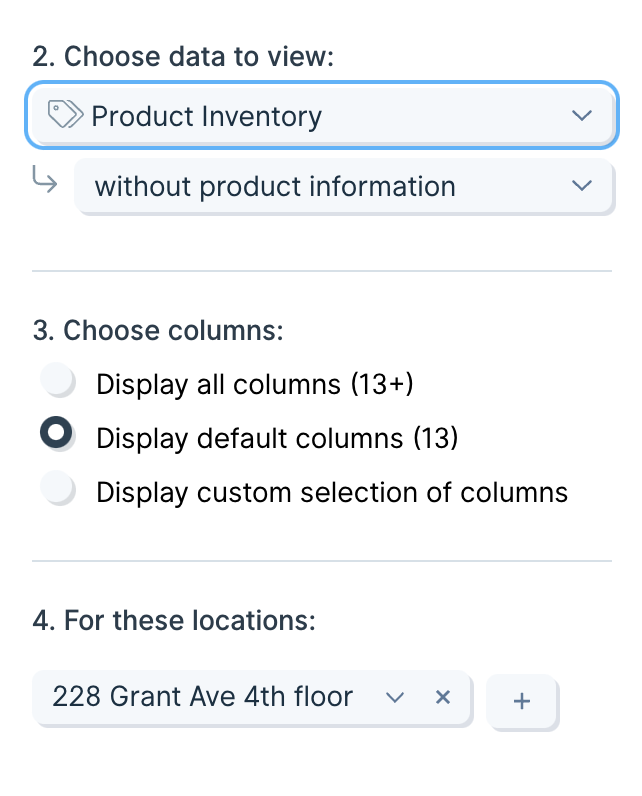
Pulling your Location Details
This is a simple option that will pull in all of your locations for this shop. The data is formatted as one row per location.
Pulling your Payouts
Payouts represent the movement of money between a Shopify Payments account balance and a connected bank account. You can use this pull option to pull a list of those payouts, with each row representing a single payout.
Pulling your Collections
Pull the name, details, and products associated with each of your collections. By default, each row returns the basic details of each collection. You can also pull the associated products with each collection.
Available filters:
- You can pull in a list of your manual collections. A manual collection contains a list of products that are manually added to the collection. They may have no relation to each other.
- You can pull in a list of your smart collections. A smart collection contains a list of products that are automatically added to the collection based on a set of shared conditions like the product title or product tags.
Pulling your Products
This pulls in a list of your products. Each row represents product variant since a product can have any number of variants. You may see that a product is repeated across many rows, with one row for each of its variants. When you set up a product, it is created as a variant, so products cannot exist without having at least one variant, even if it is the only one.
Available filters:
- Choose to include the default columns (most commonly used) or include all columns (every field that your orders contain).
- By default, we will only pull in one image per variant. Because you may have multiple images per variant, you can select the checkbox to "Expand rows to include all images". If you select this option, for product variants with many images, each image will be added to a new row, so product variant XYZ may show up on 3 rows if there are 3 images pulled for it.
- You can also filter down your products by a few attributes: collection_id, handle, product_type, published status, title, and vendor.
The Send to Shopify step can connect directly to your Shopify store and automatically update information in your store.
This step can perform the following actions in Shopify:
- Create new customers
- Update existing Customers
- Delete existing Customers
- Add products to collections
- Delete product-collection relationships
- Update existing inventory items
- Adjust existing inventory levels
- Reset inventory levels
- Issue refunds by line items
Connect your Shopify account
To connect your Shopify account from within Parabola, click on the blue "Authorize" button. For more help on connecting your Shopify account, jump to the section: Authorizing the Shopify integration and managing multiple stores.
Custom settings
Once you connect a step into the Send to Shopify step, you'll be asked to choose an export option.
The first selection you'll make is whether this step is enabled and will export all data or disabled and will not export any data. By default, this step will be enabled, but you can always disable the export if you need to for whatever reason.
Then you can tell the step what to do by selecting an option from the menu dropdown.
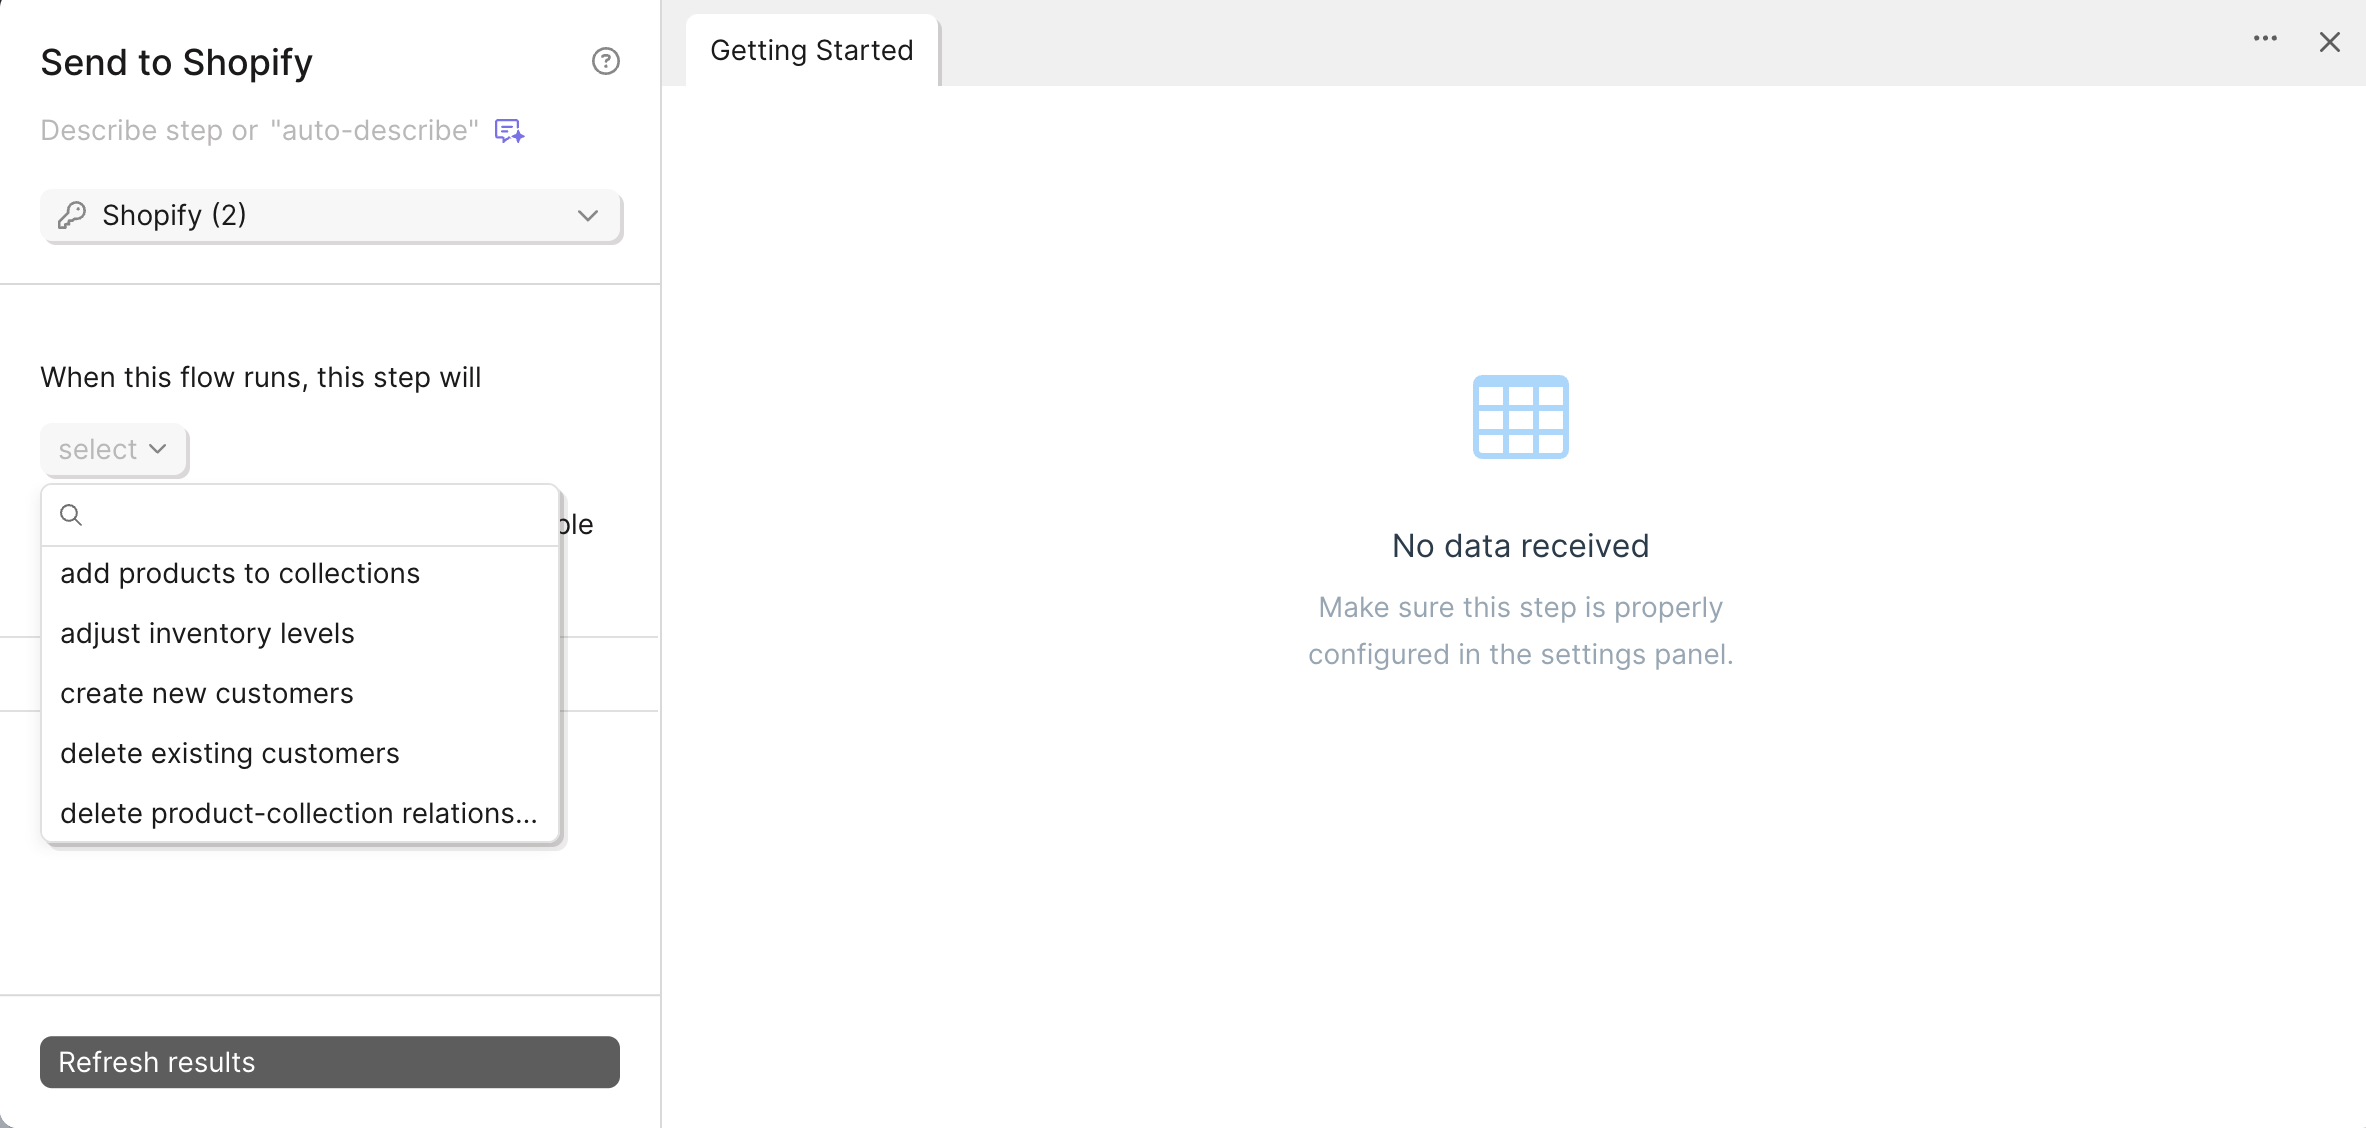
Create New Customers
When using this option, every row in your input data will be used to create a new customer, so be sure that your data is filtered down to the point that every row represents a new customer to create.
When using this step, any field that is not mapped in the settings table in the step will not be sent. Only the mapped fields will be sent to Shopify.
Every customer must have either a unique Phone Number or Email set (or both), so be sure those fields are present, filled in, and have a mapping.
If you create customers with tags that do not already exist in your shop, the tags will still be added to the customer.
The address fields in this step will be set as the primary address for the customer.
Update Existing Customers
When using this option, every row in your input data will be used to update an existing customer, so be sure that your data is filtered down to the point that every row represents a customer to update.
When using this step, any field that is not mapped in the settings table in the step will not be sent. Only the mapped fields will be sent to Shopify.
Every customer must have a Shopify customer ID present in order to update successfully, so be sure that column is present, has no blanks, and is mapped to the id field in the settings.
The address fields in this step will be edit the primary address for the customer.
Delete Existing Customers
When using this option, every row in the step will be used to delete an existing customer, so be sure that your data is filtered down to the point that every row represents a customer to delete.
This step only requires a single field to be mapped - a column of Shopify customer IDs to delete. Make sure your data has a column of those IDs without any blanks. You can find the IDs by using the Pull from Shopify step.
Add Products to Collection
Collections allow shops to organize products in interesting ways! When using this option, every row in the step will be used to add a product to a collection, so be sure that your data is filtered down to the point that every row represents a product to add to a collection.
When using this option, any field that is not mapped in the settings table in the step will not be sent. Only the mapped fields will be sent to Shopify.
You only need two mapped fields for this option to work - a Shopify product ID and a Shopify Collection ID. Each row will essentially say, "Add this product to this collection".
Delete Product-Collection Relationships
Why is this option not called "Remove products from collections" if that is what it does? Great question. Products are kept in collections by creating a relationship between a product ID and a Collection ID. That relationship exists, and has its own ID! Imagine a spreadsheet full of rows that have product IDs and Collection IDs specifying which product belongs to which collections - each of those rows needs their own ID too. That ID represents the relationship. In fact, you don't need to imagine. Use the Pull from Shopify step to pull in Product-Collection Relationships. Notice there is an ID for each entry that is not the ID of the product or the collection. That ID is what you need to use in this step.
When using this option, every row in the step will be used to delete a product from a collection, so be sure that your data is filtered down to the point that every row represents a product-collection relationship that you want to remove.
This step does not delete the product or the collection! It just removes the product from the collection.
When using this step, any field that is not mapped in the settings table in the step will not be sent. Only the mapped fields will be sent to Shopify.
You need 1 field mapped for this step to work - it is the ID of the product-collection relationship, which you can find by Pulling those relationships in the Pull from Shopify step. In the step, it is called a "collect_id", and it is the "ID" column when you pull the product-collection relationships table.
Update Existing Inventory Items
What's an inventory item? Well, it represents the goods available to be shipped to a customer. Inventory items exist in locations, have SKUs, costs and information about how they ship.
There are a few aspects of an inventory item that you can update:
- Cost: The unit cost associated with the inventory item - should be a number, such as 10 or 10.50
- SKU: Any string of characters that you want to use as the SKU for this inventory item
- Tracked: Whether the inventory item is tracked. Set this to true or false
- Requires Shipping: Whether a customer needs to provide a shipping address when placing an order containing the inventory item. Set this to true or false
When using this step, you need to provide an Inventory Item ID so that the step knows which Item you are trying to update. Remember, any field that is not mapped in the settings table in the step will not be sent. Only the mapped fields will be seny to Shopify.
“Update” option behavior
When using the “Update” option in the Send to Shopify step, Parabola will overwrite all existing values for any fields that are mapped in the step’s settings table. This behavior is standard for update requests and ensures that Shopify reflects the exact data provided in your flow.
Any fields not mapped will remain unchanged in Shopify. To avoid unintended data loss or partial updates, make sure to explicitly map all fields you want to update and double-check your input data before running the flow.
Adjust Existing Inventory Levels
When using this option, every row in the step will be used to adjust an existing item's inventory level, so be sure that your data is filtered down to the point that every row represents an item to adjust.
When using this step, any field that is not mapped in the settings table in the step will not be sent. Only the mapped fields will be sent to Shopify.
Every item must have a Shopify inventory item ID present in order to adjust successfully, so be sure that column is present, has no blanks, and is mapped to the id field in the settings.
You must provide the inventory item ID, the location ID where you want to adjust the inventory level, and the available adjustment number. That available adjustment number will be added to the inventory level that exists. So if you want to decrease the inventory level of an item by 2, set this value to -2. Similarly, use 5 to increase the inventory level by 5 units.
Reset Inventory Levels
When using this option, every row in the step will be used to reset an existing item's inventory level, so be sure that your data is filtered down to the point that every row represents an item to reset.
When using this step, any field that is not mapped in the settings table in the step will not be sent. Only the mapped fields will be sent to Shopify.
Every item must have a Shopify inventory item ID present in order to reset successfully, so be sure that column is present, has no blanks, and is mapped to the id field in the settings.
You must provide the inventory item ID, the location ID where you want to adjust the inventory level, and the available number. That available number will be used to overwrite any existing inventory level that exists. So if you want to change an item's inventory from 10 to 102, then set this number to 102.
To use the Pull from Shopify or Send to Shopify steps, you'll need to first authorize Parabola to connect to your Shopify store.
To start, you will need your Shopify shop URL. Take a look at your Shopify store, and you may see something like this: awesome-socks.myshopfy.com - from that you would just need to copy awesome-socks to put into the first authorization prompt:
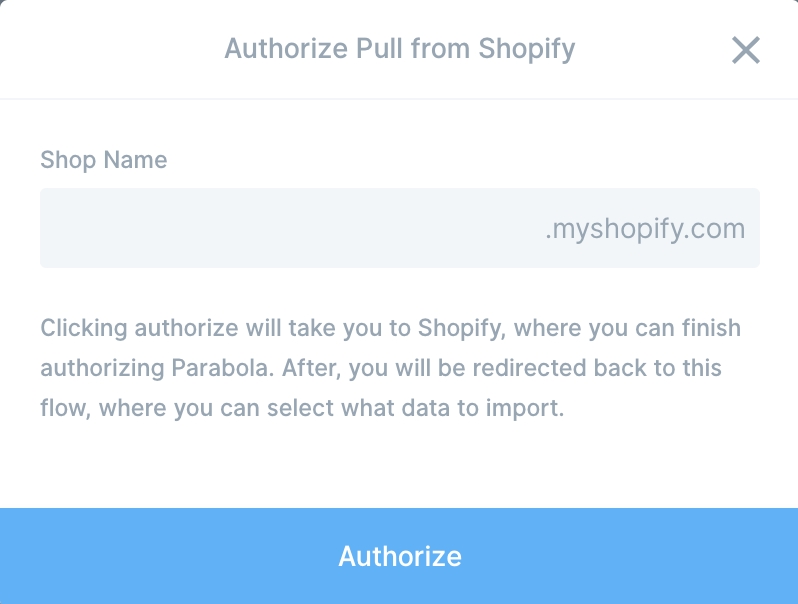
After that, you will be shown a window from Shopify, asking for you to authorize Parabola to access your Shopify store. If you have done this before, and/or if you are logged into Shopify in your browser, this step may be done automatically.
Parabola handles authorization on the flow-level. Once you authorize your Shopify store on a flow, subsequent Shopify steps you use on the same flow will be automatically connected to the same Shopify store. For any new flows you create, you'll be asked to authorize your Shopify store again.
Editing your authorization
You can edit your authorizations at any time by doing the following:
- Open your Pull from Shopify or Send to Shopify step.
- Click on the authorization dropdown near the top of the result view.
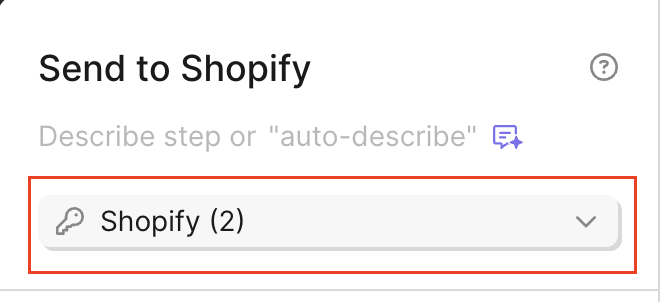
- Click on "Edit accounts" at the bottom of the dropdown.
- Click the three dots next to the Shopify Auth that you are currently using or want to edit.
- We recommend that you rename your Account Name so you can easily keep track of which Shopify store you're connected to.
Managing multiple Shopify stores in a single flow
If you manage multiple Shopify stores, you can connect to as many separate Shopify stores in a single flow as you need. This is really useful because you can combine data from across your Shopify-store and create wholistic custom reports that provide a full picture of how your business is performing.
Adding an authorization for another Shopify Store
- Open your Pull from Shopify or Send to Shopify step.
- Click on authorization dropdown at the top of the result view.
- Click on "Add new account" in the dropdown.

- Another authorization window will appear for you to authorize to a different store. Don't worry, connecting to a different store in one Shopify step will not impact the already-connected Shopify steps already on your flow.
- The "Edit Accounts" menu is how you can switch which account a step is pulling from or pushing to. We recommend renaming the Account Name of your various Shopify accounts so it's easier to toggle in between your different accounts.
Deleting a Shopify account from authorization
Please note that deleting a Shopify account from authorization will remove it from the entire flow, including any published versions.
- Open your Pull from Shopify or Send to Shopify step.
- Click on authorization dropdown near the top of the result view.
- Click Edit accounts.
- Click on the three dots next to the Shopify account that you'd like to remove authorization for and choose the delete option.
This article goes over the date filters available in the Pull from Shopify step.
The Orders and Customer pulls from the Pull from Shopify step have the most complex date filters. We wanted to provide lots of options for filtering your data from within the step to be able to reduce the size of your initial import and pull exactly the data you want to see.
Date filters can be a little confusing though, so here's a more detailed explanation of how we've built our most complex date filters.
The date filters in the Pull from Shopify step, when available, can be found the bottom of the lefthand side, right above the "Show Updated Results" button.
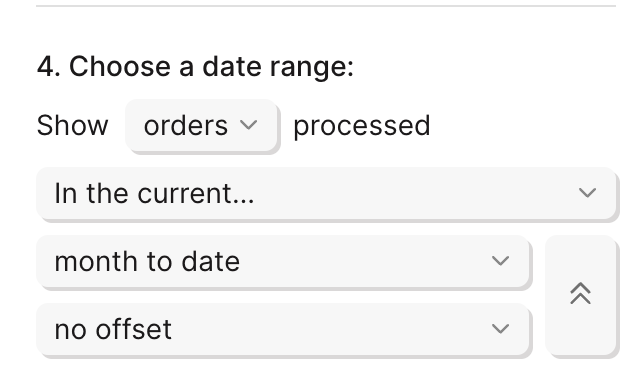
The first date filter you can set is:
- within the previous # day, hour, week, or month
- based on when the flow is run or the most recently completed day
- You can also add an offset to the previous period or previous year
- Example 1: If today is August 17, 2020, and I select within the previous 1 day based on the most recently completed day with no offset, the date range used would be August 16, 2020 12:00am PDT -August 17, 2020 12:00am PDT. Since August 16, 2020 was the most recently completed day, it's pulling in data from that day.
- Example 2: If today is August 17, 2020, and I select within the previous 1 week based on when the flow is run offset to the previous period, the date range used would be August 3, 2020 - August 10, 2020. This is temporarily calculated based on the assumption that I'll run my flow soon. It will be automatically recalculated at the time I actually run my flow. The previous one week from today would be August 10, 2020-August 17, 2020. Since I'm offsetting to the previous period (one week), the date range is pulling data from the week prior.
- Example 3: If today is August 17, 2020, and I select within the previous 1 month based on the most recently completed month offset to the previous year, the date range used is July 1, 2019 12:00am PDT - August 1, 2019 12:00am PDT. The most recently created month will be July 2020 and I want to pull data from that month. By offsetting to the previous year, I see data from July 2019.
The second date filter you can set is:
- within the current day to date, week to date, month to date, year to date
- You can add an offset to the previous period or previous year.
- Example 1: If today is August 17, 2020, and I select within the current month to date with no offset, the date range used will be August 1, 2020-August 17, 2020.
- Example 2: If today is August 17, 2020, and I select within the current year to date with offset to the previous period, the date range used will be January 1, 2019-August 17, 2019. The previous period in this situation is the same time frame, just the year before.
- Example 3: If today is Tuesday, August 17, 2020 and I select within the current week to date with offset to the previous year, the date range used will be August 16, 2019-August 17, 2019. Week to date is calculated from Sunday being the first day of the week. Offsetting to the previous year will take the same dates, but pull data from those date from the previous year.
The third date filter you can set is:
- after x date
- Example: after January 1, 2020
The fourth and last date filter you can set is:
- between x and y dates
- Example: between January 1, 2020 and June 30, 2020
Time zones
In this step, we indicate what time zone we're using to pull your data. This time zone matches the time zone selected for your Shopify store.
Confirming the date range
At the bottom of the lefthand panel of your step, if you're still uncertain if you've configured the date filters correctly, we have a handy helper to confirm the date range we'll use to filter in the step:
This article explains how to reproduce the most commonly-used Shopify metrics. If you don't see the metric(s) you're trying to replicate, send us a note and we can look into it for you.
The Shopify Overview dashboard is full of useful metrics. One problem is that it doesn't let you drill into the data to understand how it's being calculated. A benefit of using Parabola to work with your Shopify data is that you can easily replicate most Shopify metrics and see exactly how the raw data is used to calculate these overview metrics.
Total Sales by line items
This formula will show you the total sales per line item by multiplying the price and quantity of the line items sold.
Import Orders with Line Items details
{Line Items: Quantity} * {Line Items: Price}
Total Refunds by line items
This formula will show you the total refund per line item by multiplying the refunded amount and refunded quantity. In this formula, we multiply by 1 to turn it into a negative number. If you'd like to display your refunds by line items as a positive number, just don't multiply by 1.
Import Orders with Line Items details
{Refunds: Refund Line Items: Quantity} * {Refunds: Refund Line Items: Subtotal}*-1
Net quantity
This formula will show you the net quantity of items sold, taking into account and removing the items that were refunded.
Import Orders with Line Items details
First, use the Sum by group step to sum "Line Items: Quantity" and "Refunds: Refund Line Items: Quantity"
Then, use the newly generated "sum" columns for your formula.
{Line Items: Quantity (sum)}-{Refunds: Refund Line Items: Quantity (sum)}
Gross sales
Import Orders with Orders details.
Add a Sum by group step. Sum the "Total Line Items Price" column.
Net sales
Import Orders with Orders details.
To calculate net sales, you'll want to get gross sales - refunds - discounts. This will require two steps:
- Add a Sum by group step and sum the following columns: "Total Line Items Price", "Total Refunded Amount", and "Total Discounts".
- Add an Insert Math Column step and add in the following equation:
{Total Line Items Price (sum)}-{Total Refunded Amount (sum)}-{Total Discounts (sum)}
Total sales
Import Orders with Line Items details.
To calculate total sales, you'll want to get gross sales + taxes - refunds - discounts. This will require three steps:
- Add an Insert math column step and add in the following equations to get gross sales and call the column, "Sales":
{Line Items: Quantity} * {Line Items: Price}
- Add in a Sum by group step and sum the following columns: {Sales}, {Line Items: Total Discount Allocations}, {Refunds: Refund Line Items: Subtotal}, {Line Items: Total Tax Lines}, and {Refunds: Refund Line Items: Total Tax}.
- Add in an Insert math column step with the following equation:
{Sales (sum)} + ({Refunds: Refund Line Items: Subtotal}*-1) - {Line Items: Total Discount Allocations (sum)} + ({Line Items: Total Tax Lines (sum)} - {Refunds: Refund Line Items: Total Tax (sum)})
Total refunds
Import Orders with Orders details.
- Add a Sum by group step and sum the following column: "Total Refunded Amount".
Total discounts
Import Orders with Orders details.
- Add a Sum by group step and sum the following column: "Total Discounts".
Total tax
Import Orders with Orders details.
- Add a Sum by group step and sum the following column: "Total Tax".
Average order value
Import Customers. This table will give us Total Spent per customer as well as the # of Orders by customer.
- Add a Sum by group step and sum the columns: {Orders Count} and {Total Spent}.
- Add an Insert math column step and use the following calculation:
{Total Spent (sum)} / {Orders Count (sum)}.
Alternatively, import Orders.
- Add an Insert math column step and create a new column called Orders with the following calculation: =1
- Add a Sum by group step and sum the columns: Orders and Total price
- Add an Insert math column step and create a new column called Average Order Value and use the following calculation:
{Total Price (sum)} / {Orders (sum)}
Number of orders
Use the Count by group step after pulling in orders.
Integration:
Slack
Use the Send to Slack step to automatically post messages from your Parabola flow into a Slack channel or DM.

Setup & Authentication
The first person to install the Parabola Slack app in your workspace may need admin permissions. Once installed, all workspace members can use the app.
Your authentication process depends on your Slack workspace settings:
- If your workspace allows app installs, the Parabola app installs during authentication of the Send to Slack step.
- If not, you may need an admin to install it. Some workspaces provide an option to submit a request to your admin for approval.
To connect a Send to Slack step:
- Drag a Send to Slack step onto your canvas.
- Click the blue Connect to Slack button.
If you’re connecting for the first time, select + Add new account. To update an existing account, click Edit Accounts. - If you’ve connected before, you’ll see available options in the dropdown for quick setup.
- Review the permissions in the pop-up window and click Allow. If no window appears, check for a pop-up blocker.
- If you’re already logged in to Slack, the step connects automatically. Otherwise, follow the login instructions to connect.
Message Settings
- Message type:
- Send a single message sends one message with your configured text
- Send one message per row sends a separate message for each row of data.
- Select Channel message and choose a channel, or
- Select Message to user and choose a user.
- Both channel messages and DMs send from the “Parabola app”, not your own Slack profile.
- To direct message multiple users, duplicate the Send to Slack step, filter rows for each user, and configure each step separately.
- Direct Messages sent with this integration will appear under the “Apps” section in your Slack sidebar.
- Send a single message sends one message with your configured text
- Message text:
- Write plain text or Slack markdown.
- Reference column values dynamically with curly braces. For example: {SKU}.
- When sending a single message, values from the first row fill in the curly-braced references.
- Message Settings Gear icon (all on by default):
- Include a link to this flow (requires appropriate flow permissions for recipients).
- Expand URLs and images in Slack
- Link usernames and channels. Channels can be referenced as “#general” and users as @alex
- Send messages when input data has at least 1 row (default). You can update this to send messages when input data has any number of rows (including 0).
- Sending test messages:
- Click Send test message to send test messages to yourself without running the full flow. Test messages do not use Parabola credits.
- Attached file:
- Do not attach anything is the default message. This means that the recipient will only receive the content configured in the Message Text box and a link to the flow if you kept this enabled in your Message Settings.
- Attach entire table as a CSV - you’ll name the CSV file that will be sent via Slack. The individual file size limit is 1 GB, based on Slack’s file upload limit.
- Attach a file by URL - Use this setting when you have a column that contains file URLs. Merge in that column’s value by wrapping the column name in curly braces. You can also enter a file URL manually if you have one stored elsewhere.
Finding Channel names and IDs
If you are using a version of this step that does not show a list of channels to send messages to, and requires you to type in the location of the channel, use this guide to find those names and IDs.
Channel names are the same as they appear in Slack. i.e #general or #we-love-parabola but they can only be used if you are not attaching files of data. Always include the # symbol.
When attaching files, indicate the channel using the ID (B07F36JHD), not the name (#general).
The channel ID can be found by right clicking on the channel name in Slack, clicking “Copy link”, and taking the ID from the end of the link. For example, use the channel ID of B07F36JHD from this link: https://parabolaio.slack.com/archives/B07F36JHD
Formatting messages with markdown
Basics
_italic_ will produce italicized text
*bold* will produce bold text
~strike~ will produce strikethrough text
Line breaks
You can write multi-line text by typing a new line, or insert a newline by including the string “\n” in your text.
Block quotes
You can highlight text as a block quote by using the > character at the beginning of one or more lines.
Code blocks
If you have text that you want to be highlighted like code, surround it with back-tick (`) characters.For example:
`This is a code block`
You can also highlight larger, multi-line code blocks by placing 3 back-ticks before and after the block. For example:
```This is a code block\nAnd it's multi-line```
Lists
Create lists by using a - character followed by a space. For example:
- This
- is
- a list
Links
URLs will automatically work. Spaces in URLs will break the URL, so we recommend that you remove any spaces from your URL links.
You can also use markdown to adjust the text that appears as the link from the URL to something else: For example:
<http://www.example.com|This message *is* a link>
And create email links:
<mailto:bob@example.com|Email Bob Roberts>
Emoji
Emoji can be included in their full-color, fully-illustrated form directly in text. Once published, Slack will then convert the emoji into their common 'colon' format. For example, a message published like this:
It's Friday 😄
will be converted into colon format:
It's Friday :smile:
If you're publishing text with emoji, you don't need to worry about converting them, just include them as-is.
The compatible emoji formats are the Unicode Unified format (used by OSX 10.7+ and iOS 6+), the Softbank format (used by iOS 5) and the Google format (used by some Android devices). These will be converted into their colon-format equivalents. The list of supported emoji are taken from https://github.com/iamcal/emoji-data.
Helpful Information
- You can preview messages by sending yourself a test DM before running the Flow.
- Slack messages have a 40k character limit.
- Some Slack features (like @here) aren’t supported.
- If you’re posting into a channel, make sure the Parabola app has been added to that channel first (or ask a Channel Manager to add it).
- You can post to private Slack channels along as you have access to that channel.
- If you want to still send a Slack message even when there are 0 rows in the input data, update the dropdown found in the Message Settings to "Send messages when input data has any number of rows (including 0)".
Integration:
Smartsheet
The Pull from Smartsheet step enables you to pull in data from Smartsheet (a collaborative spreadsheet tool) used for organizing and working with data. This way, you'll be able to view your data as a table, workflow, or timeline and automate the process of making reports. You may also combine with other data sources.
Connect your Smartsheet account
To authorize your Smartsheet account in this step, select Authorize.
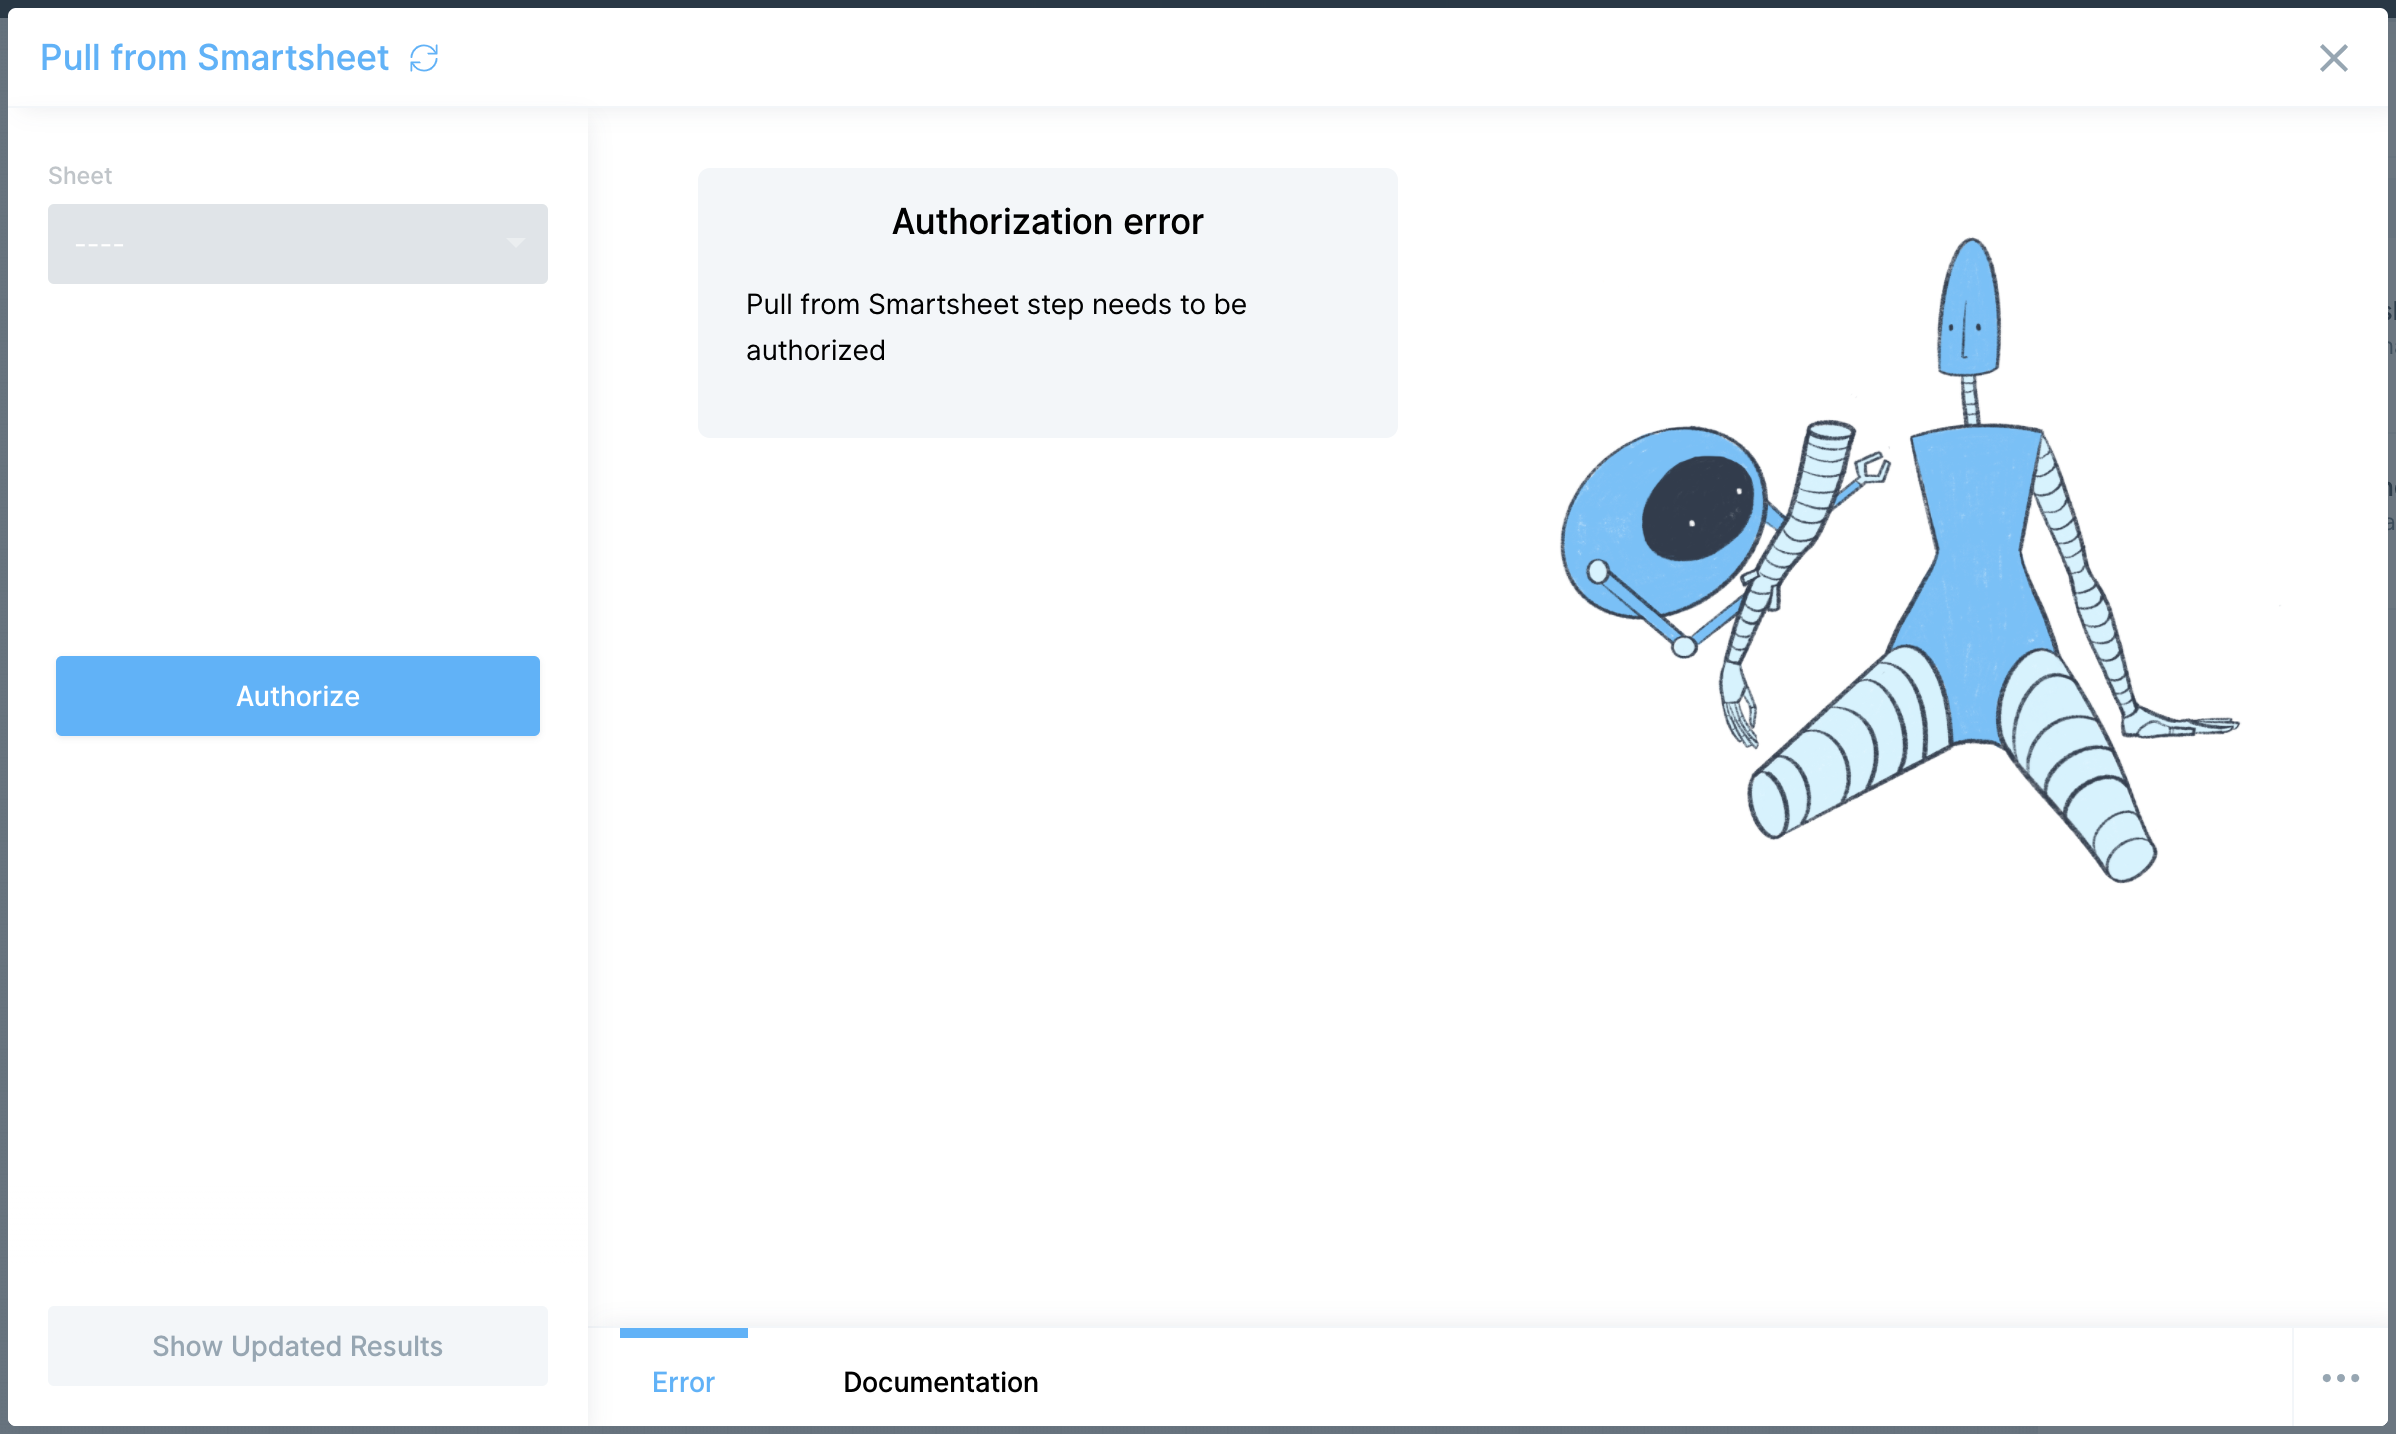
Then, a new webpage tab will open and redirect you to log into your Smartsheet account. Once you login, select Allow to finalize the authorization.
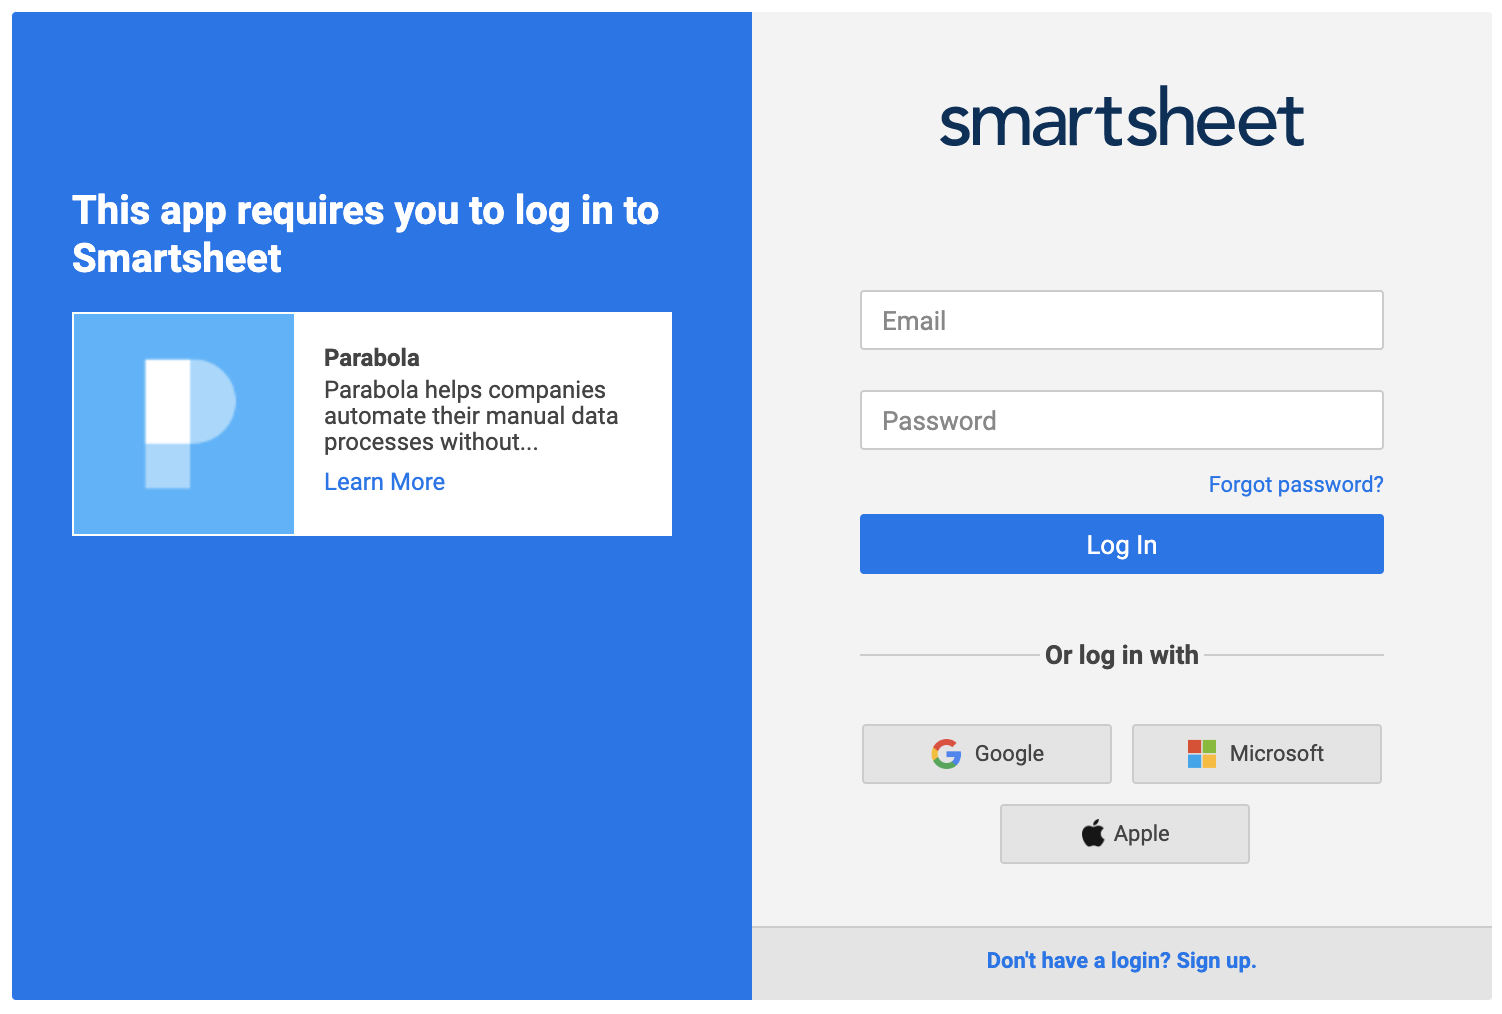
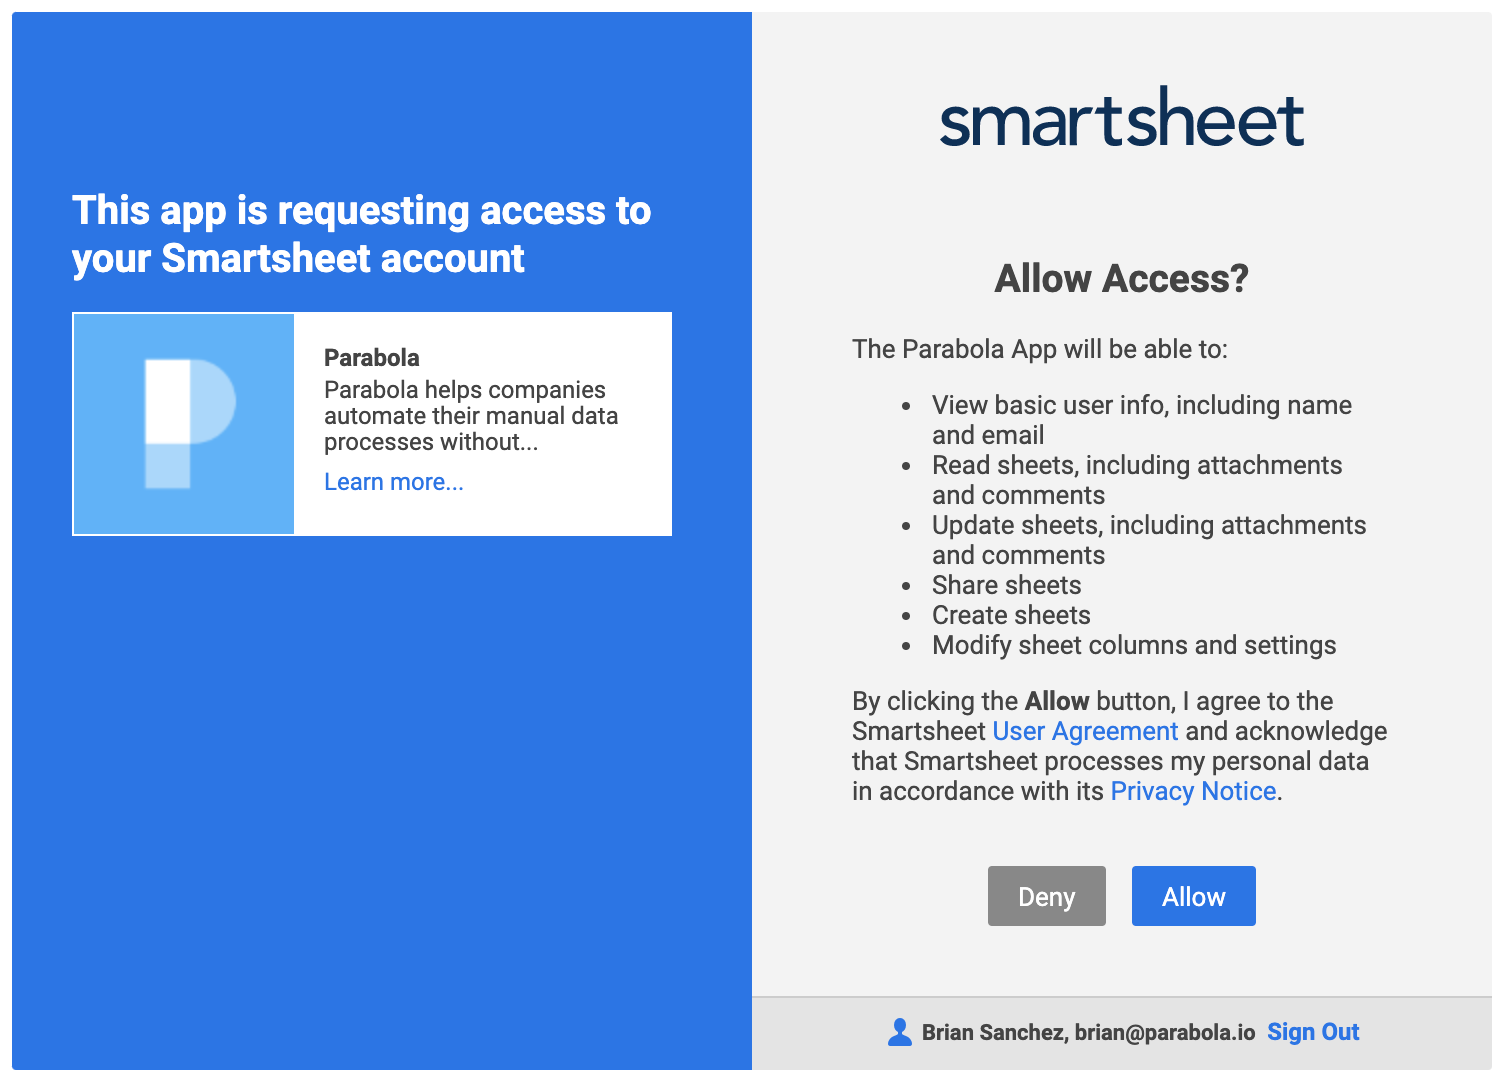
After this, your webpage will return to the tab with your Parabola flow on it and refresh the step automatically.
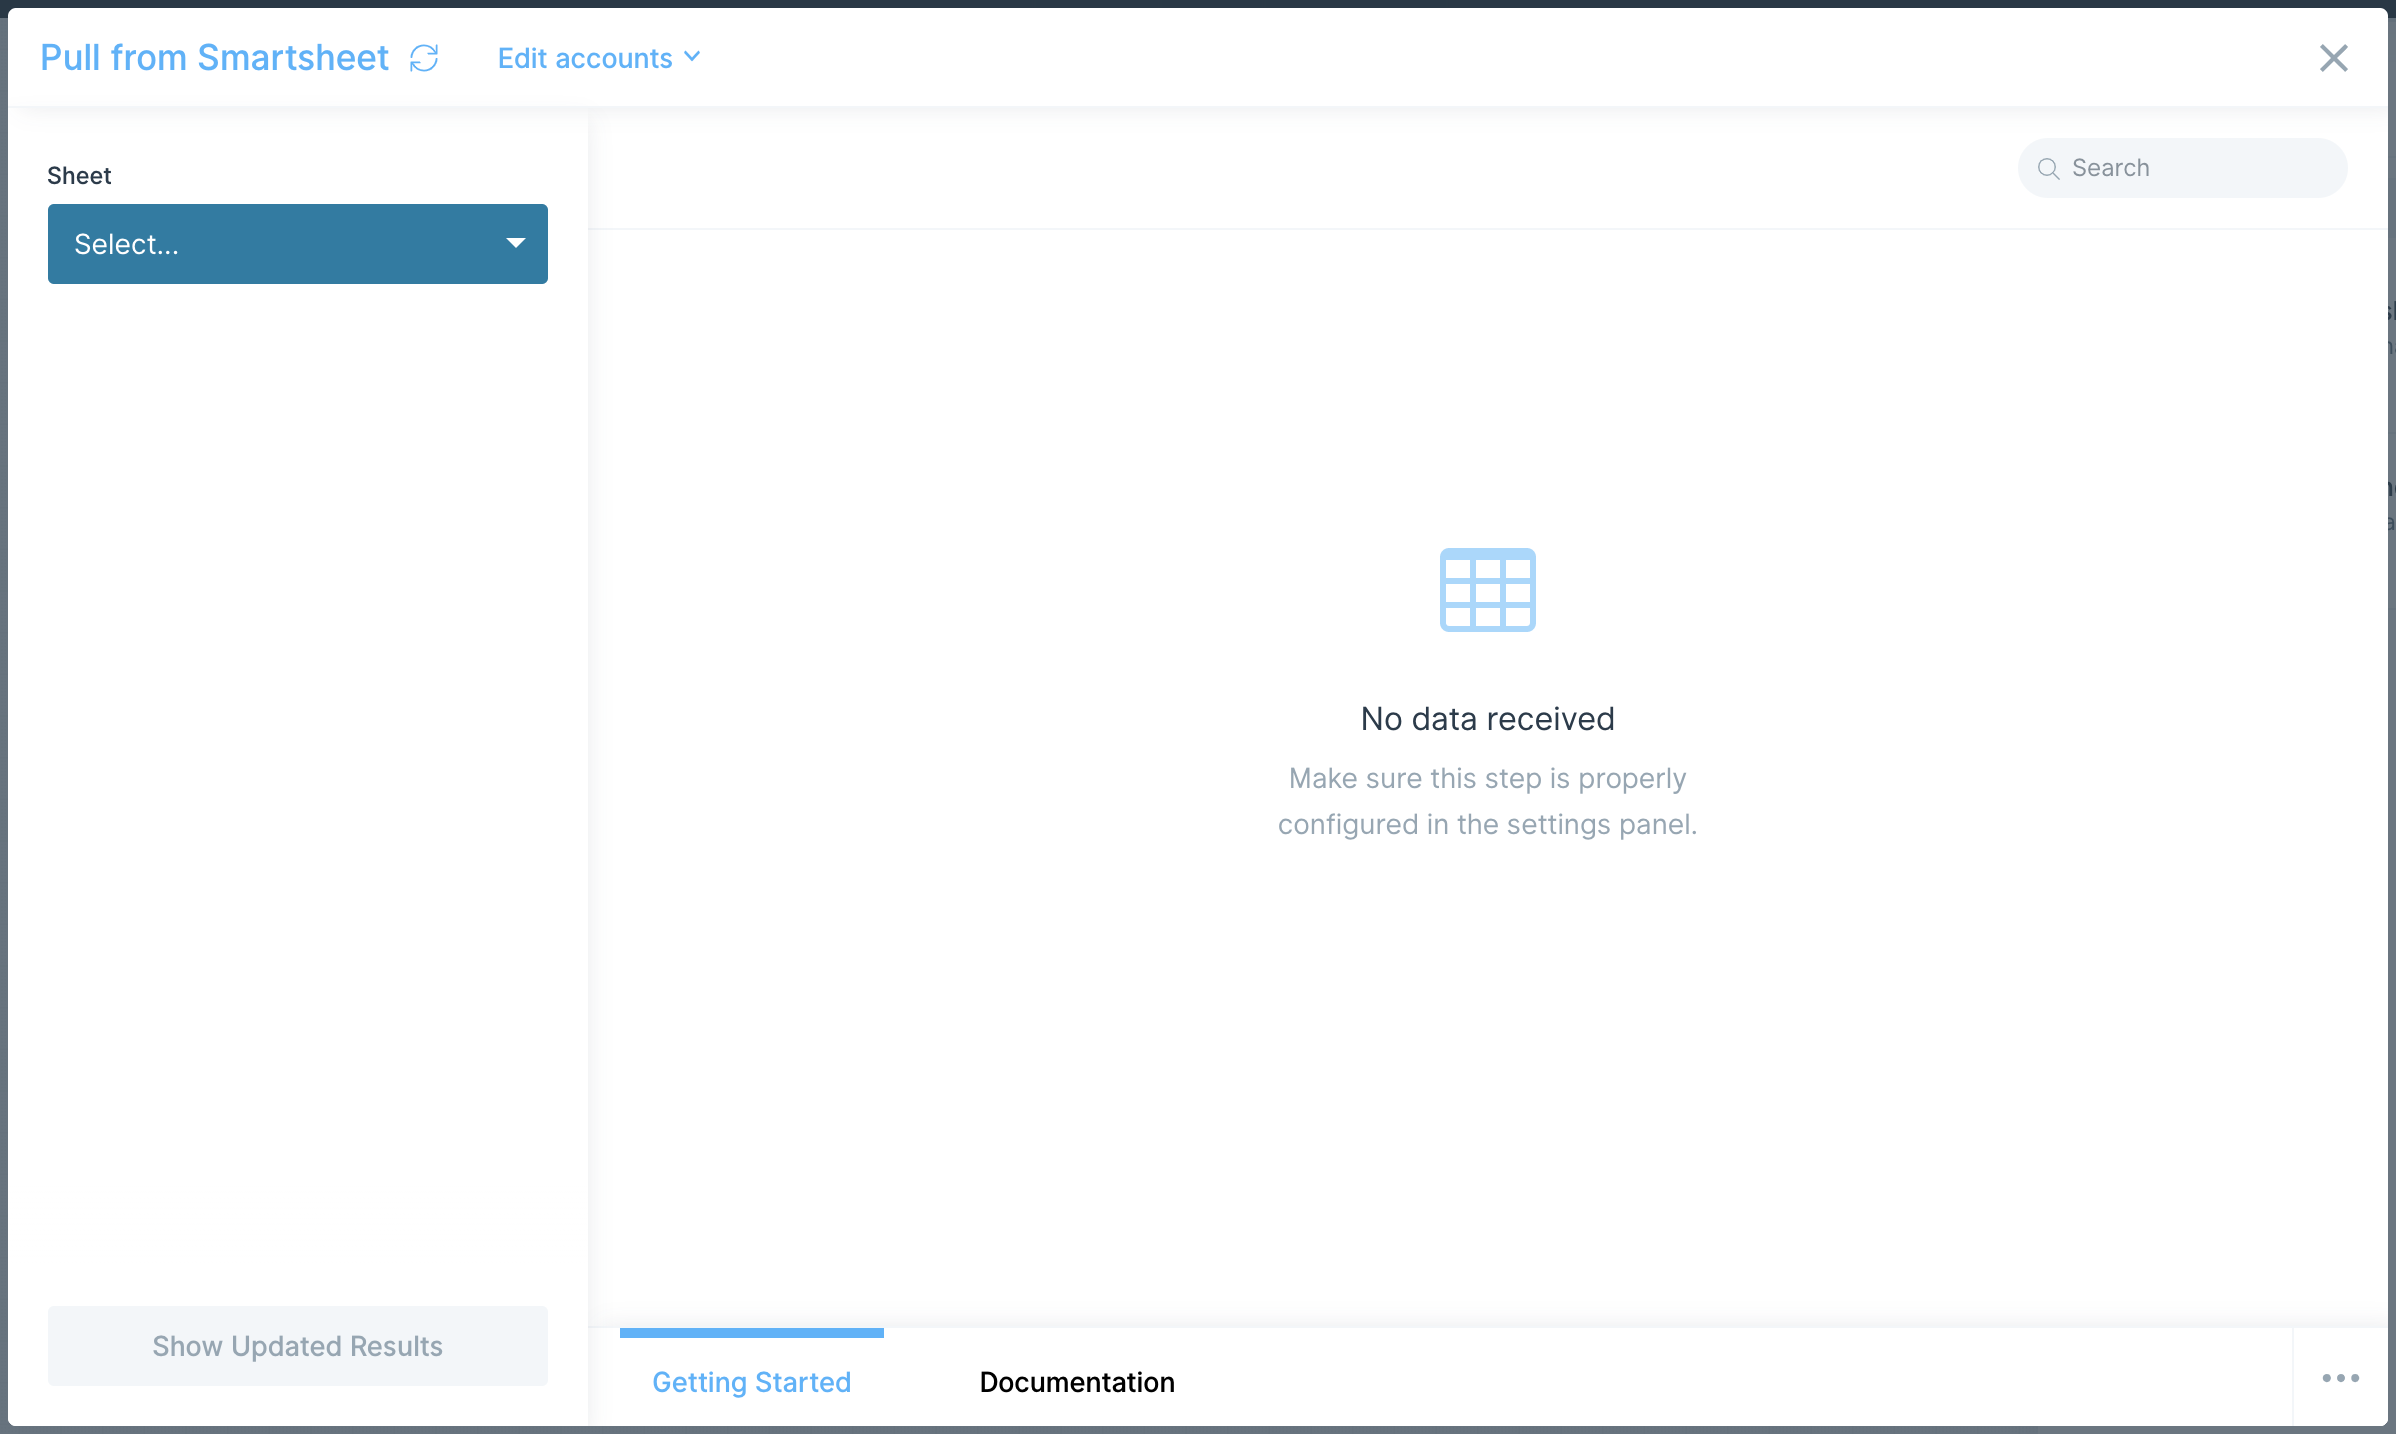
Custom settings
The step will automatically select and pull in the first Sheet listed in your Smartsheet account's Sheets section. To bring in a different Smartsheet Sheet with the dataset you'd like to work with, select the name of the sheet to pull it in and click on the circular arrow icon next to the step's name Pull from Smartsheet to refresh the display window.
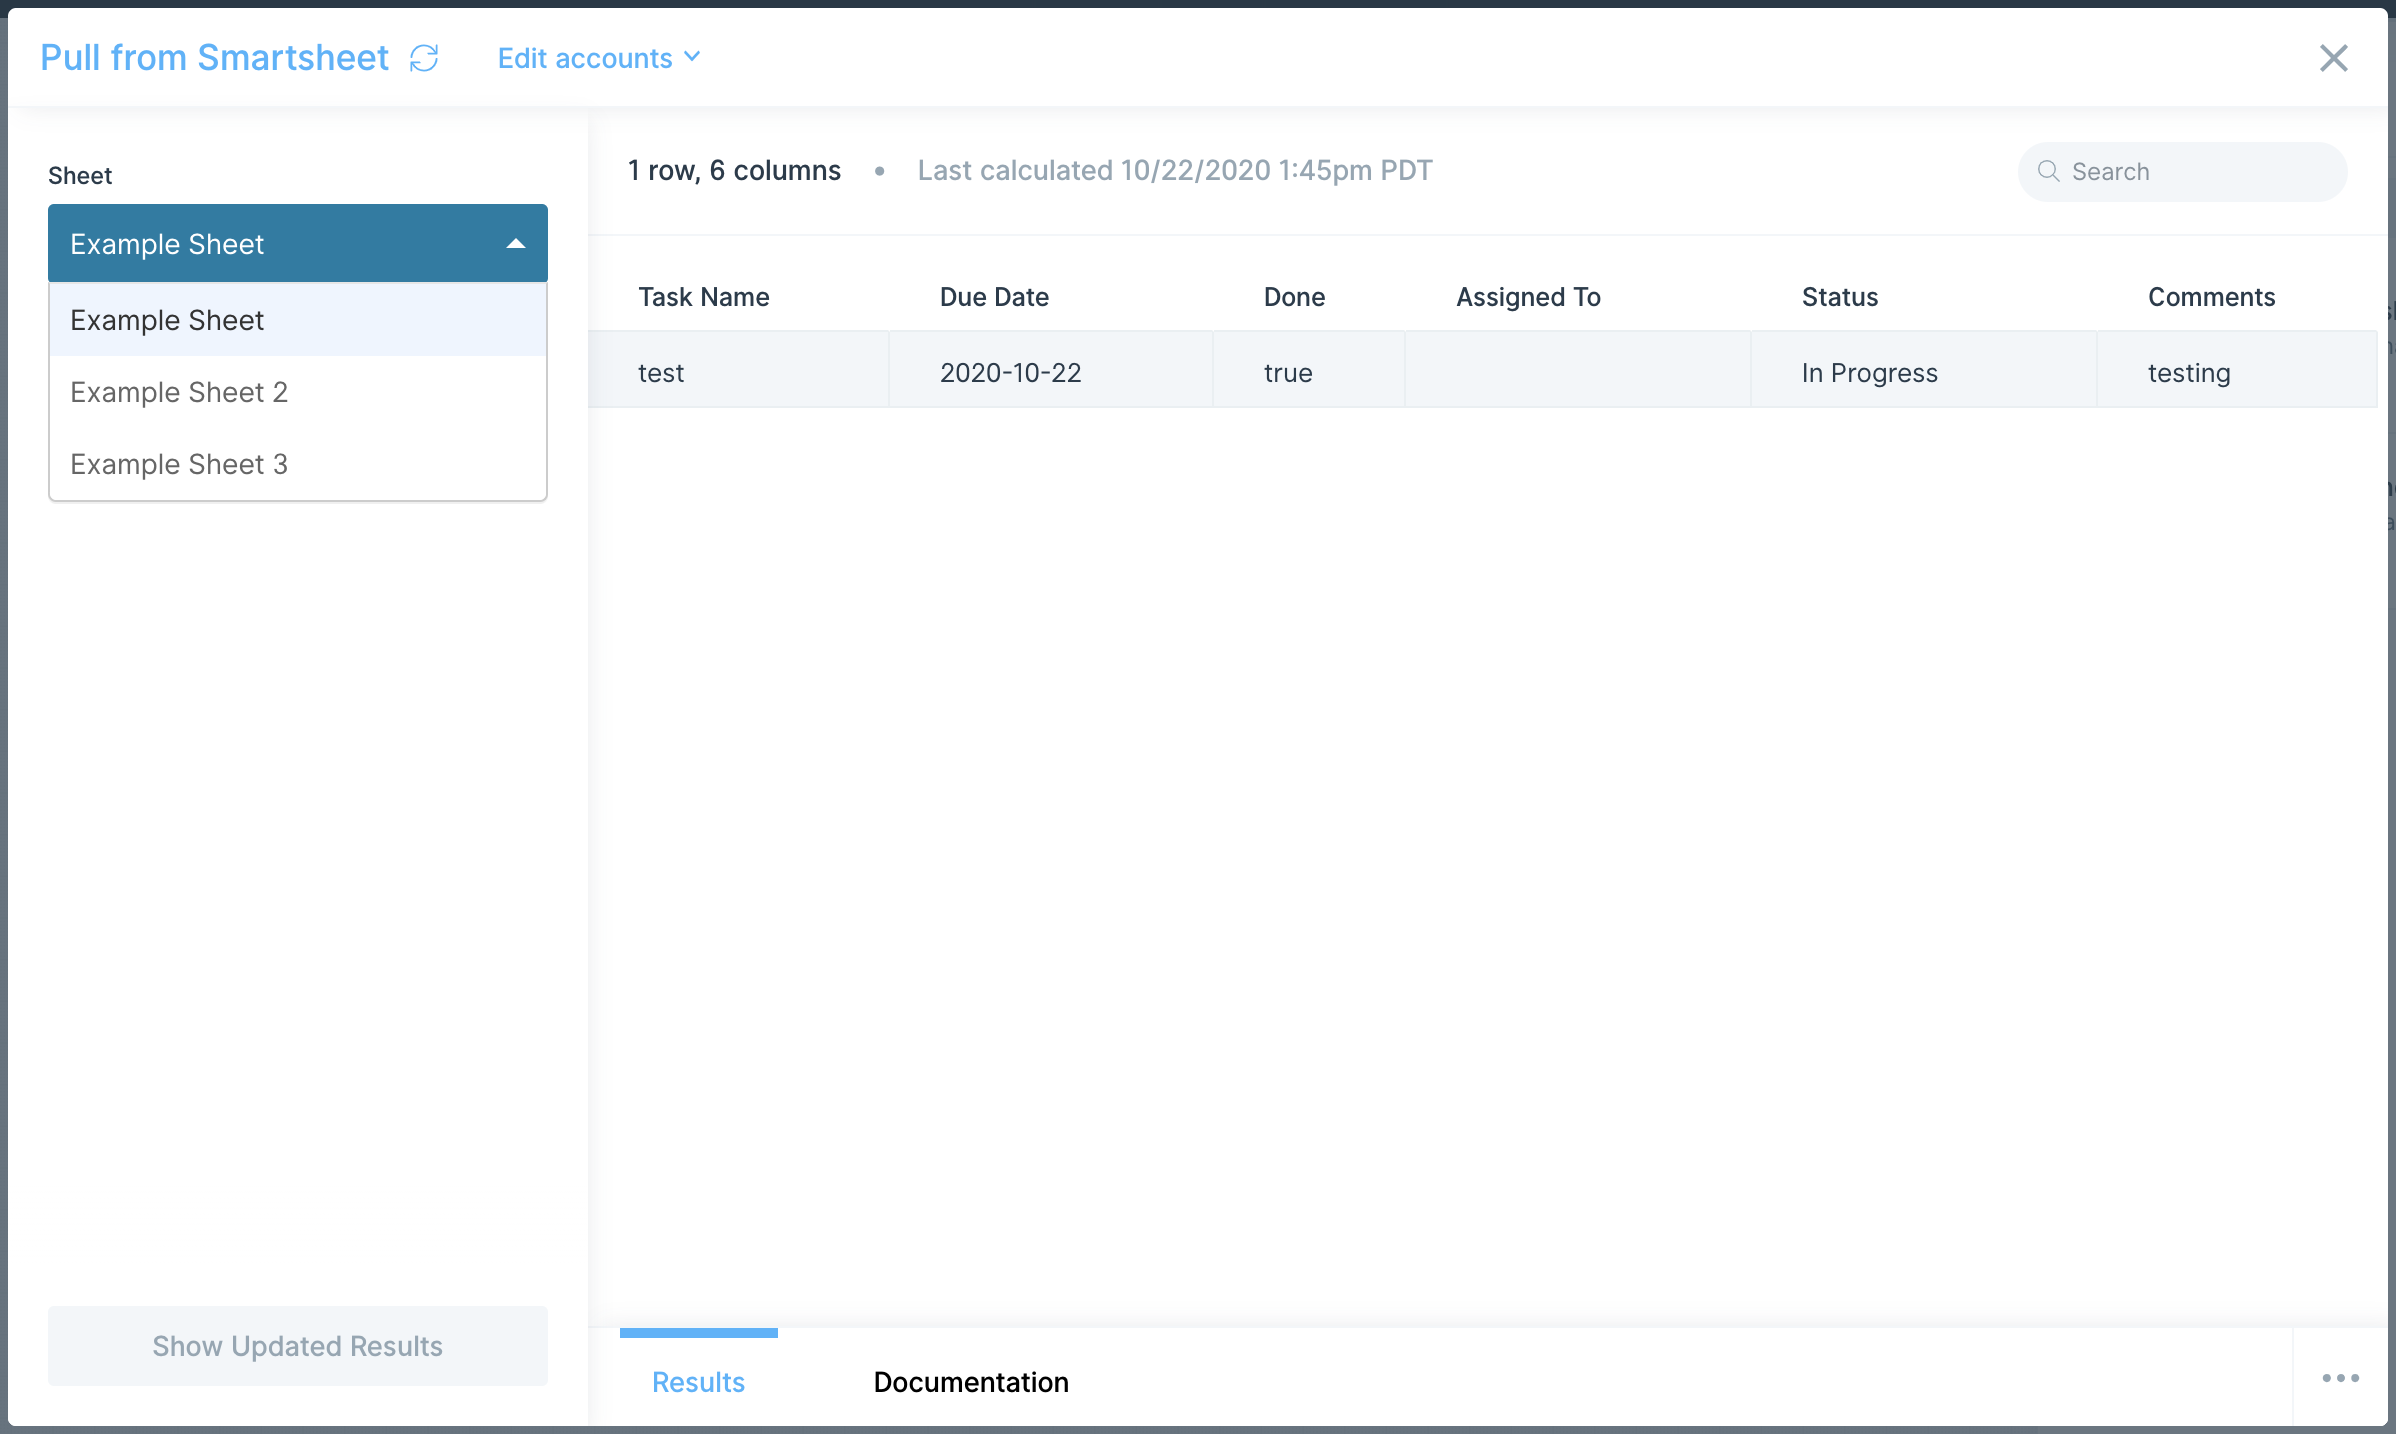
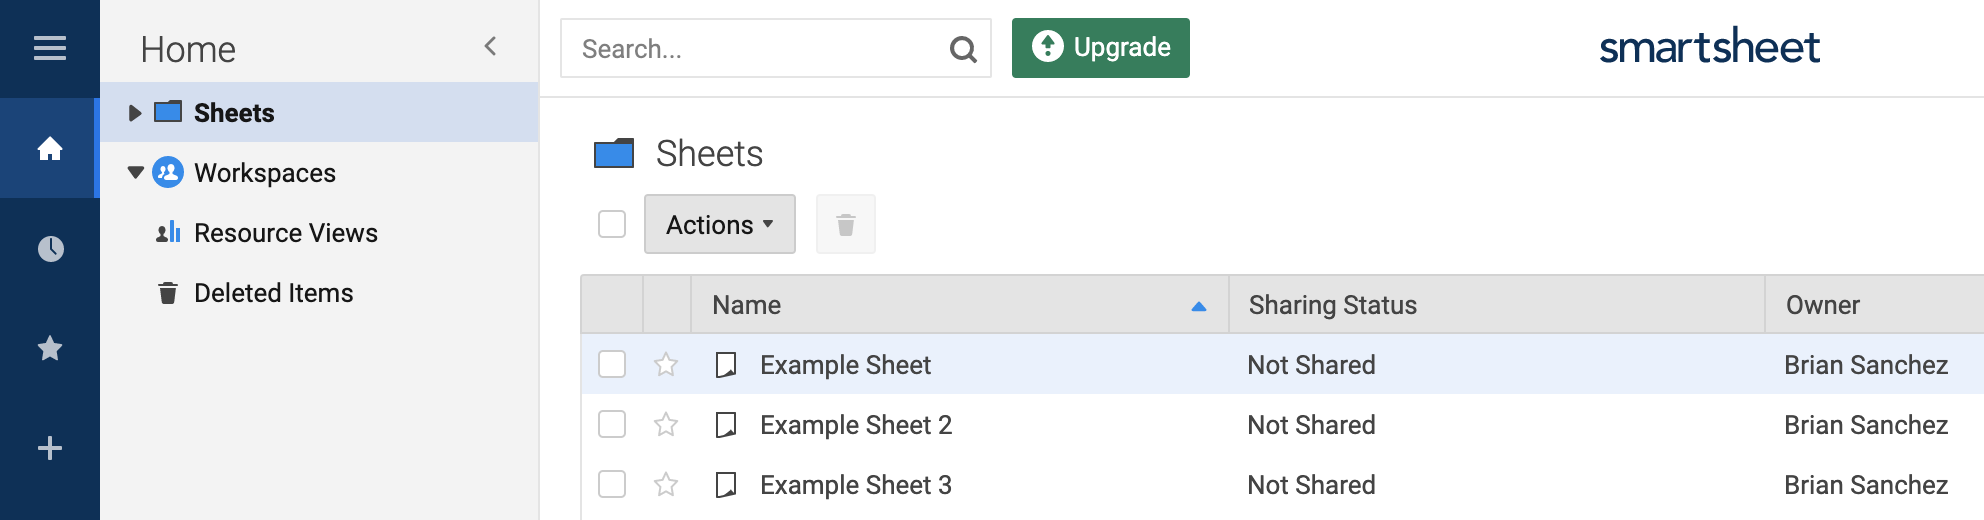
After a dataset from your Smartsheet sheet is pulled in, select the blue "Show Updated Results" button to save these settings in the step.
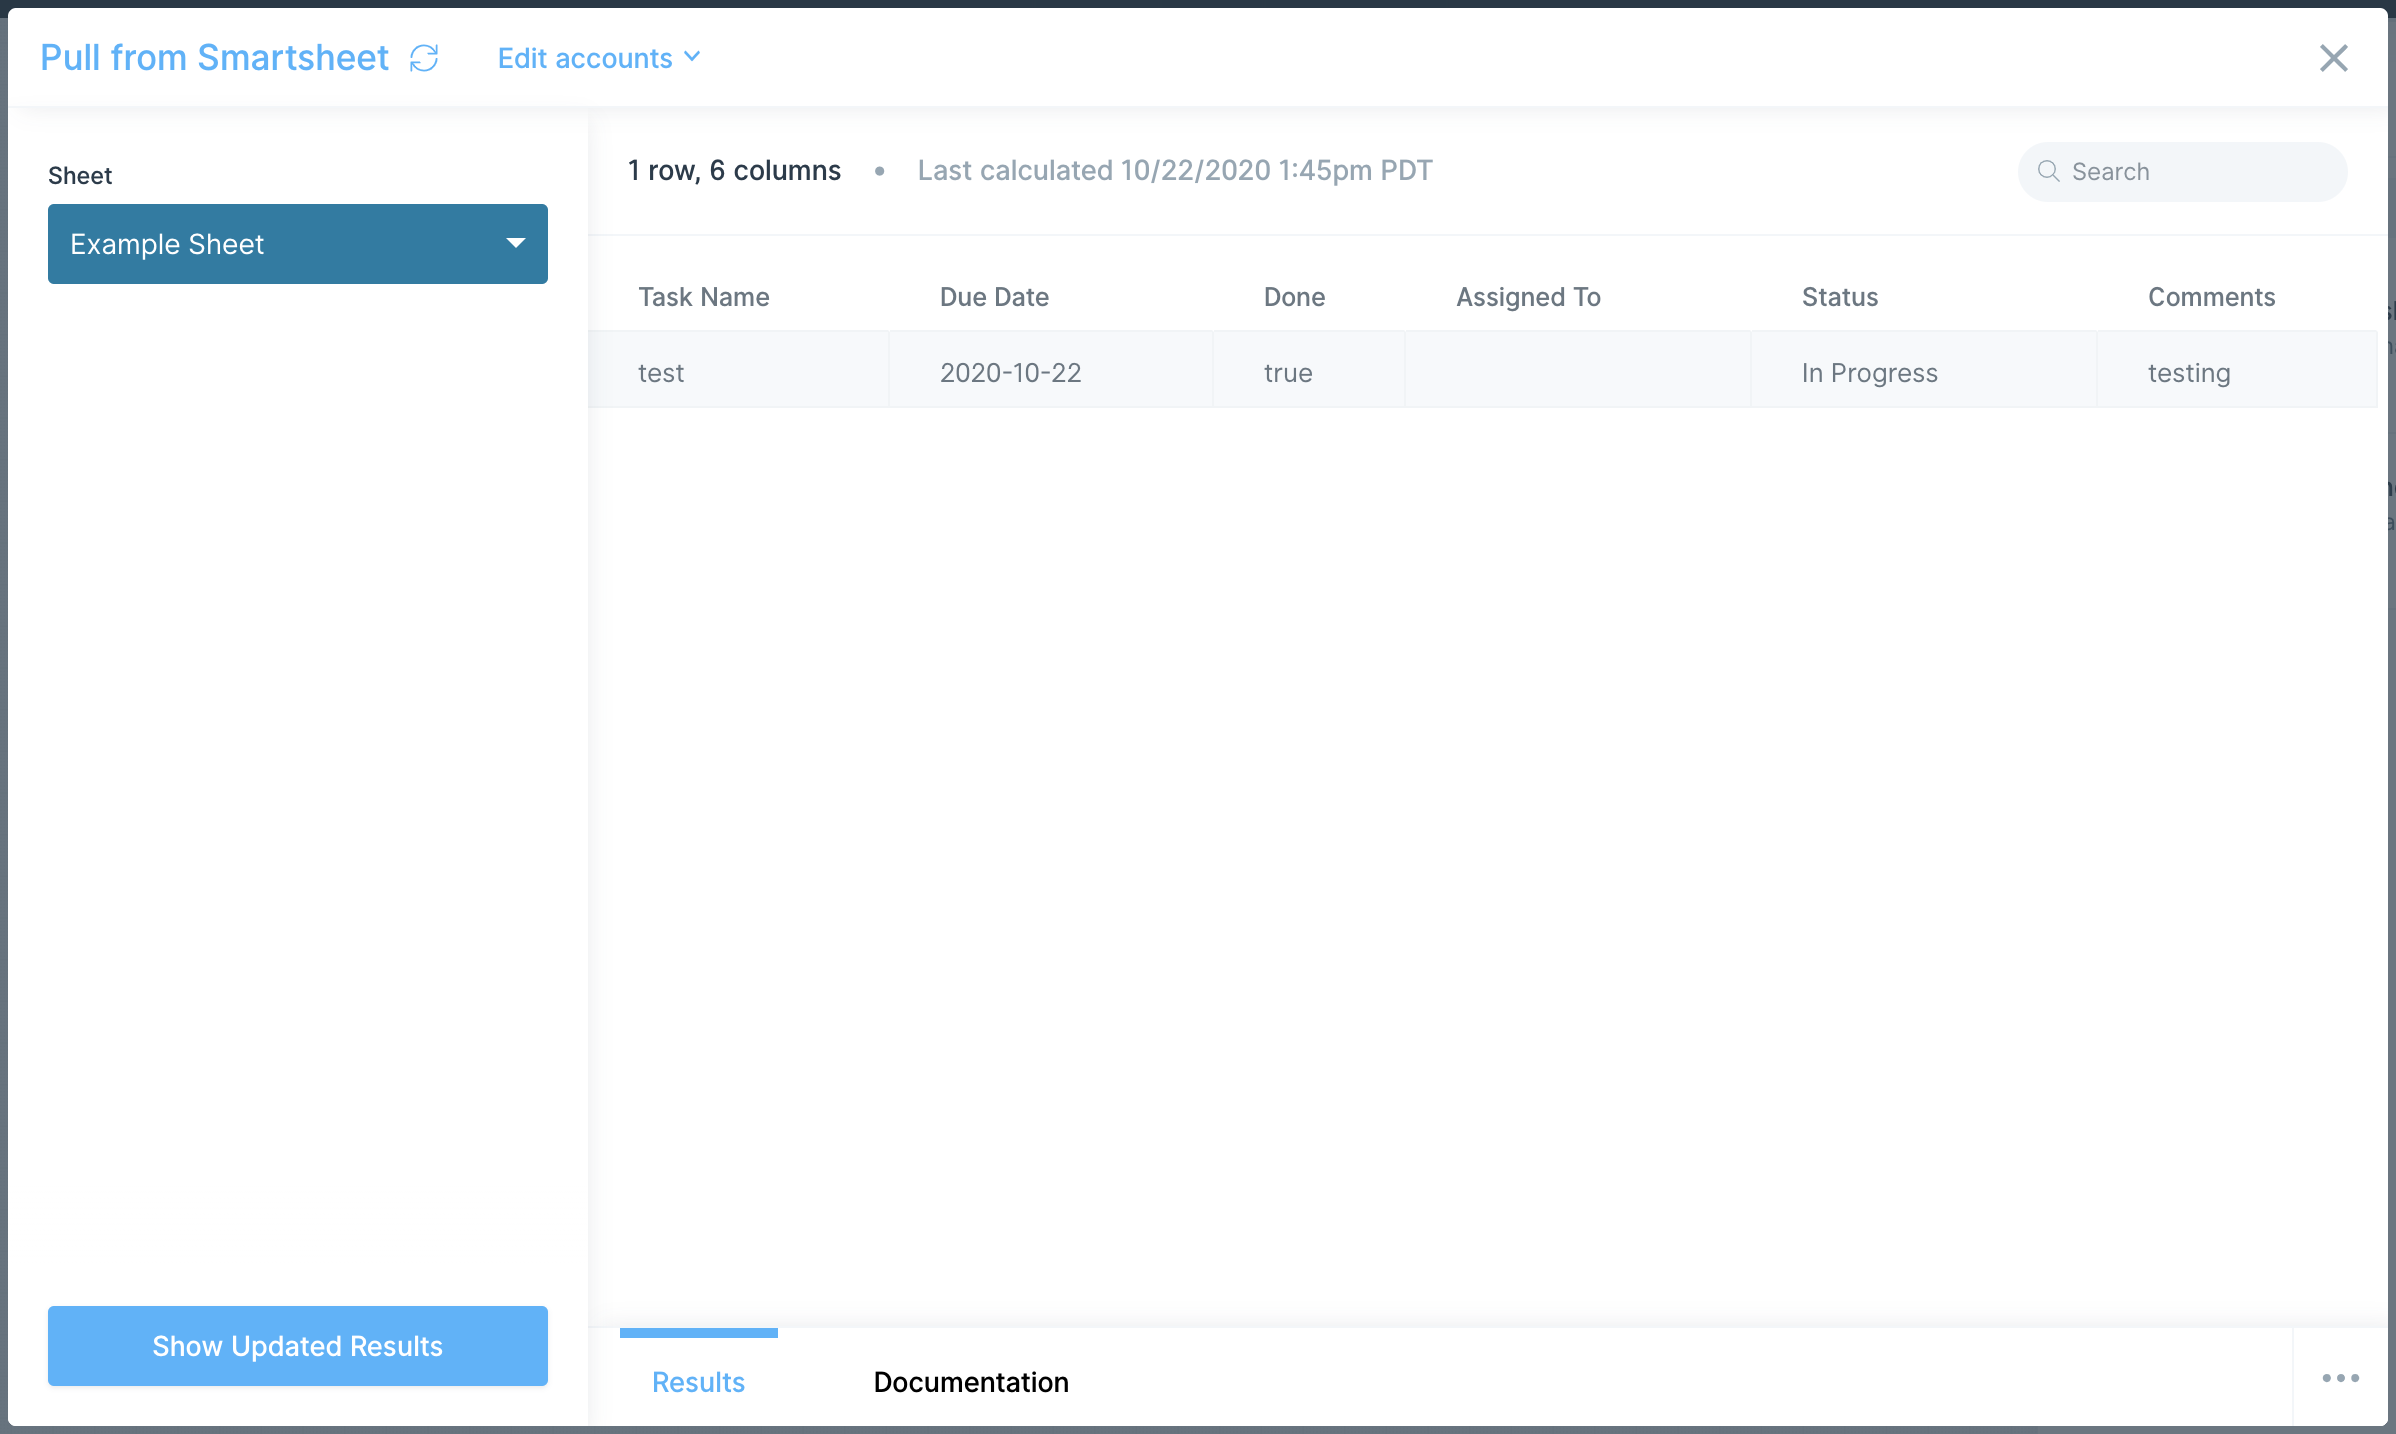
Helpful tips
- Any changes you make in Smartsheet Sheets will automatically sync with Parabola in your steps that incorporate those datasets.
The Send to Smartsheet step enables you to automate data entry in Smartsheet, automatically add new data into existing Sheets, send reports to customers and clients, or add new data to existing Sheets.
Connect your Smartsheet account
To authorize your Smartsheet account in this step, select Authorize.
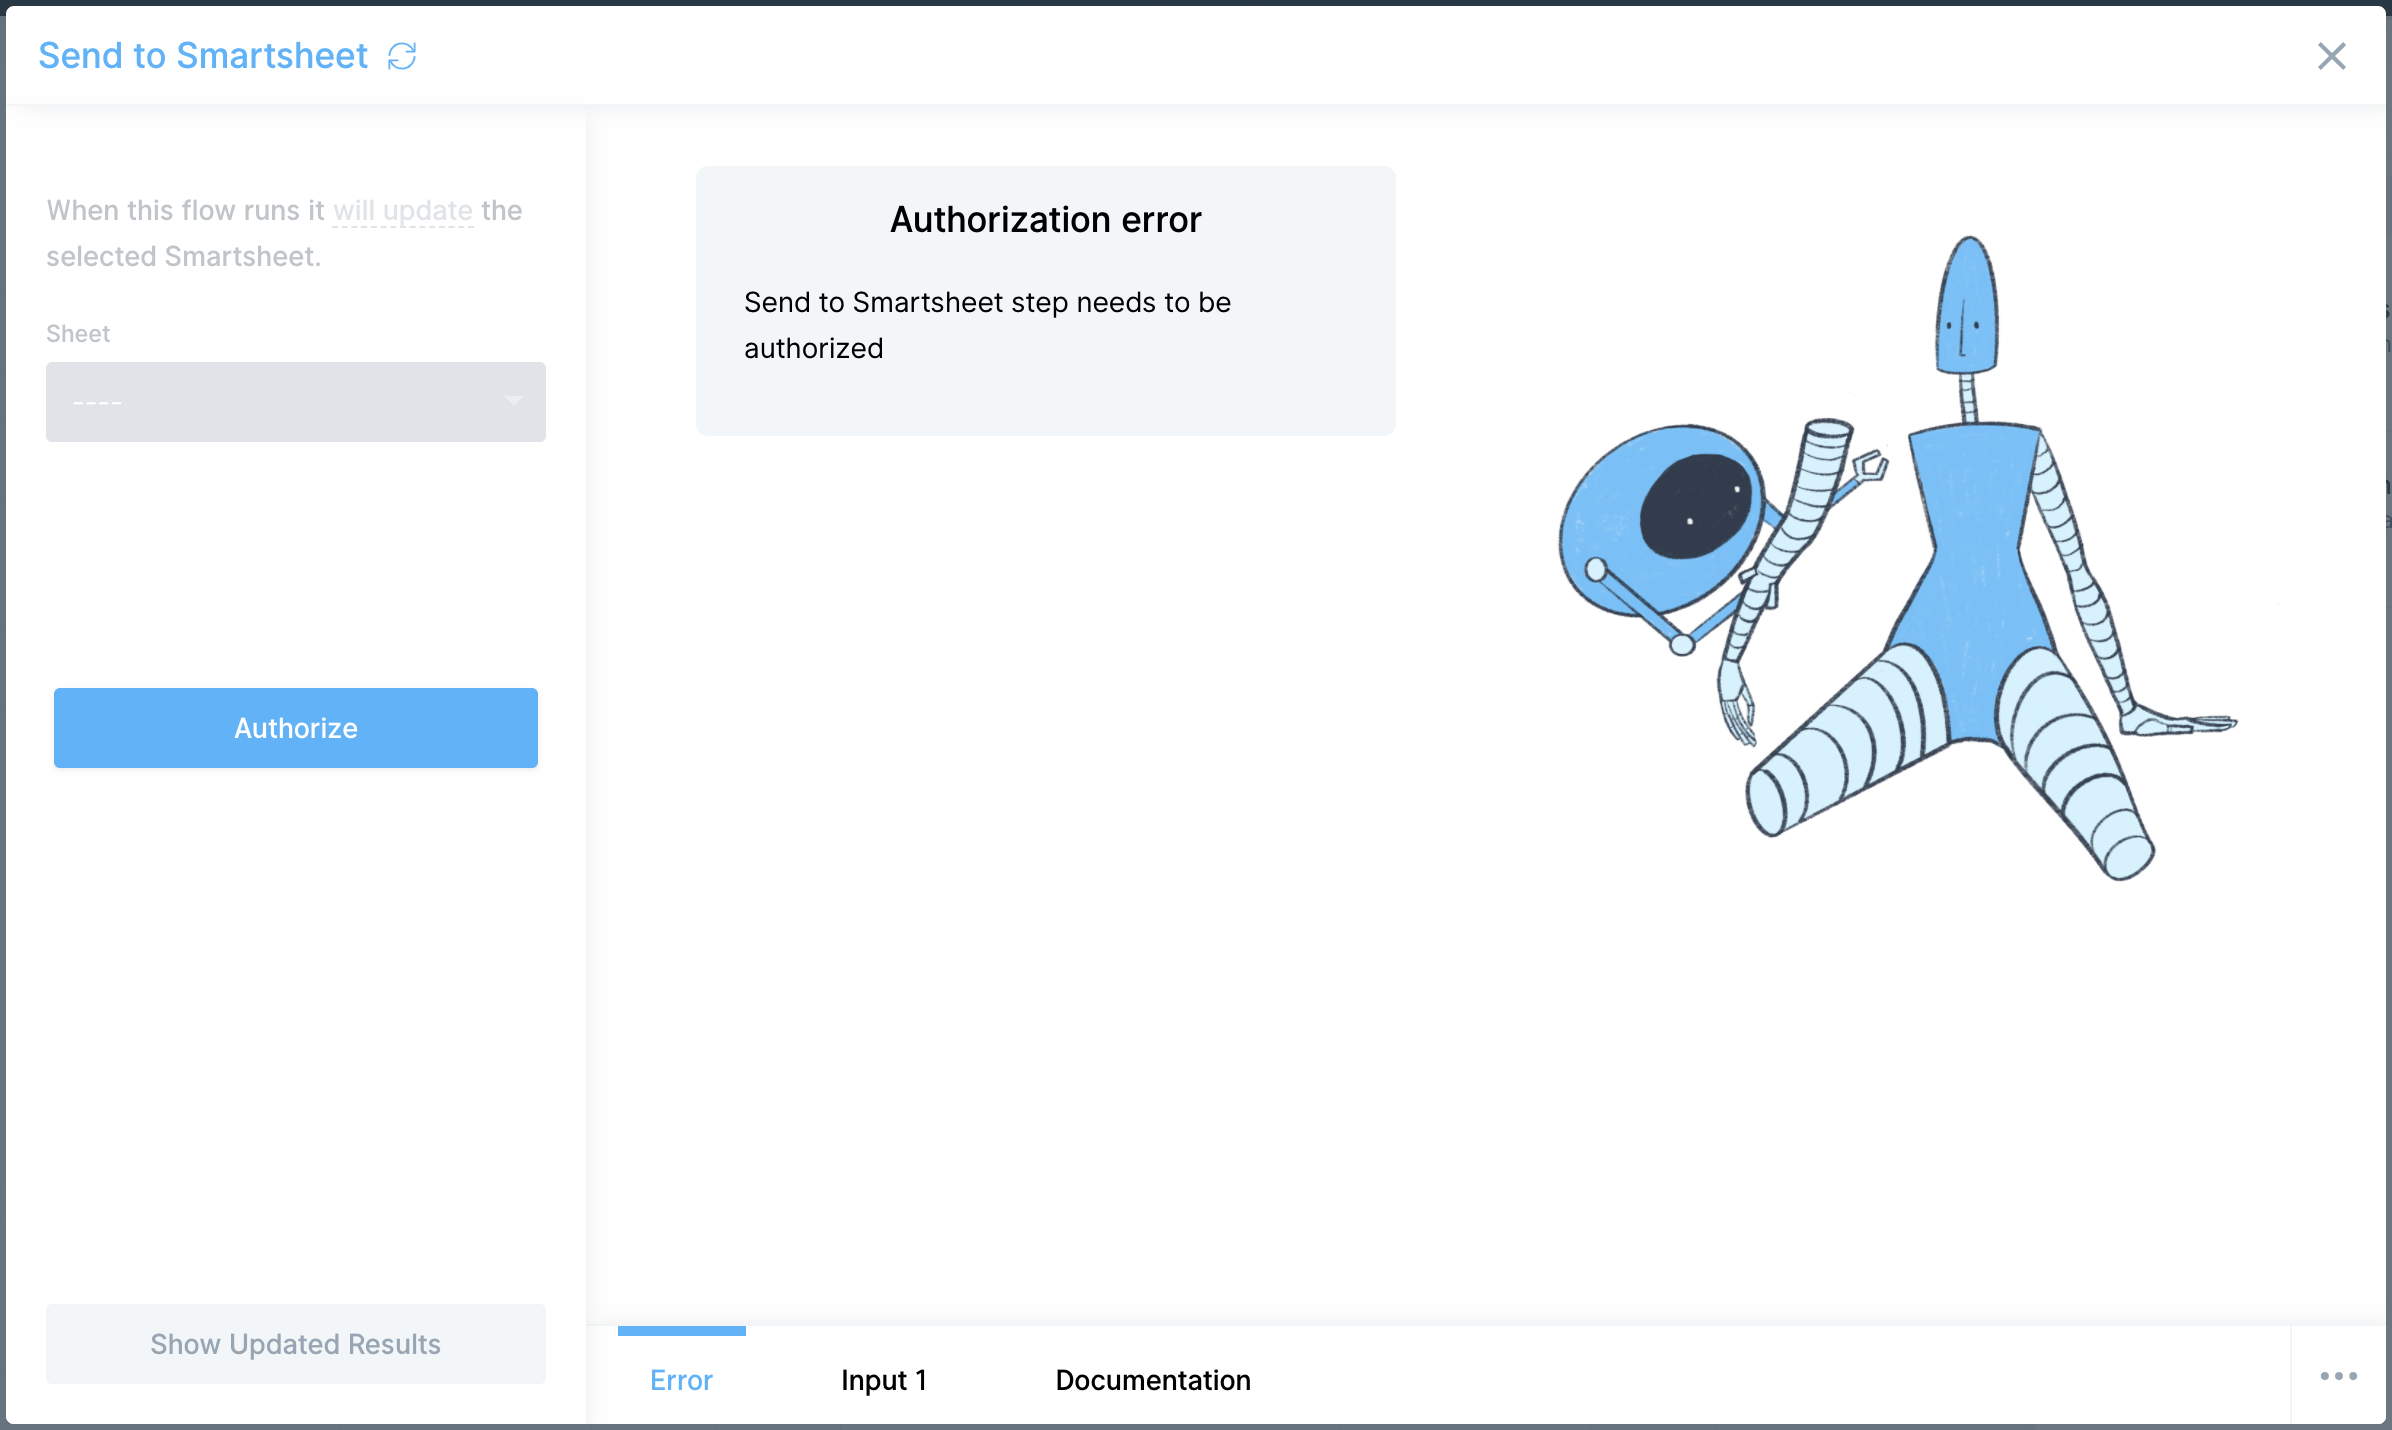
Then, a new webpage tab will open and redirect you to log into your Smartsheet account. Once you login, select Allow to finalize the authorization.
After this, your webpage will return to the tab with your Parabola flow on it and refresh the step automatically.
Custom settings
Select the Sheet you'd like to overwrite and update, or select Create New Sheet to make a new one in Smartsheet.
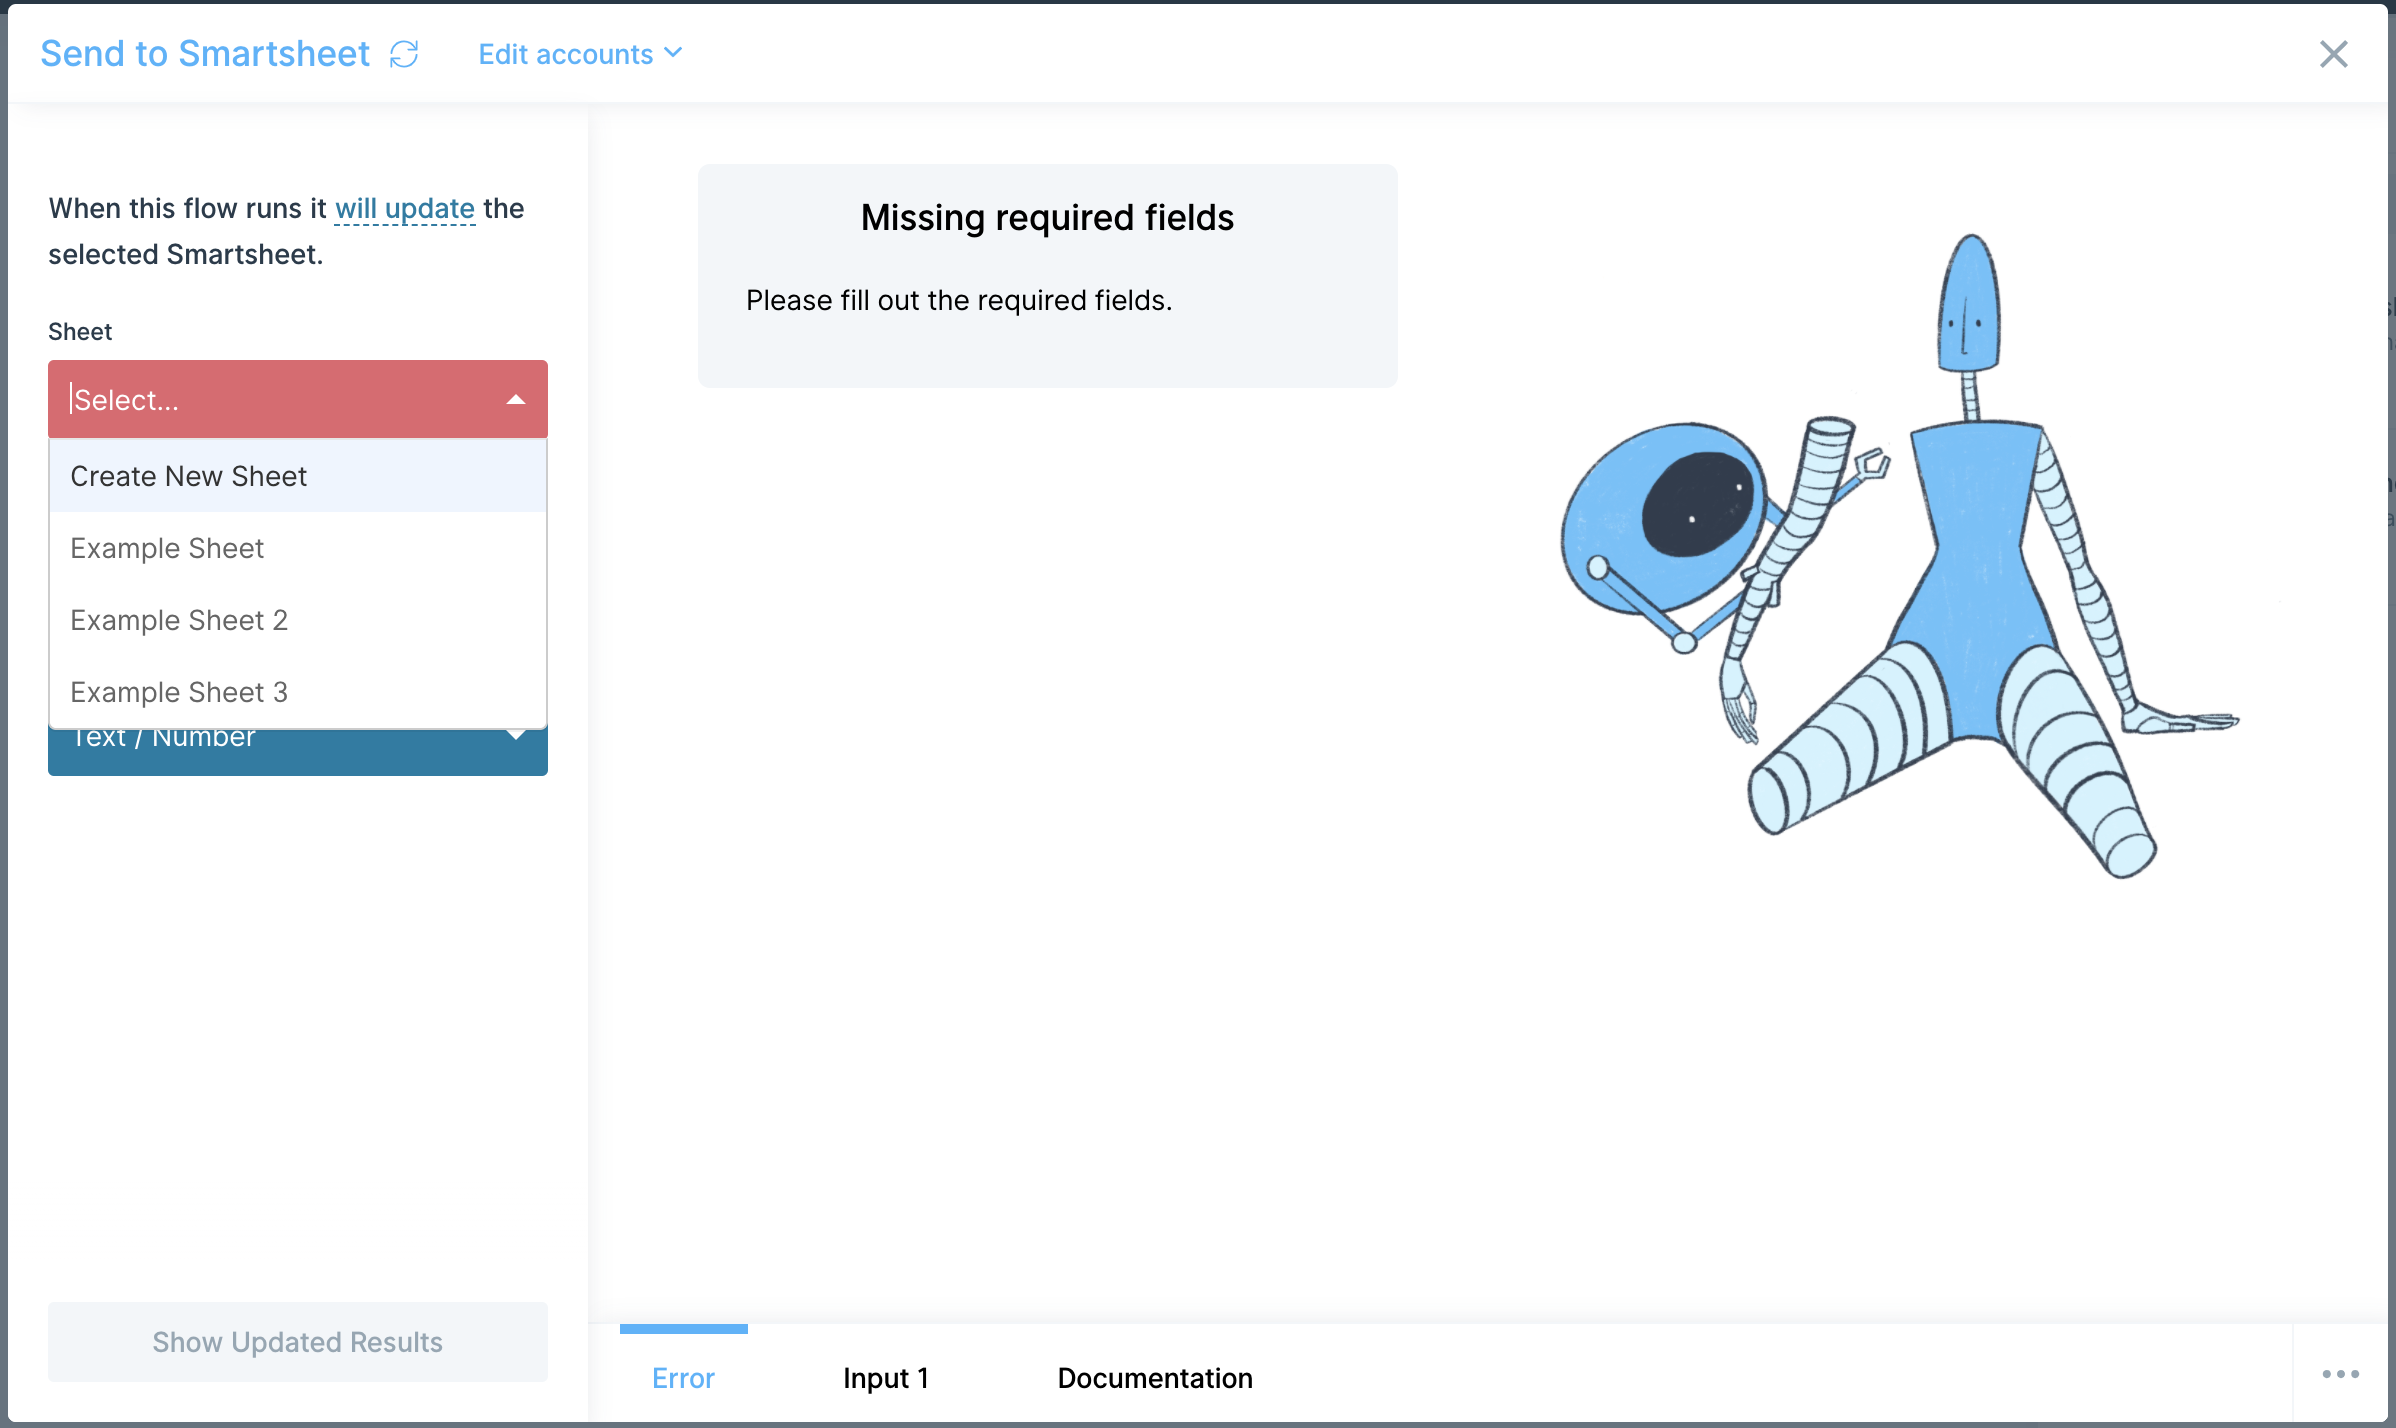
Select Show Updated Results to save the step settings and update the display window.
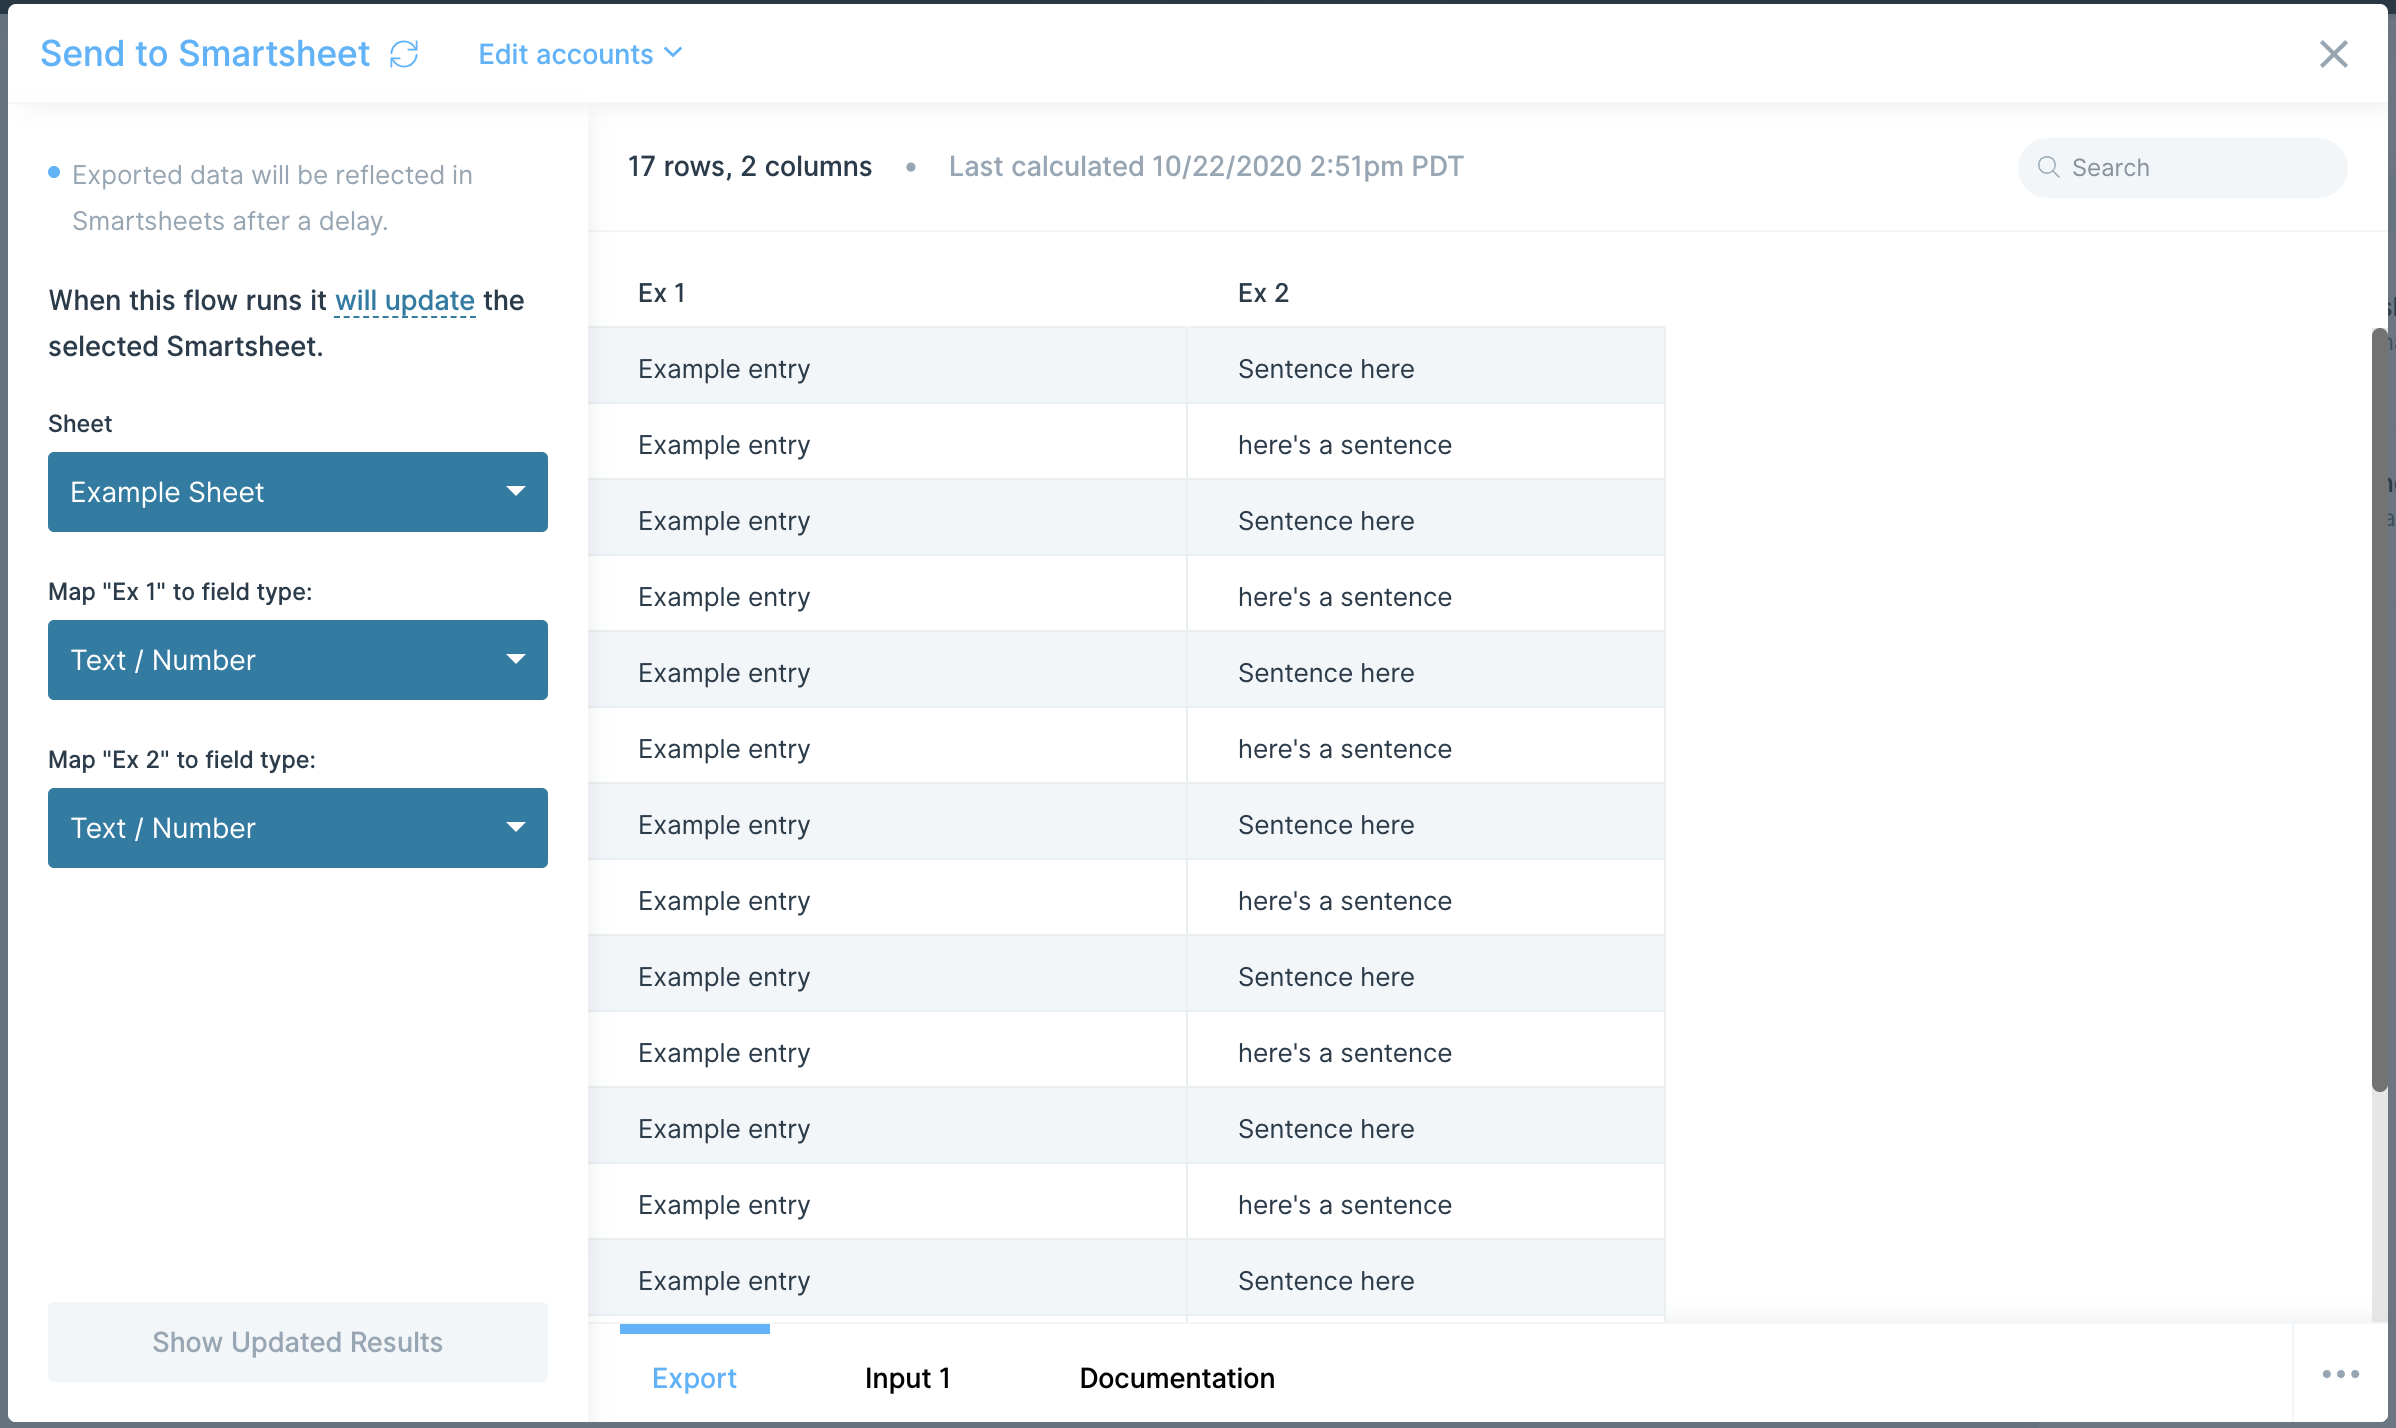
Under the Map "column name" to field type: settings section, you may also select one of 11 field types to customize a column's field type in Smartsheet.
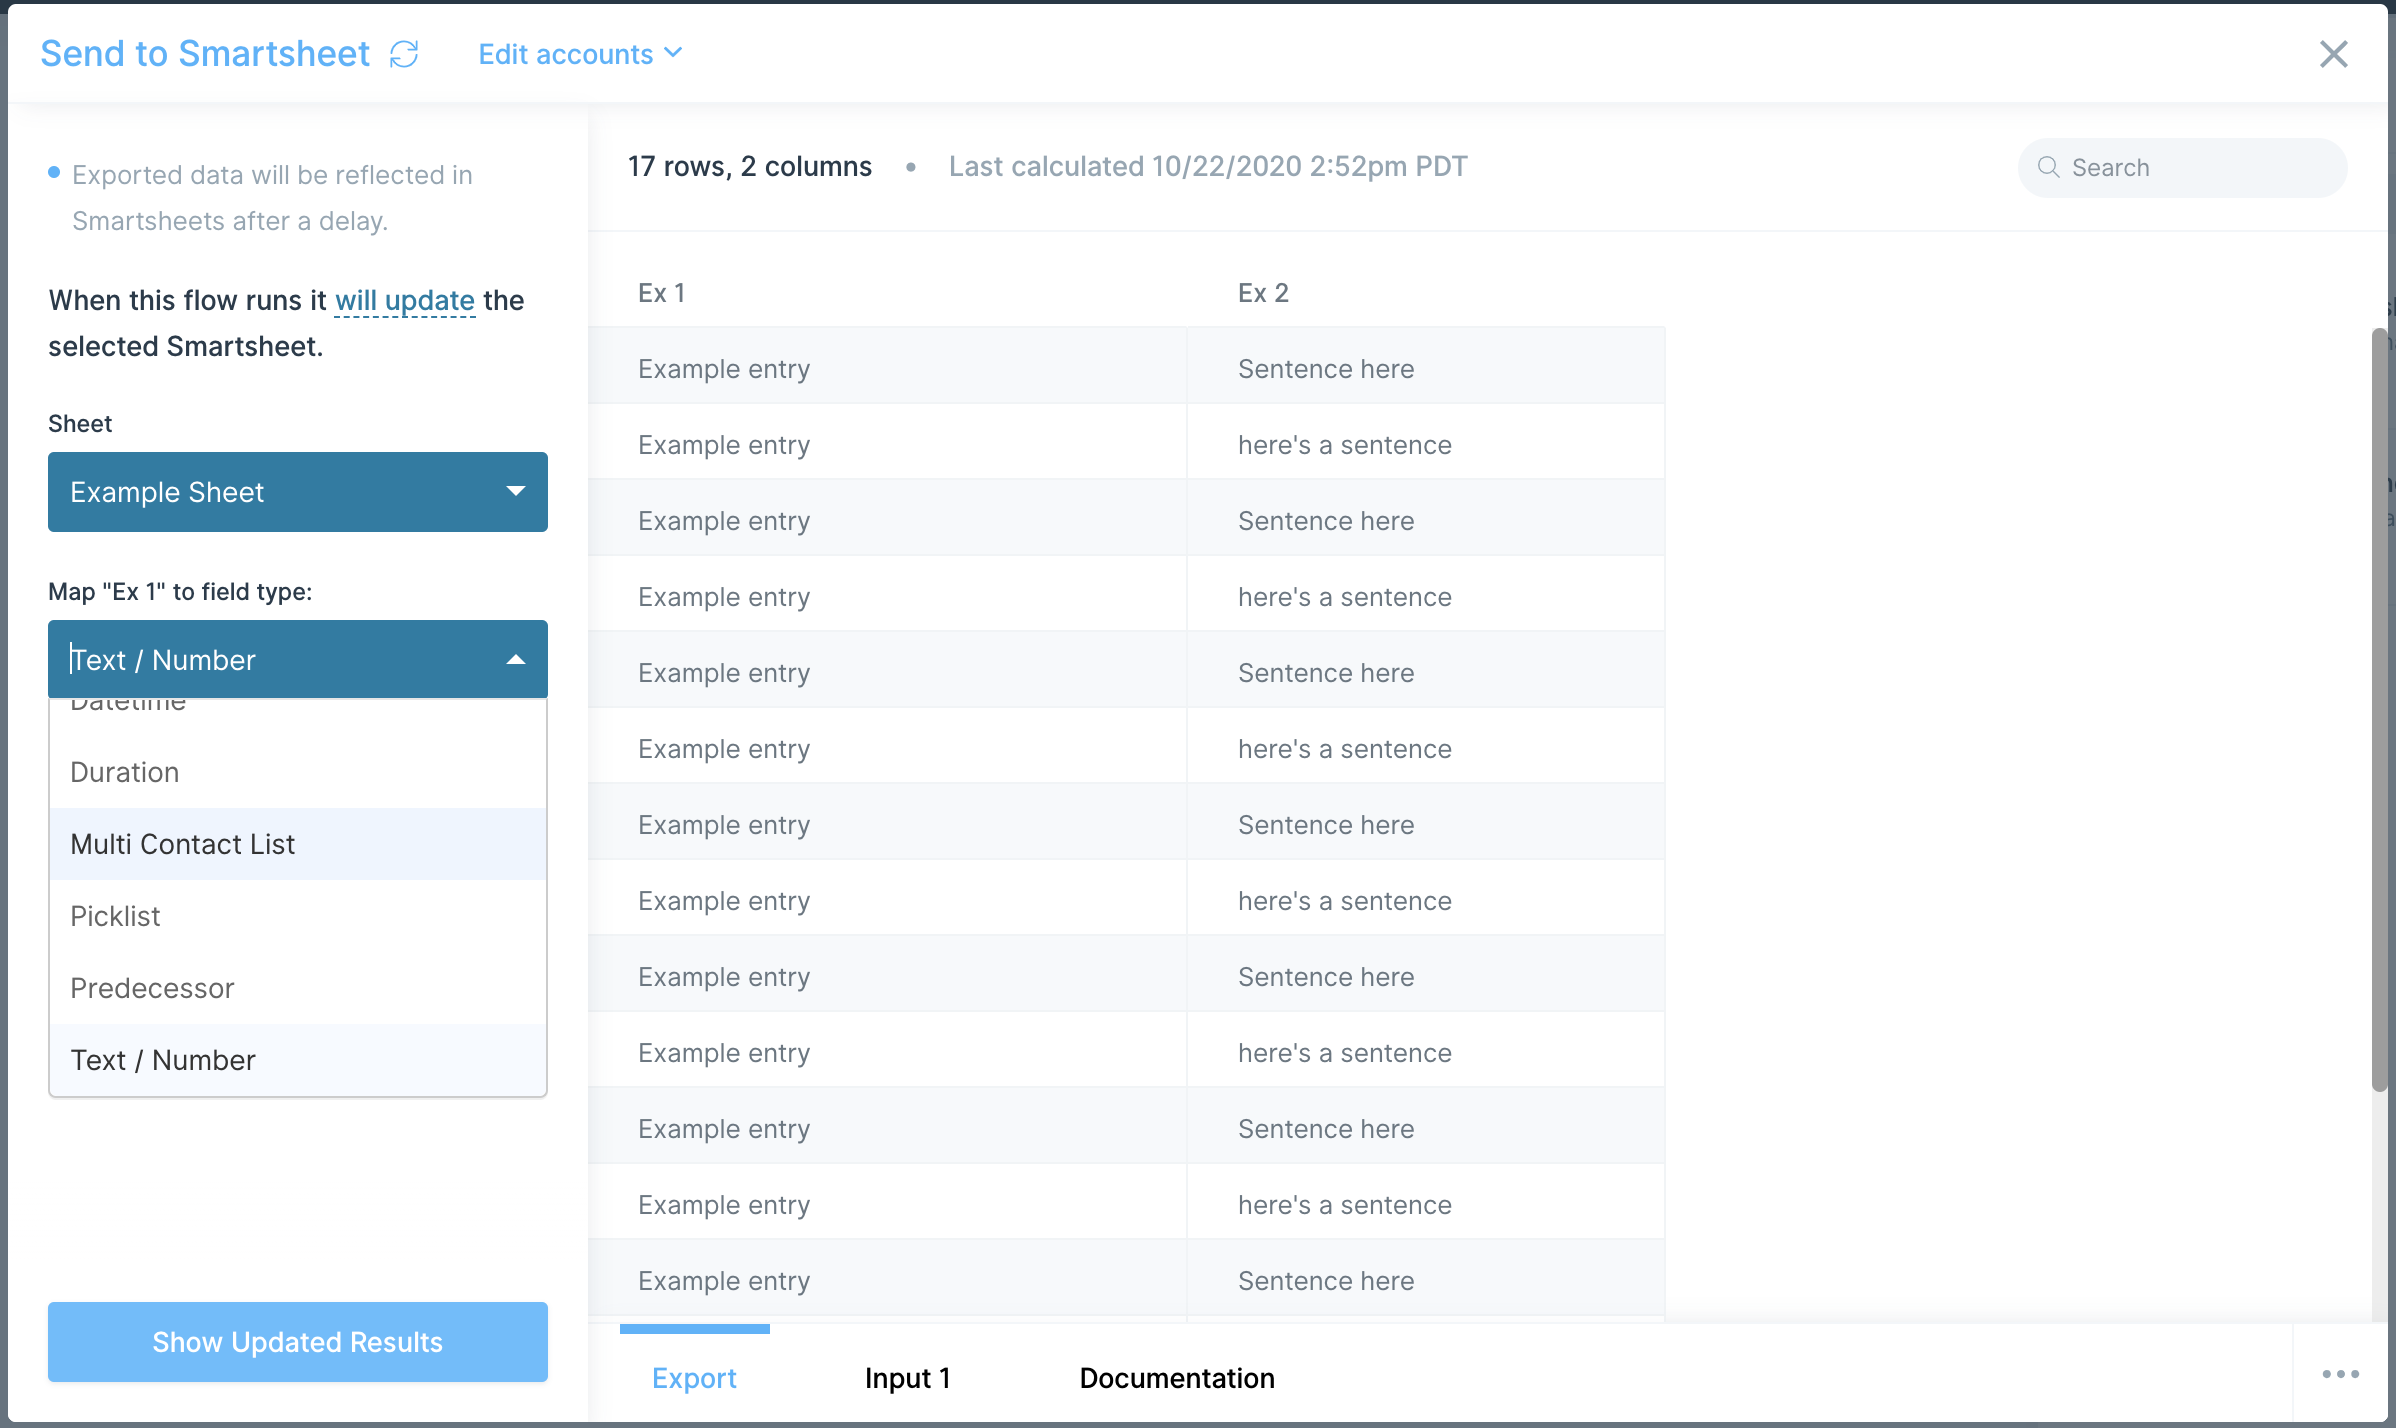
Helpful tips
- Any data in your step's result view will be used to overwrite the data in that Smartsheet.
Integration:
Snowflake
Use the Pull from Snowflake step to pull in your data from your Snowflake database.
Before you start
Check whether your team has already created a Snowflake OAuth security integration for Parabola (client ID and client secret). If it exists, you can skip to the Set up the step in Parabola section.
Create a Snowflake OAuth security integration
In order to perform these steps, you must have Snowflake permissions to create a security integration.
1. Sign into Snowflake. Click on “Worksheets” tab in the sidebar and click "+ Worksheet" button in the upper right hand corner
.png)
2. In the worksheet, paste the query below into the worksheets query box. This will instantiate a custom client OAuth server on your Snowflake instance that Parabola will use to connect to.
create security integration oauth_parabola_prod
type = oauth
enabled = true
oauth_client = custom
oauth_client_type = 'CONFIDENTIAL'
oauth_redirect_uri = 'https://parabola.io/api/auth/snowflake/callback'
oauth_issue_refresh_tokens = true
oauth_refresh_token_validity = 7776000
The configuration above is the basic default settings for OAuth server up, but can be customized further for your needs. Additional information located on Snowflake documents here.
Click the Run/Play button. If successful, you should see a notification on the lower portion of the screen confirming integration creation was successful.
Retrieving the Client ID and Client Secret
Run the following query:
select system$show_oauth_client_secrets('OAUTH_PARABOLA_PROD');
Note: The name of your integration passed into this statement should be all capitalized. Ex “oauth_parabola_prod” should be entered as 'OAUTH_PARABOLA_PROD'
Click on the result in the lower half of the page and copy the oauth_client_id and oauth_client_secret values in the resulting json
.png)
Set up the step in Parabola
In your builder, bring in the Snowflake step and Click on “Authorize Snowflake”. You will see a form asking for client_id, client_secret, and account_identifier. For client_id and client_secret, paste the values you received above.
For account_identifier, paste your Snowflake account id. Your account ID will be the located in your URL:
<account_identifier>.snowflakecomputing.com
If your Snowflake URL has a region included in it, along with an account identifier, you may need to include that region as well in this step.
After you hit Submit, a module will pop up which will ask to authenticate. Login to your Snowflake account as you always would. After logging in, you should be taken back to Parabola. You will now be able to query data from Snowflake!
Step Permissions
When a user authorizes our "Pull from Snowflake" step, their access to data within the Parabola step will be the same as their access to data within the Snowflake platform. If a user has granular permissions configured in Snowflake, their access will be gated in the same fashion within Parabola.
While credentials like Client ID and Client Secret are at the organization level, when a user actually authenticates the step through their Snowflake login, we ensure that the actual user account permissions are enforced within the step itself.
Parabola now supports shared authentication for Snowflake, making it easier for teams to authorize Snowflake once and reuse that connection across flows and users—without needing to repeatedly input credentials or reauthorize each step.
- Admins can authorize a Snowflake connection once via any Pull from Snowflake or Send to Snowflake step.
- Any team member can select the shared Snowflake connection in their Pull from Snowflake or Send to Snowflake step by choosing the appropriate shared auth profile.
- Permissions and access levels will still reflect the Snowflake role tied to that authenticated connection.
Learn more about managing integration accounts here.
Helpful Tips
On pulling data from Snowflake
There is currently no way to add dynamic filters to your query, so you’ll want to filter your data as much as possible in the query itself to limit the amount of data you’re pulling in.
Get help from AI
When working in the ‘Query (optional)’ field, you’ll see two buttons that open AI chat:
- “Help write query”: Describe the data you want in plain language (for example, “Show the last 30 days of shipped orders”), and AI will draft the SQL.
- “Optimize query”: Paste your existing SQL and ask AI to fix errors, improve performance, or add logic. This is especially helpful for resolving SQL syntax issues.
You can iterate in the AI chat until the query is ready to run.
Snowflake's maximum token validity
The maximum token validity is 90 days, as enforced by Snowflake. This limit cannot be extended. You can set a shorter validity period by updating the oauth_refresh_token_validity parameter for your custom client. If a token expires after reaching its maximum validity, you will be prompted to reauthorize your Snowflake connection the next time the flow runs.
Snowflake permissions
By default Parabola will mimic the permissions you have within your Snowflake instance. The request will check the user's default role, warehouse, and database/schema. If these values are not set, or the users default values are not sufficient to make a certain request, you will see an error message like below:
Settings Error: Error occurred with Snowflake API (status_code: 422, message: “SQL compilation error: Object ‘CUSTOMER’ does not exist or not authorized.”)
If this occurs, open up the settings on the left-hand side labeled Connection Options and manually enter the values you would like to use to make a query:
.png)
You can play around with these values in the Snowflake worksheets section to find a configuration that works for you. In the upper left hand corner of the page select for role or warehouse, and the sidebar for database or schema respectively:
.png)
.png)
Use the Send to Snowflake step to insert, update, or merge data into your Snowflake database.
This step is currently offered to users on our Advanced Plan. Check out the Pricing Page for additional information.
Before you get started, check to see if your team has already set up their Client ID and Client Secret for Parabola. If you or someone else on your team has already set this up on the Snowflake side, you will not need to go through this process again and can jump straight to the Parabola Step Set Up section.
Connect your Snowflake account
In order to perform these steps, you must have the right permission level in Snowflake to create a security integration.
Login to your Snowflake account. Once you’re logged in, click on “Worksheets” tab in the sidebar and click + Worksheet button in the upper right hand corner
In the worksheet, paste the query below into the worksheets query box. This will instantiate a custom client OAuth server on your Snowflake instance that Parabola will use to connect to.
create security integration oauth_parabola_prod
The configuration above is the basic default settings for OAuth server up, but can be customized further for your needs. Additional information located on Snowflake documents here.
Click the Run/Play button. If successful, you should see a notification on the lower portion of the screen confirming integration creation was successful.
Retrieving the Client ID and Client Secret
Run the following query:
select system$show_oauth_client_secrets('OAUTH_PARABOLA_PROD');
Note: The name of your integration passed into this statement should be all capitalized. Ex “oauth_parabola_prod” should be entered as 'OAUTH_PARABOLA_PROD'
Click on the result in the lower half of the page and copy the oauth_client_id and oauth_client_secret values in the resulting json
Parabola Step Set Up
In your Flow builder, add the Send to Snowflake step and click on “Authorize Snowflake”. You will see a form asking for client_id, client_secret, and account_identifier. For client_id and client_secret, paste the values you received above.
For account_identifier, paste your Snowflake account id. Your account ID will be the located in your URL:
<account_identifier>.snowflakecomputing.com
.png)
If your Snowflake URL has a region included in it, along with an account identifier, you may need to include that region as well in this step.
After you hit “Submit”, a window will pop up which will ask to authenticate. Login to your Snowflake account as you always would. After logging in, you should be taken back to Parabola. You will now be able to send data to Snowflake!
Step Permissions
When a user authorizes our Send to Snowflake step, their access to data within the Parabola step will be the same as their access to data within the Snowflake platform. If a user has granular permissions configured in Snowflake, their access will be gated in the same fashion within Parabola.
While credentials like Client ID and Client Secret are at the organization level, when a user actually authenticates the step through their Snowflake login, we ensure that the actual user account permissions are enforced within the step itself.
Sending data
This step can send data in 3 different ways:
- Insert - adds new rows to Snowflake
- Update - uses a unique identifier to find existing rows to update
- Merge (upsert) - attempts an update, and if no matching rows are found, inserts the data instead
Both update and merge require a Snowflake column to be used as the unique identifier.
This step cannot create or remove tables within Snowflake. A database table must already exist in Snowflake, with a schema of columns, to use this step.
Any columns within Parabola that are not mapped to corresponding columns in Snowflake will not be sent. If any Snowflake columns do not have corresponding columns mapped within Parabola, the resulting new rows will have blank values in those columns.
⚠️ Note: when using the “update” option, Snowflake will not send back an error if an update was unable to find a matching row. The Parabola Flow will indicate success and look like it sent a number of rows, but if any of those rows during the update process were unable to match any rows in Snowflake, no error will be returned. This is unfortunately a Snowflake limitation.
Helpful Tips
By default Parabola will mimic the permissions you have within your Snowflake instance. The request will check the users default role, warehouse, and database/schema. If these values are not set, or the users default values are not sufficient to make a certain request, you will see an error message like below:
Settings Error: Error occurred with Snowflake API (status_code: 422, message: “SQL compilation error: Object ‘CUSTOMER’ does not exist or not authorized.”)
If this occurs, try updating the Role, Warehouse, Database, or Schema settings.
You can play around with these values in the Snowflake worksheets section to find a configuration that works for you. In the upper left hand corner of the page select for role or warehouse, and the sidebar for database or schema respectively:
Snowflake's maximum token validity
The maximum token validity is 90 days, as enforced by Snowflake. This limit cannot be extended. You can set a shorter validity period by updating the oauth_refresh_token_validity parameter for your custom client. If a token expires after reaching its maximum validity, you will be prompted to reauthorize your Snowflake connection the next time the flow runs.
Integration:
SPS Commerce
Integration:
Square
The Pull from Square step connects directly to your data in Square. Pull in data on transactions, refunds, customers, locations, and more.
Connect your Square account
To connect your Square account to Parabola, double-click on the Pull from Square step and click "Authorize." A window will pop up asking you to sign in to your Square account using your email and password. Once you complete the login, you'll see the step on Parabola connected and pulling in your data.
Default settings
When you first connect to the Pull from Square step, it'll pull in Location Details which is the first option in the data type dropdown.
If you click into "Advanced Settings," you can filter locations if you have multiple locations and you want to filter to see data for those particular locations.
Custom settings
Here are the available data sets in the data type dropdown:
- Location Details (see default settings)
- Transactions
- Refunds
- Catalog
- Customers
- Employees
Transactions
Pulling in Transactions data will return the following columns:
- "created_at"
- "transaction_id"
- "device.id"
- "device.name"
- "tax_money.amount"
- "total_collected_money.amount"
- "net_sales_money.amount"
- "location_id"
By default, this option will pull in all data for your selected time frame. However, you can filter for the following subsets of data: Tenders, Refunds, Line Items, Transactions Report, and Item Details Report.
The Timeframe will default to the Last 7 Days, but the following timeframe options are available: Last 24 Hours, Last 1 Day, Last 7 Days, Last 30 Days, Last Month, Last 3 Months, Last 6 Months, Last Year, This Year, and Custom Range.
If you select the Custom Range option, you can configure a Start Date and End Date. Please make sure to provide these dates in the following format: MM-DD-YYYY. So, February 28, 2020 will be indicated as 02-28-2020.
You should also set the appropriate Time Zone to use to filter for your dates. By default, the Africa/Abidjan time zone will be selected since that's the first time zone listed in our alphabetical list.
If you click into "Advanced Settings," you'll see an option to Filter Locations if it'd be useful to filter your data by one or many locations.
You can also adjust the offset of your relative timeframe by customizing how many days, weeks, or months ago we should start the timeframe from.
You can also specify a Day Start Time which will be 12:00AM as a default.
Refunds
Pulling in Refunds data will return the following columns:
- "created_at"
- "transaction_id"
- "device.id"
- "device.name"
- "tax_money.amount"
- "total_collected_money.amount"
- "net_sales_money.amount"
- "location_id"
By default, this option will pull in all data for your selected time frame. However, you can filter for the following subsets of data: Original Transaction Tenders, Original Transaction Line Items, Refunds Report, Item Details Report.
The Timeframe, Time Zone, and Advanced Settings are all the same as the Transactions data type above.
Catalog
Pulling in Category data will return your item catalog including items, variations, categories, discounts, taxes, modifiers, and more. A total of 92 columns are returned.
Customers
Pulling in Customers data will return the following columns:
- "id"
- "created_at"
- "updated_at"
- "given_name"
- "family_name"
- "email_address"
- "reference_id"
- "preferences.email_unsubscribed"
- "groups[0].id"
- "groups[0].name"
- "address.address_line_1"
- "address.locality"
- "address.administrative_district_level_1"
- "address.postal_code"
- "phone_number"
Employees
Pulling in Employees data will return the following columns:
- "authorized_location_ids[0]"
- "authorized_location_ids[1]"
- "id"
- "first_name"
- "last_name"
- "status"
- "authorized_location_ids[2]"
- "role_ids[0]"
- "email"
If you click into "Advanced Settings," you can filter locations if you have multiple locations and you want to filter to see data for those particular locations.
Helpful tips
- Timeframes will always shift to only include full units of time. If you choose the last 7 days, it will begin with the most recent full day, not the partial day you are in right now. If you choose the last 3 months, it will begin with the most recent full month, not including the partial month you are in right now.
- Inventory is not currently a supported category in the native Square integration, but you can attempt to connect Square’s API directly to pull in inventory data.
Integration:
Squarespace
The Pull from Squarespace step pulls data from your Squarespace account via their API.
The Pull from Squarespace step is a beta step. It is a Pull from an API step that has been pre-configured to work with the Squarespace API.
NOTE: Squarespace requires an "Advanced Commerce" plan to pull data from their Commerce API. For additional information, please visit their pricing page.
Connect your Squarespace account
Connecting to the Squarespace API is straightforward. You will need to provide an API Key from your Squarespace account. Head here for instructions from Squarespace on generating an API key.
Once you have your API Key, add it into the step into the Bearer Token field.

If the pull does not bring back all of your data, increase the Max Requests field so that more pages are fetched.
Custom settings
This beta step is pre-configured to pull data in from the Squarespace Orders endpoint. You can update the URL in the API Endpoint URL field if you'd like to access data from a different endpoint. You can view all available endpoints from Squarespace's Commerce API here.
Integration:
Stord
How to authenticate
Stord uses a Bearer token (also called an API secret key). You'll need this token from your Stord account to connect.
- Get your credentials in Stord
- From the Stord One Console, go to My Profile > API Keys. Select Create API Key.
- Add or edit the key name to describe why or how the key is used and make it identifiable.
- Modify the key's permissions. Make sure that you keep your keys extra secure by limiting the access that each key needs.
- Select Create Token to generate the token's secret
- Copy the secret to a secure place
- Connect in Parabola
- In your flow, add a Pull from Stord step.
- Click Authorize and enter your API secret key (Bearer token) when prompted.
- Once connected, select the Stord resource you want to pull and configure any filters (dates, SKUs, facilities, order statuses, etc.) offered by the step.
Available data
Parabola can pull a wide range of Stord records across inventory, orders, shipments, and products. Here's what you'll see when using the Stord integration:
- Inventory: View current inventory balances by SKU, lot number, facility, and expiration date. See quantities that are locked, unlocked, and total on-hand.
- Receipt Confirmations: Details on received inventory including order numbers, processing status, and timestamps for purchase and transfer orders.
- Sales Orders: Outbound order information including order details, customer information, delivery addresses, and order status.
- Purchase Orders: Inbound purchase order data with supplier information and expected receipts.
- Transfer Orders: Inter-facility transfer order details showing inventory movements between warehouse locations.
- Shipment Confirmations: Tracking information and shipment details once orders have shipped.
- Order Documents: Access to packing slips and other order-related documents.
- Products: Product catalog information including SKUs, names, product types (items, kits, listings), and attributes.
Common use cases
- Reconcile inventory across multiple Stord facilities to maintain an accurate stock picture.
- Monitor order fulfillment performance by tracking sales orders from creation through shipment confirmation.
- Automate low-stock alerts by pulling inventory balances and flagging SKUs below reorder thresholds.
- Validate receipt confirmations against expected purchase orders to catch receiving discrepancies.
- Create operational dashboards showing fulfillment velocity, order status distribution, and warehouse utilization.
- Audit inventory adjustments by combining adjustment records with reason codes to identify patterns or issues.
Tips for using Parabola with Stord
- Schedule your flows based on operational cadence: hourly during peak fulfillment windows, daily for inventory reconciliation, weekly for performance reporting.
- Use date filters to pull incremental data to avoid reprocessing historical records.
- Combine data sources like sales orders with shipment confirmations to calculate fulfillment speed, or merge inventory balances with adjustments to track accuracy.
- Set up Checks and Alerts to flag exceptions: orders missing shipping info, inventory adjustments without reason codes, or receipt confirmations that don't match expected quantities.
- Filter by facility when working with multi-warehouse operations to analyze performance or inventory levels by location.
- Use product filters to focus on specific inventory segments or product categories.
- Archive historical data to a warehouse or BI tool so you can analyze trends over time without repeatedly querying the Stord API.
That's it! You're ready to automate your Stord operations with Parabola.
Integration:
Stripe
The Pull from Stripe step connects to your Stripe account and pulls the following data types into Parabola in a familiar spreadsheet format:
- coupons
- customers
- invoices
- payments
- plans
- products
- subscriptions
Connect your Stripe account
Double-click on the Pull from Stripe step and click "Authorize." A pop-up window will appear asking you to log in to your Stripe account to connect your data to Parabola
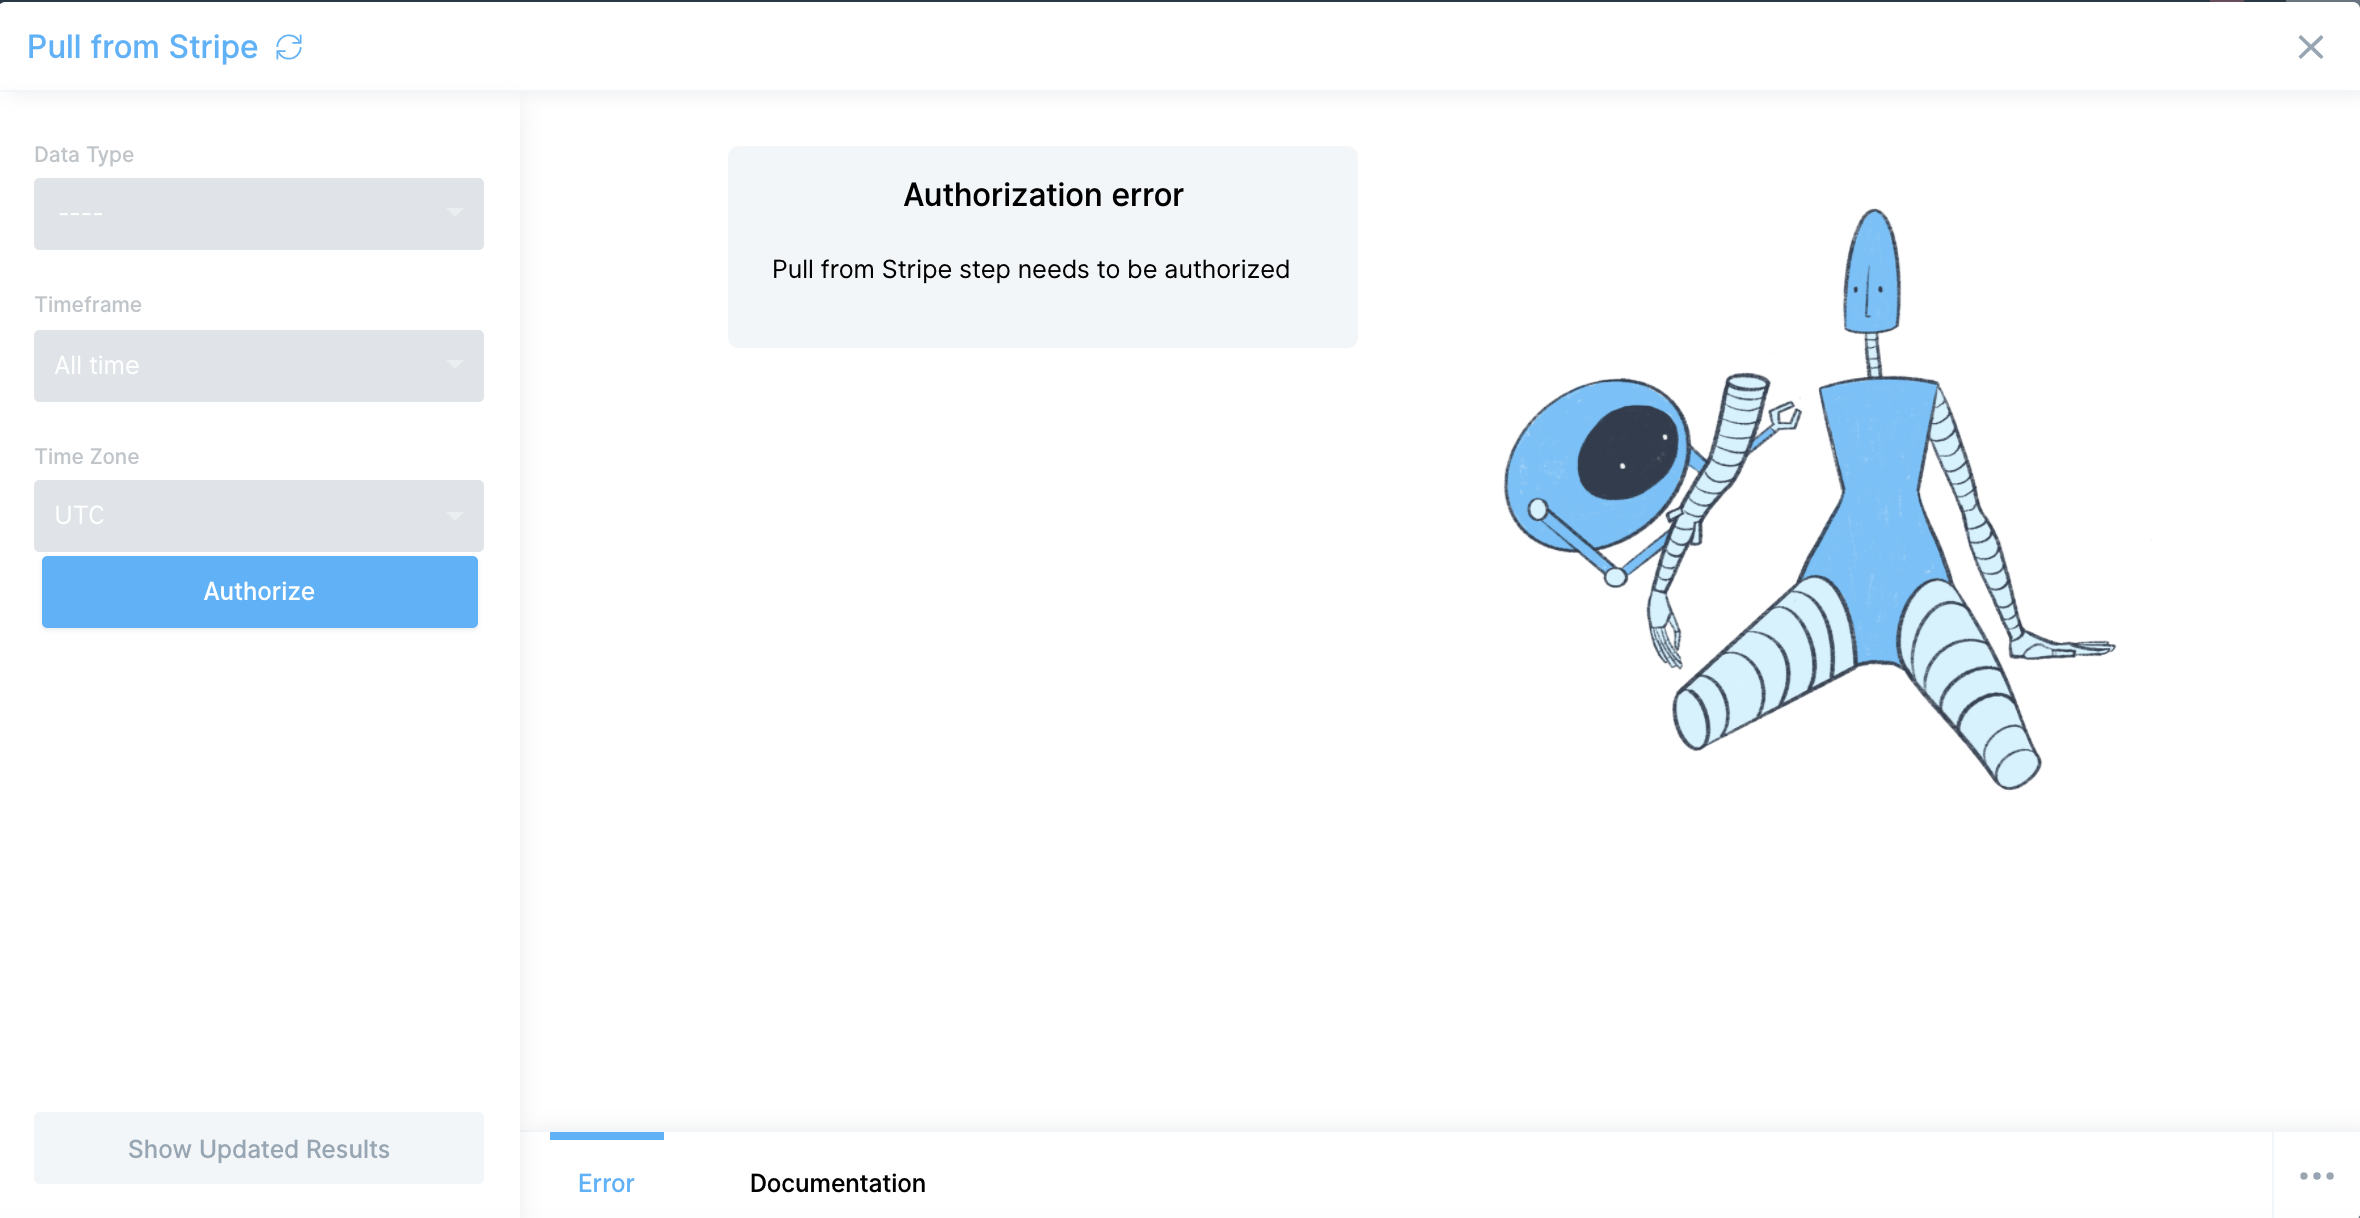
If you ever need to change the Stripe account that your Parabola flow is connected to, click "Edit accounts" at the top of the step and select to either "Edit" or "Add new account." Both options will prompt the same Stripe login window to update or add a new account.
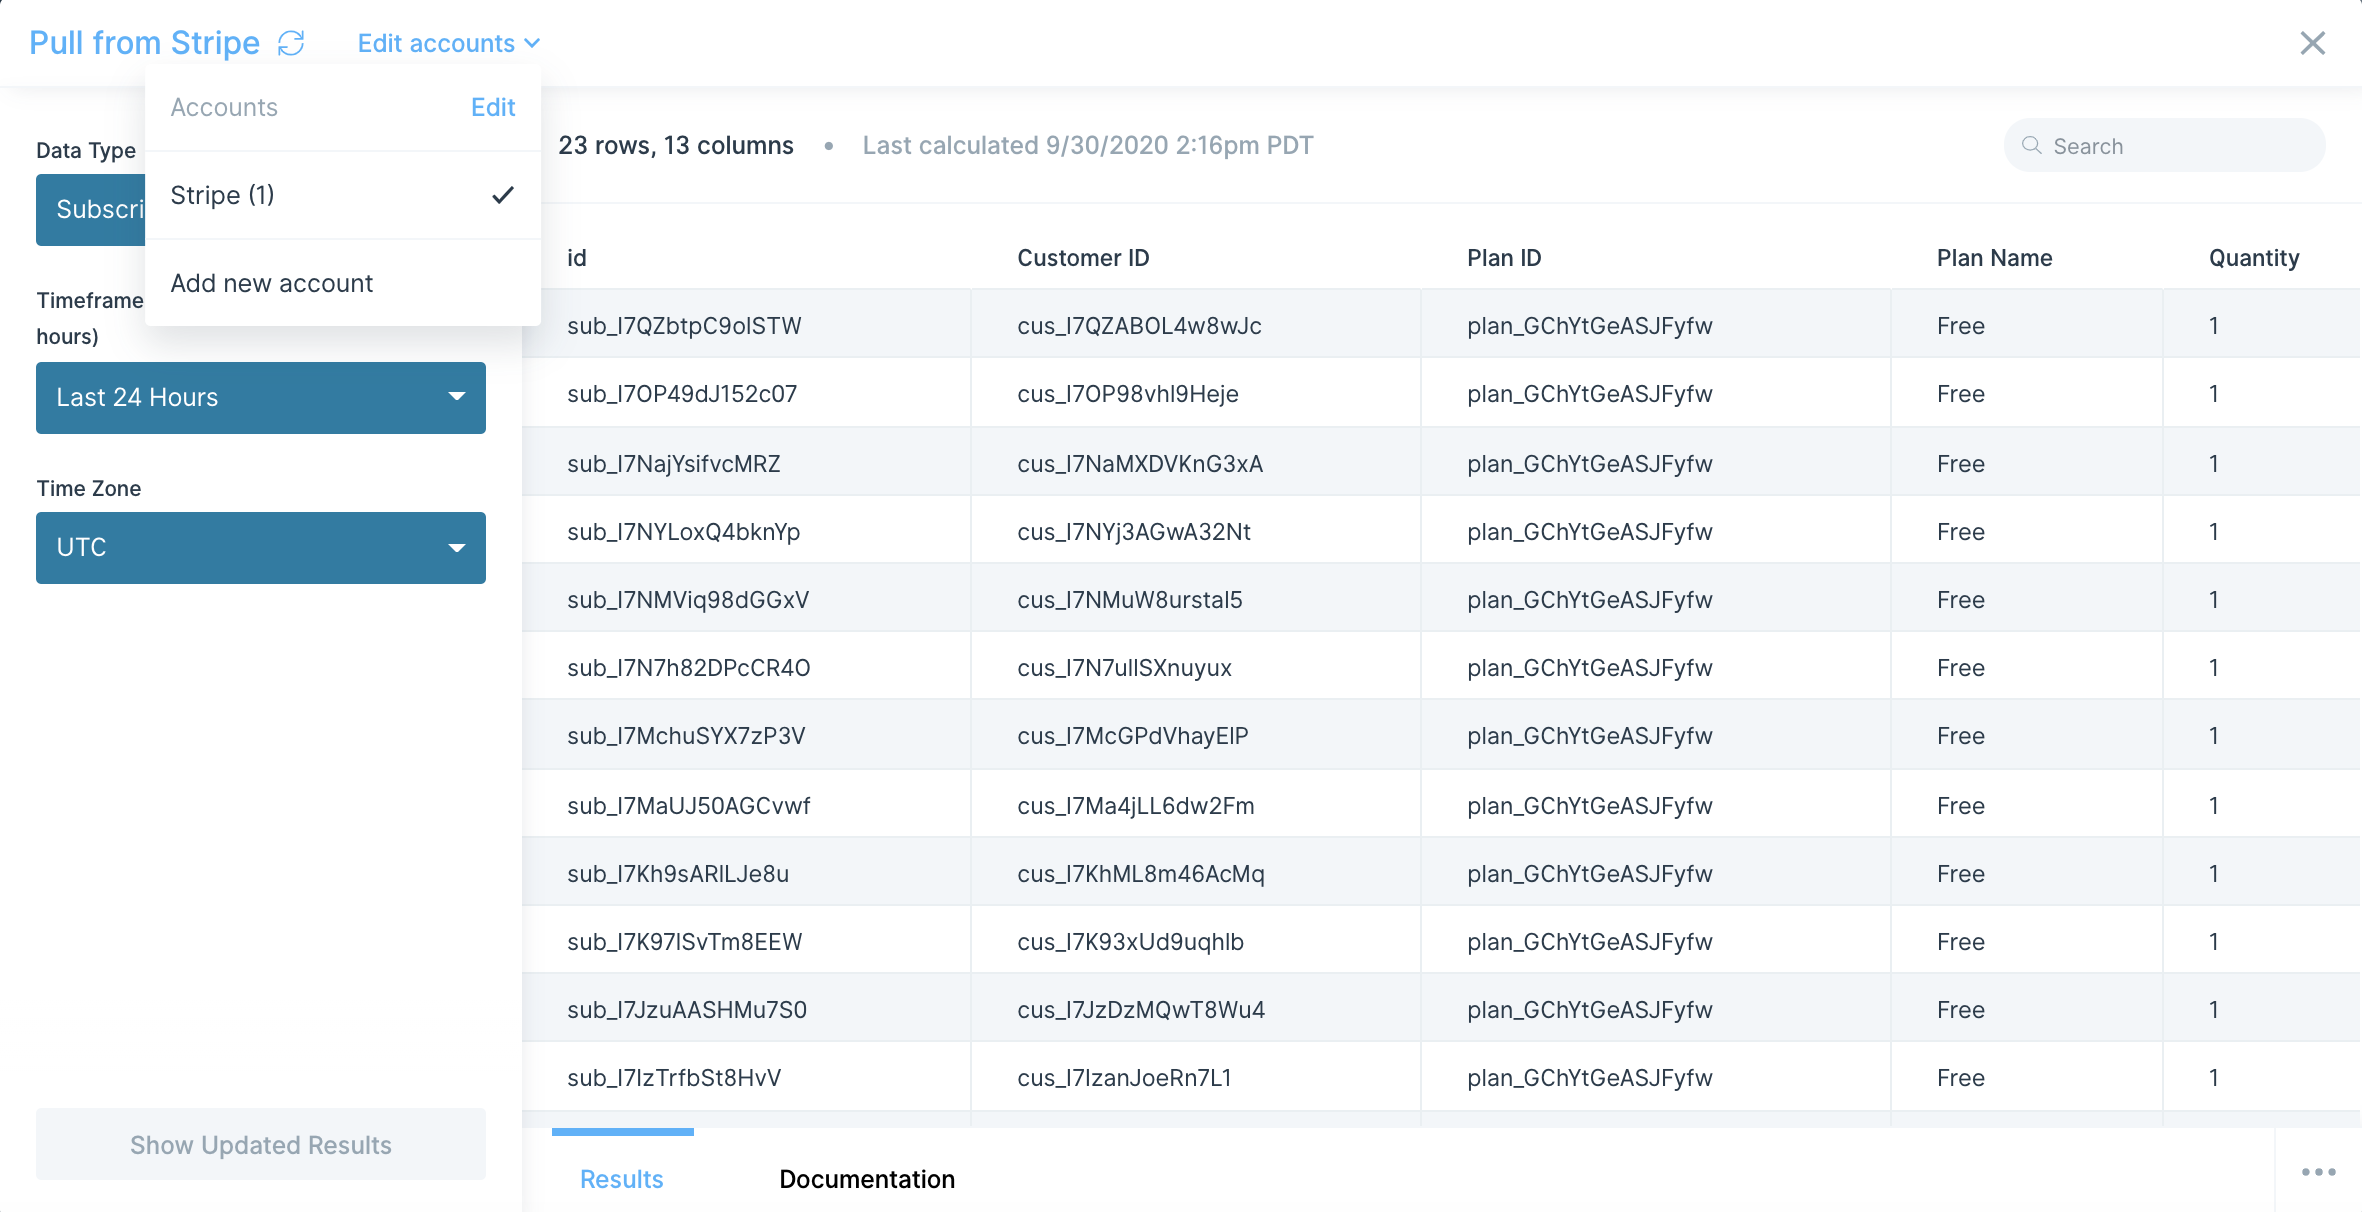
Custom settings
The first thing you'll want to do is select a data type to pull in from Stripe. Below are the seven different data types available.
Coupons
See data about coupons existing in your Stripe account. Please note that Stripe returns "Amount Off" with no decimals, so if you see 50000 in the "Amount Off" column, that will equal 500.00. You can connect our Insert math column step and Format numbers to update this if you prefer.
Column headers:
- "id"
- "Duration"
- "Duration in Months"
- "Percent Off"
- "Amount Off"
- "Currency"
- "Redeem By"
- "Max Redemptions"
Customers
See data about your customers in your Stripe account. The Created field displays when the customer was created in Stripe. The time is represented in Unix time. You can connect our Format dates step to update the date to your preferred format.
Column headers:
- "id"
- "Description"
- "Email"
- "Email"
- "Created"
- "Delinquent"
- "Plan ID"
- "Plan Name"
- "Quantity"
- "Status"
- "Balance"
Invoices
See data about invoices that exist in your Stripe account. The "Created" field displays when the invoices were created in Stripe. The time is represented in Unix time. You can connect our Format dates step to update the date to your preferred format.
Column headers:
- "id"
- "Created"
- "Customer ID"
- "Amount Due"
- "Total"
- "Tax"
- "Currency"
- "Charge ID"
- "Subscription ID"
- "Coupon"
- "Attempt Count"
- "Closed"
Payments
See data about payments that exist in your Stripe account. The "Created" field displays when the payment was created in Stripe. The time is represented in Unix time. You can connect our Format dates step to update the date to your preferred format. Please note that Stripe returns Amount with no decimals, so if you see 50000 in the Amount column, that will equal 500.00. You can connect our Insert math column step and Format numbers to update this if you prefer.
Column headers:
- "id"
- "Customer ID"
- "Created"
- "Amount"
- "Amount Refunded"
- "Currency"
- "Order ID"
- "Invoice ID"
- "Application ID"
- "Application Fee"
- "Status"
Plans
See data about plans that exist in your Stripe account. The "Created" field displays when the plan was created in Stripe. The time is represented in Unix time. You can connect our Format dates step to update the date to your preferred format. Please note that Stripe returns Amount with no decimals, so if you see 50000 in the Amount column, that will equal 500.00. You can connect our Insert math column step and Format numbers to update this if you prefer.
Column headers:
- "id"
- "Name"
- "Product ID"
- "Created"
- "Interval"
- "Interval Count"
- "Amount"
- "Currency"
- "Trial Period"
Products
See data about products that exist in your Stripe account. The "Created" field displays when the plan was created in Stripe. The time is represented in Unix time. You can connect our Format dates step to update the date to your preferred format.
Column headers:
- "id"
- "Name"
- "Type"
- "Created"
- "Description"
- "Statement Descriptor"
- "Unit Label"
- "URL"
Subscriptions
See data about subscriptions that exist in your Stripe account. The "Created" date field returned is represented in Unix time. You can connect our Format dates step to update the date to your preferred format.
Column headers:
- "id"
- "Customer ID"
- "Plan ID"
- "Plan"
"Name" - "Interval"
- "Amount"
- "Status"
- "Coupon"
- "Created"
- "Start"
- "Current Period Start"
- "Current Period End"
Custom timeframe and time zone
For every data type available in the Pull from Stripe, we support the ability to customize the timeframe to use to pull the relevant data as well as the time zone we should use for the selected timeframe. Parabola will retrieve rows of data that were created within your selected timeframe.
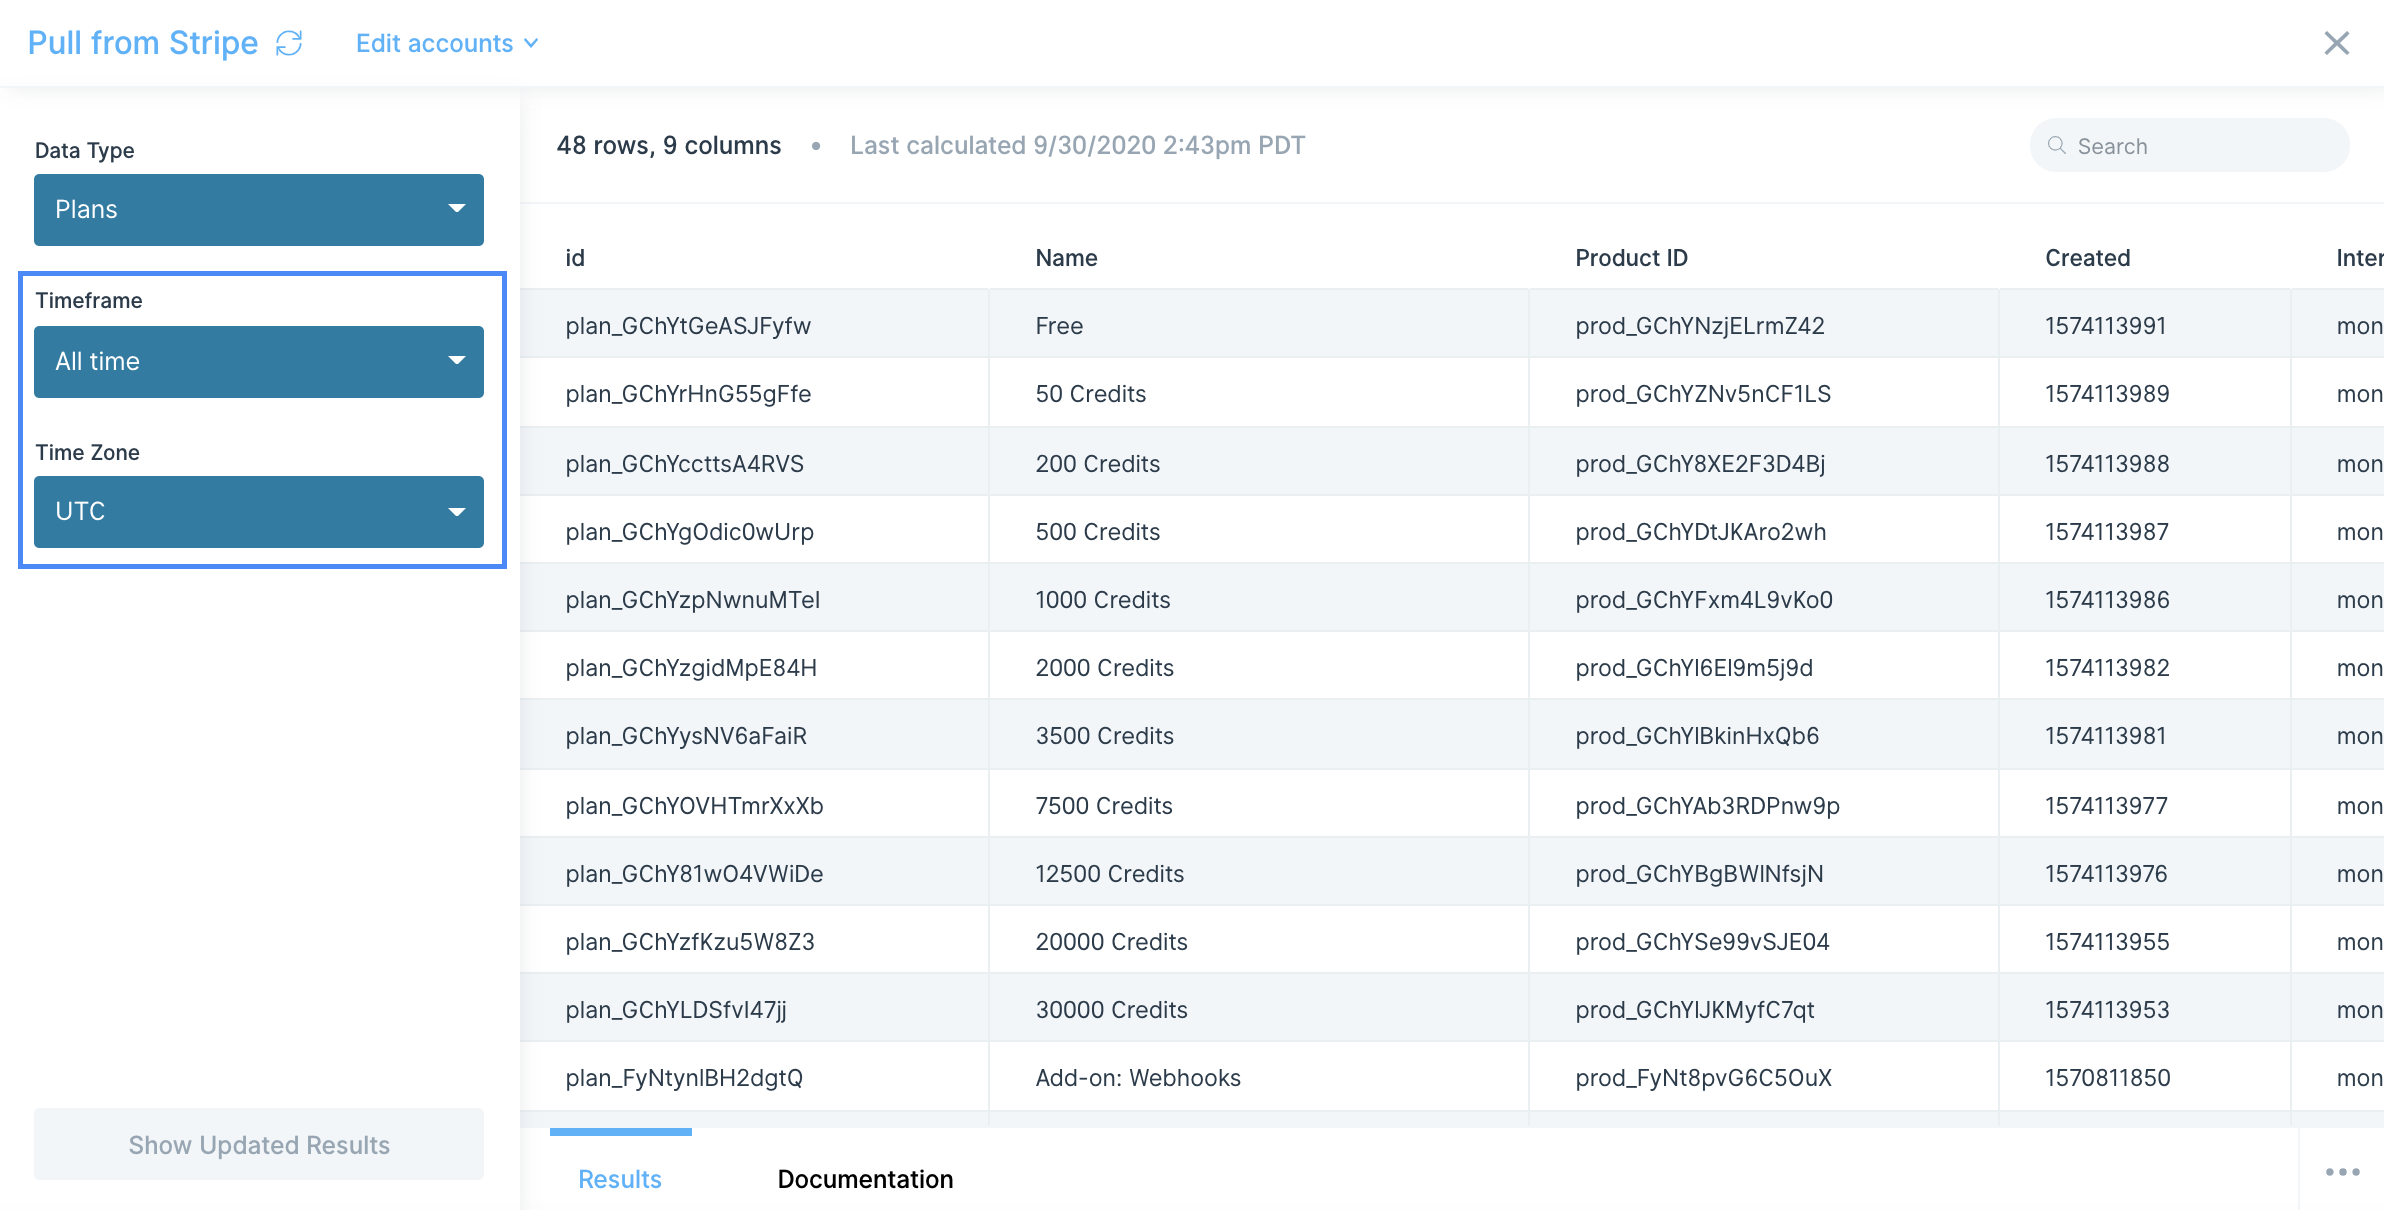
Integration:
TikTok
Get a full-picture view of your marketing performance across channels by adding TikTok data to your automated reports. Track key metrics like clicks, impressions, and payments, and combine your spend across platforms for a blended CAC metrics.
TikTok is a beta integration which requires a more involved setup process than our native integrations (like Facebook Ads and Google Analytics). Following the guidance in this doc should help even those without technical experience pull data from TikTok. If you run into any questions, shoot our team an email at support@parabola.io.
Connect your TikTok account
To pull marketing data from TikTok, you must start by registering as a TikTok developer through their Marketing Portal.
Once registered, you can then 'Create a Developer App.' Heads up – TikTok says this app may take 2-3 business days for them to review and approve.
- Note: when you're creating the developer app, you'll be asked to provide a 'redirect URL.' You can supply the following URL: https://parabola.io/api/steps/generic_api/callback
With your developer app approved, you'll be provided with an auth_token URL that generates your access token. If you click on this URL or paste it into a new browser tab and search, you'll see an access token appended to the resulting URL. That access token can be copied and inserted into the "Pull from TikTok" step in the "Request Header" section.
You'll also need to acquire your "Advertiser ID", which can be pasted in the "Input Advertiser ID" card.
Custom Settings
Our TikTok integration was built to support TikTok's Basic Reports and Audience Reports. To help you get started, we've brought in a list of all the Metrics (ex. Spend, CPM) and Dimensions (ex. group by Campaign and Day) supported in TikTok's reports.
To start outputting your data once you've successfully set up your TikTok Developer Account, you'll need to follow 4 steps:
- In the "SELECT DIMENSIONS" and "SELECT METRICS" steps, select your desired data. These selections flow into the live API call later in the flow.
- In the "Specify Date Range" card, follow the instructions on the card to set your desired date range.
- Input your Advertiser ID in the corresponding step – this also will be dynamically inserted into your live API call
- Enter your Access_Token in the "Pull from TikTok" step in the "Request Headers" section
Helpful Information
- Metric/ Dimension Groupings: There are certain dimension/ metric groupings that TikTok does not support (ex. in each request, you can only have one ID dimension and one time dimension). For a full explanation of their API capabilities, check out their report pages.
- Pulling additional data: If you're hoping to pull a different dataset from TikTok's API, check out their API documentation.
Integration:
Twilio
The Pull from Twilio step pulls messages and phone numbers from Twilio.
Connect your Twilio account
The first thing you'll need to do to start using the Pull from Twilio step is to authorize the step to access the data in your Twilio account.
Double-click on the step and click "Authorize." This window will appear where you'll need to provide the Account SID and Auth Token from your Twilio account.
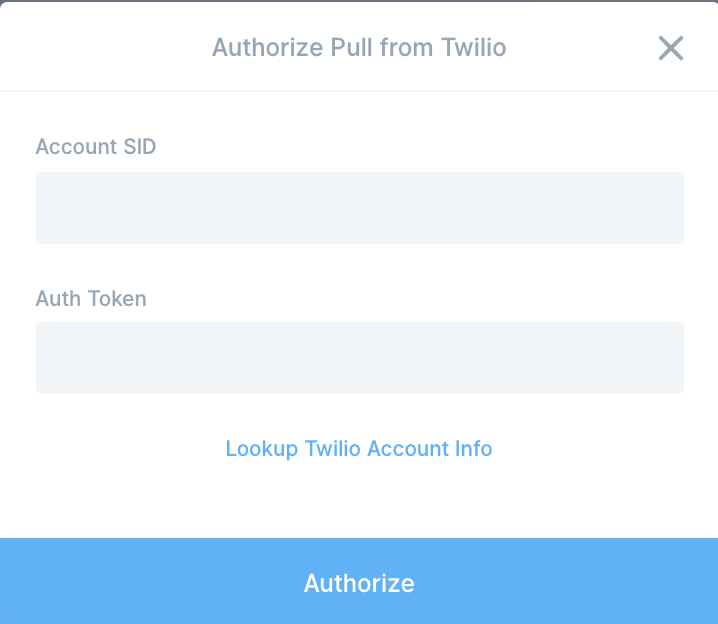
To locate this information on your Twilio account, click on the blue link to Lookup Twilio Account Info. This will take you to https://www.twilio.com/console. You'll see your Account SID and Auth Token that you can copy and paste from your account to Parabola.
Custom settings
Once you're connected, you'll have the following data types to select from:
- Outbound Messages
- Inbound Messages
- Phone Numbers
Outbound Messages
This option pulls logs of all outbound messages you sent from your Twilio account. The returned columns are: To (phone number), From (phone number), Status, Price, Date Sent, Body (of message).
You have optional fields you can set to filter the data. Leaving the Date Sent field blank will simply pull in the most recent 100k messages.
Inbound Messages
This option pulls logs of any responses or inbound messages you've receive to the phone numbers associated with your Twilio account. The returned columns are: To (phone number), From (phone number), Status, Price, Date Sent, Body (of message).
You have optional fields you can set to filter data. Leaving the Date Received field blank will simply pull in the most recent 100k messages.
Phone Numbers
This option pulls in phone numbers that are associated with your account. The returned columns are: Number ID, Phone Number, Friendly Name, SMS Enabled, MMS Enabled, Voice Enabled, Date Created, Date Updated.
The Send to Twilio step triggers dynamic SMS messages sent via Twilio using data transformed in your Parabola flow. You can use Parabola to dictate who should receive your SMS messages, what message they should receive, and trigger Twilio to send them.
Connect your Twilio account
The first thing you'll need to do to start using the Send to Twilio step is to authorize the step to send data to your Twilio account.
Double-click on the step and click on the blue button to Authorize. This window will appear where you'll need to provide the Account SID and Auth Token from your Twilio account.
To locate this information on your Twilio account, click on the blue link to Lookup Twilio Account Info. This will take you to https://www.twilio.com/console. You'll see your Account SID and Auth Token that you can copy and paste from your account to Parabola.
Custom settings
By default, this step will be configured to Send text messages to recipients when the flow runs. If for whatever reason you need to disable this temporarily, you can select to not send text messages when the flow runs.
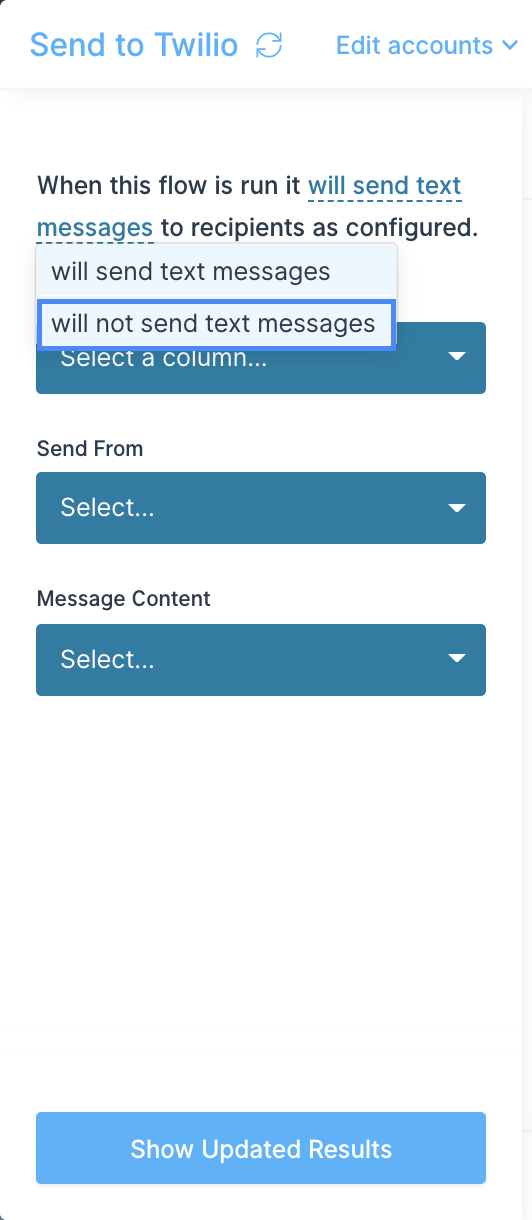
Then, you'll select the following columns that contain the data for phone numbers you'd like to Send To, phone numbers you'd like to Send From, and text you'd like Twilio to send as Message Content.
Please make sure that the phone numbers you'd like to Send From are valid Twilio phone numbers that your Twilio account is authorized to send from. Verified Caller ID phone numbers cannot be used to send outbound SMS messages.
For Message Content, you have the option to use content from an existing column or a custom message. Select the Custom option from the dropdown if you'd like to type in a custom message. While the custom message is a great, easy option, this means that all of your recipients will receive the same message. If you'd like your messages to be customized at all, you should create your dynamic messages in a column beforehand. The Insert column can be particularly useful here for creating dynamic text content.
Each row will represent a single SMS. If your data contains 50 rows that means 50 SMS messages will be sent.
Helpful tips
- Twilio will charge you according to your account per message. You can monitor your Twilio usage by heading to Twilio's Console page.
- Twilio has a rate limit on sending messages. They will only send as fast as one per second, or 60 per minute. If your flow is attempting to send a large number of messages, be aware that it may run for a long time to comply with this limit.
- Parabola doesn’t automatically run the Flow upon each text, but you can pull in the texts based on some time/data parameters if you choose to schedule the Flow. It’s also possible, on theTwilio side, to set up a webhook that spins every time a text is sent, which can then be set to trigger the Flow via Parabola.
Integration:
Typeform
The Pull from Typeform step enables you to connect to your Typeform account and pull response data from your Typeform forms into Parabola.
Connect your Typeform account
Double-click on the Pull from Typeform step and click the blue button to Authorize. A pop-up window will appear asking you to log in to your Typeform account and connect your data to Parabola.

If you ever need to change the Typeform account that your Parabola flow is connected to, click "Edit accounts" at the top of the step and select to either "Edit" or "Add new account." Both options will prompt the same Typeform login window to update or add a new account.
Custom settings
The first thing you'll be asked to do is select the relevant Typeform form you'd like to pull in. Click on the "Form" dropdown on the lefthand side and you'll see all of the forms you have created in Typeform.

By default, the checkbox below to Include metadata from responses will be unchecked. With this option unchecked, a column will be created for every survey question, and a row of answers will appear for every response you receive.
If you check the box to Include metadata from responses, Parabola will also pull in metadata about a client's HTTP request that Typeform collected along with their responses. The following columns will be pulled into Parabola in addition to the question columns:
- "landing_id"
- "token"
- "response_id"
- "landed_at"
- "submitted_at"
- "hidden"
- "calculated"
- "user_agent"
- "platform"
- "referrer"
- "network_id"
- "browser"
Helpful tips
- Pulling data from multiple Typeform forms: if your flow requires data from multiple Typeform forms or multiple Typeform accounts, you can either duplicate or drag in another Typeform step, connect that step to a different form, or click edit accounts to connect to a different Typeform account entirely. Each Pull from Typeform step you have in a single Parabola flow can represent a different Typeform form. There is no limit to how many different forms' data that can be pulled in on a single Parabola flow.
Integration:
UPS
The UPS integration is used by operators to integrate UPS’s shipping, tracking, and logistics services into their platforms and workflows.
How to authenticate
UPS uses OAuth 2.0 Client Credentials for secure API access.
- Go to your UPS Developer Portal and register an app. See below for in-depth instructions.
- Locate your Client ID and Client Secret from the app info page.
- Use these credentials in Parabola’s UPS integration setup form:
- Enter your Client ID and Client Secret.
- x-merchant-id is your 6-digit UPS account number.
- Parabola will automatically use UPS’s token endpoint to request an access token
- Once authenticated, you can begin importing tracking data by inquiry number or reference number.
Tips for using Parabola with UPS
- Schedule your flow to run automatically for continuous visibility into shipments.
- Use Filters to flag delayed or “Exception” status shipments for faster response.
- Join UPS data with your order records to automate delivery confirmations.
- Combine with other systems (like Shopify, Netsuite, or your warehouse management system) to create end-to-end logistics visibility.
- Create email or Slack alerts in Parabola for critical milestones like “Out for Delivery” or “Delivered.”
- Leverage proof-of-delivery images to verify receipt for high-value or time-sensitive orders.
Creating an application in the UPS Developer Portal
1. Navigate to the UPS Developer Portal.
2. Click Login to access your UPS account.
3. Click Create Application to make a new application and generate your credentials.

⚠️ Note: This application will be linked to your shipper accounts(s) and email address associated with your UPS.com ID
4. Select your use case, shipper account, and accept the agreement.
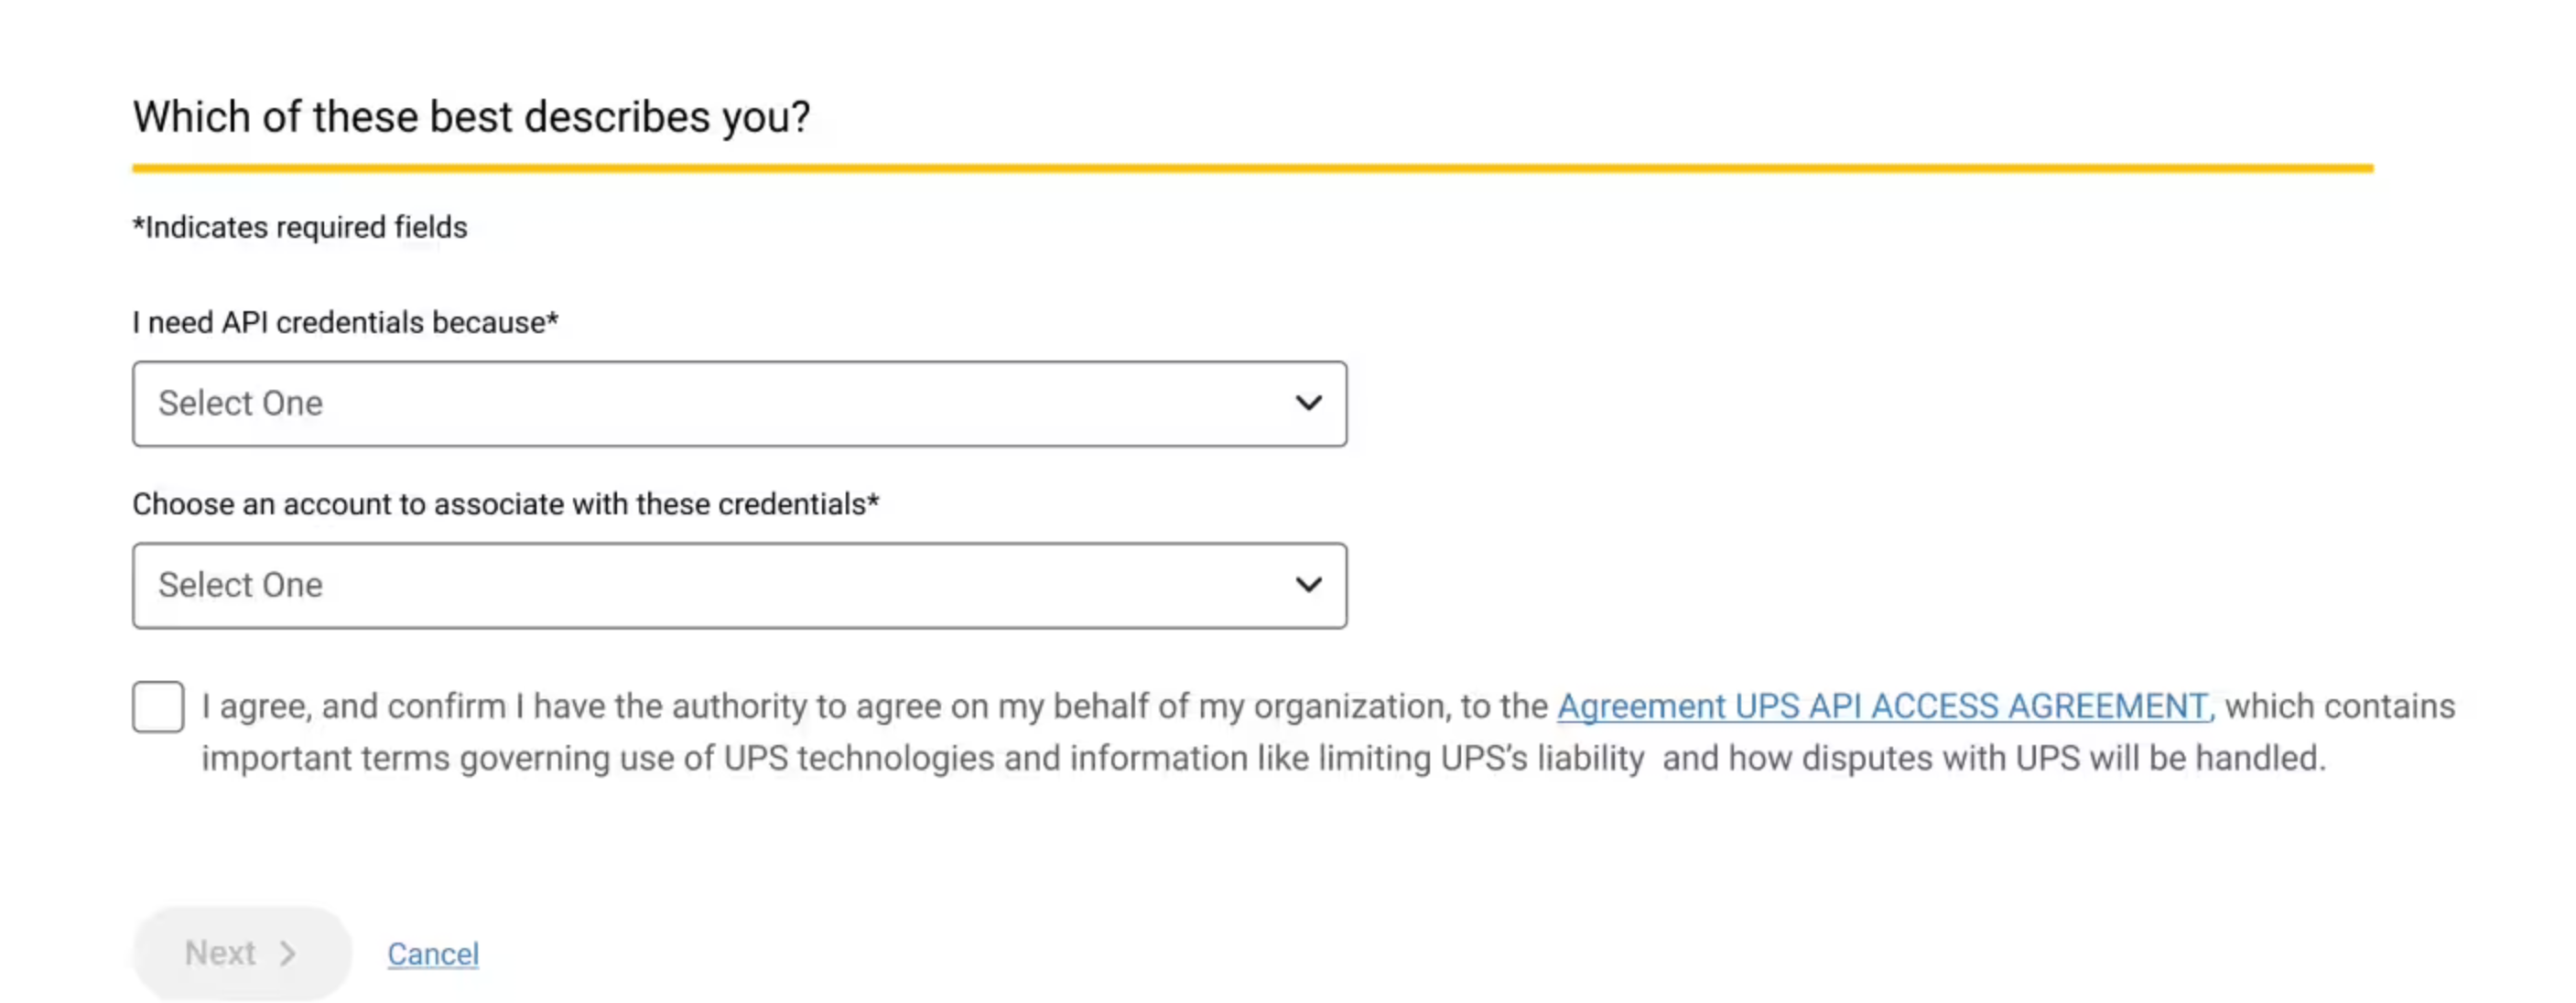
5. Enter your contact information.
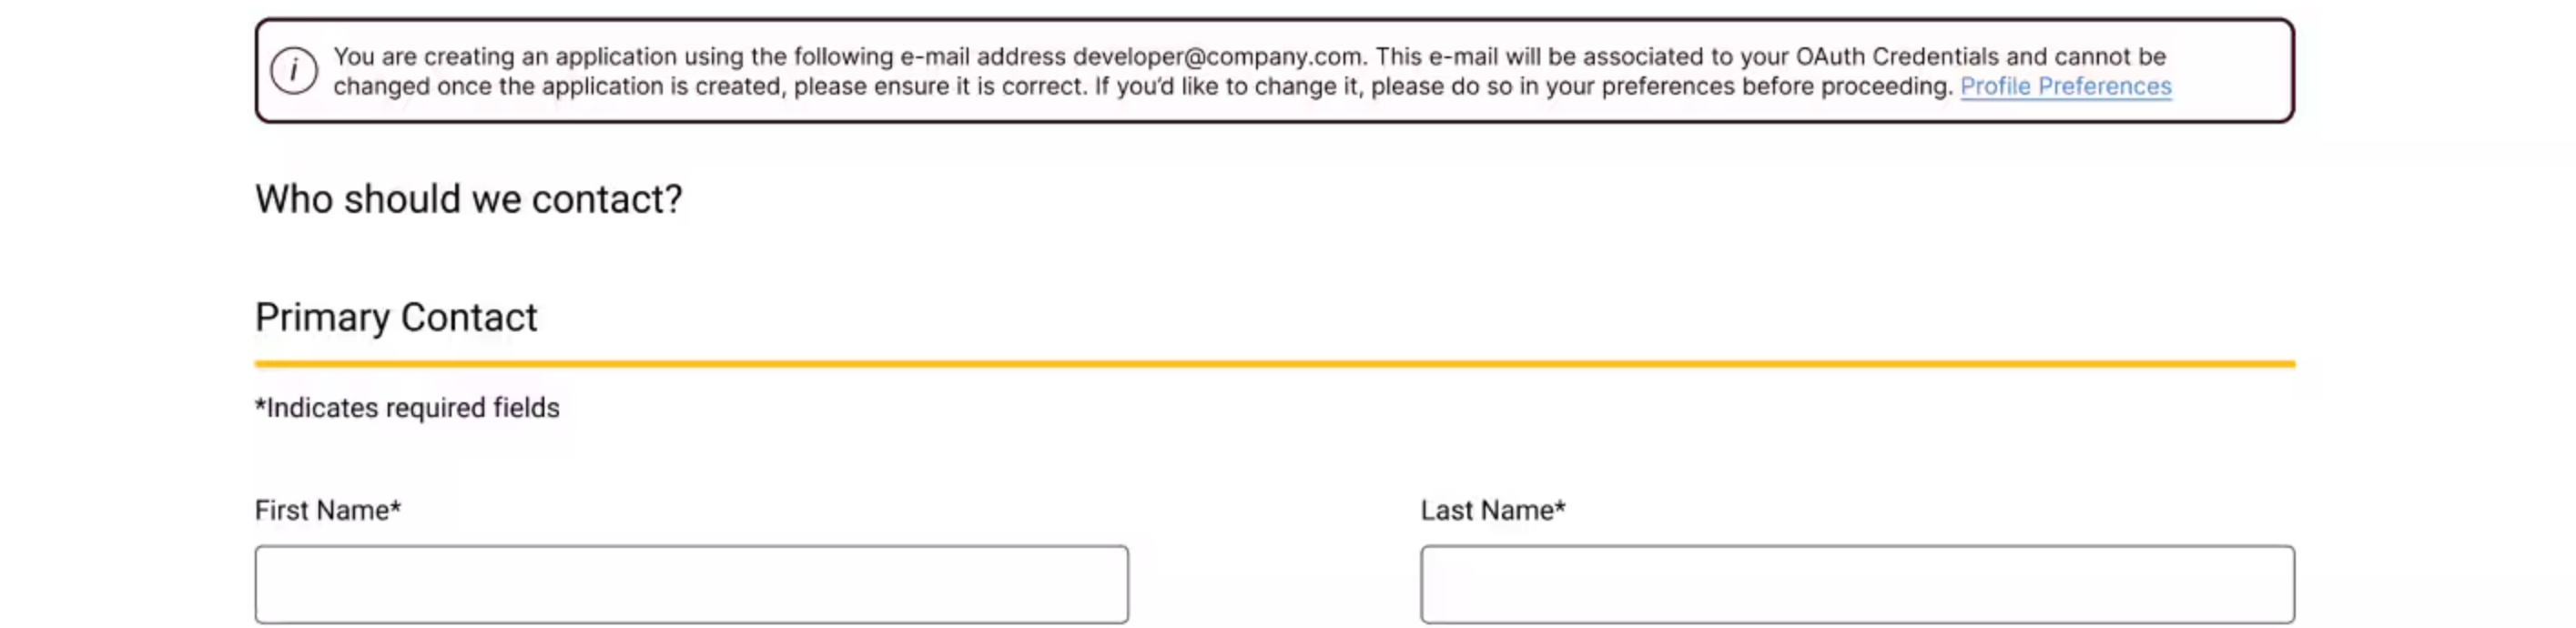
💡 Tip: Consider using a group inbox that is accessible to others on your development team. You are unable to change this email once the credentials are created or you will lose access to your application.
6. Define your application details that includes the name, associated billing account number, and custom products.
⚠️ Note: In the Callback URL field, add the following URL: https://parabola.io/api/steps/generic_api/callback
7. Once saved, your Client ID and Client Secret are generated.
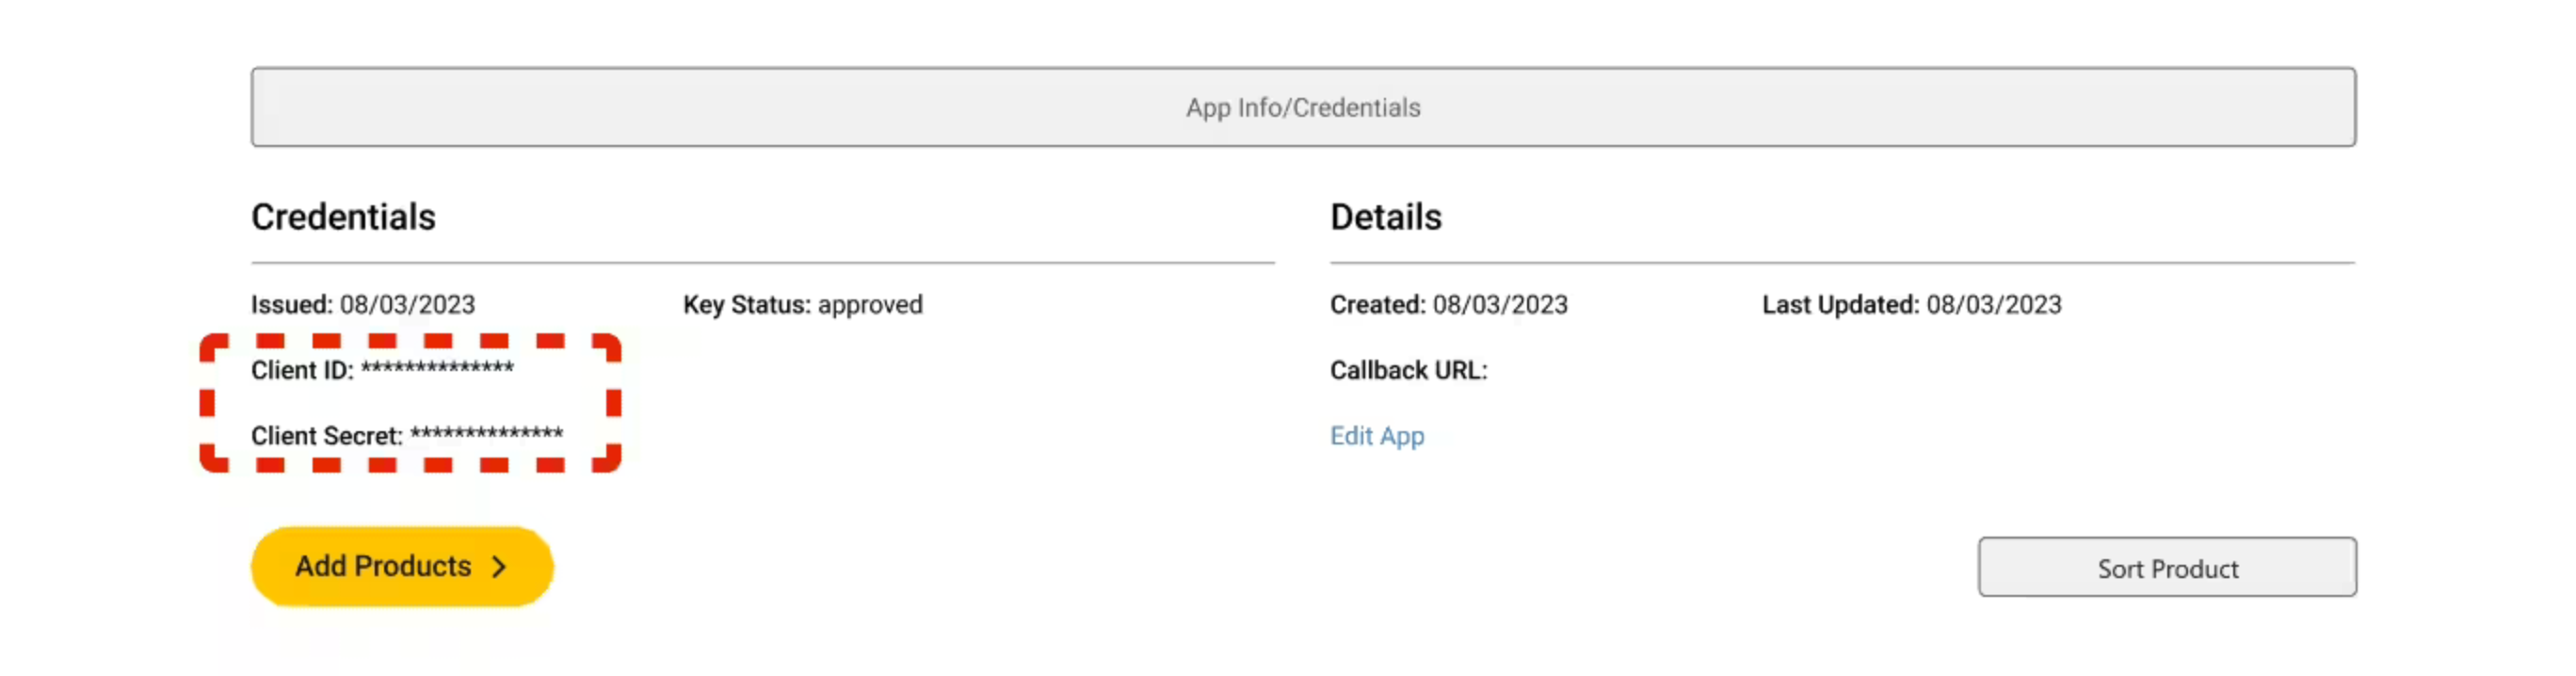
💡 Tip: Click Add Products to enable additional products like the Tracking and Time in Transit APIs if they have not been added to your application.
Available data
Using the UPS TrackService API in Parabola, you can pull in:
- Shipments: Overview of each tracked shipment, including inquiry numbers and user relationships.
- Packages: Details for every package in a shipment, including tracking number, weight, dimensions, and delivery details.
- Activities: Historical scan events with timestamps and locations.
- Status: Current status and simplified text description of the shipment (e.g., “In Transit,” “Delivered”).
- Milestones: Key progress checkpoints for the package’s journey.
- Delivery Information: Delivery confirmation data such as location, proof of delivery, and signature image.
- Addresses: Origin, destination, and delivery addresses for each shipment.
- Payment Information: Collect-on-delivery or other payment records tied to a shipment.
- Service details: The service level used (e.g., “UPS Ground,” “UPS Next Day Air”).
Common use cases
- Real-Time delivery tracking to integrate updates into your applications or websites, allowing businesses to monitor the status of their shipments.
- Reconcile delivery confirmations with order records to mark items as delivered automatically.
- Track and analyze delivery performance by service type, carrier zone, or region.
- Calculate shipping costs for domestic and international shipments in real-time and provide accurate shipping costs to customers at checkout.
- Calculate estimated delivery times for packages based on UPS’s delivery schedules and provide customers accurate delivery windows during checkout.
- Identify delayed or stalled shipments and trigger alerts or workflows.
- Sync shipment milestones (like “Out for Delivery” or “Delivered”) to internal dashboards or CRMs.
Integration:
Visualize
The Visualize step is a destination step used to display data as charts, styled tables, or key metrics. These visualizations can optionally be shown on the Flow canvas or on the Flow dashboard.
Set up
When first added to your Flow and connected to a step, the Visualize step will expand. Data flowing into the Visualize step will be shown as a table on the canvas.
To customize this visualization and create new views, open the Visualize step by clicking "Edit this View."
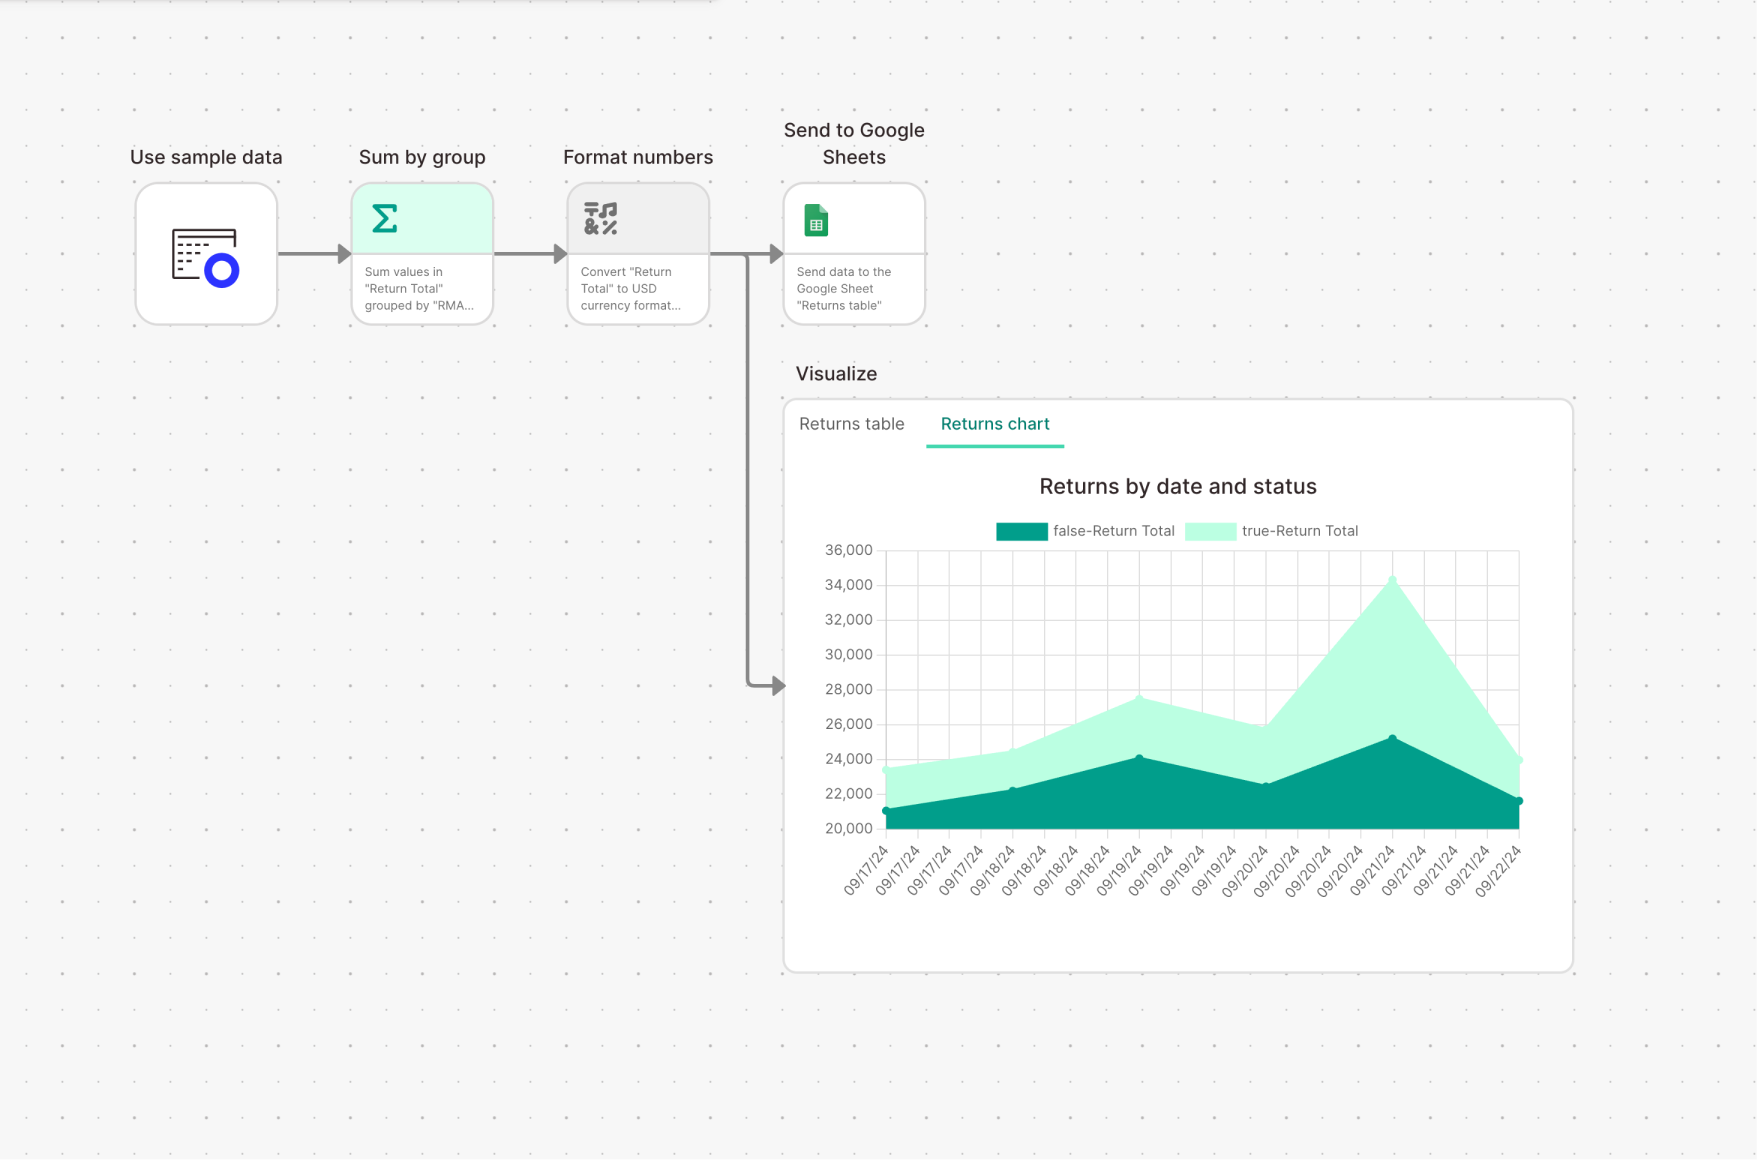
Configuring views
Visualize steps can be configured with any number of views. Every view in a single Visualize step will use the same input data, but each view can be customized to display data in a different way.
Syncing views to the Flow dashboard
The Visualize step is also used to sync views to your Flow dashboard tab. When the “Show on dashboard” step option is enabled, that visualization will also appear in your Flow dashboard.
Views in the Visualize step will be shown on your Flow dashboard by default. Uncheck the dashboard setting within the Visualize step to remove any views from the dashboard.
Resizing, expanding and collapsing
Visualize steps can be collapsed into normal-sized steps by clicking the collapse button, located in the top right of the expanded visualization. Similarly, collapsed Visualize steps can be expanded by clicking on the expand button under the step.
Expanded Visualize steps can be resized using the handle in the bottom right of the step.
Flow dashboards enable your team to easily view, share, and analyze the data that your Flows create. Use the Visualize step to create interactive reports that are shareable with your entire team. Visualizations can be powered by any step in your Flow or by Parabola Tables for historic reporting.
Check out this Parabola University video for a brief intro to tables.
How it works
The Visualize step is a tool for creating tables, charts, and metrics from the output of your Flows. These views of data can be arranged and shared directly in Parabola from the Flow dashboard page.
To create a Visualization, connect any step in your flow to a Visualize step:
Data connected to a Visualize step will be usable to create any number of views. Those views are automatically added to your Flow dashboard, where they can be arranged and customized.
Once you’ve added views to your Flow dashboard, you can:
- Visualize your data in the form of tables, featured metrics, charts, and graphs.
- Arrange a dashboard of multiple views, utilizing a tabbed or tiled layout.
- Analyze the entire page of views using quick filters.
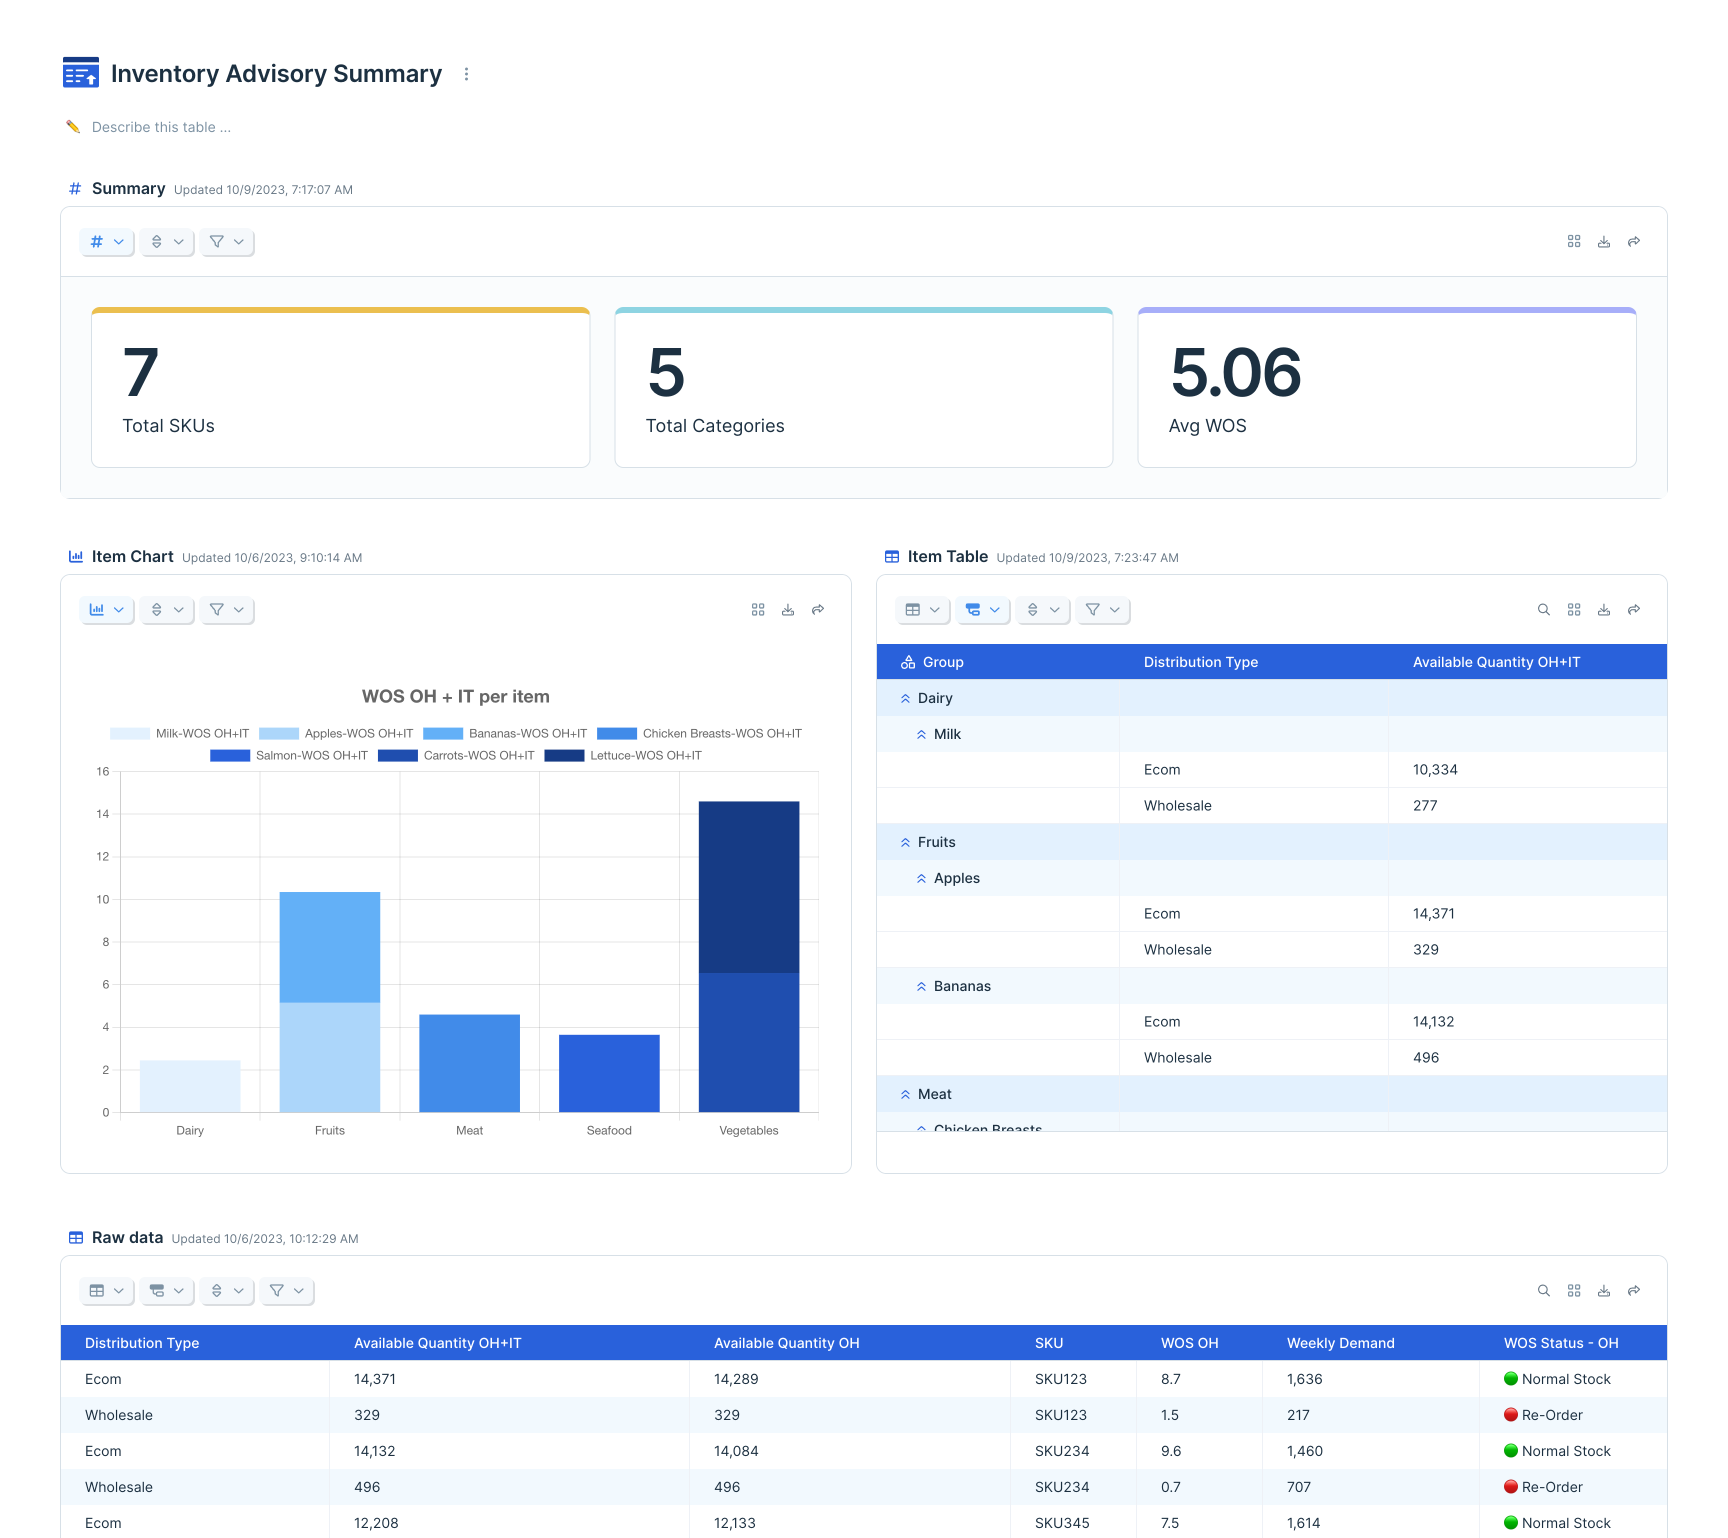
Sharing tables with teammates
Anyone with access to your Flow will be able to see the Flow dashboard:
- "Can edit": any teammate with edit permissions can create and edit data views. Any changes to views will be visible immediately to anyone else who has access to the Flow.
- "Can view": teammates with view permissions can see all data views, but cannot make changes.
To share a view, you can either share the entire dashboard with your teammate (see instructions here), or click “Share” from a specific table view. Sharing the view will give your teammate access to the Flow (and it’s dashboard), and link them directly to that specific view.
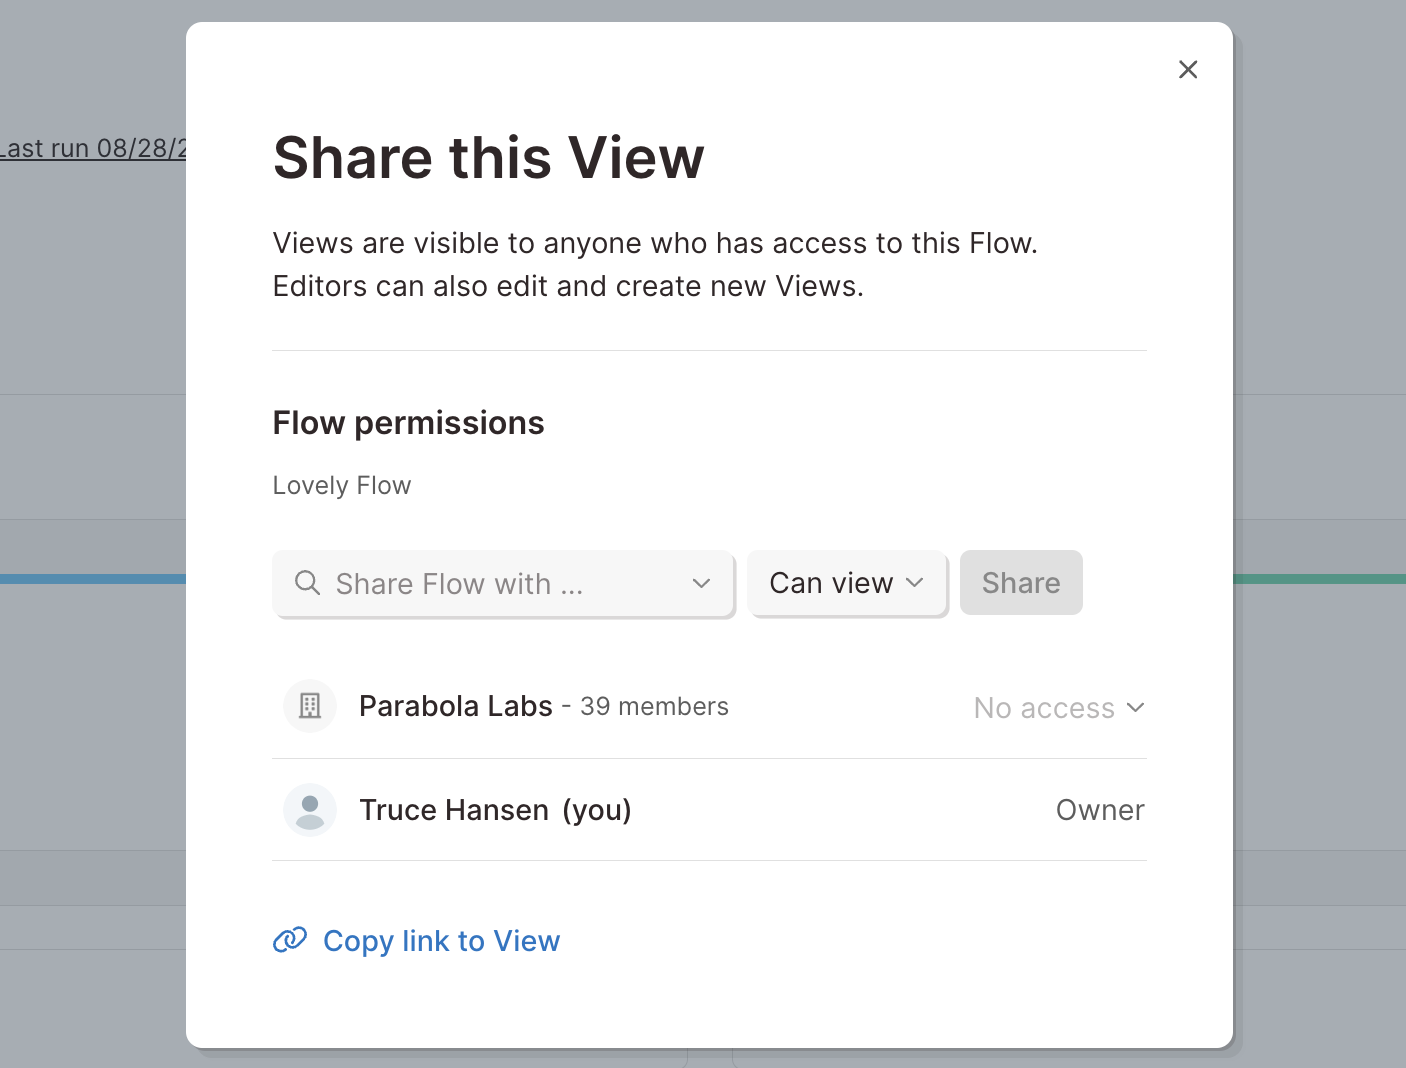
Sharing dashboards outside your team (external sharing)
Any visualization can be exported as a CSV. Simply click on the "Export to CSV" button at the top right of your table or chart.
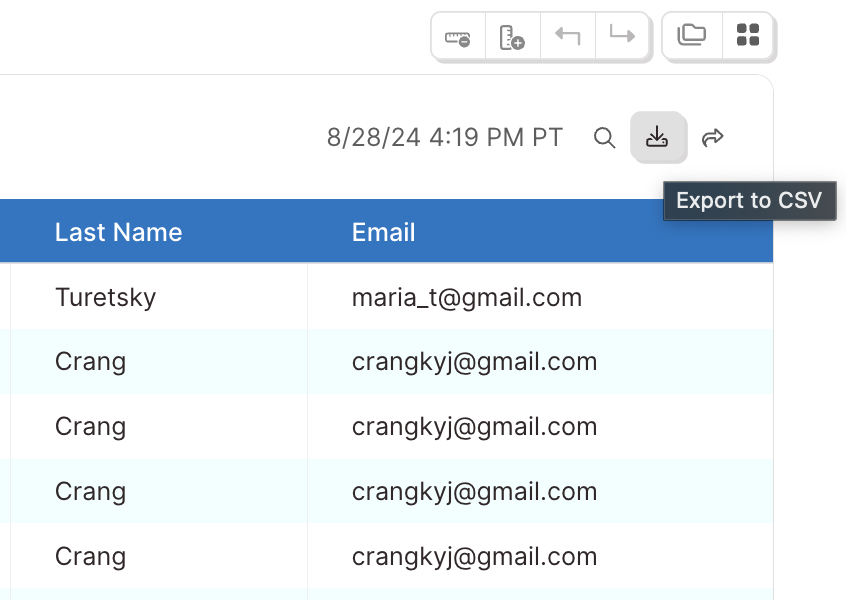
Views are individual visualizations, accessible from the Visualize step, or on the Flow dashboard. The data connected to a Visualize step acts as a base dataset, which you can customize using views. Views can be visualized as tables, featured metrics, charts, and graphs.
Ready for a deeper dive? This Parabola University video will walk you through some of the configurations available to fine-tune how you see your data.
Page layout
Arrange data views on the page with either a tab or tile layout.
Tabs will appear like traditional spreadsheet tabs, which you can navigate through. Drag to rearrange their order.
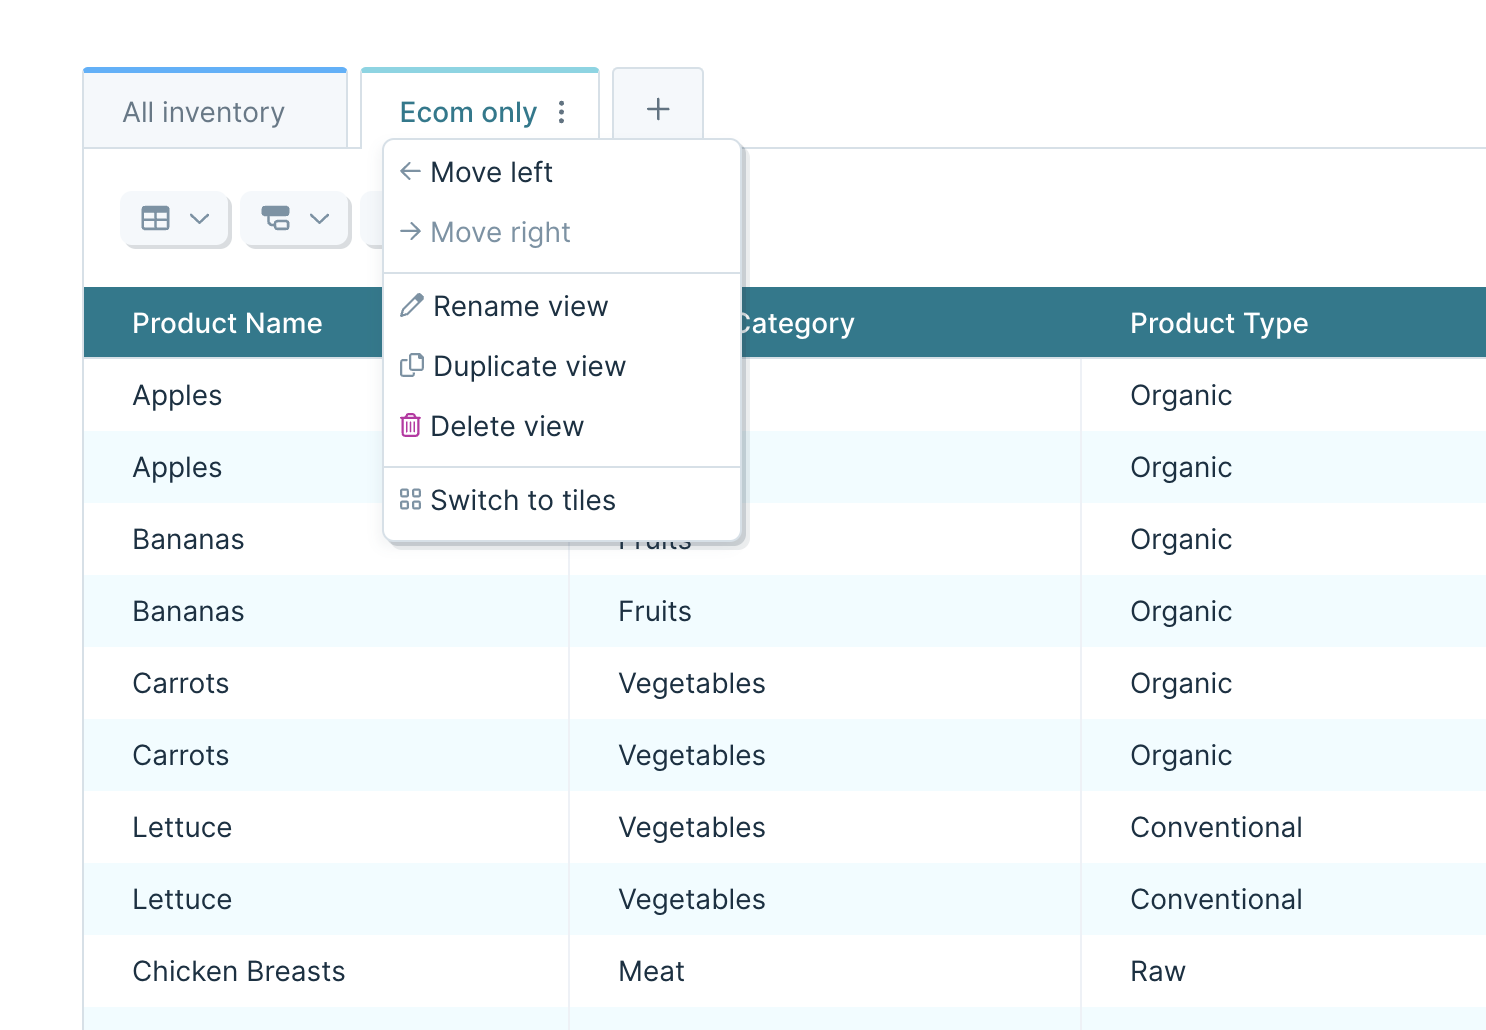
Tiles enable you to see all views simultaneously. You can completely customize the page by changing view height and width, and drag-and-drop to rearrange.
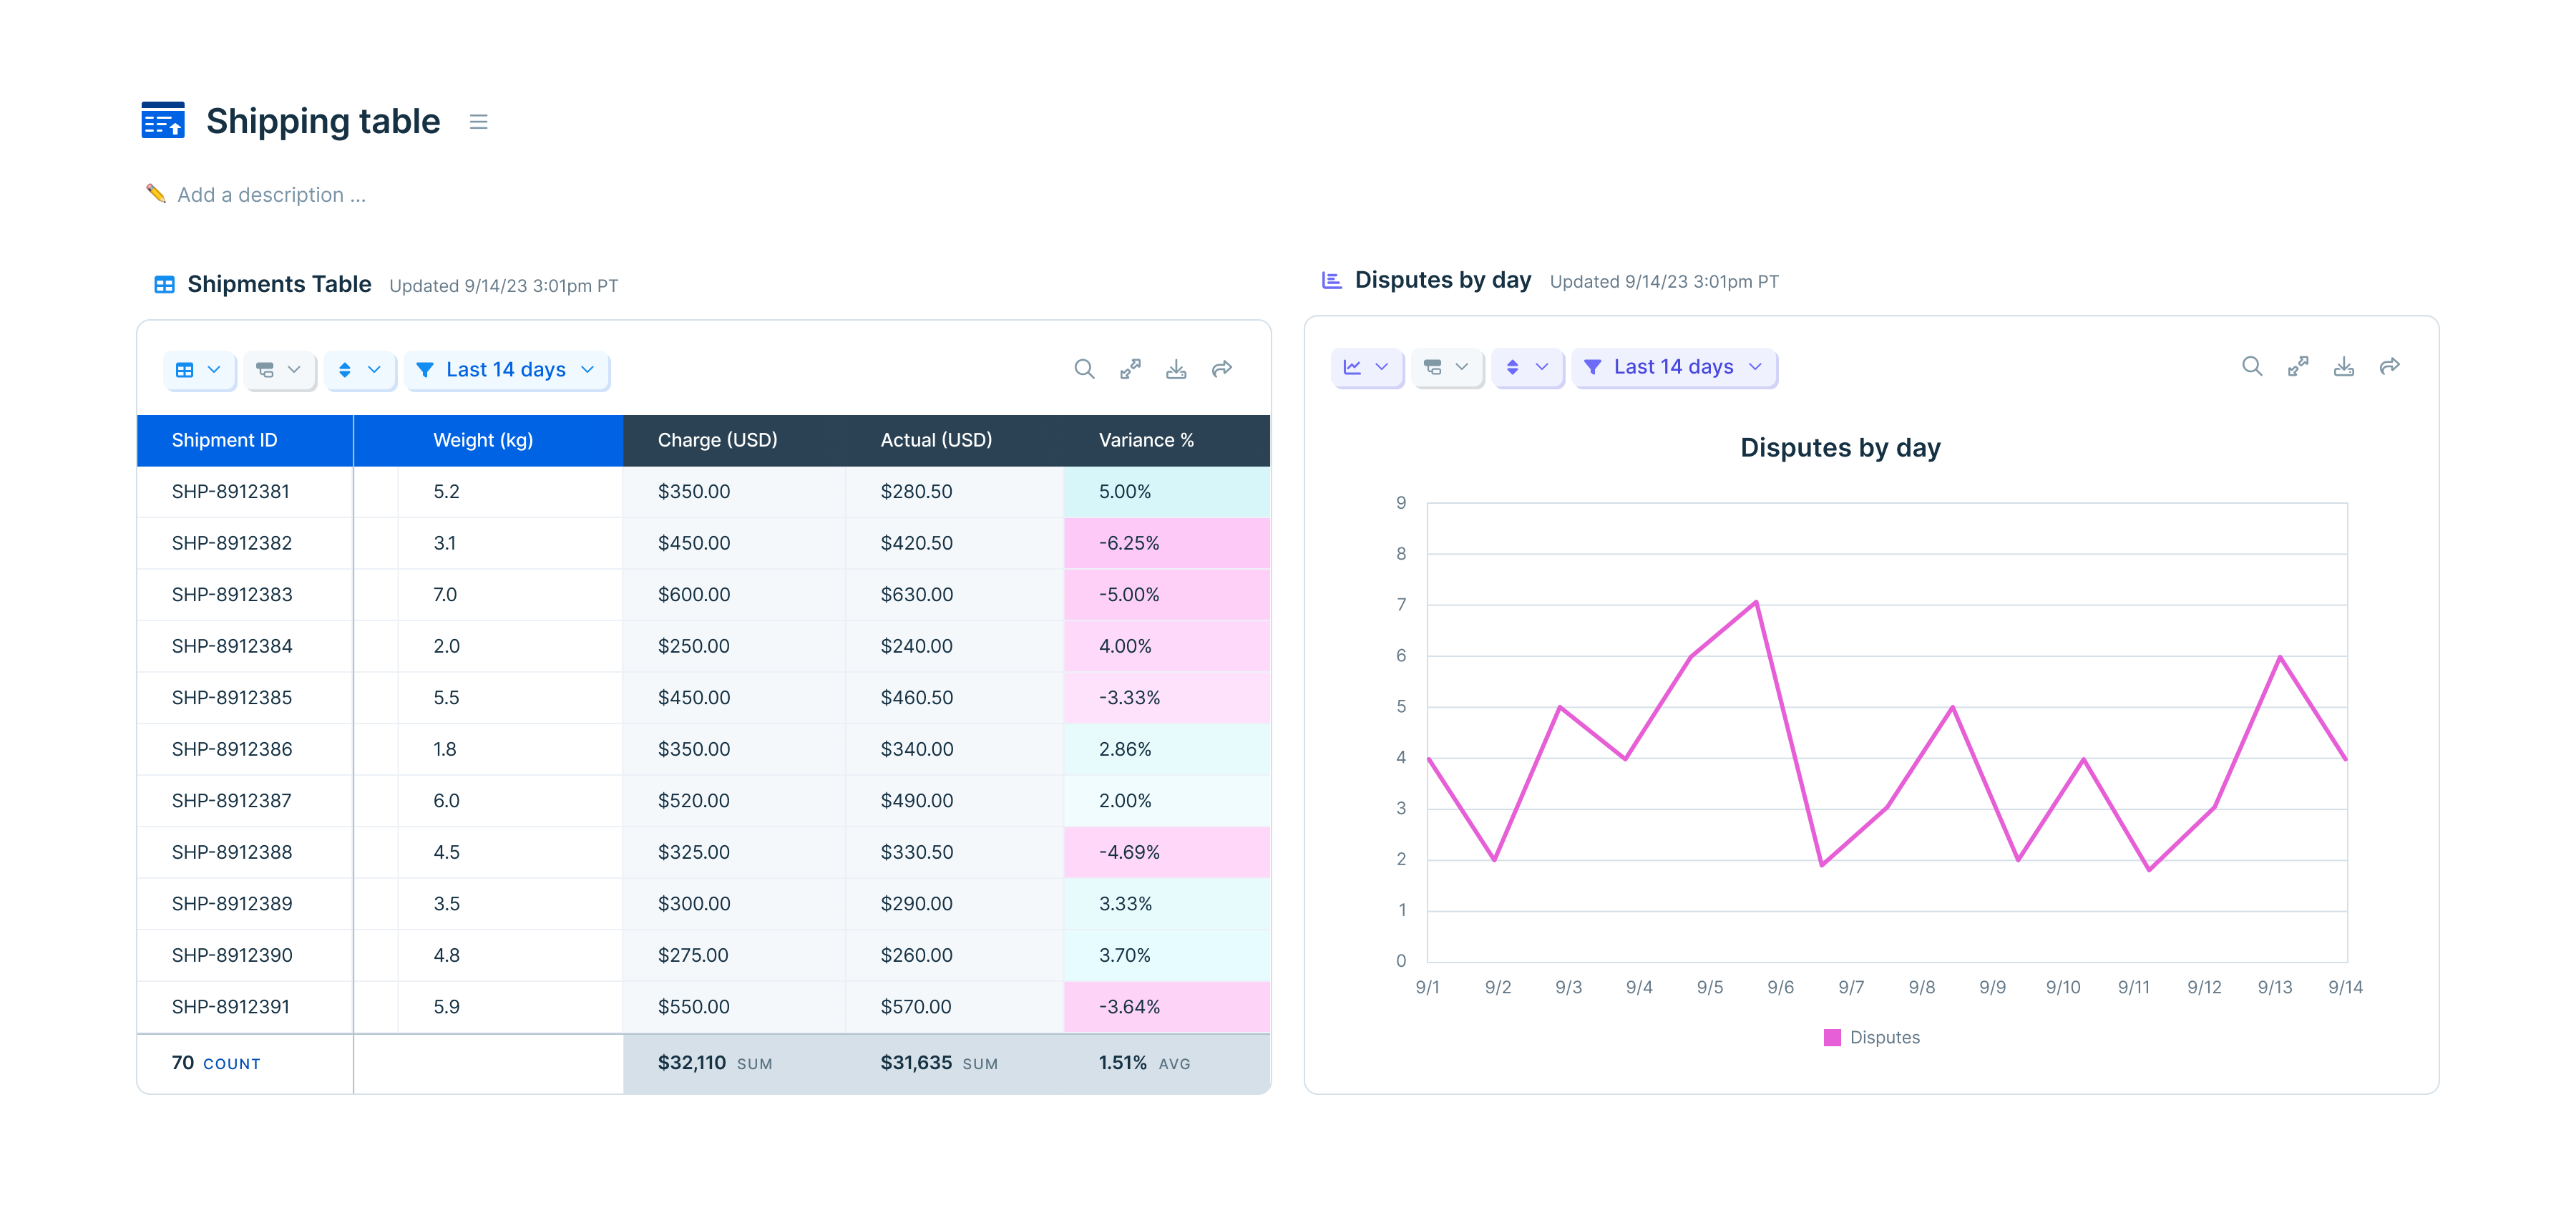
Helpful tips:
- Views will refresh their results if: the Flow runs, the base data is updated, and/or settings are changed
- Click the overflow menu next to the name of a view to move, rename, duplicate, or delete it. Use the same menu to switch the page layout between tabs and tiles
- Add new views by clicking the plus icon to the right of the last tab view, or by clicking the large “Add view” button below the last tile view. If you have too many tab views to see the icon, use the tab list menu on the right side of the table
- Duplicated and new tab views will show up in the private views section, so you may need to scroll down to see your new view
From the “Table/chart options” menu, you can select from several types of visualizations.
Tables
By default, visualizations display as tables. This format works well to show rows of data that are styled, calculated, grouped, sorted, or filtered.
In the below image, the table options menu is at the top left, below the "All Inventory" tab. This is where you can access options to format and style columns, or to add aggregation calculations.
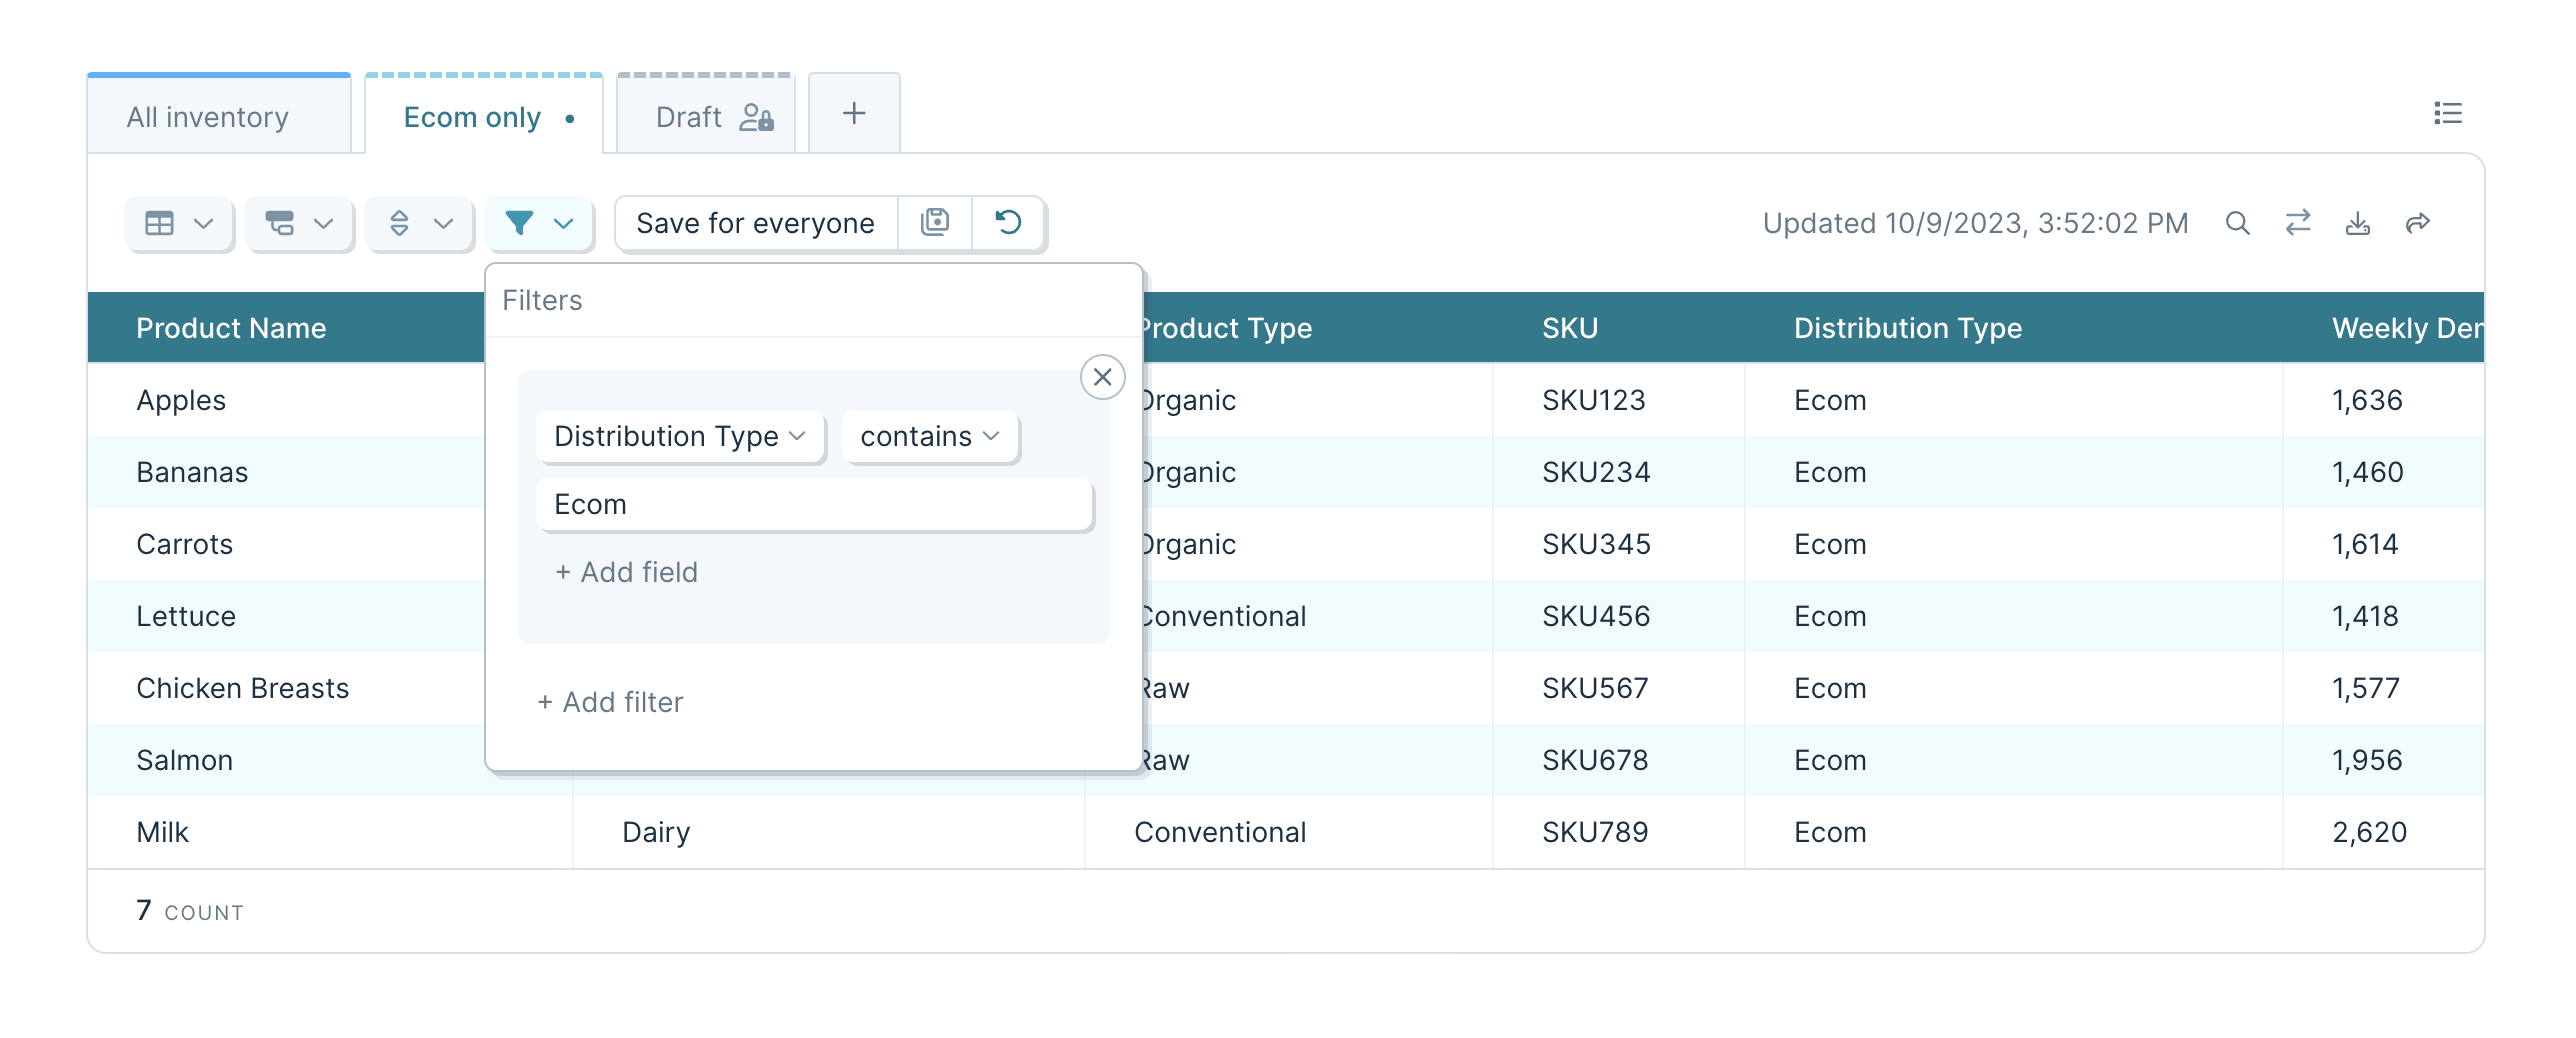
Featured metrics
Featured metrics allow you to display specific column calculations from the underlying table.
Metrics can be renamed, given a color theme, and formatted (date, number, percent, currency, or accounting). The metrics options menu is in the same placement as above, represented with a '#' symbol.
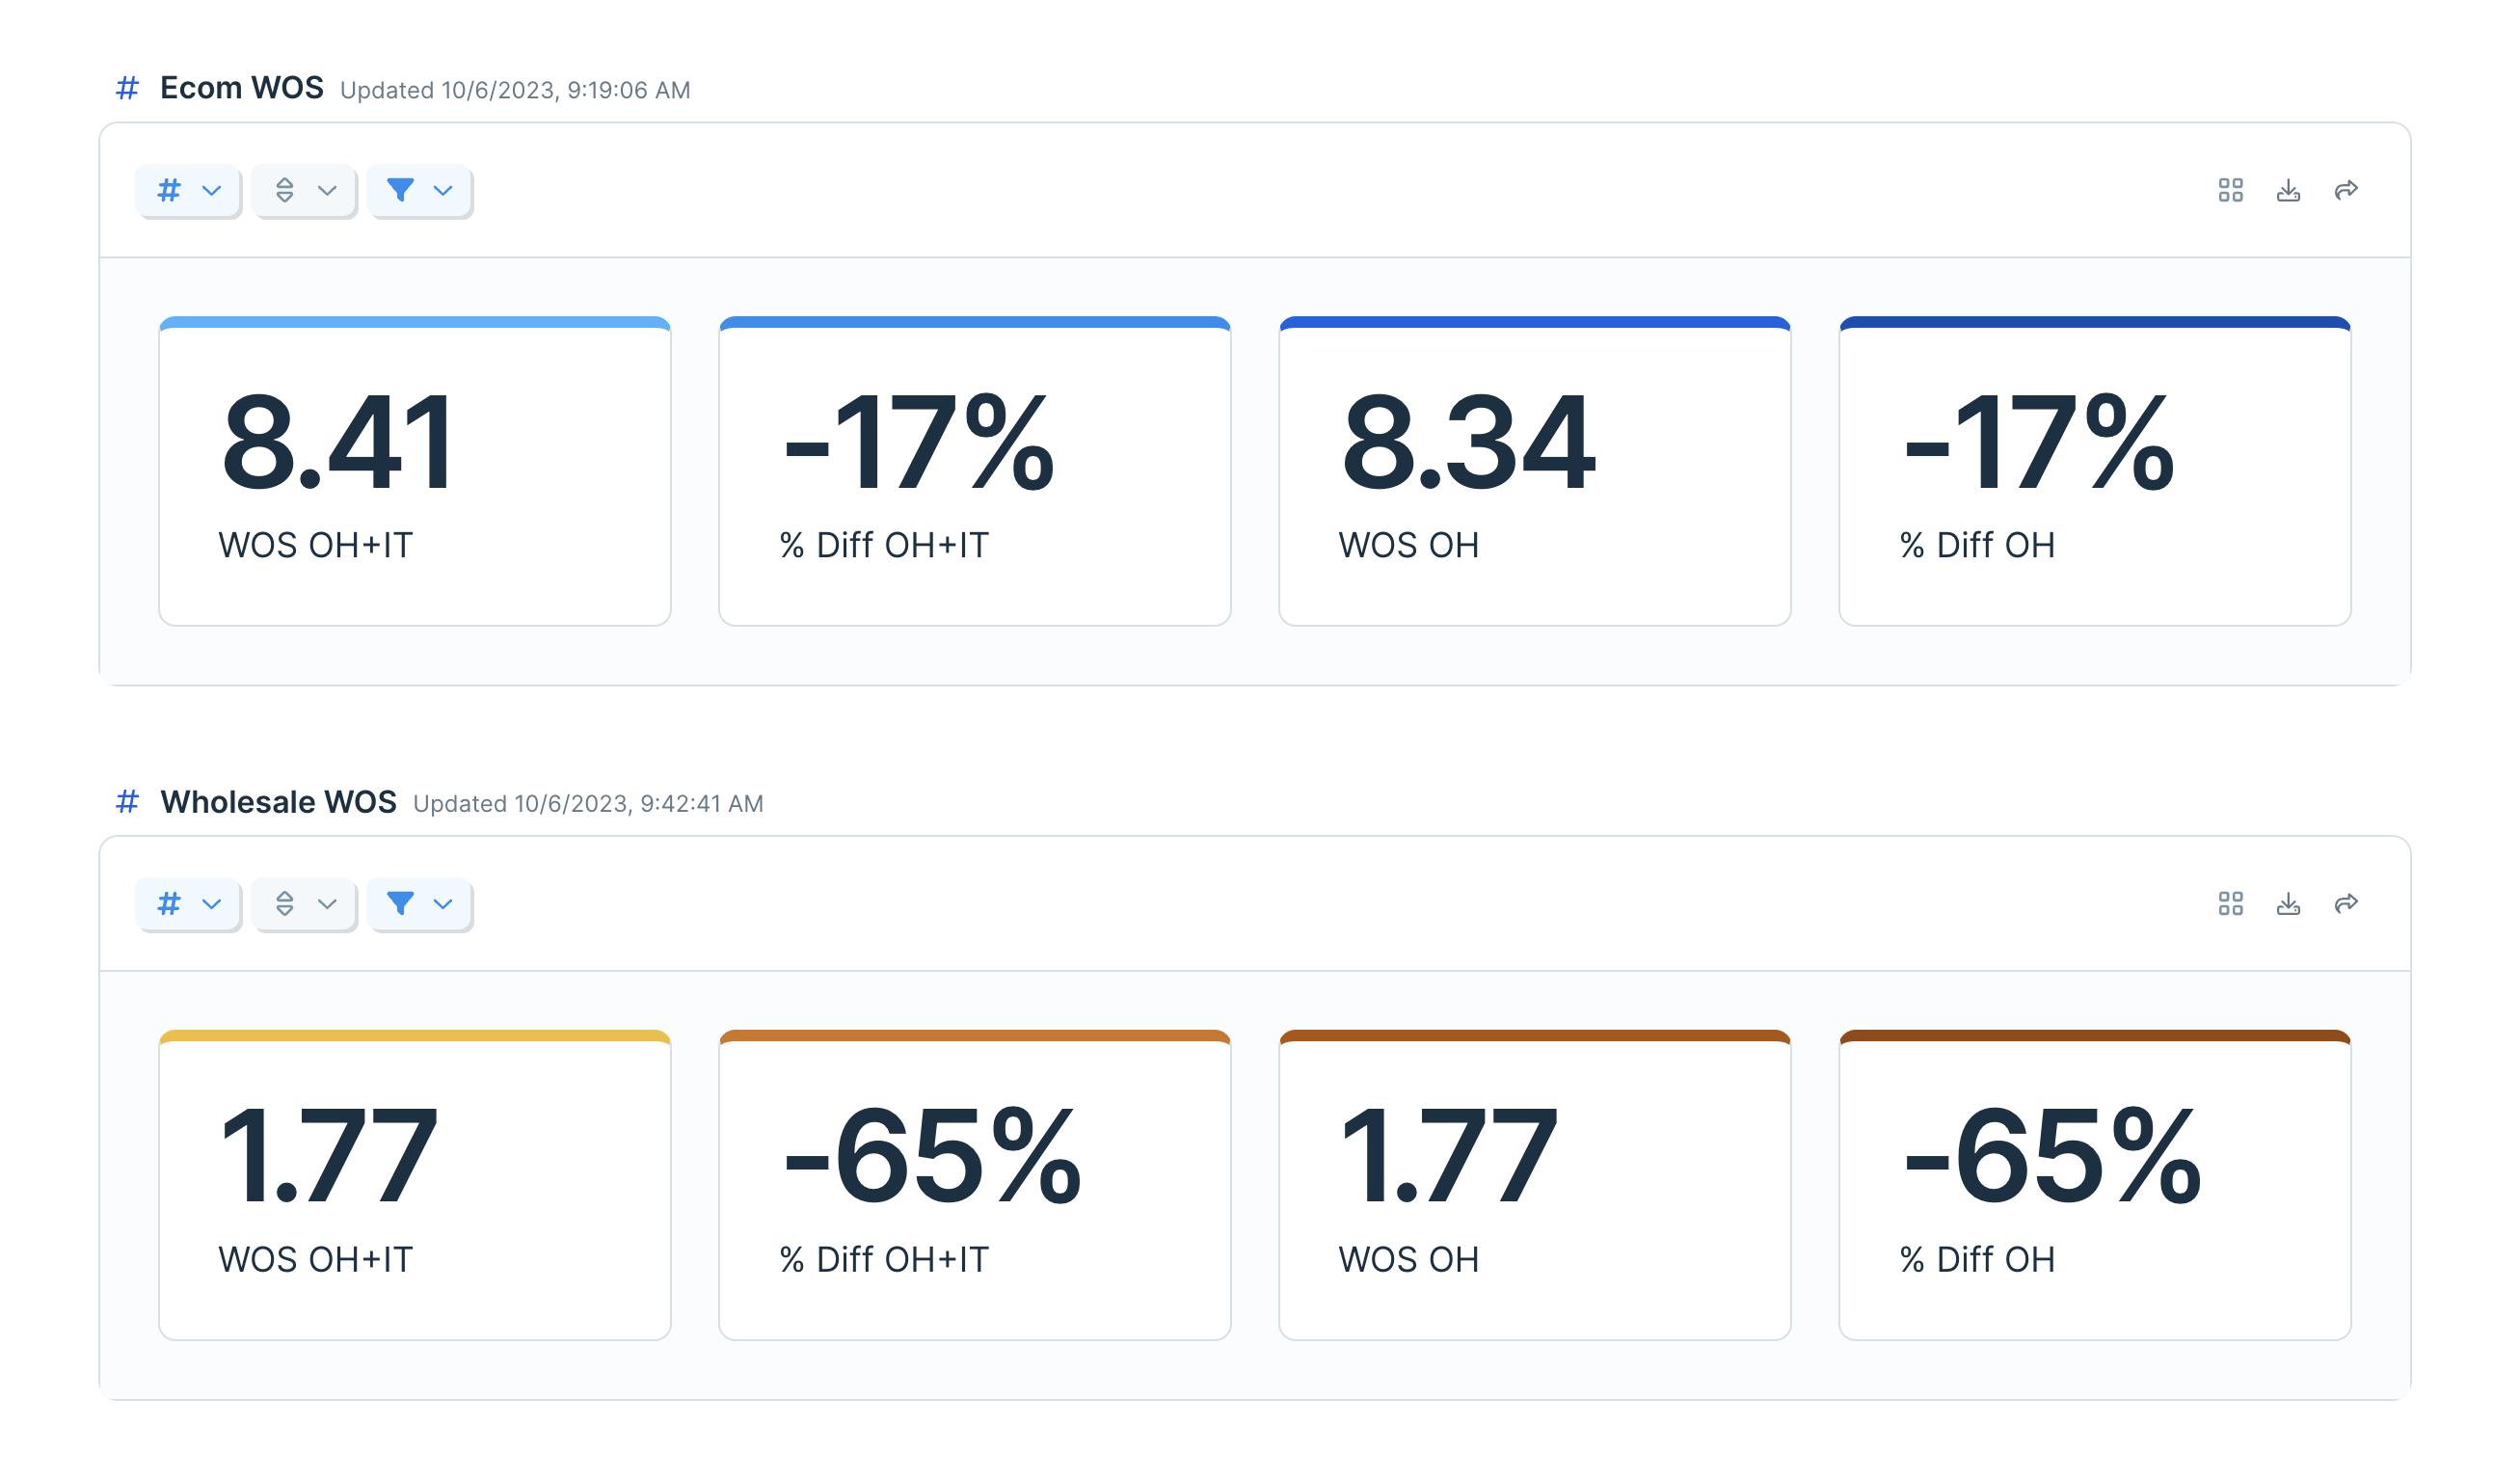
Charts and graphs
Parabola supports several chart types:
- Column chart
- Line chart
- Area chart
- Scatter chart
- Mixed chart (multiple types combined)
Within the chart options menu, represented below as a mini bar graph, you can customize chart labels, color themes, gridlines, and legend placement.
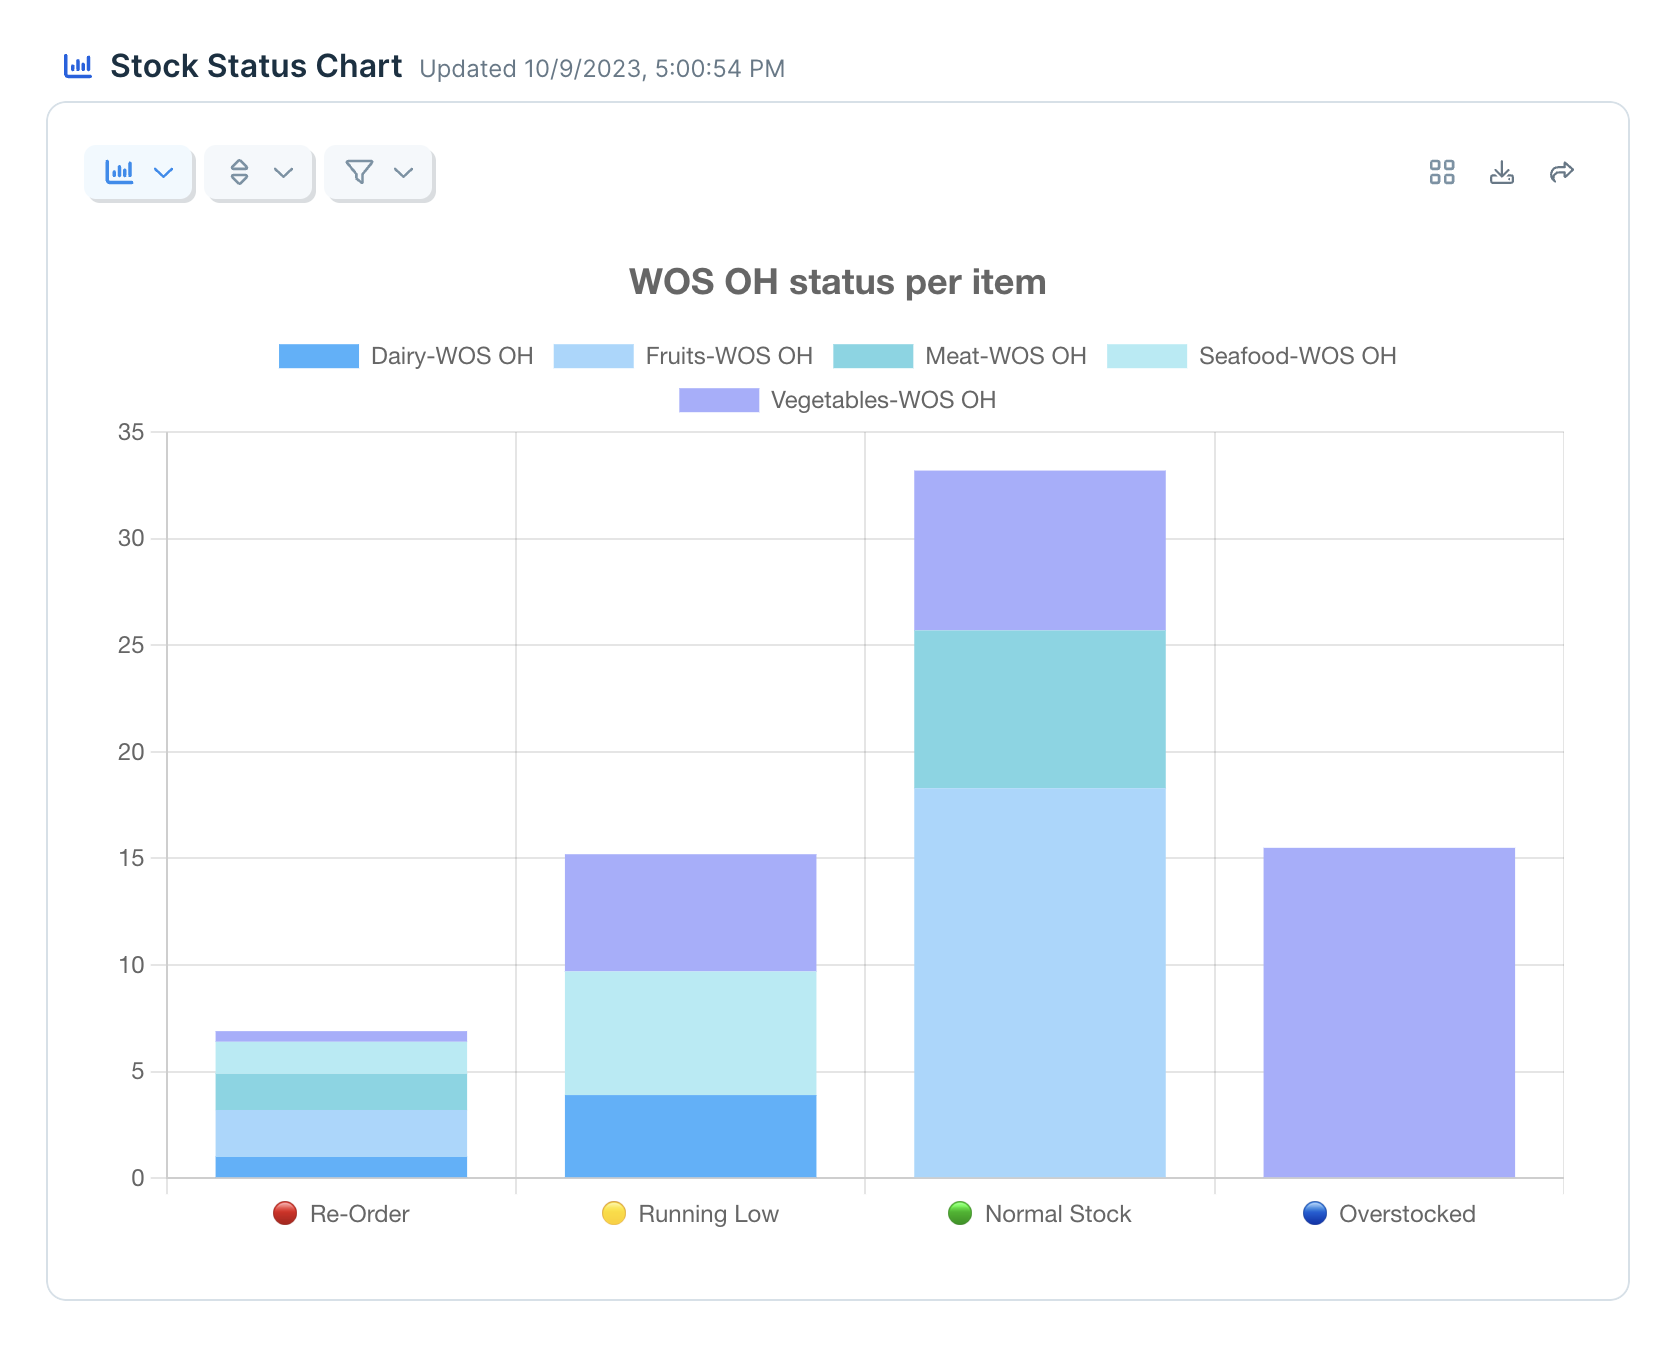
X axis
Charts have a single value plotted on the horizontal X axis, along the bottom of the chart. Date or category values are commonly used for the X axis
Use the grouping option on the X axis control to aggregate values plotted in the chart. For example, if you have a week's worth of transactions, and you want to see the total number of transactions per day, you would set your X axis to the day of the week, and group your data to find the sum. Ungrouped values will be plotted exactly as they appear in your dataset.
Use the X axis options dropdown within the chart options menu to further fine-tune your formatting.
Y axis
Charts can have up to two Y axes, on the left, right, or both. Additionally, each Y axis can key to any number of data values, called series.
Adding multiple series will show multiple bars, lines, or dots, depending on which chart you are using. The above image shows a chart using one Y axis, but several series with stacking enabled under the "Categories / stacking" dropdown.
When you add a second Y axis, it will add a scale to the right side of the graph. Any series that are plotted in the second Y axis will adhere to that scale, whereas any series on the first Y axis will adhere to the first scale. Your charts are limited to two scales, but each series can be aggregated individually, so you can compare the mean of one data point with the sum of another, and the median of a third.
Imagine using multiple Y axes to plot two sets of data that are related, but exist on different numerical scales, such as total revenue in one axis, and website conversion rate in another axis.
Categories and stacking
Many charts and graphs have category and stacking options. Depending on your previous selections with the X and Y axes, and the chart type, some options will be available in this menu.
- “Categorize by …” will allow you to further split a Y axis value according to a subcategory that exists in your dataset. For example, you could categorize total revenue by store location to see a bar of total revenue for each store location.
- The “Categorize and stack by …” option will function as above, and further stack your subcategories into a single bar – i.e. producing an overall column showing the total revenue, but with different colored segments for each store location.
- The “Stack series” option will take multiple series on the X axis and stack them into a single bar, so that you can aggregate multiple columns together.
Helpful tips
- Add a title to charts and graphs from the “Table/chart options” menu
- Clicking on an item in the legend will temporarily hide the series on the graph. Click again to make it reappear
- All charts and graphs will export as CSV files that mirror the base table data
View controls can be selected from the icons in the control bar on any view.
Column calculations
You can perform the following calculations on a column:
- Count all: Counts the number or rows in the entire table, and for any groups
- Count unique: Counts the number of unique values in the specified column for the entire table, and for any groups. Unique values are case-sensitive and space-sensitive
- Count empty: Counts the number of blank cells in the specified column for the entire table, and for any groups. Cells with just a space character, or other invisible characters, are not considered empty or blank
- Count not empty
- Sum: Totals all numeric values in the specified column for the entire table, and for any groups. Cells that are blank or contain non-numeric values are skipped. If no result can be produced, a - - value will be shown
- Average: Creates an average by totaling all numeric values in the specified column for the entire table, and for any groups, and dividing the total by the total number of values used. Cells that are blank or contain non-numeric values are skipped. If no result can be produced, a - - value will be shown
- Median: Finds the value where one half the values are greater and half are less in the specified column for the entire table, and for any groups. Cells that are blank or contain non-numeric values are skipped. If no result can be produced, a - - value will be shown
- Minimum (Min): Finds the smallest value in the specified column for the entire table, and for any groups. Cells that are blank or contain non-numeric values are skipped. If no result can be produced, a - - value will be shown
- Maximum (Max): Finds the largest value in the specified column for the entire table, and for any groups. Cells that are blank or contain non-numeric values are skipped. If no result can be produced, a - - value will be shown
Only one metric can be calculated per column.
Grouping
Tables can be grouped up to 6 times. (After 6 groups, the '+ Add grouping' option will be disabled.) Groups are applied in a nested order, starting at the first group, and creating subgroups with each subsequent rule.
Use the sort options within the group rules to determine what order the groups are shown in. Normal sort rules will be used to sort the rows within the groups.
Sorts
Click the “Sort” button to quickly add a new sort rule (or the view options menu). These sorts define how rows are arranged in the view.
Filters
Click the “Filter” button to quickly add a new filter rule (or the view options menu). These filters define which rows are kept in the view.
Filters work with dates – select the “Filter dates to…” option, and utilize either relative ranges (e.g. “Last 7 days”) or specify exact ones.
Data formatting
Columns, metrics, and axes can be formatted to change how their data is displayed and interpreted. Click the left-most of your configuration buttons, the "Table/Chart Options" button, to apply formatting to any column, metric, or axis. You can select auto-format, or choose from a list of categories and formats within those categories.
In charts, the X-axis will be auto-formatted, and you can change the format as needed. All series in each Y-axis will share the same format. Axis formatting can be adjusted by clicking the gear icon next to the axis name.
Formats will be used to adjust how data is displayed in the columns of a table, in the aggregations applied to groups and in the grand total row, and to featured metrics. When grouping a formatted column, the underlying, unformatted value will be used to determine which row goes in which group.
When working with dates, the format is autodetected by default. If your date is not successfully detected, click the 3 dots next to the output format field and enter a custom starting format.
.png)
Valid options are:
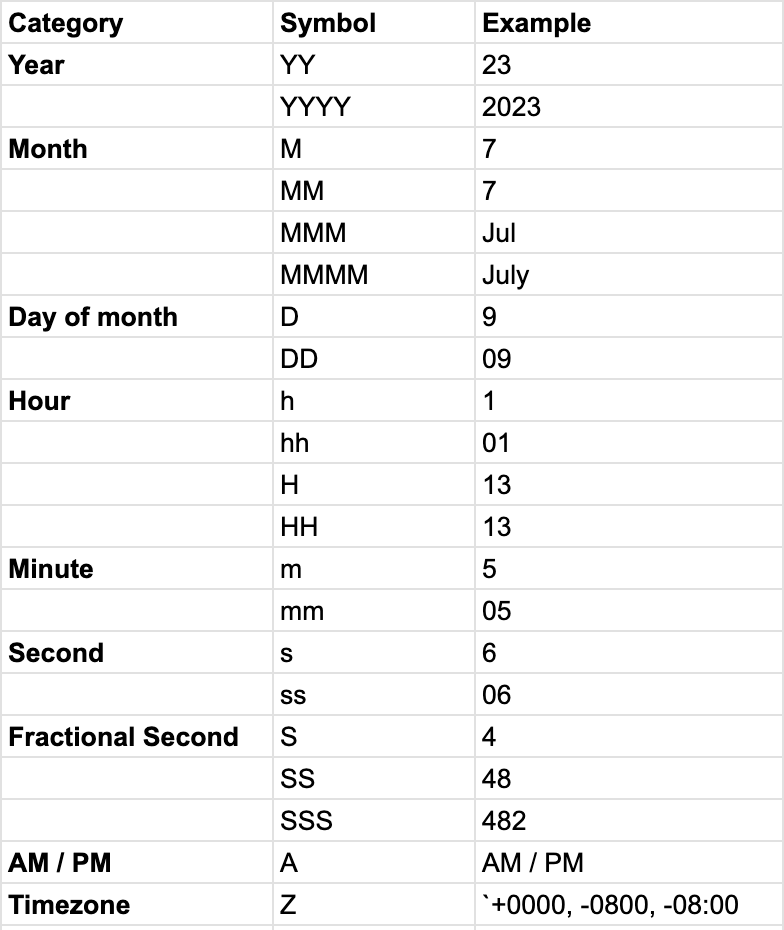
If the output format uses a token that is not found in the input , e.g. converting MM-DD to MM-DD-YYYY, then certain values will be assumed:
- Day - 1
- Month - January
- Year - 2000
Dates that do not adhere to the starting format will remain unformatted in your table.
Hiding Columns
Use the "Table/Chart Options" to hide specific columns from your table view.
Columns can be used for sorting, grouping, and filtering even when hidden. Those settings are applied before the columns are hidden for even more control over your final Table.
Hidden columns will not show up in search results, unless the option for “Display all columns” is enabled.
Hidden columns can be filtered by quick filters.
Hidden columns will be present in CSV exports downloaded from the view.
Freezing Columns and Rows
Use the "Table/Chart Options" to freeze the first (left-most) column or the first row by using the checkboxes at the top. A frozen column or row will “stick,” and other columns and rows will scroll behind them.
Quick filters
Click "Quick Filter" in the top right corner of the dashboard to toggle the filter bar pictured below. Using "Add quick filter" or "Add date filter," you can filter data in specific columns across every view on the page. These filters are only applied for you, and will not affect how other users see this Flow. Refreshing the page will reset all quick filters.
After 8 seconds, the combination of quick filters will be saved in the “Recents” drawer on the right side of the filter bar. Your recent filters are only visible to you, and can be reapplied with a click.
Quick filters can only be used if you have at least one table on your Flow. Above the first table on your published Flow page, click to add a filter. The filter bar will then follow you as you scroll.
Multiple quick filters are combined using a logical “and” statement. These filters are applied in conjunction with any filters set on individual views.
Use the clear filters icon to remove all currently applied filters.
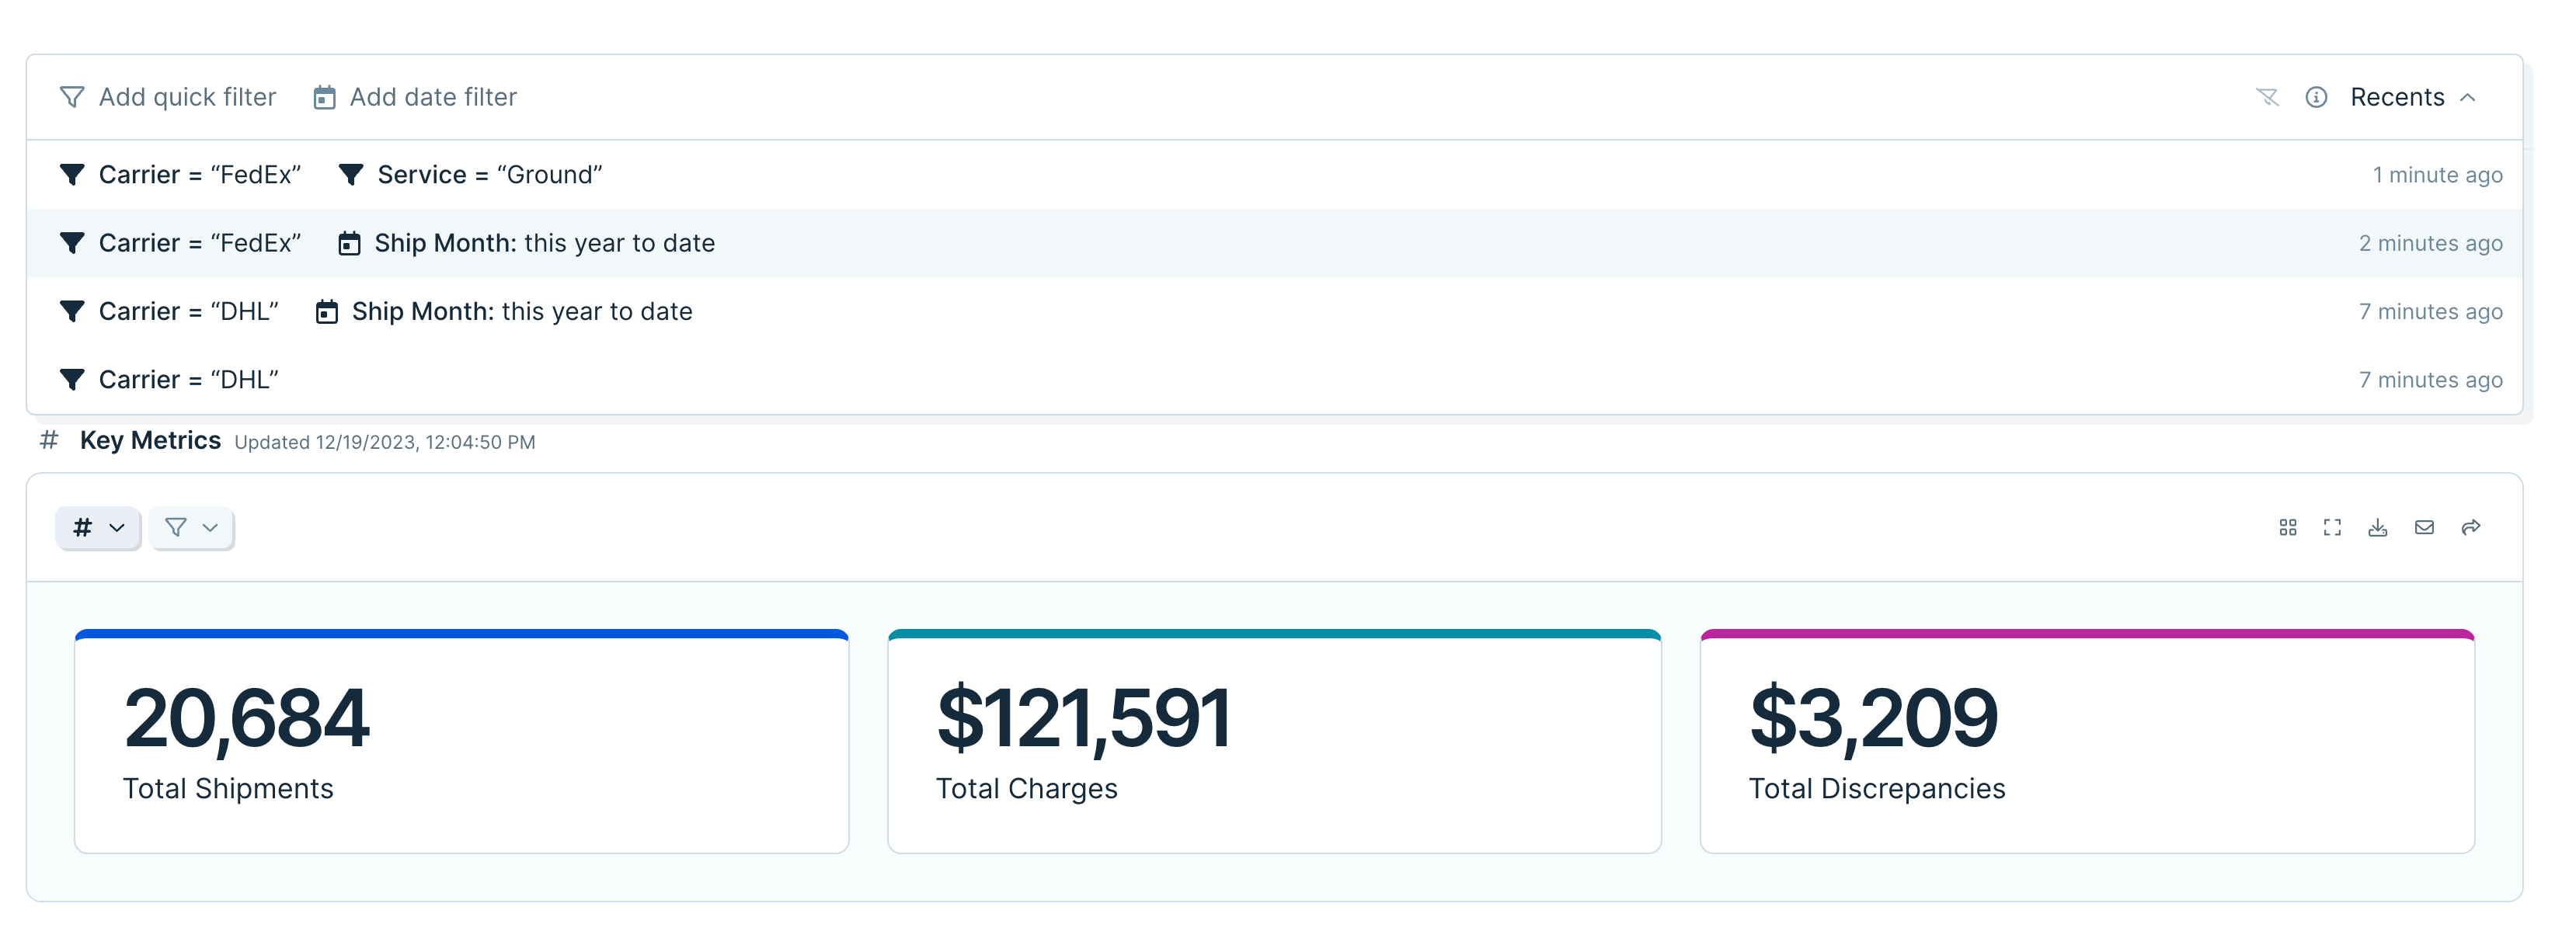
Conditional formatting
From the Table Options menu, use the “add color rule” button to apply formatting to the columns of your Table view.
.png)
There are 3 types of formatting that can be added:
- Set color
- Color rule
- Color scale
(The same menu can be used to remove any existing colors applied to a column.)
.png)
Set color
Applies a chosen color to a column entirely. All cells will have a color applied.
Color rule
Uses a conditional rule to color specific cells. The following operators are supported:
.png)
Color scale
Applies a 2 color or 3 color scale to every cell in the column. All cells will have a color applied.
When using two colors, by default the first color will be applied to the minimum value and the second color will be applied to the maximum value. When using three colors, by default, the middle color will be applied to the value 50% between the smallest and largest value in the column.
Cells with values between the minimum, maximum, and middle value (if using 3 colors) will blend the colors they are between, creating a smooth gradient.
When setting a custom value for the maximum or minimum on a color scale, any value in the table that is larger than the maximum or smaller than the minimum will have the the maximum color or minimum color applied, respectively.
Click the ellipsis menu next to the format dropdown to access controls to adjust how the scale is applied.
.png)
Switch each breakpoint to use a number, percent, or the default min/max value.
Scales can be applied to columns containing dates, numbers, currency, etc.
Applying multiple rules
Multiple rules can be applied to the same column. They will be evaluated top down, starting with the first rule. Any cells that are not colored as a result of that rule move on to the next rule, until all rules have been evaluated, or all cells have been assigned a color. A cell will show the color of the first rule that evaluates to true for the value in that cell.
After a set color or color scale is applied, no further rules will be evaluated, as all cells will have an assigned color after those rules.
Migration from “Column Emphasis”
Existing table views may have columns with column emphasis applied. Those columns will be migrated automatically to use a set color formatting rule.
Integration:
Walmart
The Walmart API is used to programmatically interact with Walmart's platform and provides access to various Walmart services including order managements, inventory and stock levels, product data, and customer insights.
Walmart is a beta integrations which requires a slightly more involved setup process than our native integrations. Following the guidance in this document should help even those without technical experience to pull data from Walmart. If you run into any questions, shoot our team an email at support@parabola.io.
Use Cases
🤝 Walmart | Integration configuration
📖 Walmart API Reference:
https://developer.walmart.com/home/us-mp/
🔐 Walmart Authentication Documentation
https://developer.walmart.com/doc/us/us-mp/us-mp-auth/
Instructions
1. Navigate to the Walmart Developer Portal.
2. Click My Account to log into your Marketplace.

3. Click Add New Key For A Solution Provider to set permissions for the provider to generate a Client ID and Client Secret.
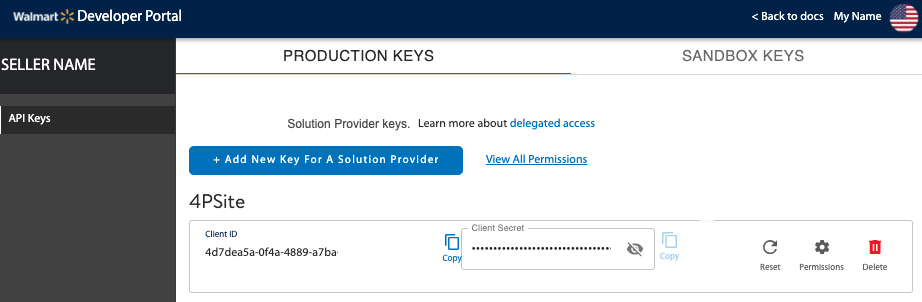
💡 Tip: Use Production Keys to connect to live production data in Parabola. Use Sandbox Keys to review the request and response formats using mock data.
4. Select the Solution Provider from the drop-down list.
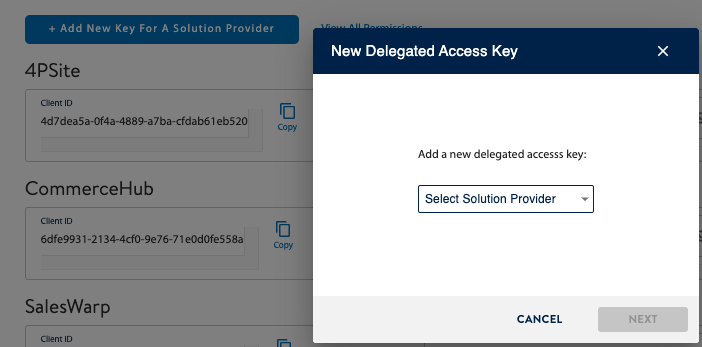
⚠️ Note: If your Solution Provider is not listed, contact Walmart. You need to have a contract with Walmart before you can delegate access to a Solution Provider.
5. Specify specific permissions, or to take the defaults, click Submit.
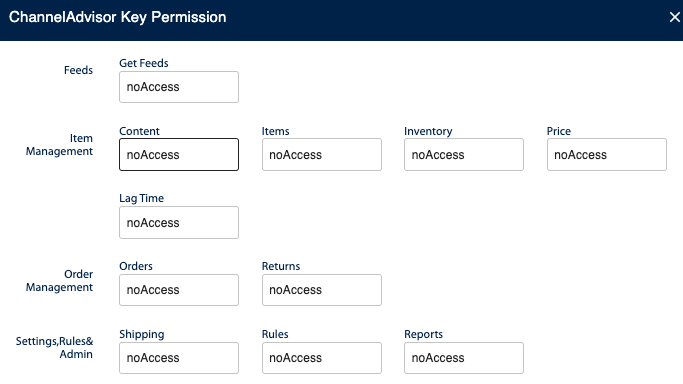
6. Configure an Expiring Access Token request to the Token API in Parabola.
🔐 Parabola | Authentication configuration
1. Add a Pull orders from Walmart step template to your canvas.
2. Click into any of the Enrich with API steps to configure your authentication.
3. Under the Authentication Type, select Expiring Access Token before selecting Configure Auth.
4. Enter your credentials to make a request to the Token API using the format below:
Access token request URL (POST)
Sandbox URL
https://sandbox.walmartapis.com/v3/token
Production URL
https://marketplace.walmartapis.com/v3/token
Request Body Parameters
Request Headers
💡 Tip: You can configure an Authorization Header Value using a base-64 encoder. Encode your Client ID and Client Secret separated by a colon: Client ID:Client Secret.
In Parabola, use the Header Value field to type Basic , followed by a space, and paste in your encoded credentials: Basic {encoded credentials here}.
💡 Tip: You can generate a WM_QOS.CORRELATION_ID Header Value using a GUID generator. Click Generate some GUIDS and copy the result to your clipboard.
In Parabola, paste the results in the WM_QOS.CORRELATION_ID Header Value.
Response Access Token Field
access_token
5. Click Advanced Options
Header Key for Using Access Token
WM_SEC.ACCESS_TOKEN
Header Value for Using Access Token
{token}
6. Click Authorize
Example Screenshot
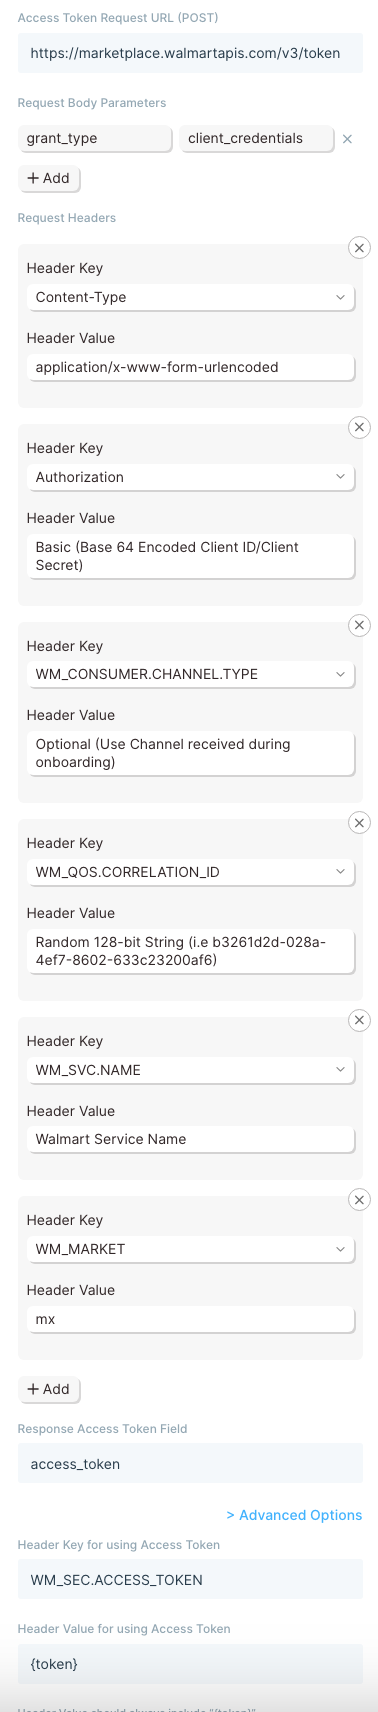
7. Click into the other Enrich with API steps and select the Expiring Access Token as your Authentcation Type to apply the same credentials.
🌐 Walmart | Sample API Requests
List orders using a dynamic date range
Get started with this template.
1. Add a Start with date & time step to the canvas to define the earliest order date.
2. Connect it to a Format dates step to format the Current DateTime into yyyy-MM-dd.
3. Connect it to the Enrich with API step.
4. Under Authentication Type, ensure Expiring Access Token is selected to use your authentication credentials.
5. Click into the Request Settings to configure your request using the format below:
API Endpoint URL
URL Parameters
Request Headers
6. Click Refresh data to display the results.
Example Screenshot
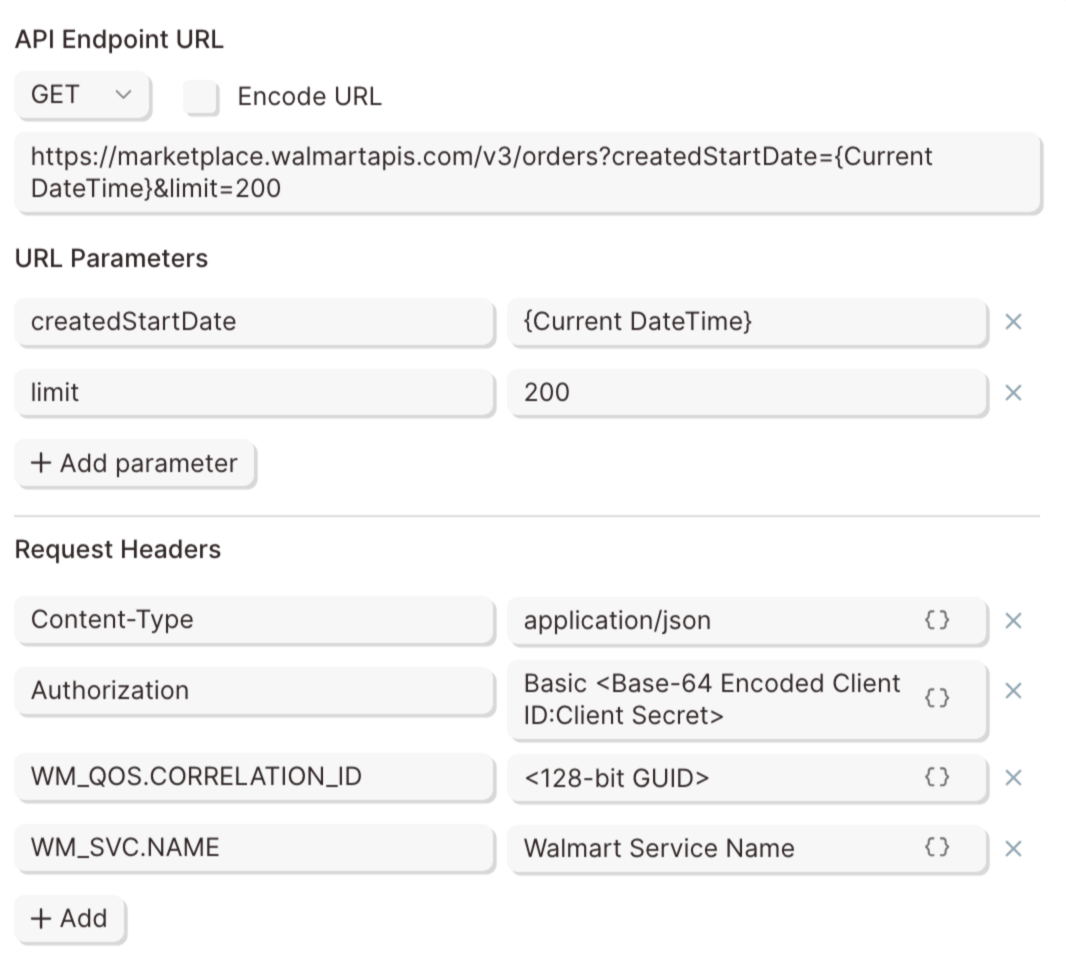
📣 Callouts
⚠️ Note: Parabola cannot support the API’s cursor-style pagination at this time. We can import up to 200 records at a time. Configuring a smaller, dynamic date range with frequent Flow runs is highly recommended.
Integration:
Webhook
The Pull from webhook step receives data that was sent to Parabola in an external service's Webhook feature. It is a source step that brings in data triggered by an event that took place on the external service, such as a customer purchasing an item on a platform like Shopify.
Set up your Flow to receive data from webhooks
First, set up an example flow with one import step (Pull from webhook) and one destination step of your choosing (for example, Send to Parabola Table). Once those steps are connected and configured, publish and run the Flow (see the button in the top right corner of a Flow canvas).
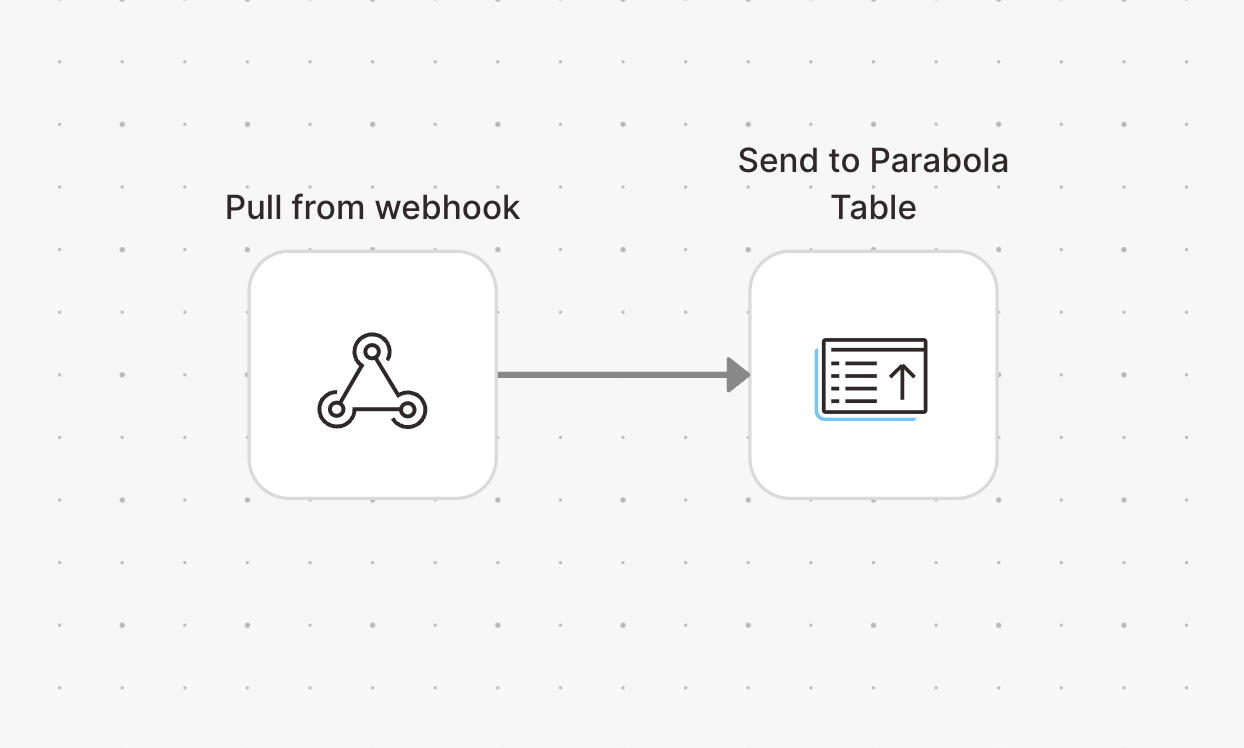
Once this Flow has been run with the Pull from webhook step, open the Schedules / Triggers pane from the published Flow screen: you’ll see a webhook trigger.
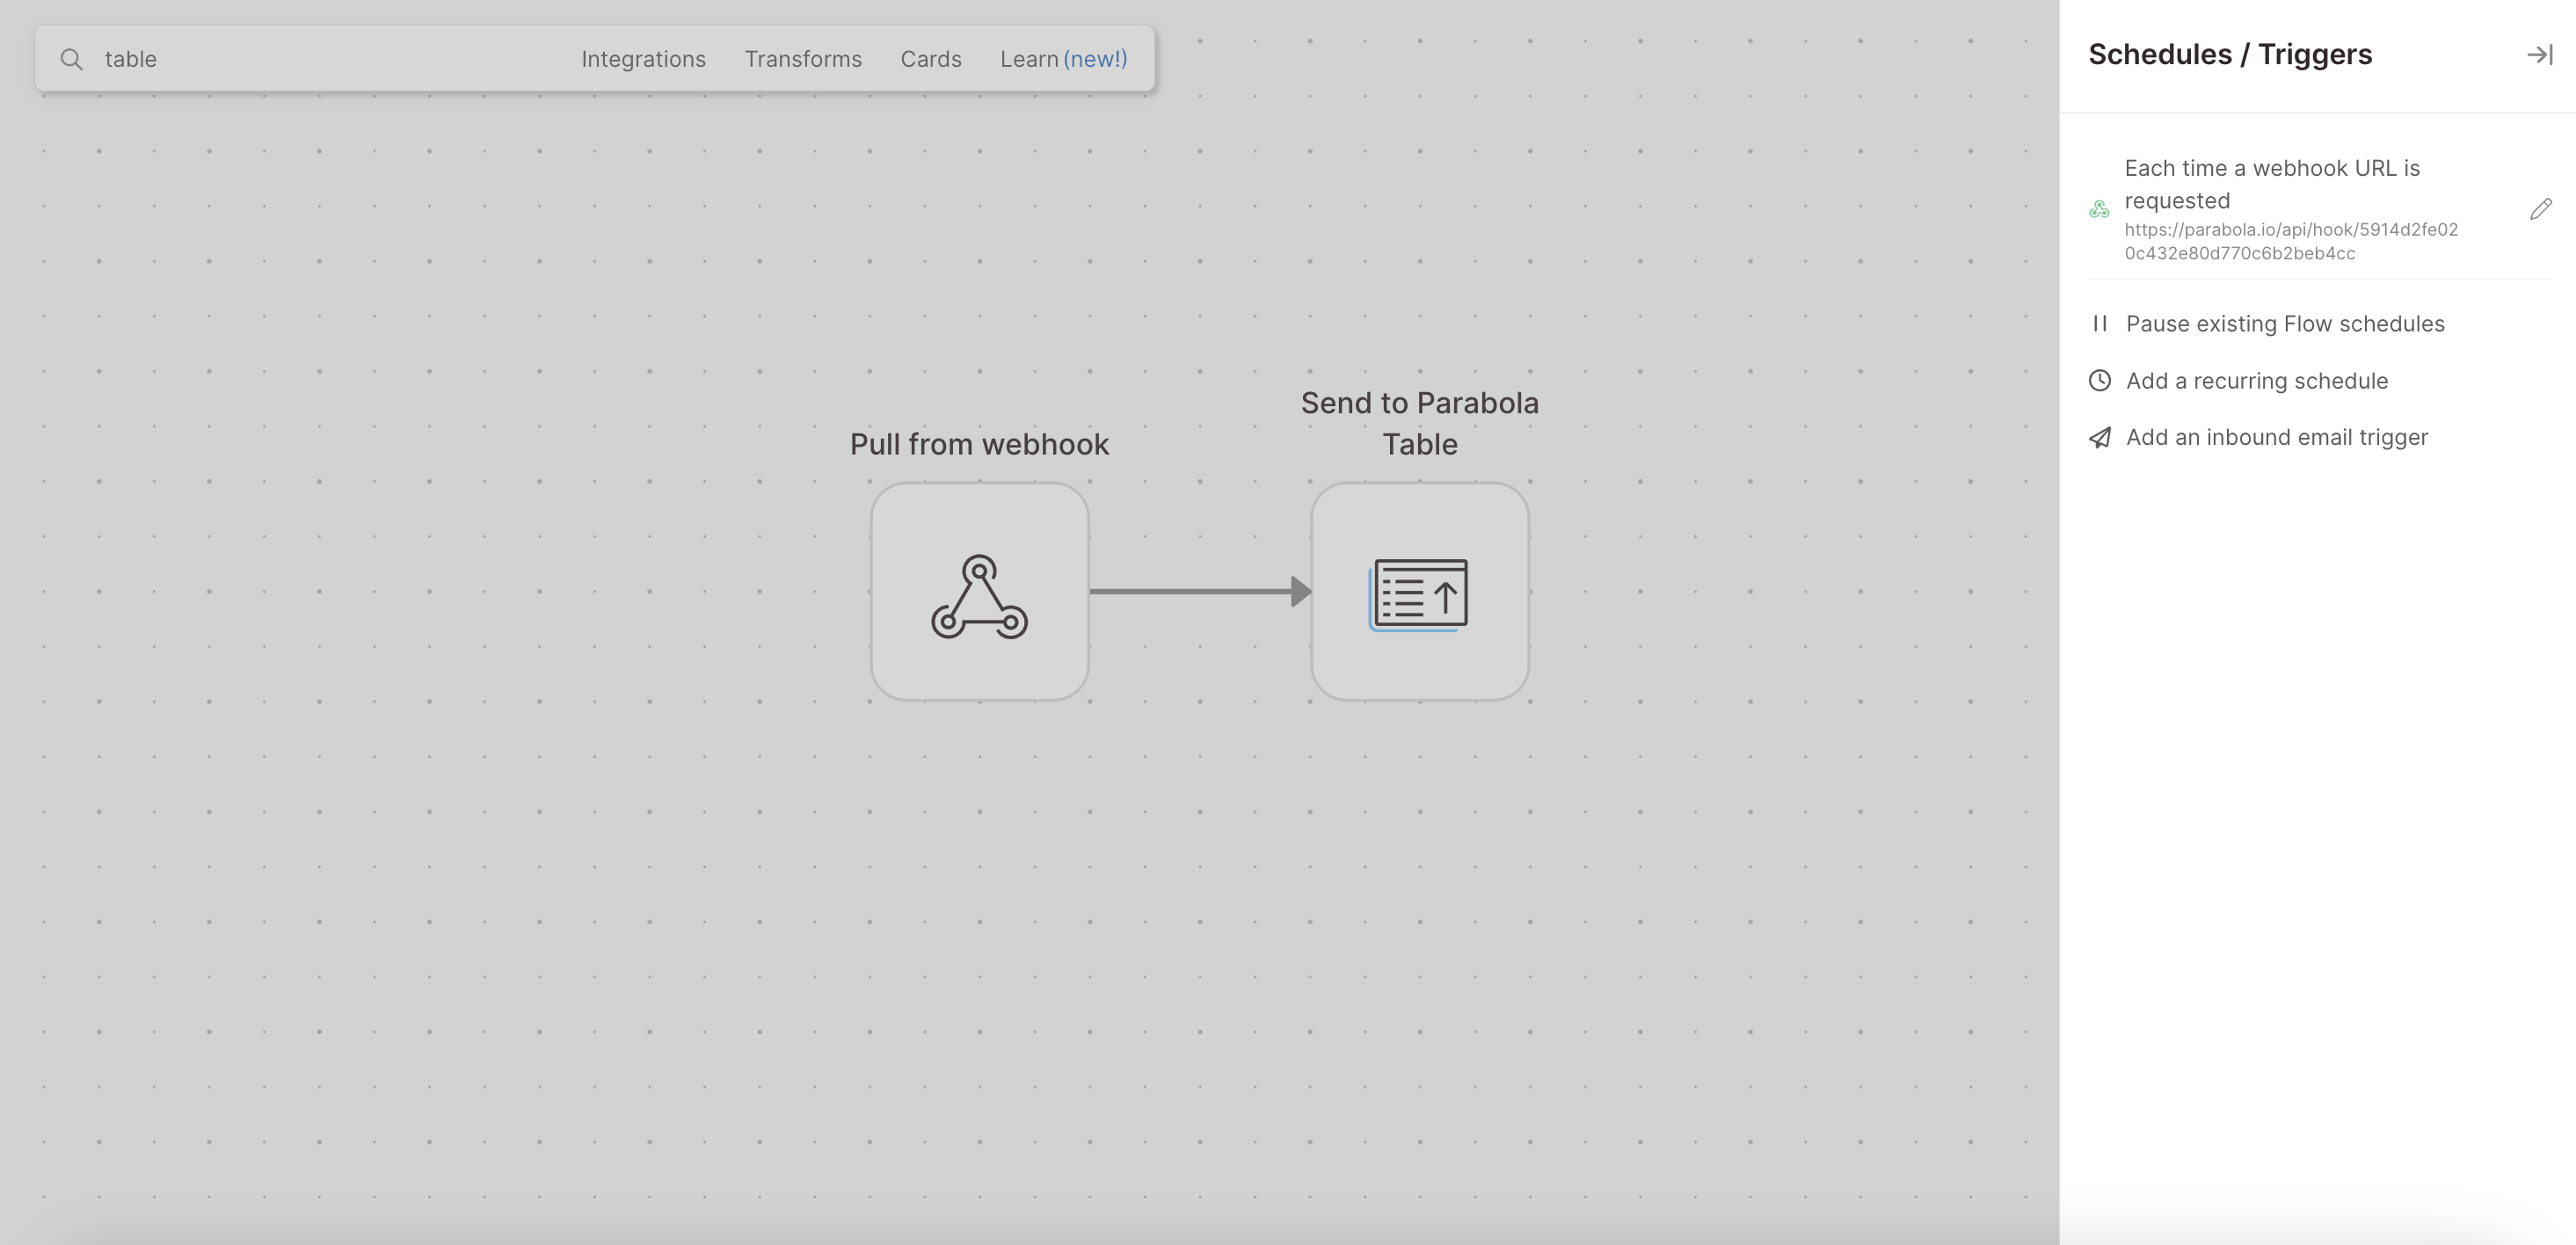
Click the pencil icon to copy, configure, and see the history of this webhook trigger.
.png)
Have your external service send data via webhoook
Highlight and copy the webhooks link to give to your external service in their webhooks section. (Be sure to not return to the Draft mode yet; if you have, refrain from publishing that Draft and return to the published Flow view).
After you've copied the Webhook link and entered it into your external tool's webhooks area, do a test initiation event to trigger this webhook (or wait for one to happen naturally, like a customer purchasing an item). Then, return to your Flow — it should have run automatically from this external event. Start a new Draft to open up the Flow builder again.
The Flow will now have the test webhook data pulled into it. Double-click on the Receive from webhook step to view it. This way, you'll get an idea of what the service's hook data looks like when its received and you can build out a flow that deals with it in the way you'd like. Please note that you must wait for a webhook to run at least once in order to go back to the flow's editor mode and see displayed hook data — otherwise, the step's display will be blank.
.png)
Helpful tips
- What is a Webhook?: webhooks are how tools communicate to one another when an event happens. For example, if you have an online store and someone makes a purchase, a webhook could be sent from your payment system to your email tool confirming the purchase. The webhook would send information like the customer, items purchased, date, and amount charged.
- How Webhook data can be used in your Flow: this step enables you to pull data in from a webhook that your Flow can work with. Data sent through webhooks must be in JSON format to be pulled in and processed by the Flow. Every time your Flow receives a webhook, the Flow will begin running and processing that incoming event-triggered dataset.
- What happens when multiple webhooks are received by your Flow: if your Flow is processing a dataset while another webhook with a dataset (or multiple) comes in, then they will queue up to be pulled into your Flow in the order they were received. All webhooks sent to a Flow, even if multiple at a time, will be queued up to 1,000 (maximum) and processed.
- Step refresh button?: the refresh button doesn't exist in this step since the data pulled in is triggered by an event happening on an external service and is sent over by webhook. In order for your Flow to catch the hook data and pull it in, after you set up your sample flow and select "Update Live Version" to be redirect to the Dashboard page, don't return to the editor by selecting Editor mode until you see in the Flow History run log a blue webhook button next to an entry. Only after you see a blue webhook associated run log should you then select the Editor button and return to the builder. This is because if you clicked on the Editor button, you created a newer Flow draft version that isn't finalized or published to catch the webhook data. Though the older Flow version may run and appear in 'Flow History' run logs, you won't be able to view the data in the Editor mode since selecting that button overwrote the previous draft file the webhook sent to.
- Limitations: if you send a very large amount of webhooks to one Flow at the same time, you may hit some limits in the amount of datasets that can be received and processed. This step cannot pull in data from a source whenever you'd like – it can only pull in data when data is sent to it through an event-based action. Webhooks can handle up to 1,000 queued runs per Flow, and will check for new runs every minute.
Integration:
Zendesk
How to authenticate
Zendesk uses basic authentication with an API token. Here's how to get your credentials and connect them in Parabola:
- Getting your Zendesk API token
- Log into your Zendesk account as an administrator.
- Navigate to Admin Center in the sidebar and go to Apps and integrations → APIs → Zendesk API.
- Click Add API Token in the API tokens section.
- Add a Description (e.g., "Parabola Integration") to identify the token.
- Copy the token immediately and store it somewhere secure. Once you close the window, the full token will never be displayed again.
- Connecting in Parabola
- In your Parabola flow, add a Pull from Zendesk step.
- Click Authorize and add your credentials when prompted.
- You will also need your Zendesk subdomain (e.g., if your URL is acme.zendesk.com, then the subdomain you enter is acme).
- Select the Zendesk resource you want to pull (Tickets, Users, Organizations, etc.) and configure any filters like date ranges or statuses.
Once connected, Parabola will securely use your credentials to pull data from Zendesk into your flows.
Available data
Using the Zendesk integration in Parabola, you can pull in a wide range of customer service and support data, including:
- Tickets: Support requests with details like status, priority, assignee, requester, description, tags, custom fields, timestamps, and satisfaction ratings
- Users: Customer and agent profiles including names, emails, roles, organizations, time zones, and custom user fields
- Organizations: Company profiles with domains, notes, tags, and custom organization fields
- Groups: Agent teams and their memberships for routing and assignment tracking
- Ticket Comments: All public and private comments on tickets, including attachments and author details
- Ticket Audits: Complete change history for tickets showing what changed, when, and by whom
- Ticket Forms: Custom forms used for different ticket types
- Tags: Labels applied to tickets, users, and organizations for categorization
- Triggers: Automated rules that run when ticket conditions are met
- Automations: Time-based rules that execute on schedules
- Macros: Pre-built responses and ticket actions for agents
- Views: Saved ticket filters used by support teams
Common use cases
- Track team performance and SLA compliance including resolution times, first response times, and assignee information to monitor agent performance, identify bottlenecks, and ensure SLA targets are being met across teams and brands.
- Analyze customer satisfaction trends with ticket details, product tags, and agent assignments to identify which issues, products, or agents drive positive or negative CSAT scores.
- Reconcile support data with sales and billing systems in your CRM, ERP, or billing system to create unified customer views and ensure support interactions are tied to the right accounts.
- Automate recurring support reports that pull ticket volumes, resolution metrics, and satisfaction data daily or weekly, then push formatted reports to Google Sheets, Slack, or email for stakeholders.
- Monitor and escalate critical tickets by priority, status, or custom fields to flag urgent or stalled issues, then automatically send alerts to managers or create follow-up tasks in project management tools.
- Audit agent activity and ticket changes for quality assurance, compliance, or training purposes.
Tips for using Parabola with Zendesk
- Schedule your flows to run automatically on the cadence your team needs. Run hourly for real-time dashboards, daily for operational reports, or weekly for trend analysis.
- Use date filters when pulling tickets or audits to limit the data to recent records and keep your flows fast and focused.
- Combine Zendesk data with other sources like Shopify orders, Stripe payments, or Salesforce accounts to create cross-system reports that show the full customer journey.
- Normalize IDs early in your flow (ticket IDs, user IDs, organization IDs) so downstream joins and lookups work smoothly across systems.
- Add Checks and Alerts to flag exceptions: tickets missing assignees, satisfaction ratings below a threshold, or SLA breaches.
- Filter by status, priority, or tags to isolate specific ticket segments (e.g., only open tickets, high-priority issues, or tickets tagged "billing").
- Use custom fields strategically: If your Zendesk instance uses custom fields extensively, map them clearly in your flow and document what each field represents for your team.
- Set up Alerts via Slack or email in Parabola to notify your support team when critical conditions are met, like a spike in unresolved tickets or a drop in CSAT scores.
With Parabola and Zendesk, you can turn your support data into automated workflows that save hours, improve visibility, and help your team deliver better customer experiences.