Stack tables
The Stack tables step provides the ability to vertically stack any table(s) on top of one other.
Input/Output
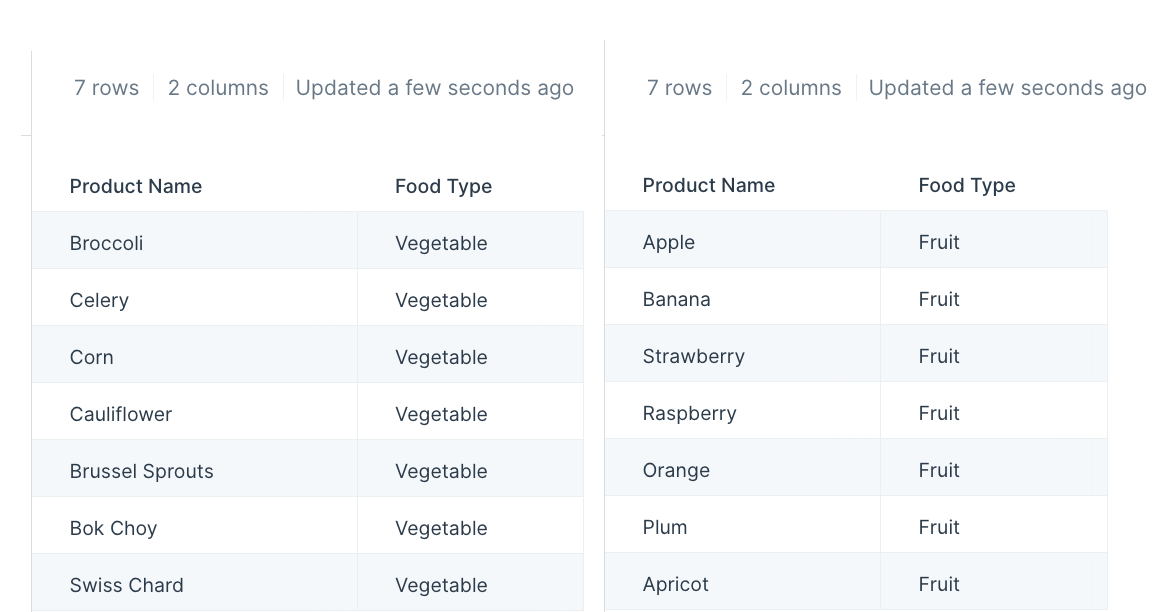
The Stack tables step needs at least two data inputs. In the example below, we have two tables that both have the columns "Product Name" and "Food Type".

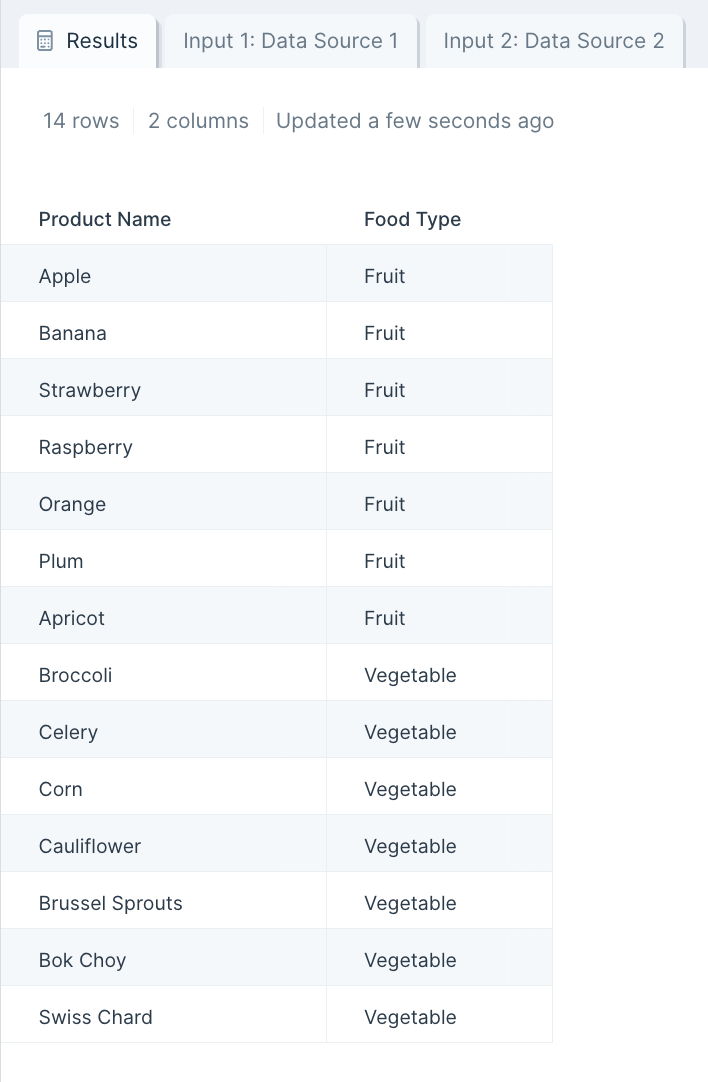
After using the Stack tables step, these two tables are now stacked one on top of the other.

Custom settings
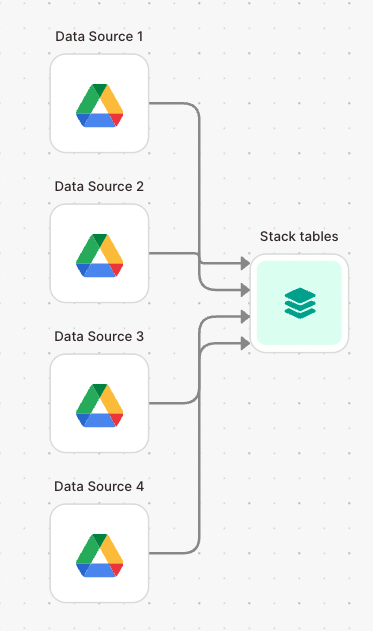
First, connect at least two datasets (or flow branches) to this step on your canvas.
Then, double-click on the Stack tables step to open up a pop-up window. This displays your datasets combined where the first connected dataset is on top while the second dataset is right below.
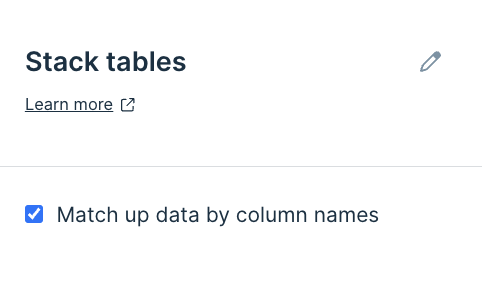
By default we stack the tables vertically based on the order of columns. If you prefer, you can click a checkbox to have Parabola match up data by column names. If your inputs are integration steps or APIs, we recommend selecting this option to match data by column names for a more stable flow, in case the API/integration decides to change up its column ordering.

Helpful tips
- This step requires at least two inputs. Make sure you have at least two arrows connected to this step. You can have as many inputs as you need. There's no maximum number of inputs.
- The order of the arrows matter. This is how we know what order to stack the tables in. The column headers from the first input are the headers used by the step's output result. The numbers you see in the arrow indicates the order. Your first input is the one with a blank arrow.

- If you have fewer columns in your first data input than you do in your other ones, the step's result won't retain those extra columns from the other data inputs.