Input/output
Our input data is a list of ecommerce orders, including detailed data about items ordered.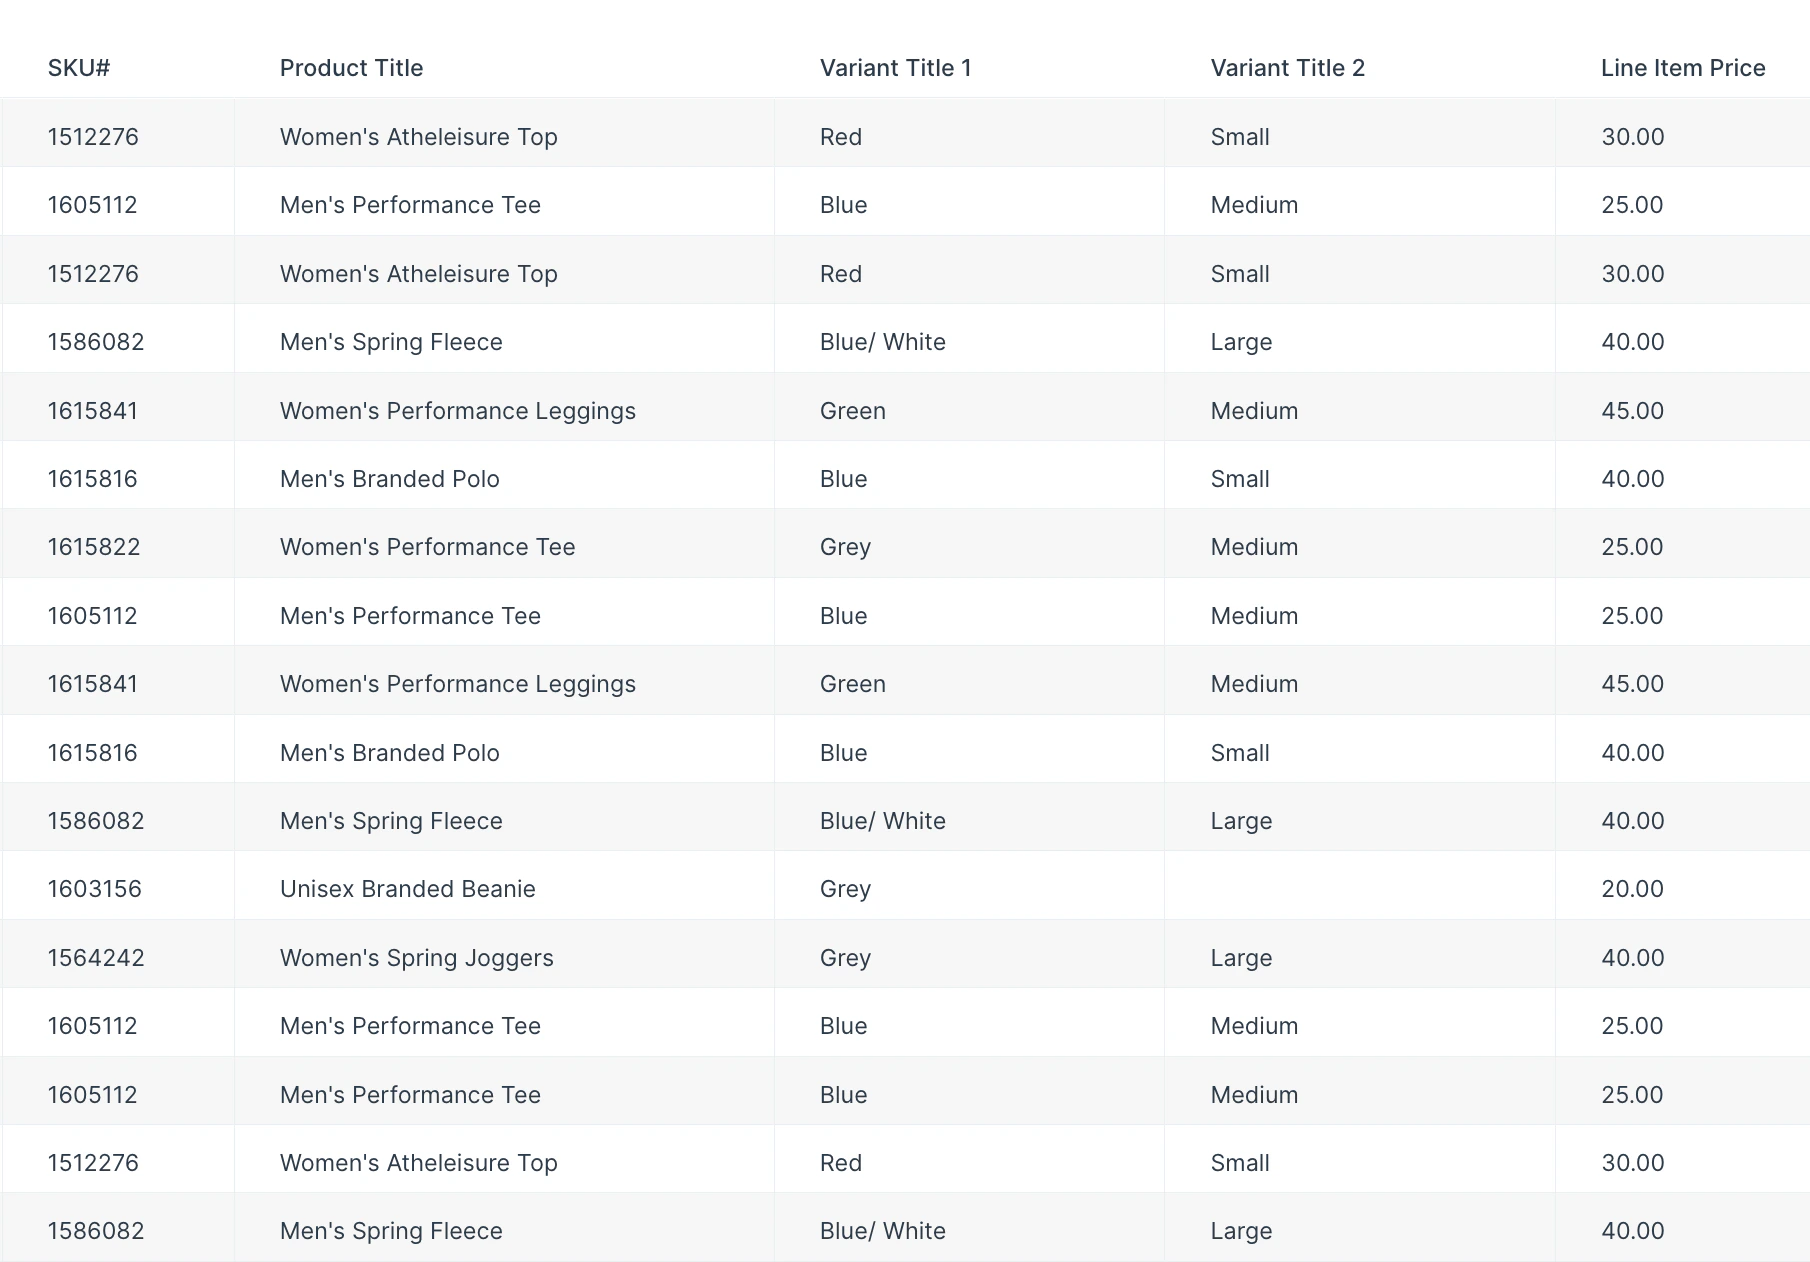
Default settings
By default, this step will count every row as unique and display a ‘Count’ column with the same value as the number of rows in your input table.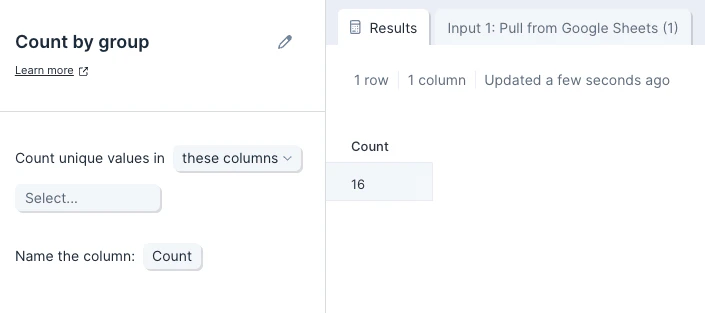
Custom settings
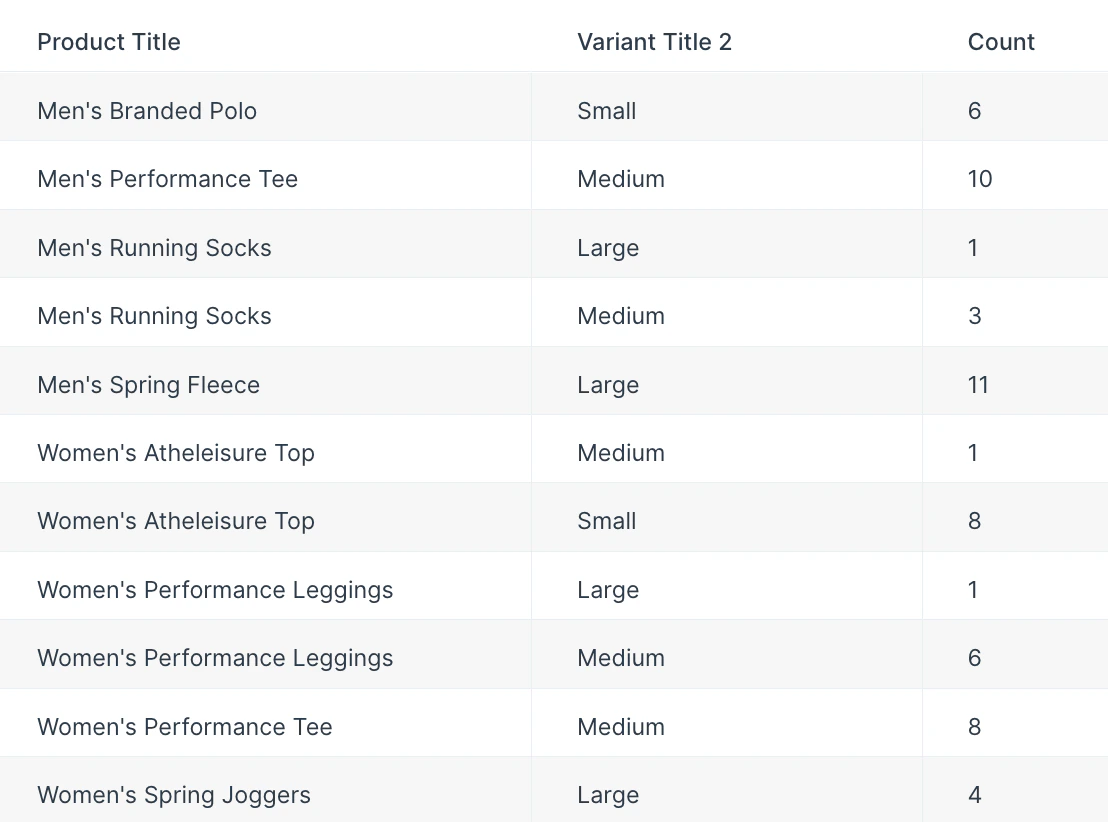
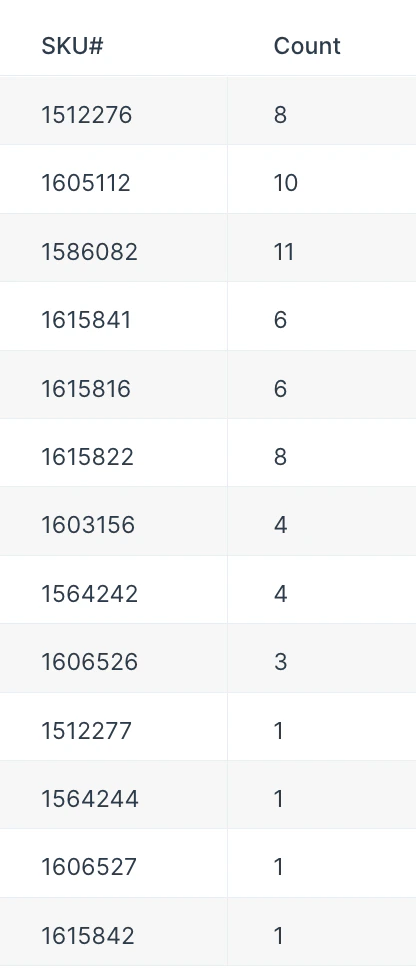
To customize these default settings, you’ll first select a column or multiple columns you’d like to count unique values in. Then, you’ll title your new counting column. Above, we wanted to count groups in a single column, so we selected ‘SKU’ from the dropdown and named the new column ‘Count’. You can also add multiple columns if you want to count unique values for the combinations of those column values. For example, if we want to count sizes sold of each item type, we can select ‘Product Title’ and ‘Variant Title 2’ (item sizes) from the dropdown to see these updated results. The results below show us that we sold significantly more small than medium women’s athleisure tops.