
Shopify integration
What is Shopify?
Shopify is an ecommerce platform that enables businesses to create and manage their online stores. It provides a comprehensive suite of tools for inventory management, payment processing, and order fulfillment, making it a popular choice for businesses of all sizes. Shopify's robust infrastructure supports millions of merchants worldwide, offering them the ability to sell products across multiple channels and marketplaces.
How to integrate Shopify with Parabola
Parabola's Shopify integration enables seamless e-commerce data extraction, management and transformation.
- Import Shopify data automatically with scheduled refreshes
- Transform and clean ecommerce data with built-in steps, including replacing values, removing duplicate rows or values, and counting days between dates
- Combine Shopify data with the following sources (and more): API data, email data, Excel, Google Sheets, ShipHero, NetSuite, Amazon Seller Central
Learn more about Parabola's Shopify integration below.
Connecting to the Shopify API
If you have to pull or push data that is not yet supported by our native integration, you have an option to use our API steps and connect directly to Shopify’s robust API. If you need any additional help connecting the Shopify API, please reach out to us at help@parabola.io.
Pull from Shopify
The Pull from Shopify step can connect directly to your Shopify store and pull in orders, line item, customer, product data and much more!
This step can pull in the following information from Shopify:
- A list of Orders with the following details: Orders, a list of Line Items sold for each order, with refunds and fulfillment included, a list of Shipping Lines for each order, and Discount Applications that have been applied to your orders
- Your Shop Balance
- A list of your shop Customers
- A list of shop Disputes
- Your Product Inventory Levels per location
- A list of Location Details associated with your shop
- A list of shop Payouts
- A list of all Collections with their associated products
- A list of Products
Connect your Shopify account
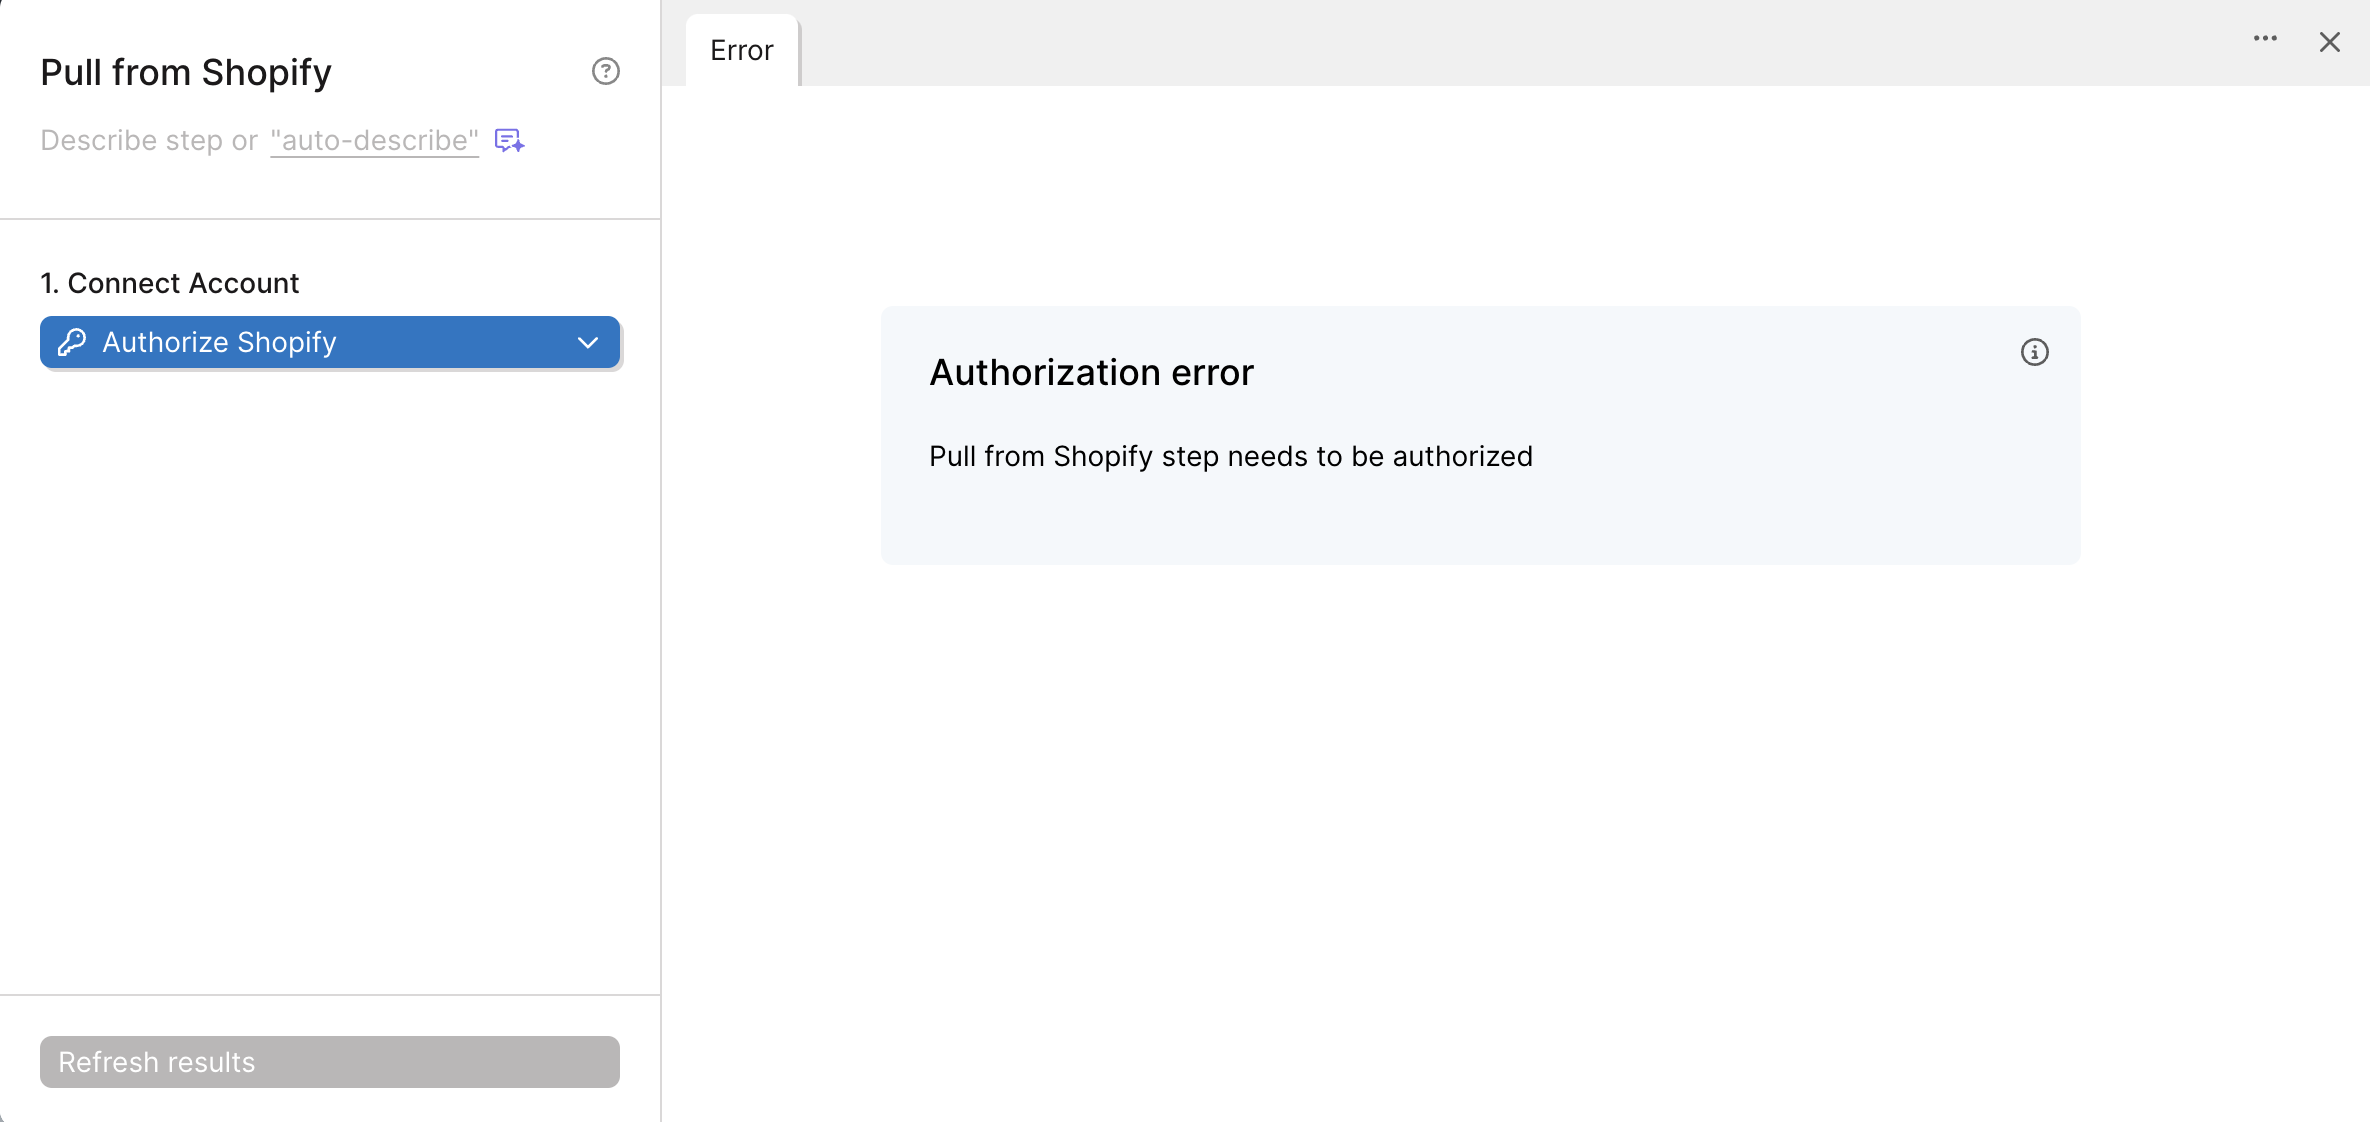
Select the blue Authorize button. If you're coming to Parabola from the Shopify App Store, you should see an already-connected Pull from Shopify step on your flow.
Default settings
By default, once you connect your Shopify account, we'll import your Orders data with Line Items detail for the last day. From here, you can customize the settings based on the data you'd like to access within Parabola.
Custom settings
This section will explain all the different ways you can customize the data being pulled in from Shopify. To customize these settings, start by clicking the dropdown in part 2 of the step.
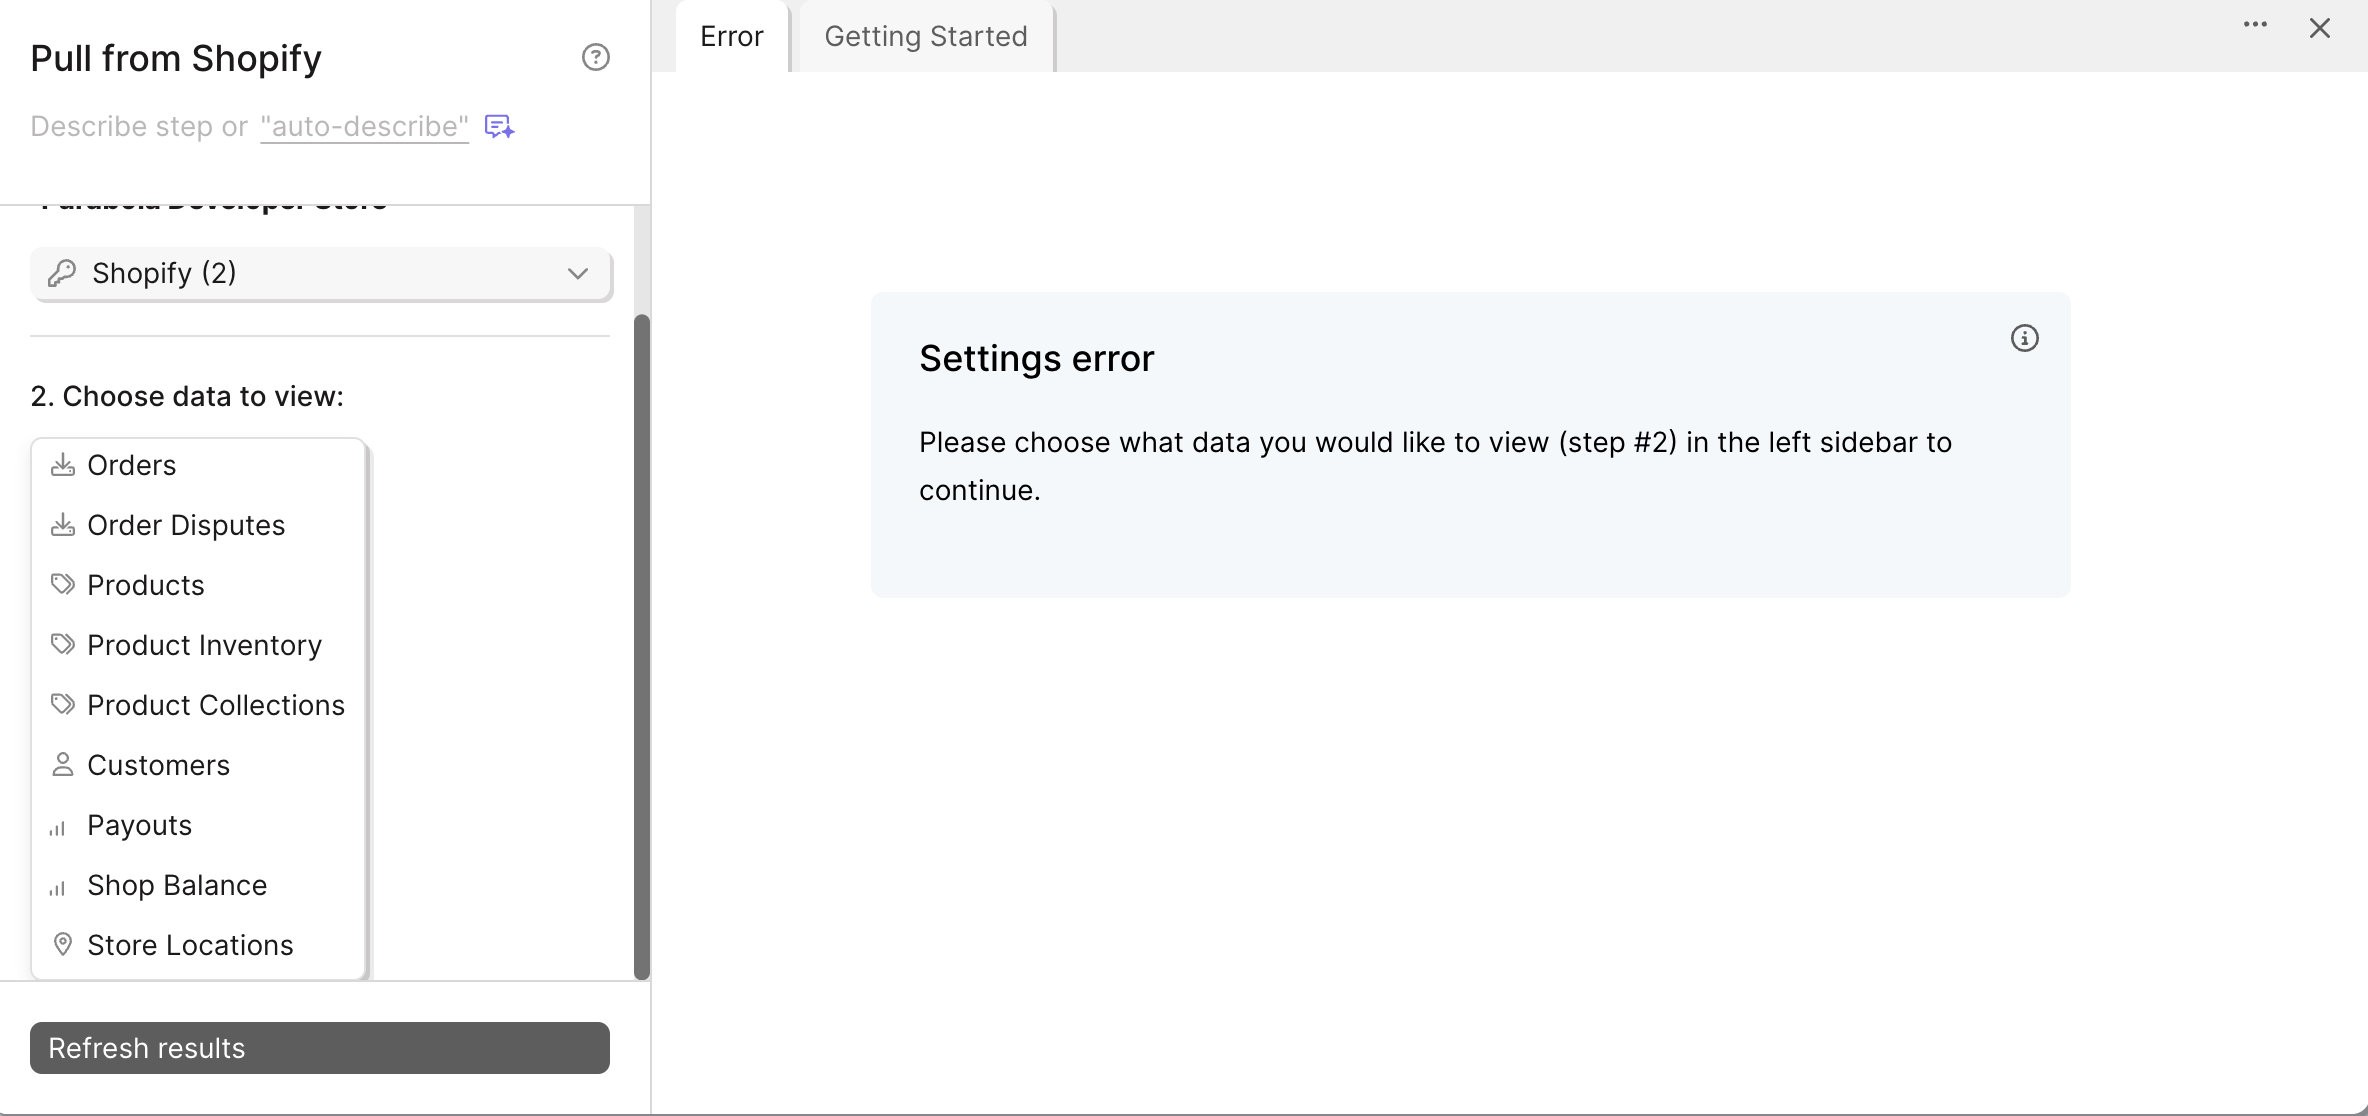
Pulling your Orders
Shopify orders contain all of the information about each order that your shop has received. You can see totals associated with an order, as well as customer information and more. The default settings will pull in any Order with the Orders detail happened in the last day. This will include information like the order total, customer information, and even the inventory location the order is being shipped from.
If you need more granular information about what products were sold, fulfilled, or returned, view your Orders with Line Items detail. This can be useful if you want relevant product data associated with each line item in the order.
Available filters for orders, line items, shipping lines, and discount applications
- Choose to include the default columns (most commonly used) or include all columns (every field that your orders contain).
- Choose to include or not include test orders
- Filter by order status: any, cancelled, closed, open, open and closed
- Filter by financial status: any, authorized, paid, partially_paid, partially_refunded, pending, refunded, unpaid, voided
- Filter by fulfillment status: any, shipped, partial, unshipped, unfulfilled (partial + unshipped)
Date filters for orders, line items, shipping lines, and discount applications
- Choose to filter your data by order processed date or refund processed date
- within the previous # day, hour, week, or month
- based on when the flow is run or the most recently completed day
- You can also add an offset to the previous period or previous year. We have a handy helper to confirm the date range we'll use to filter in the step:

- within the current day to date, week to date, month to date, year to date
- You can add an offset to the previous period or previous year.
- after x date
- between x and y dates
Pulling your Line Items, with refunds and fulfillments
Each order placed with your shop contains line items - products that were purchased. Each order could have many line items included in it. Each row of pulled data will represent a single item from an order, so you may see that orders span across many rows, since they may have many line items.
There are 4 types of columns that show up in this pull: "Orders", "Line Items", "Refunds", and "Fulfillment columns". When looking at a single line item (a single row), you can scroll left and right to see information about the line item, about its parent order, refund information if it was refunded, and fulfillment information if that line item was fulfilled.
Pulling your Shipping Lines
As your orders are fulfilled, shipments are created and sent out. Each shipment for an order is represented as a row in this pull. Because an order may be spread across a few shipments, each order may show up more than one time in this pull. There are columns referring to information about the order, and columns referring to information about the shipment that the row represents.
Pulling your Discounts
Every order the passes through your shop may have some discounts associated with it. A shopper may use a few discount codes on their order. Since each order can have any number discount codes applied to it, each row in this pull represents a discount applied to an order. Orders may not show up in this table if they have none, or they may show up a few times! There are columns referring to information about the order, and columns referring to information about the discount that was applied.
Pulling your Shop Balance
This is a simple option that pulls in 1 row, containing the balance of your shop, and the currency that it is set to.
Pulling your Customers
This option will pull in 1 row for every customer that you have in your Shopify store records.
Available filters:
- Choose to include the default columns (most commonly used) or include all columns (every field that your orders contain).
- By default, we will only pull in the default address for each customer. Because customers may have more than one address, you can select the checkbox to "Expand rows to include all addresses". If you select this option, any customer with more than a single address will show up on multiple rows. For example, if your customer Juanita has 3 addresses in your system, then you will see 3 rows for Juanita, with the address information being the only data that is different for each of her rows.
Date filters for customer data:
- Choose to filter your data by order processed date or refund processed date
- Within the previous # day, hour, week, or month
- Based on when the flow is run or the most recently completed day
- You can also add an offset to the previous period or previous year. We have a handy helper to confirm the date range we'll use to filter in the step:

- Within the current day to date, week to date, month to date, year to date
- You can add an offset to the previous period or previous year.
- After x date
Pulling your Disputes
Retrieve all disputes ordered by the date when it was initiated, with the most recent being first. Disputes occur when a buyer questions the legitimacy of a charge with their financial institution. Each row will represent 1 dispute.
Pulling your Product Inventory
An inventory level represents the available quantity of an inventory item at a specific location. Each inventory level belongs to one inventory item and has one location. For every location where an inventory item is available, there's an inventory level that represents the inventory item's quantity at that location.
This includes product inventory item information as well, such as the cost field.
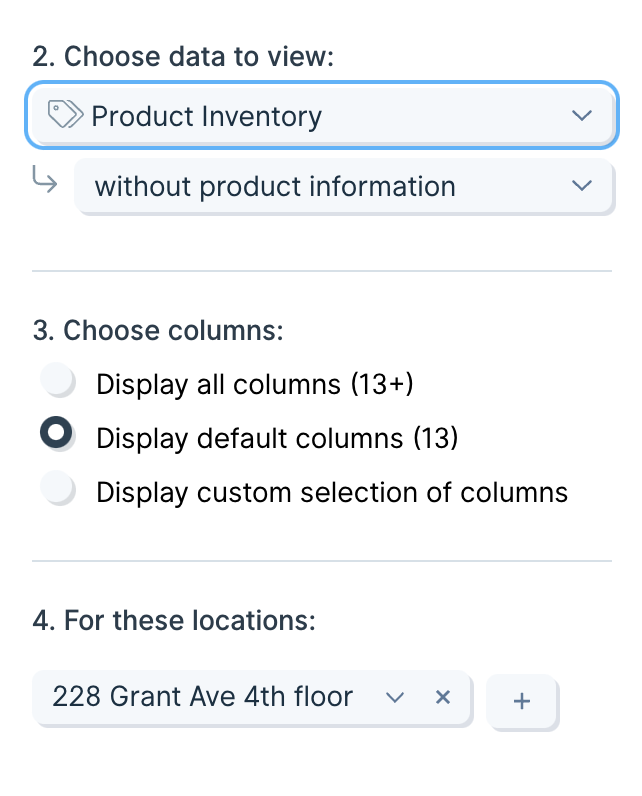
You can choose any combination of locations to pull the inventory for, but you must choose at least one. Each row will contain a product that exists in a location, along with its quantity.
Toggle "with product information" to see relevant product data in the same view as the Product Inventory.
Pulling your Location Details
This is a simple option that will pull in all of your locations for this shop. The data is formatted as one row per location.
Pulling your Payouts
Payouts represent the movement of money between a Shopify Payments account balance and a connected bank account. You can use this pull option to pull a list of those payouts, with each row representing a single payout.
Pulling your Collections
Pull the name, details, and products associated with each of your collections. By default, each row returns the basic details of each collection. You can also pull the associated products with each collection.
Available filters:
- You can pull in a list of your manual collections. A manual collection contains a list of products that are manually added to the collection. They may have no relation to each other.
- You can pull in a list of your smart collections. A smart collection contains a list of products that are automatically added to the collection based on a set of shared conditions like the product title or product tags.
Pulling your Products
This pulls in a list of your products. Each row represents product variant since a product can have any number of variants. You may see that a product is repeated across many rows, with one row for each of its variants. When you set up a product, it is created as a variant, so products cannot exist without having at least one variant, even if it is the only one.
Available filters:
- Choose to include the default columns (most commonly used) or include all columns (every field that your orders contain).
- By default, we will only pull in one image per variant. Because you may have multiple images per variant, you can select the checkbox to "Expand rows to include all images". If you select this option, for product variants with many images, each image will be added to a new row, so product variant XYZ may show up on 3 rows if there are 3 images pulled for it.
- You can also filter down your products by a few attributes: collection_id, handle, product_type, published status, title, and vendor.
Send to Shopify
The Send to Shopify step can connect directly to your Shopify store and automatically update information in your store.
This step can perform the following actions in Shopify:
- Create new customers
- Update existing Customers
- Delete existing Customers
- Add products to collections
- Delete product-collection relationships
- Update existing inventory items
- Adjust existing inventory levels
- Reset inventory levels
- Issue refunds by line items
Connect your Shopify account
To connect your Shopify account from within Parabola, click on the blue "Authorize" button. For more help on connecting your Shopify account, jump to the section: Authorizing the Shopify integration and managing multiple stores.
Custom settings
Once you connect a step into the Send to Shopify step, you'll be asked to choose an export option.
The first selection you'll make is whether this step is enabled and will export all data or disabled and will not export any data. By default, this step will be enabled, but you can always disable the export if you need to for whatever reason.
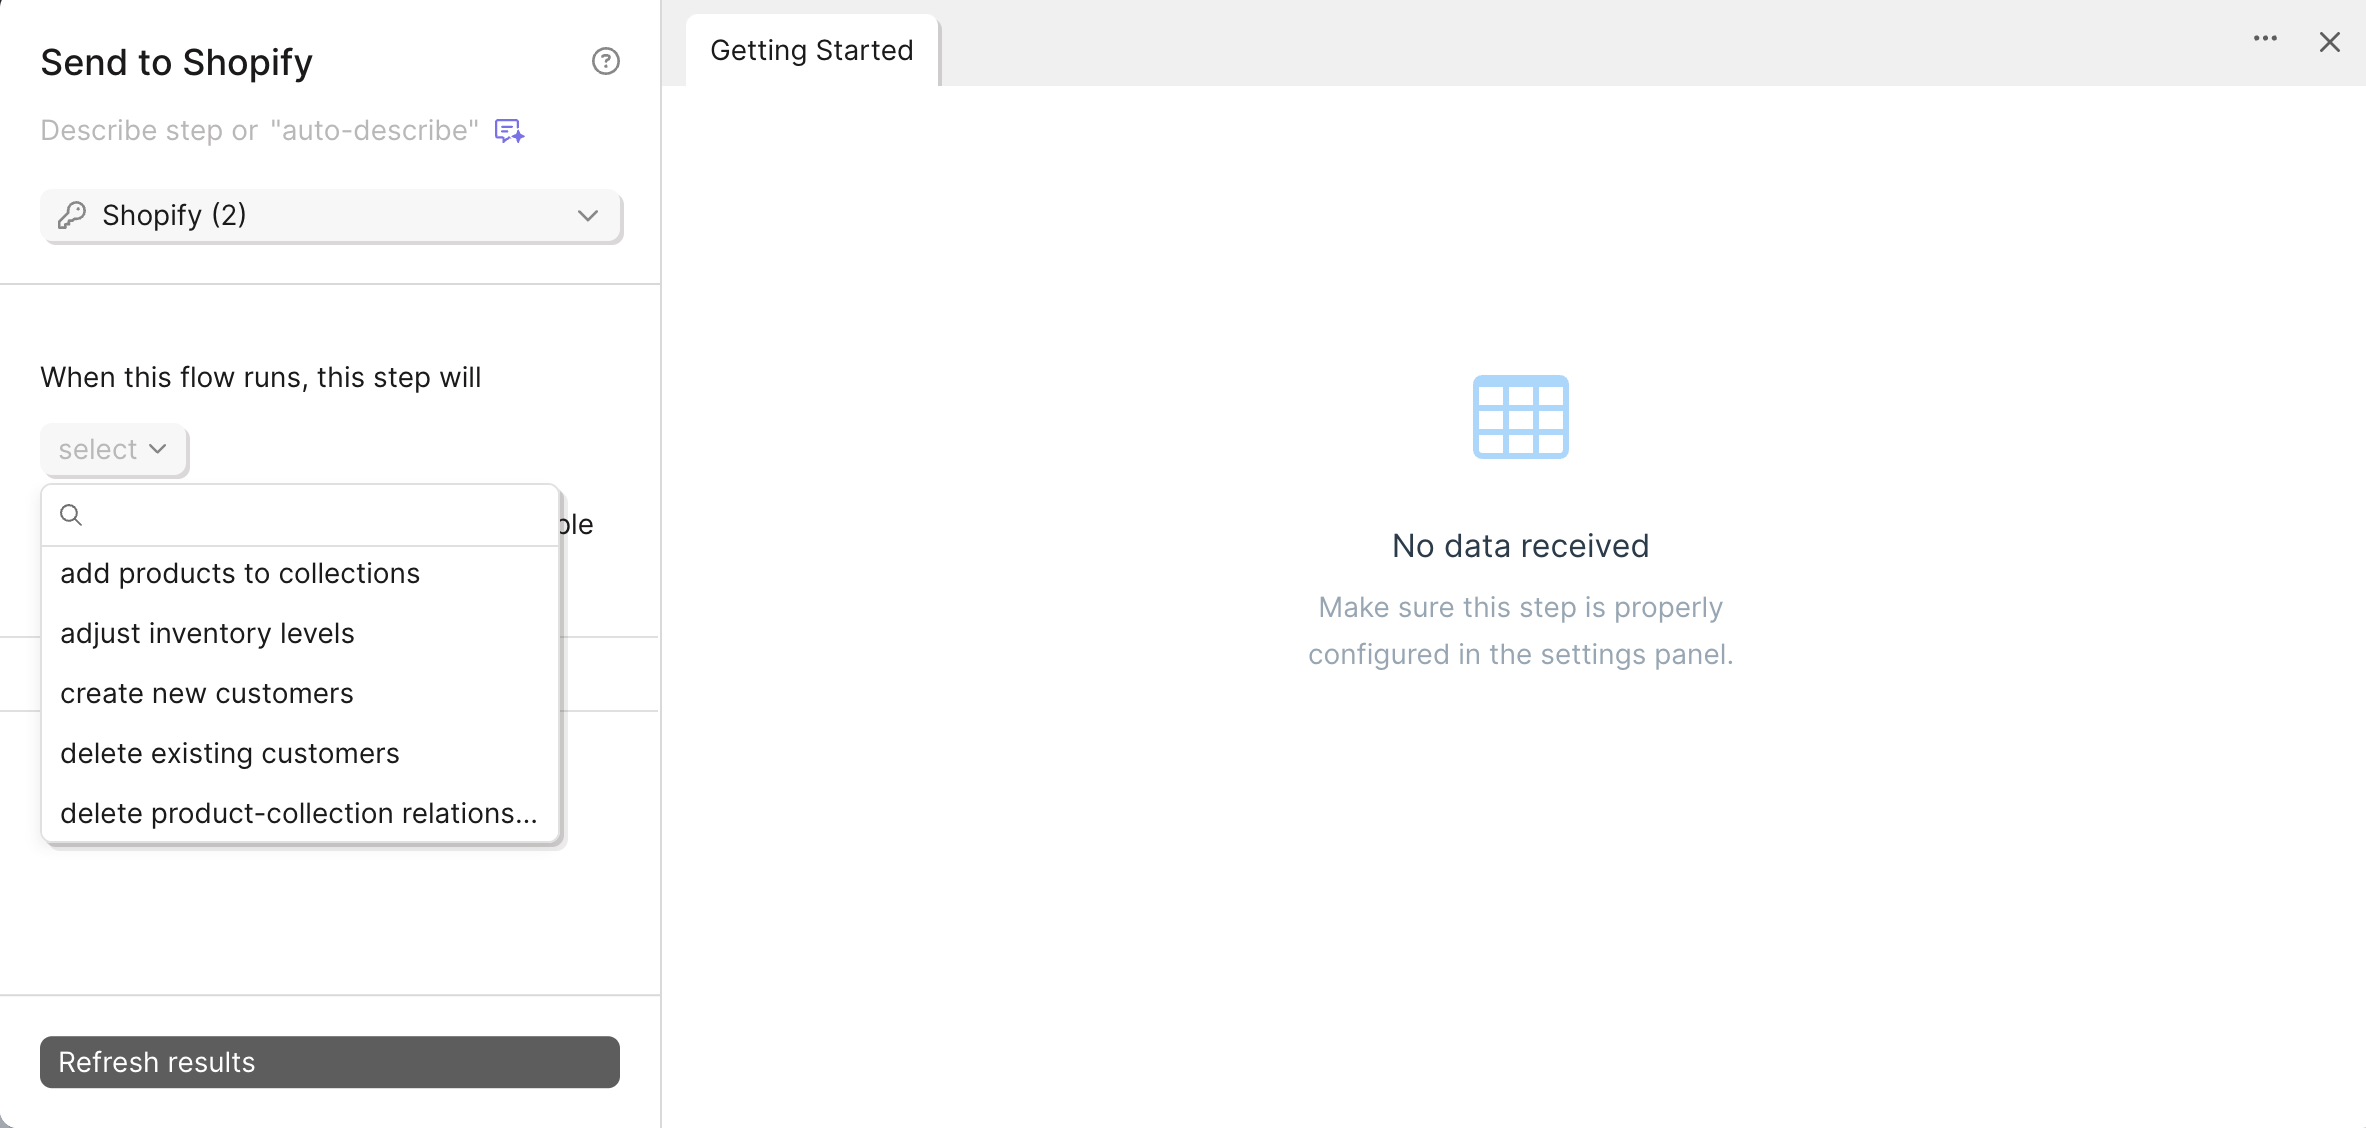
Then you can tell the step what to do by selecting an option from the menu dropdown.
Create New Customers
When using this option, every row in your input data will be used to create a new customer, so be sure that your data is filtered down to the point that every row represents a new customer to create.
When using this step, any field that is not mapped in the settings table in the step will not be sent. Only the mapped fields will be sent to Shopify.
Every customer must have either a unique Phone Number or Email set (or both), so be sure those fields are present, filled in, and have a mapping.
If you create customers with tags that do not already exist in your shop, the tags will still be added to the customer.
The address fields in this step will be set as the primary address for the customer.
Update Existing Customers
When using this option, every row in your input data will be used to update an existing customer, so be sure that your data is filtered down to the point that every row represents a customer to update.
When using this step, any field that is not mapped in the settings table in the step will not be sent. Only the mapped fields will be sent to Shopify.
Every customer must have a Shopify customer ID present in order to update successfully, so be sure that column is present, has no blanks, and is mapped to the id field in the settings.
The address fields in this step will be edit the primary address for the customer.
Delete Existing Customers
When using this option, every row in the step will be used to delete an existing customer, so be sure that your data is filtered down to the point that every row represents a customer to delete.
This step only requires a single field to be mapped - a column of Shopify customer IDs to delete. Make sure your data has a column of those IDs without any blanks. You can find the IDs by using the Pull from Shopify step.
Add Products to Collection
Collections allow shops to organize products in interesting ways! When using this option, every row in the step will be used to add a product to a collection, so be sure that your data is filtered down to the point that every row represents a product to add to a collection.
When using this option, any field that is not mapped in the settings table in the step will not be sent. Only the mapped fields will be sent to Shopify.
You only need two mapped fields for this option to work - a Shopify product ID and a Shopify Collection ID. Each row will essentially say, "Add this product to this collection".
Delete Product-Collection Relationships
Why is this option not called "Remove products from collections" if that is what it does? Great question. Products are kept in collections by creating a relationship between a product ID and a Collection ID. That relationship exists, and has its own ID! Imagine a spreadsheet full of rows that have product IDs and Collection IDs specifying which product belongs to which collections - each of those rows needs their own ID too. That ID represents the relationship. In fact, you don't need to imagine. Use the Pull from Shopify step to pull in Product-Collection Relationships. Notice there is an ID for each entry that is not the ID of the product or the collection. That ID is what you need to use in this step.
When using this option, every row in the step will be used to delete a product from a collection, so be sure that your data is filtered down to the point that every row represents a product-collection relationship that you want to remove.
This step does not delete the product or the collection! It just removes the product from the collection.
When using this step, any field that is not mapped in the settings table in the step will not be sent. Only the mapped fields will be sent to Shopify.
You need 1 field mapped for this step to work - it is the ID of the product-collection relationship, which you can find by Pulling those relationships in the Pull from Shopify step. In the step, it is called a "collect_id", and it is the "ID" column when you pull the product-collection relationships table.
Update Existing Inventory Items
What's an inventory item? Well, it represents the goods available to be shipped to a customer. Inventory items exist in locations, have SKUs, costs and information about how they ship.
There are a few aspects of an inventory item that you can update:
- Cost: The unit cost associated with the inventory item - should be a number, such as 10 or 10.50
- SKU: Any string of characters that you want to use as the SKU for this inventory item
- Tracked: Whether the inventory item is tracked. Set this to true or false
- Requires Shipping: Whether a customer needs to provide a shipping address when placing an order containing the inventory item. Set this to true or false
When using this step, you need to provide an Inventory Item ID so that the step knows which Item you are trying to update. Remember, any field that is not mapped in the settings table in the step will not be sent. Only the mapped fields will be seny to Shopify.
“Update” option behavior
When using the “Update” option in the Send to Shopify step, Parabola will overwrite all existing values for any fields that are mapped in the step’s settings table. This behavior is standard for update requests and ensures that Shopify reflects the exact data provided in your flow.
Any fields not mapped will remain unchanged in Shopify. To avoid unintended data loss or partial updates, make sure to explicitly map all fields you want to update and double-check your input data before running the flow.
Adjust Existing Inventory Levels
When using this option, every row in the step will be used to adjust an existing item's inventory level, so be sure that your data is filtered down to the point that every row represents an item to adjust.
When using this step, any field that is not mapped in the settings table in the step will not be sent. Only the mapped fields will be sent to Shopify.
Every item must have a Shopify inventory item ID present in order to adjust successfully, so be sure that column is present, has no blanks, and is mapped to the id field in the settings.
You must provide the inventory item ID, the location ID where you want to adjust the inventory level, and the available adjustment number. That available adjustment number will be added to the inventory level that exists. So if you want to decrease the inventory level of an item by 2, set this value to -2. Similarly, use 5 to increase the inventory level by 5 units.
Reset Inventory Levels
When using this option, every row in the step will be used to reset an existing item's inventory level, so be sure that your data is filtered down to the point that every row represents an item to reset.
When using this step, any field that is not mapped in the settings table in the step will not be sent. Only the mapped fields will be sent to Shopify.
Every item must have a Shopify inventory item ID present in order to reset successfully, so be sure that column is present, has no blanks, and is mapped to the id field in the settings.
You must provide the inventory item ID, the location ID where you want to adjust the inventory level, and the available number. That available number will be used to overwrite any existing inventory level that exists. So if you want to change an item's inventory from 10 to 102, then set this number to 102.
Authorizing the Shopify integration and managing multiple stores
To use the Pull from Shopify or Send to Shopify steps, you'll need to first authorize Parabola to connect to your Shopify store.
To start, you will need your Shopify shop URL. Take a look at your Shopify store, and you may see something like this: awesome-socks.myshopfy.com - from that you would just need to copy awesome-socks to put into the first authorization prompt:
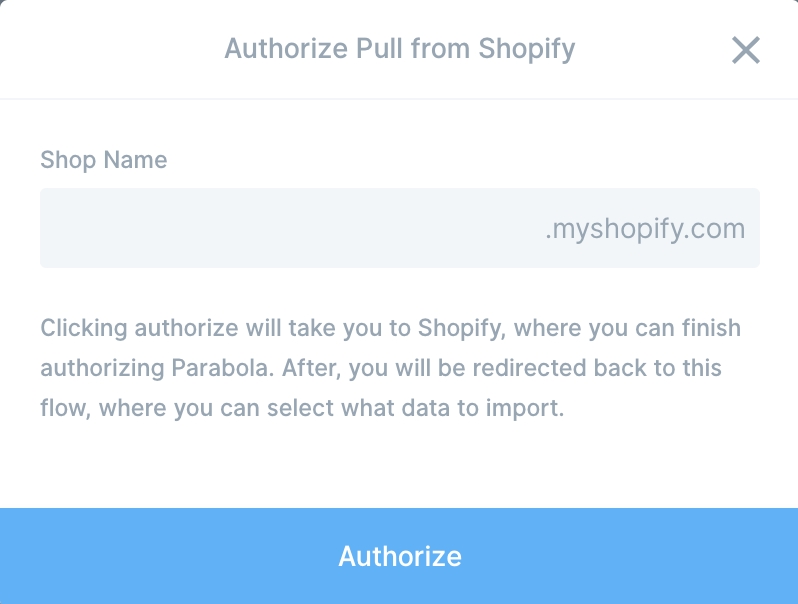
After that, you will be shown a window from Shopify, asking for you to authorize Parabola to access your Shopify store. If you have done this before, and/or if you are logged into Shopify in your browser, this step may be done automatically.
Parabola handles authorization on the flow-level. Once you authorize your Shopify store on a flow, subsequent Shopify steps you use on the same flow will be automatically connected to the same Shopify store. For any new flows you create, you'll be asked to authorize your Shopify store again.
Editing your authorization
You can edit your authorizations at any time by doing the following:
- Open your Pull from Shopify or Send to Shopify step.
- Click on the authorization dropdown near the top of the result view.
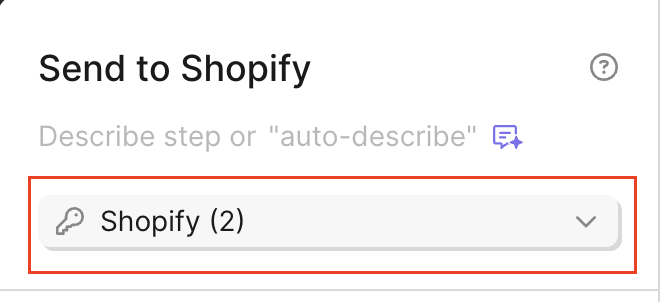
- Click on "Edit accounts" at the bottom of the dropdown.
- Click the three dots next to the Shopify Auth that you are currently using or want to edit.
- We recommend that you rename your Account Name so you can easily keep track of which Shopify store you're connected to.
Managing multiple Shopify stores in a single flow
If you manage multiple Shopify stores, you can connect to as many separate Shopify stores in a single flow as you need. This is really useful because you can combine data from across your Shopify-store and create wholistic custom reports that provide a full picture of how your business is performing.
Adding an authorization for another Shopify Store
- Open your Pull from Shopify or Send to Shopify step.
- Click on authorization dropdown at the top of the result view.
- Click on "Add new account" in the dropdown.

- Another authorization window will appear for you to authorize to a different store. Don't worry, connecting to a different store in one Shopify step will not impact the already-connected Shopify steps already on your flow.
- The "Edit Accounts" menu is how you can switch which account a step is pulling from or pushing to. We recommend renaming the Account Name of your various Shopify accounts so it's easier to toggle in between your different accounts.
Deleting a Shopify account from authorization
Please note that deleting a Shopify account from authorization will remove it from the entire flow, including any published versions.
- Open your Pull from Shopify or Send to Shopify step.
- Click on authorization dropdown near the top of the result view.
- Click Edit accounts.
- Click on the three dots next to the Shopify account that you'd like to remove authorization for and choose the delete option.
Understanding the data filters in the Pull from Shopify step
This article goes over the date filters available in the Pull from Shopify step.
The Orders and Customer pulls from the Pull from Shopify step have the most complex date filters. We wanted to provide lots of options for filtering your data from within the step to be able to reduce the size of your initial import and pull exactly the data you want to see.
Date filters can be a little confusing though, so here's a more detailed explanation of how we've built our most complex date filters.
The date filters in the Pull from Shopify step, when available, can be found the bottom of the lefthand side, right above the "Show Updated Results" button.
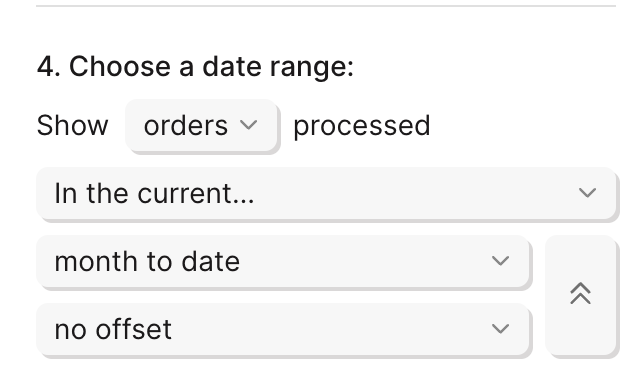
The first date filter you can set is:
- within the previous # day, hour, week, or month
- based on when the flow is run or the most recently completed day
- You can also add an offset to the previous period or previous year
- Example 1: If today is August 17, 2020, and I select within the previous 1 day based on the most recently completed day with no offset, the date range used would be August 16, 2020 12:00am PDT -August 17, 2020 12:00am PDT. Since August 16, 2020 was the most recently completed day, it's pulling in data from that day.
- Example 2: If today is August 17, 2020, and I select within the previous 1 week based on when the flow is run offset to the previous period, the date range used would be August 3, 2020 - August 10, 2020. This is temporarily calculated based on the assumption that I'll run my flow soon. It will be automatically recalculated at the time I actually run my flow. The previous one week from today would be August 10, 2020-August 17, 2020. Since I'm offsetting to the previous period (one week), the date range is pulling data from the week prior.
- Example 3: If today is August 17, 2020, and I select within the previous 1 month based on the most recently completed month offset to the previous year, the date range used is July 1, 2019 12:00am PDT - August 1, 2019 12:00am PDT. The most recently created month will be July 2020 and I want to pull data from that month. By offsetting to the previous year, I see data from July 2019.
The second date filter you can set is:
- within the current day to date, week to date, month to date, year to date
- You can add an offset to the previous period or previous year.
- Example 1: If today is August 17, 2020, and I select within the current month to date with no offset, the date range used will be August 1, 2020-August 17, 2020.
- Example 2: If today is August 17, 2020, and I select within the current year to date with offset to the previous period, the date range used will be January 1, 2019-August 17, 2019. The previous period in this situation is the same time frame, just the year before.
- Example 3: If today is Tuesday, August 17, 2020 and I select within the current week to date with offset to the previous year, the date range used will be August 16, 2019-August 17, 2019. Week to date is calculated from Sunday being the first day of the week. Offsetting to the previous year will take the same dates, but pull data from those date from the previous year.
The third date filter you can set is:
- after x date
- Example: after January 1, 2020
The fourth and last date filter you can set is:
- between x and y dates
- Example: between January 1, 2020 and June 30, 2020
Time zones
In this step, we indicate what time zone we're using to pull your data. This time zone matches the time zone selected for your Shopify store.
Confirming the date range
At the bottom of the lefthand panel of your step, if you're still uncertain if you've configured the date filters correctly, we have a handy helper to confirm the date range we'll use to filter in the step:

Replicating Shopify metrics in Parabola
This article explains how to reproduce the most commonly-used Shopify metrics. If you don't see the metric(s) you're trying to replicate, send us a note and we can look into it for you.
The Shopify Overview dashboard is full of useful metrics. One problem is that it doesn't let you drill into the data to understand how it's being calculated. A benefit of using Parabola to work with your Shopify data is that you can easily replicate most Shopify metrics and see exactly how the raw data is used to calculate these overview metrics.
Total Sales by line items
This formula will show you the total sales per line item by multiplying the price and quantity of the line items sold.
Import Orders with Line Items details
{Line Items: Quantity} * {Line Items: Price}
Total Refunds by line items
This formula will show you the total refund per line item by multiplying the refunded amount and refunded quantity. In this formula, we multiply by 1 to turn it into a negative number. If you'd like to display your refunds by line items as a positive number, just don't multiply by 1.
Import Orders with Line Items details
{Refunds: Refund Line Items: Quantity} * {Refunds: Refund Line Items: Subtotal}*-1
Net quantity
This formula will show you the net quantity of items sold, taking into account and removing the items that were refunded.
Import Orders with Line Items details
First, use the Sum by group step to sum "Line Items: Quantity" and "Refunds: Refund Line Items: Quantity"
Then, use the newly generated "sum" columns for your formula.
{Line Items: Quantity (sum)}-{Refunds: Refund Line Items: Quantity (sum)}
Gross sales
Import Orders with Orders details.
Add a Sum by group step. Sum the "Total Line Items Price" column.
Net sales
Import Orders with Orders details.
To calculate net sales, you'll want to get gross sales - refunds - discounts. This will require two steps:
- Add a Sum by group step and sum the following columns: "Total Line Items Price", "Total Refunded Amount", and "Total Discounts".
- Add an Insert Math Column step and add in the following equation:
{Total Line Items Price (sum)}-{Total Refunded Amount (sum)}-{Total Discounts (sum)}
Total sales
Import Orders with Line Items details.
To calculate total sales, you'll want to get gross sales + taxes - refunds - discounts. This will require three steps:
- Add an Insert math column step and add in the following equations to get gross sales and call the column, "Sales":
{Line Items: Quantity} * {Line Items: Price}
- Add in a Sum by group step and sum the following columns: {Sales}, {Line Items: Total Discount Allocations}, {Refunds: Refund Line Items: Subtotal}, {Line Items: Total Tax Lines}, and {Refunds: Refund Line Items: Total Tax}.
- Add in an Insert math column step with the following equation:
{Sales (sum)} + ({Refunds: Refund Line Items: Subtotal}*-1) - {Line Items: Total Discount Allocations (sum)} + ({Line Items: Total Tax Lines (sum)} - {Refunds: Refund Line Items: Total Tax (sum)})
Total refunds
Import Orders with Orders details.
- Add a Sum by group step and sum the following column: "Total Refunded Amount".
Total discounts
Import Orders with Orders details.
- Add a Sum by group step and sum the following column: "Total Discounts".
Total tax
Import Orders with Orders details.
- Add a Sum by group step and sum the following column: "Total Tax".
Average order value
Import Customers. This table will give us Total Spent per customer as well as the # of Orders by customer.
- Add a Sum by group step and sum the columns: {Orders Count} and {Total Spent}.
- Add an Insert math column step and use the following calculation:
{Total Spent (sum)} / {Orders Count (sum)}.
Alternatively, import Orders.
- Add an Insert math column step and create a new column called Orders with the following calculation: =1
- Add a Sum by group step and sum the columns: Orders and Total price
- Add an Insert math column step and create a new column called Average Order Value and use the following calculation:
{Total Price (sum)} / {Orders (sum)}
Number of orders
Use the Count by group step after pulling in orders.