Prepare the data you visualize in Tableau
Discover how Parabola's automated workflow platform complements Tableau by streamlining data preparation and ensuring consistent, analysis-ready data.
What's the difference between Parabola and Tableau?
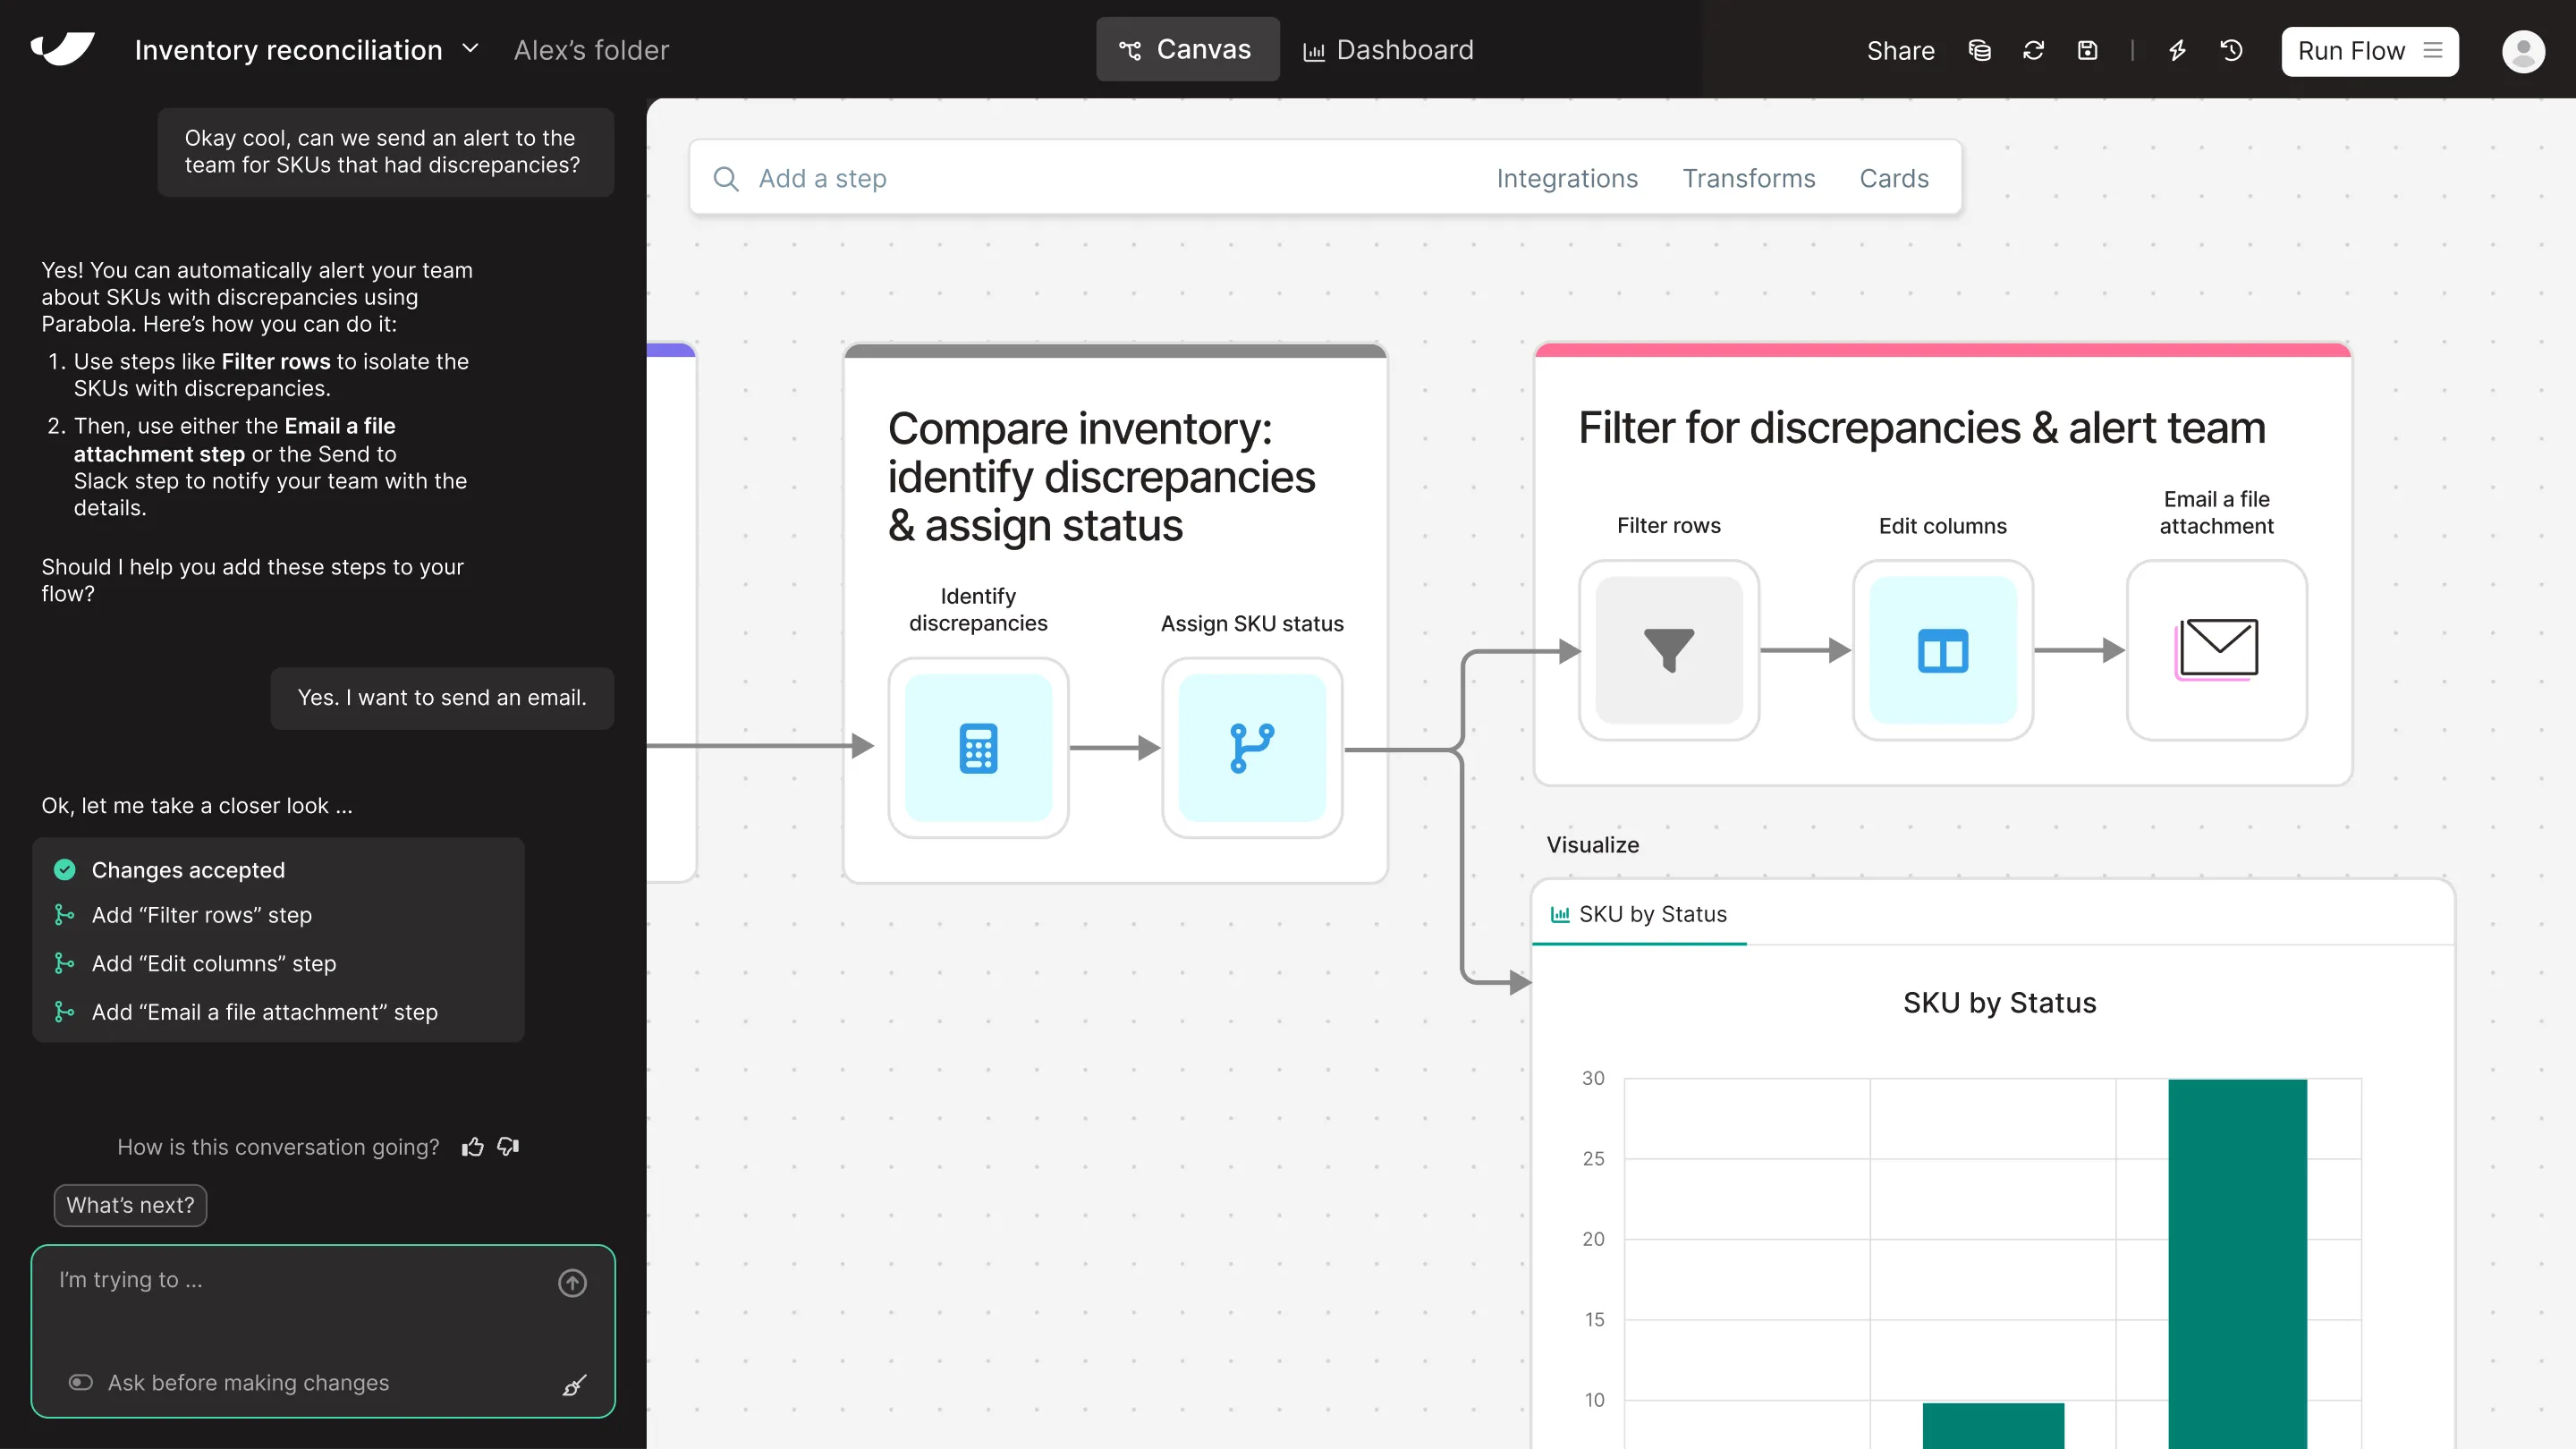
Tableau helps you visualize data—but not prepare it. Most Tableau users still rely on Excel to do the hard work of cleaning and shaping data before it ever reaches a dashboard. Parabola speeds up that entire process by letting spreadsheet users automate data consolidation and cleanup––no need to wait for IT to maintain pipelines or troubleshoot mismatched data. Additionally, with Parabola, users can build dashboards and visualizations that match what they have in Tableau.
Get a demo


Parabola vs Tableau feature comparison


Looking for a Tableau alternative?
Prove the ROI with Parabola before you're invoiced
and try our risk-free, 45-day proof of concept.
Turn messy data into automated workflows with Parabola.
Parabola vs. Tableau FAQ
Parabola automates the data cleaning and transformation processes that must happen before data reaches Tableau. While Tableau focuses on visualization, Parabola ensures your data is automatically prepared and structured for analysis.
Parabola automates the entire data pipeline, eliminating manual updates. Unlike Tableau, which requires prepared data sources, Parabola automatically processes raw data into analysis-ready formats on schedule.
Absolutely! Parabola complements Tableau by automating data preparation and updates. Our platform ensures your Tableau visualizations always have fresh, properly formatted data to work with.
While Tableau specializes in visualization, Parabola handles the critical data operations that happen first. Our visual interface makes complex data preparation accessible to business users without technical expertise.
Parabola is purpose-built to handle raw, messy data—automating the process of cleaning, filtering, and structuring it for analysis. While Tableau Prep can process some raw inputs, it’s primarily designed for manual workflows and assumes semi-structured data. Parabola’s automated approach ensures that even unstructured or API-driven data is transformed and ready for visualization with minimal effort.
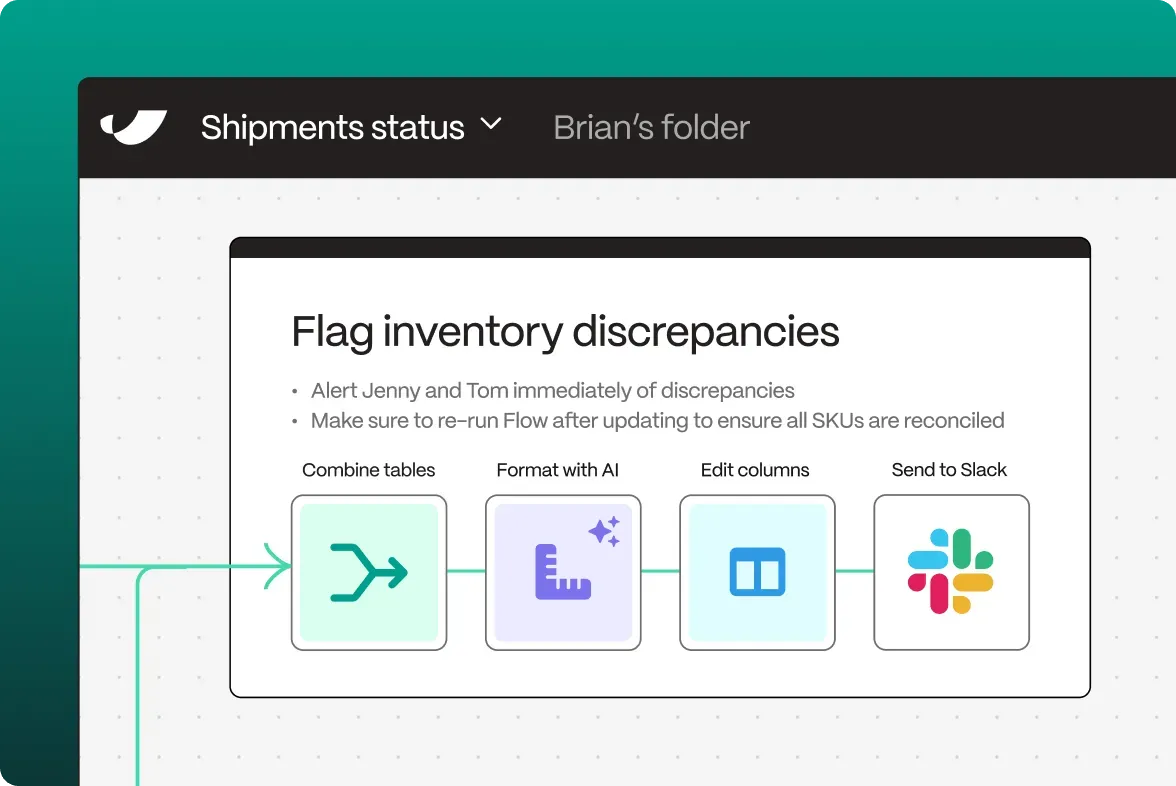
Parabola automates the entire data pipeline for your reports, ensuring consistent data preparation before it reaches Tableau. This eliminates manual data prep and ensures your visualizations always have fresh data.