Parabola's Hapag-Lloyd API enables businesses to automate their container shipping operations and maritime logistics workflows. This powerful connection allows companies to streamline their shipping processes and maintain visibility across their global container movements.
How do I connect via API?
- Connect your Hapag-Lloyd account to Parabola by navigating to the integrations page and selecting Hapag-Lloyd from the available options
- Authenticate your account using your Hapag-Lloyd credentials and grant necessary permissions
- Select the data you want to pull from Hapag-Lloyd (container tracking, shipping schedules, documentation, etc.)
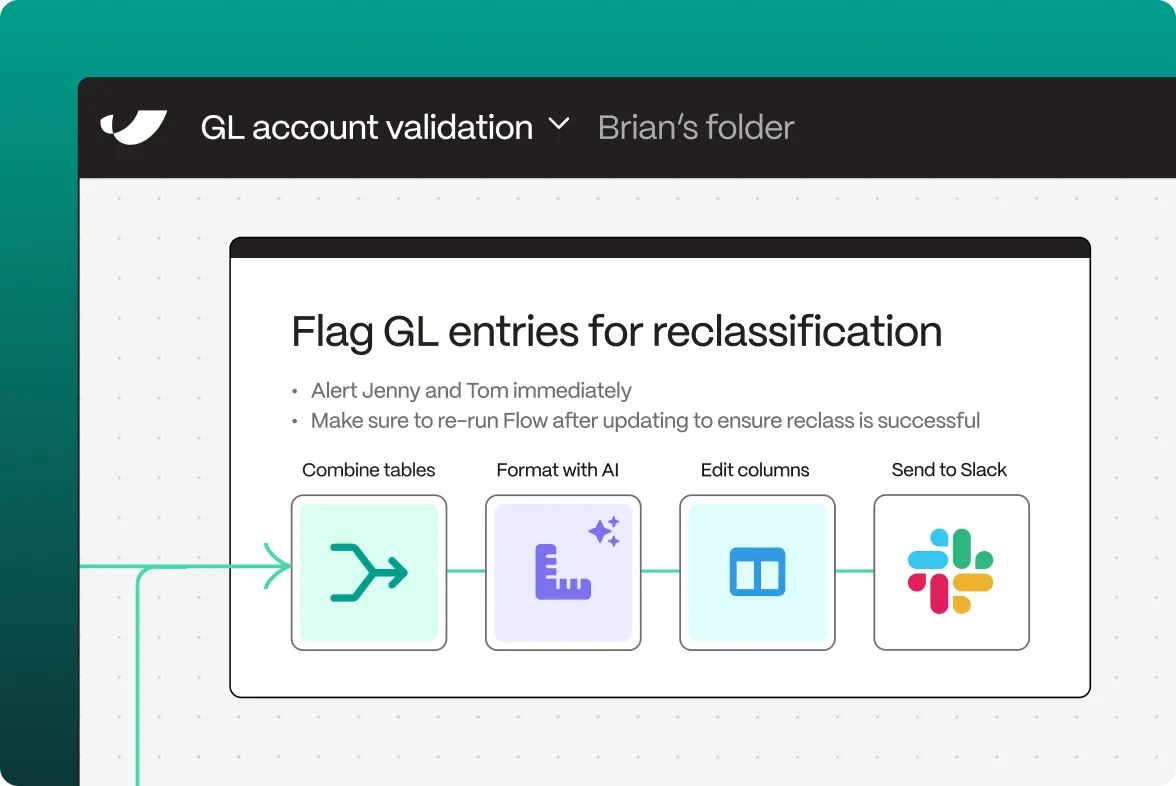
- Configure your flow in Parabola by adding transformation steps to process your shipping data
- Set up automated triggers to run your flow on a schedule or when new data is available
What is Hapag-Lloyd?
Hapag-Lloyd is one of the world's leading container shipping companies, founded in 1847 in Hamburg, Germany. With a fleet of over 250 modern container ships and a comprehensive network of services, they connect all major ports worldwide.
What does Hapag-Lloyd do?
Hapag-Lloyd specializes in container shipping services, providing comprehensive maritime transportation solutions. They offer services including container transport, special cargo handling, and digital shipping management through their online platform, with particular expertise in reefer container operations.
What can I do with the API connection?
Container Movement Analytics
Create automated workflows to track and analyze container movements across global shipping routes, optimizing cargo flows and equipment utilization.
Reefer Monitoring Automation
Generate automated reports tracking temperature-controlled container performance and compliance across different trade lanes.
Schedule Reliability Analysis
Automate the collection and analysis of vessel schedule performance data, helping optimize shipping planning and reliability metrics.