Tableau's API gives you direct access to your business intelligence and data visualization assets. By pulling Tableau data into Parabola, you can create smarter, more efficient processes for managing your analytics and reporting workflows.
How to pull data from Tableau into Parabola via API
- Connect your Tableau account to Parabola through the API page
- Authenticate using your credentials and configure API permissions
- Select desired data streams (workbook data, dashboard metrics, user analytics, etc.)
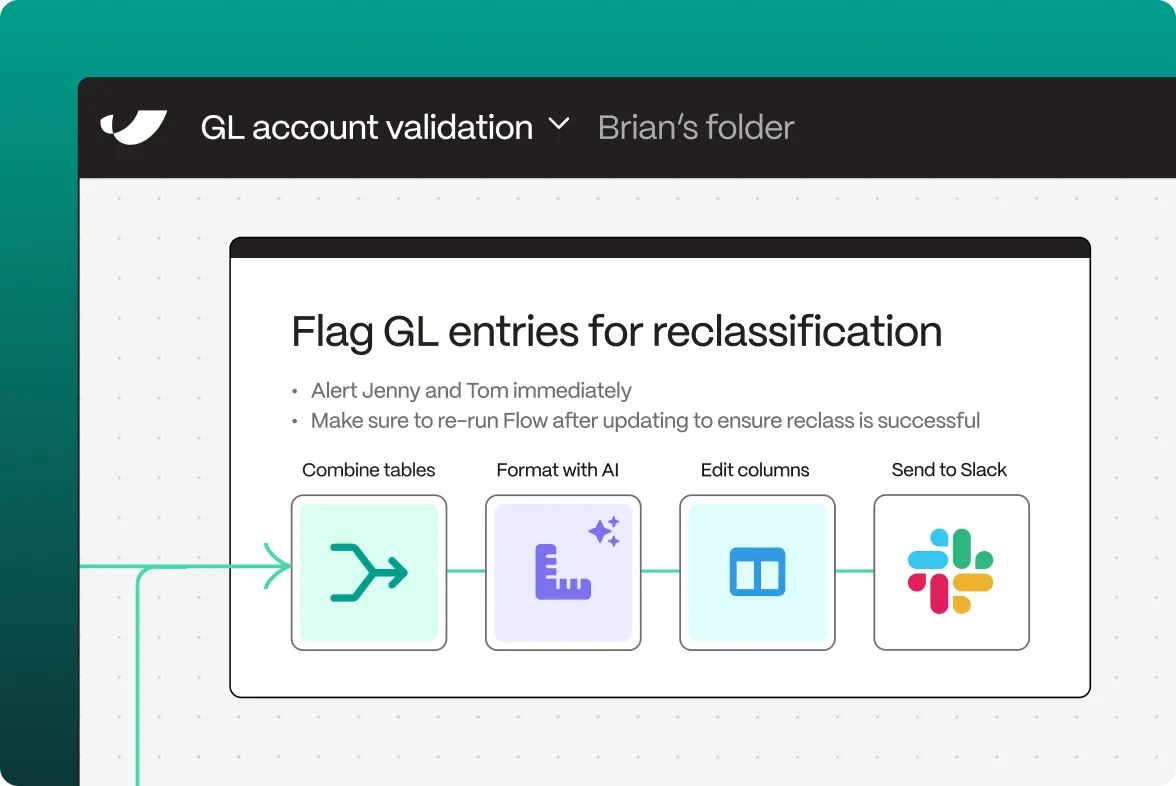
- Configure your flow in Parabola by adding transformation steps
- Set up automated triggers for real-time data processing
What can I do after connecting Parabola to Tableau?
Dashboard Management
Access comprehensive data about your Tableau dashboards and visualizations. The API enables you to monitor dashboard usage, track performance metrics, and understand how your analytics are being utilized across your organization.
Key dashboard metrics include:
• Usage statistics and views
• Performance indicators
• User interaction data
• Load time analytics
Workbook Analytics
Monitor and analyze your Tableau workbooks to optimize their performance and value. Track how different teams use your analytics and identify opportunities for improvement.
Essential workbook data includes:
• Resource utilization
• Query performance
• Data source connections
• Refresh status
User Engagement
Transform your Tableau usage data into actionable insights about analytics adoption and effectiveness. Understand how your organization leverages business intelligence tools and identify areas for enhancement.
Track important metrics such as:
• User adoption rates
• Content popularity
• Report utilization
• Access patterns
What is Parabola?
Parabola is a powerful no-code automation platform that helps businesses work smarter with their data. We make it easy to:
• Pull data from various sources, including APIs like Tableau
• Transform and clean data automatically
• Create custom workflows without coding
• Schedule automated data updates
• Build powerful business solutions
What is Tableau?
Tableau is a leading visual analytics platform that helps people and organizations make data-driven decisions. It's widely used by businesses that need to transform complex data into clear, actionable insights through interactive visualizations.
What does Tableau do?
Tableau transforms raw data into intuitive visual insights. The platform enables users to create interactive dashboards and reports that make complex data accessible and meaningful for decision-makers across organizations.
The platform specializes in:
• Interactive data visualization
• Business intelligence reporting
• Data exploration and analysis
• Performance analytics
These capabilities work together to help organizations understand their data and make informed decisions based on clear visual insights.