Combining tables

The Combine tables step allows you to join together two tables based on one or more unique identifiers. This step is Parabola’s equivalent of Excel’s “VLOOKUP” and “INDEX MATCH” — without the tricky syntax.
How to use the step
- Drag a Combine tables step onto the canvas.
- Specify rules for keeping rows from inputs 1 and 2.
- The most common approach is to keep all rows from one table, and find only matching rows from another table.
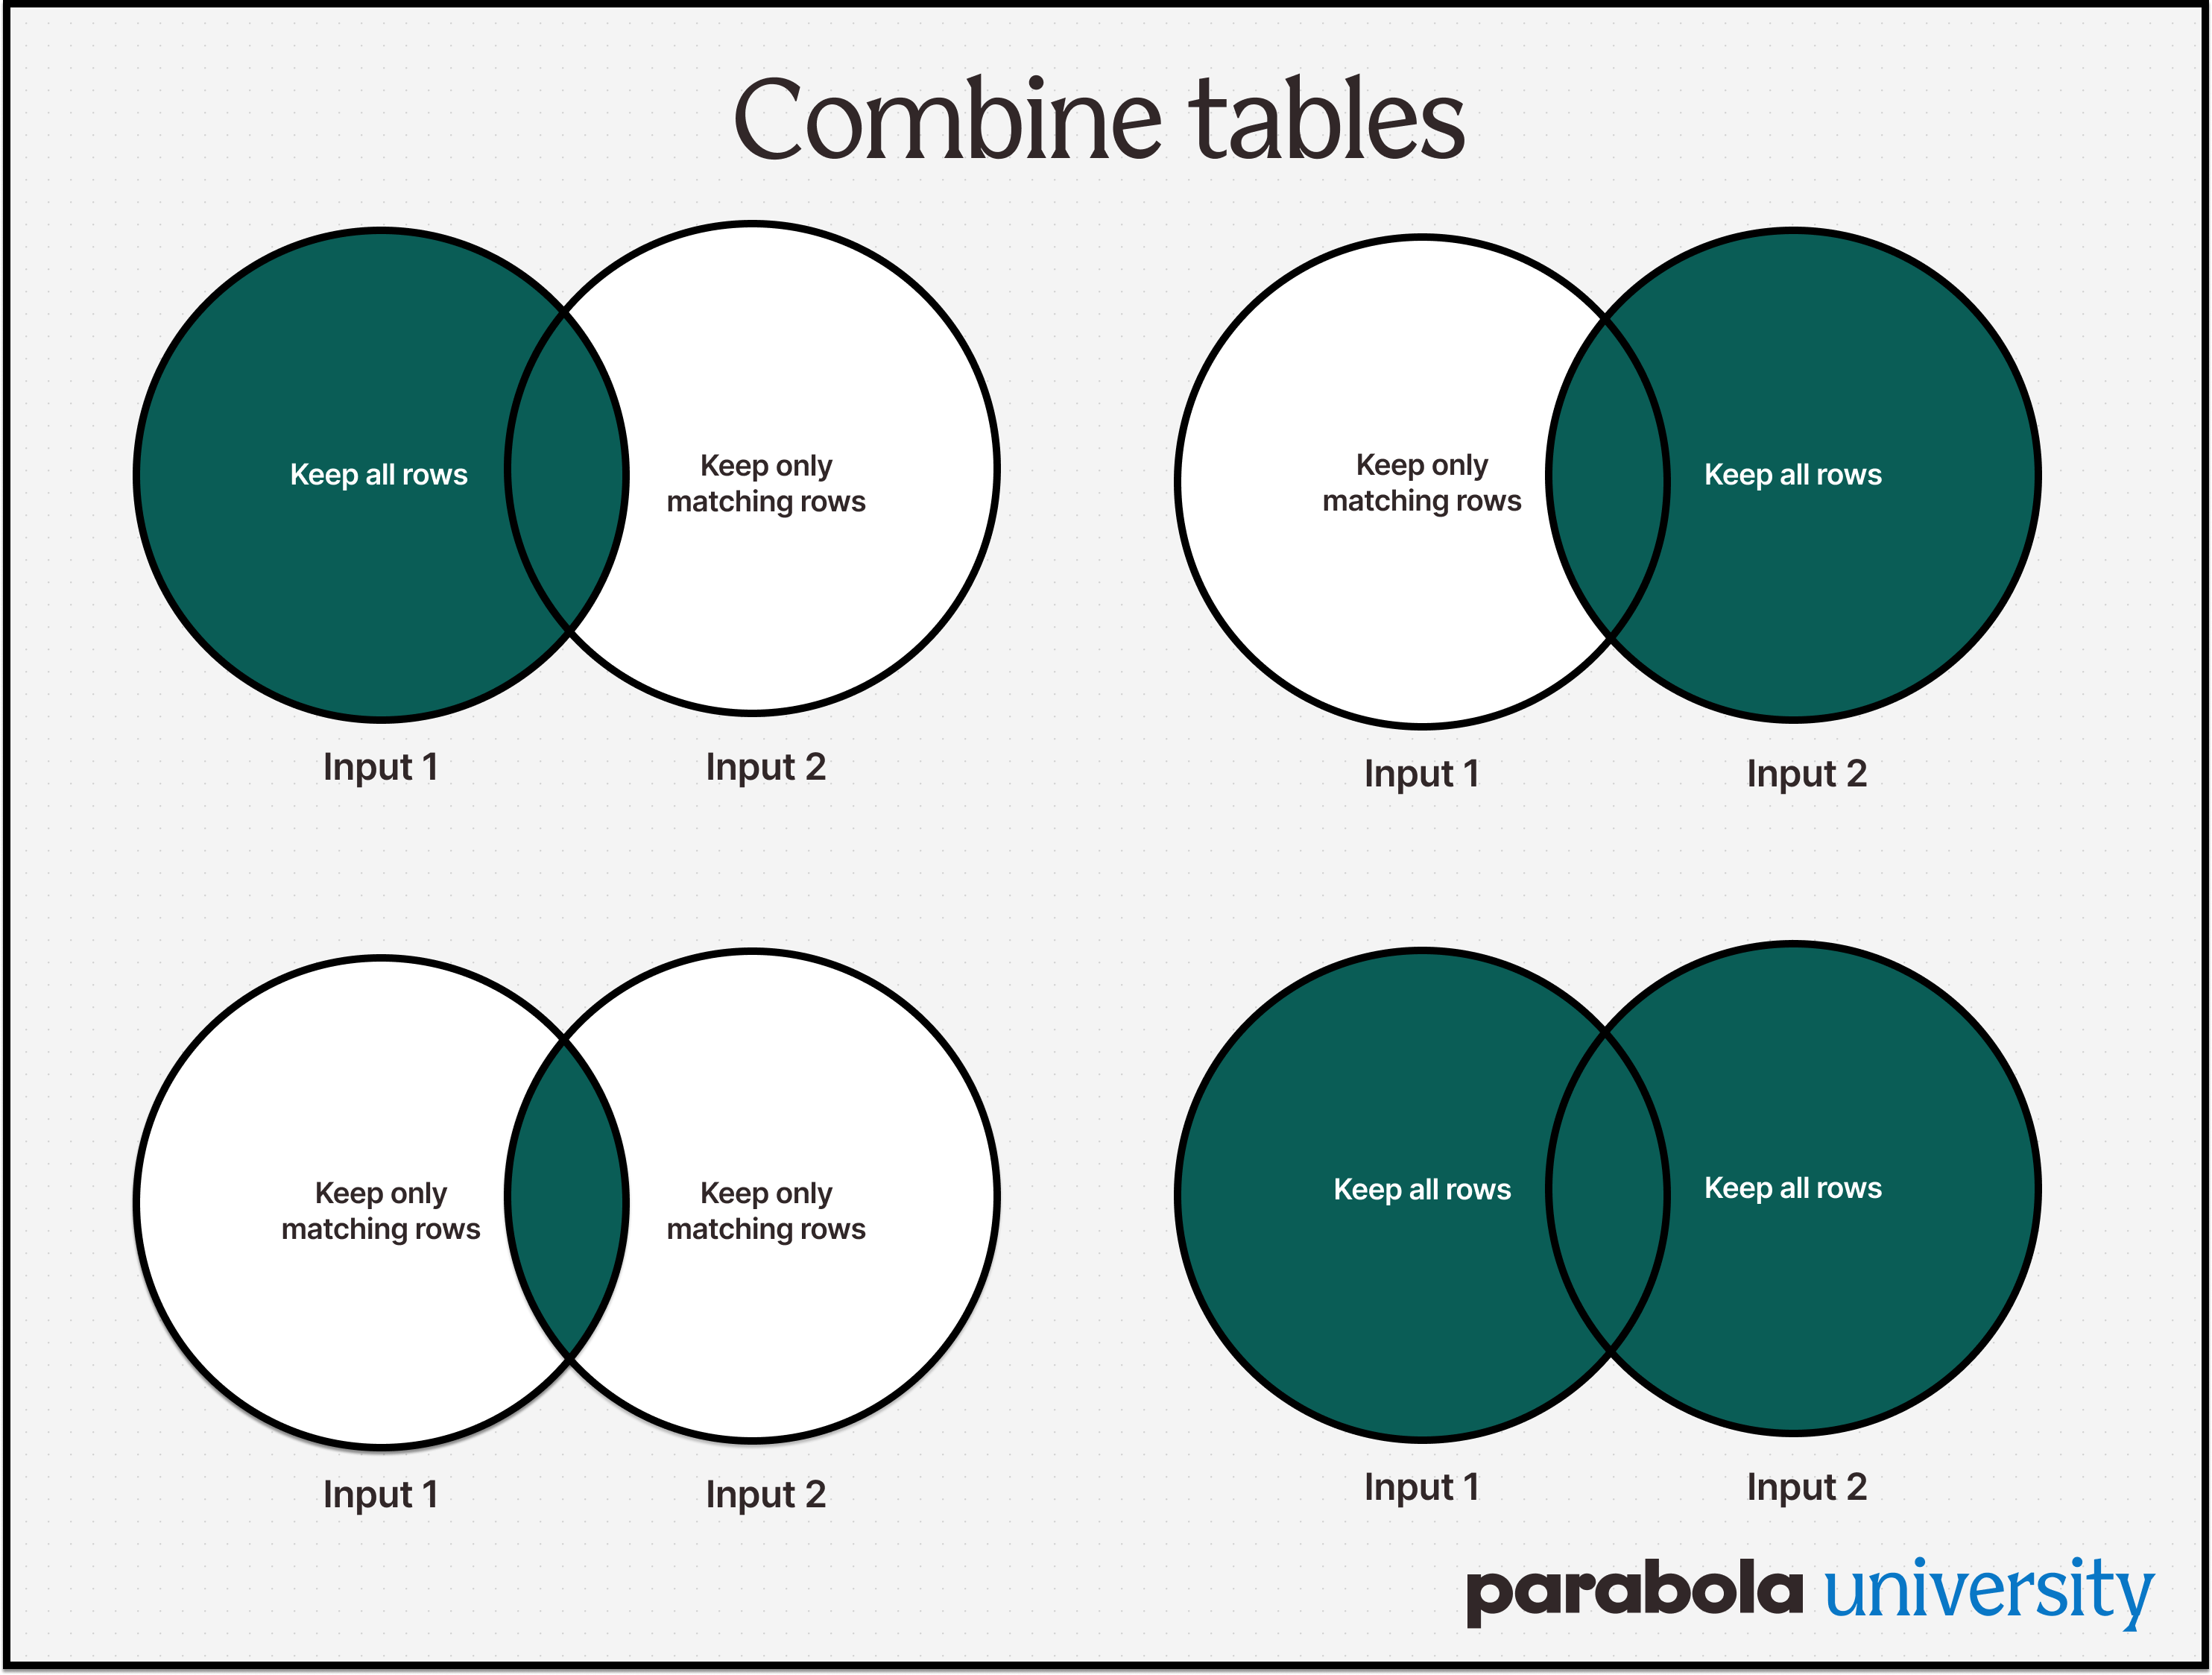
- Check out the visual below for an overview of the four different types of join options.
- Tell Parabola which column(s) to use for the join.
- This will often be something like a unique ID, email address, SKU, etc.
- If you are joining on multiple columns (like SKU and Warehouse), click the + add a match button and specify the criteria for your additional join(s).
- Make sure to specify whether this is an Any match or an All match.

Pro tip
- The input step that you connect first will always be Input 1.
- Keep an eye on the number of rows in your input datasets and Results view. If you have more rows than expected in your Results view, you likely need to edit the settings in the step.
- Understanding the concepts behind joining data is the hardest part. Remember: There’s no mistake that you can make in Parabola that you can’t just undo.
To learn more, check out our support docs.
Using the Combine Tables Step in Parabola
If you’ve ever struggled with VLOOKUP, INDEX MATCH, or SQL JOIN statements, you’ll love the Combine Tables step in Parabola. It makes merging datasets simple while keeping everything clearly documented in your flow.
Two Ways to Combine Data in Parabola
Parabola offers two steps for merging datasets:
- Combine Tables (this step) – Used when you want to add matching columns from one dataset to another.
- Stack Tables – Used when you want to stack rows from two datasets into a single table.
Joining Data with Combine Tables
To get started:
- Connect two datasets to the Combine Tables step.
- Define how you want to join the data:
- Keep all rows from one dataset and find only matching rows from the other (most common).
- Keep only matching rows from both datasets.
- Keep all rows from both datasets (full outer join).
Example 1: Matching Orders with Customer Data
In this example, we have:
- Recent Orders Dataset (customers who ordered last week)
- Historic Customers Dataset (all-time customer list with total spend)
We only want to keep recent orders and pull in their matching historic customer data:
- Keep all rows from Orders.
- Only match rows from Historic Customers.
- Join on the Customer column.
- Show Updated Results → Now the total spend column is added to our Orders dataset.
Example 2: Assigning Pick Locations for Warehouse Orders
In this case, we need to assign warehouse pick locations based on:
- Orders Dataset (SKU, Warehouse, Units Purchased).
- SKU Locations Dataset (SKU, Warehouse, Pick Location).
If we only join on SKU, we might get incorrect matches because SKUs exist in multiple warehouses.
- Instead, we must join on both SKU and Warehouse to ensure we match the right warehouse’s pick location.
Key mistake to avoid:
- If you match only on SKU, you may duplicate orders across multiple warehouse locations.
- Ensure that all conditions match by selecting “Match on all keys” instead of “Match on any key”.
- Once applied, the data is correctly merged without duplications.
Pro Tip: Avoiding Data Duplication
- If you notice duplicate rows, check whether your join conditions include all necessary columns.
- Use Match on all keys instead of Match on any key for more precise merging.
Try It Yourself!
Experiment with the Combine Tables step in the building challenge below. The more you use this step, the more comfortable you’ll get! 🚀