
1. Pull fulfillment data from each retailer. Walmart Retail Link, Target POL, Ulta portal, EDI 856 ASN. Each gets its own pipeline.
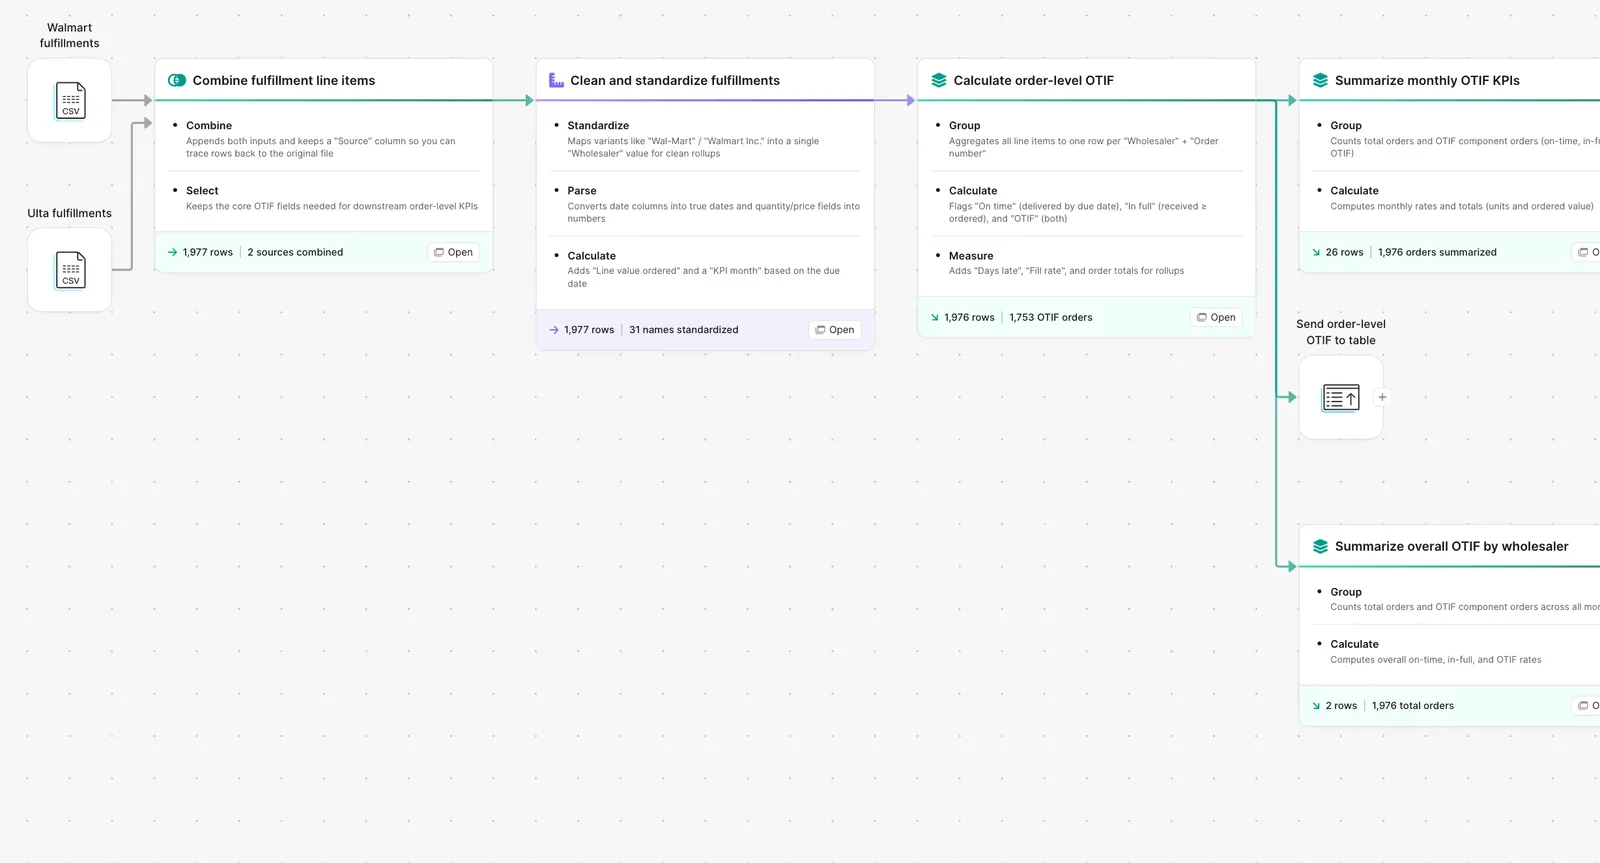
2. Standardize the schema. PO, ship date, must-arrive-by, quantity ordered, quantity shipped, quantity received. Same fields across retailers.
3. Calculate on-time per order. Did the order ship within the window the retailer required.
4. Calculate in-full per order. Did the order ship the quantity the retailer ordered.
5. Roll up to monthly KPIs by retailer. OTIF rate, on-time rate, in-full rate, dispute rate.
6. Output the scorecard. Per-retailer monthly KPI table plus an exception view for orders that missed the window.