New: Data Tracing, Email a PDF, Prowork File Uploads, and a SharePoint Integration

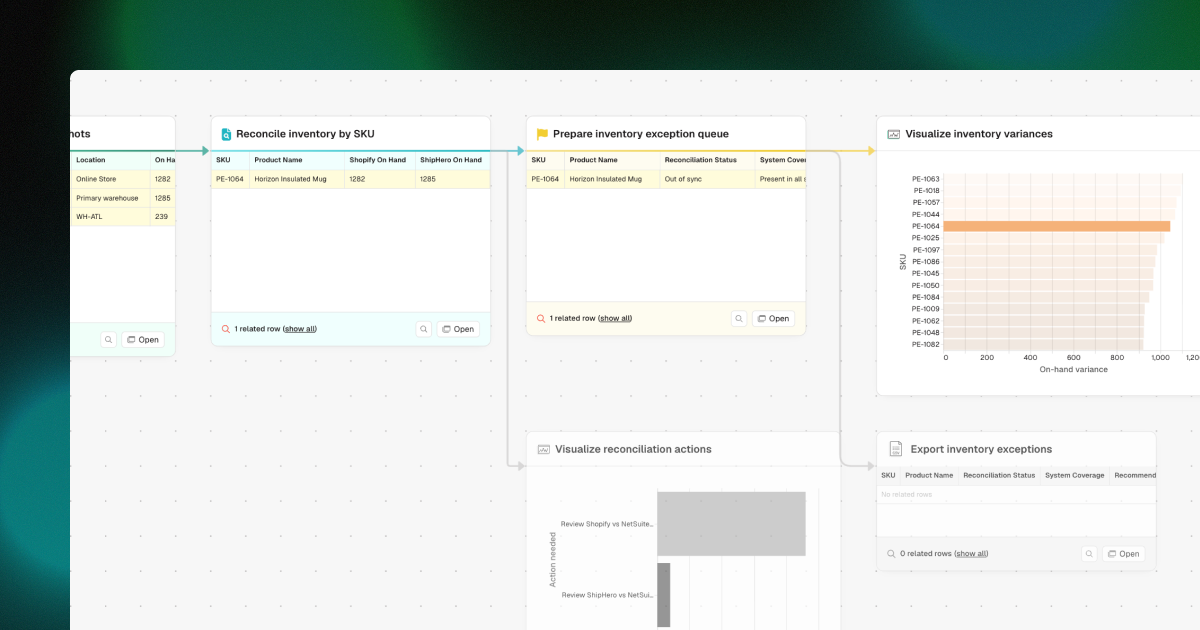
Out with the heat waves, in with a wave of new Parabola product updates. Featured this release: Data tracing, an Email a PDF step, file uploads in Prowork chat, and our new SharePoint integration, plus a handful of other improvements across the product. Here's everything that's new.
Data tracing
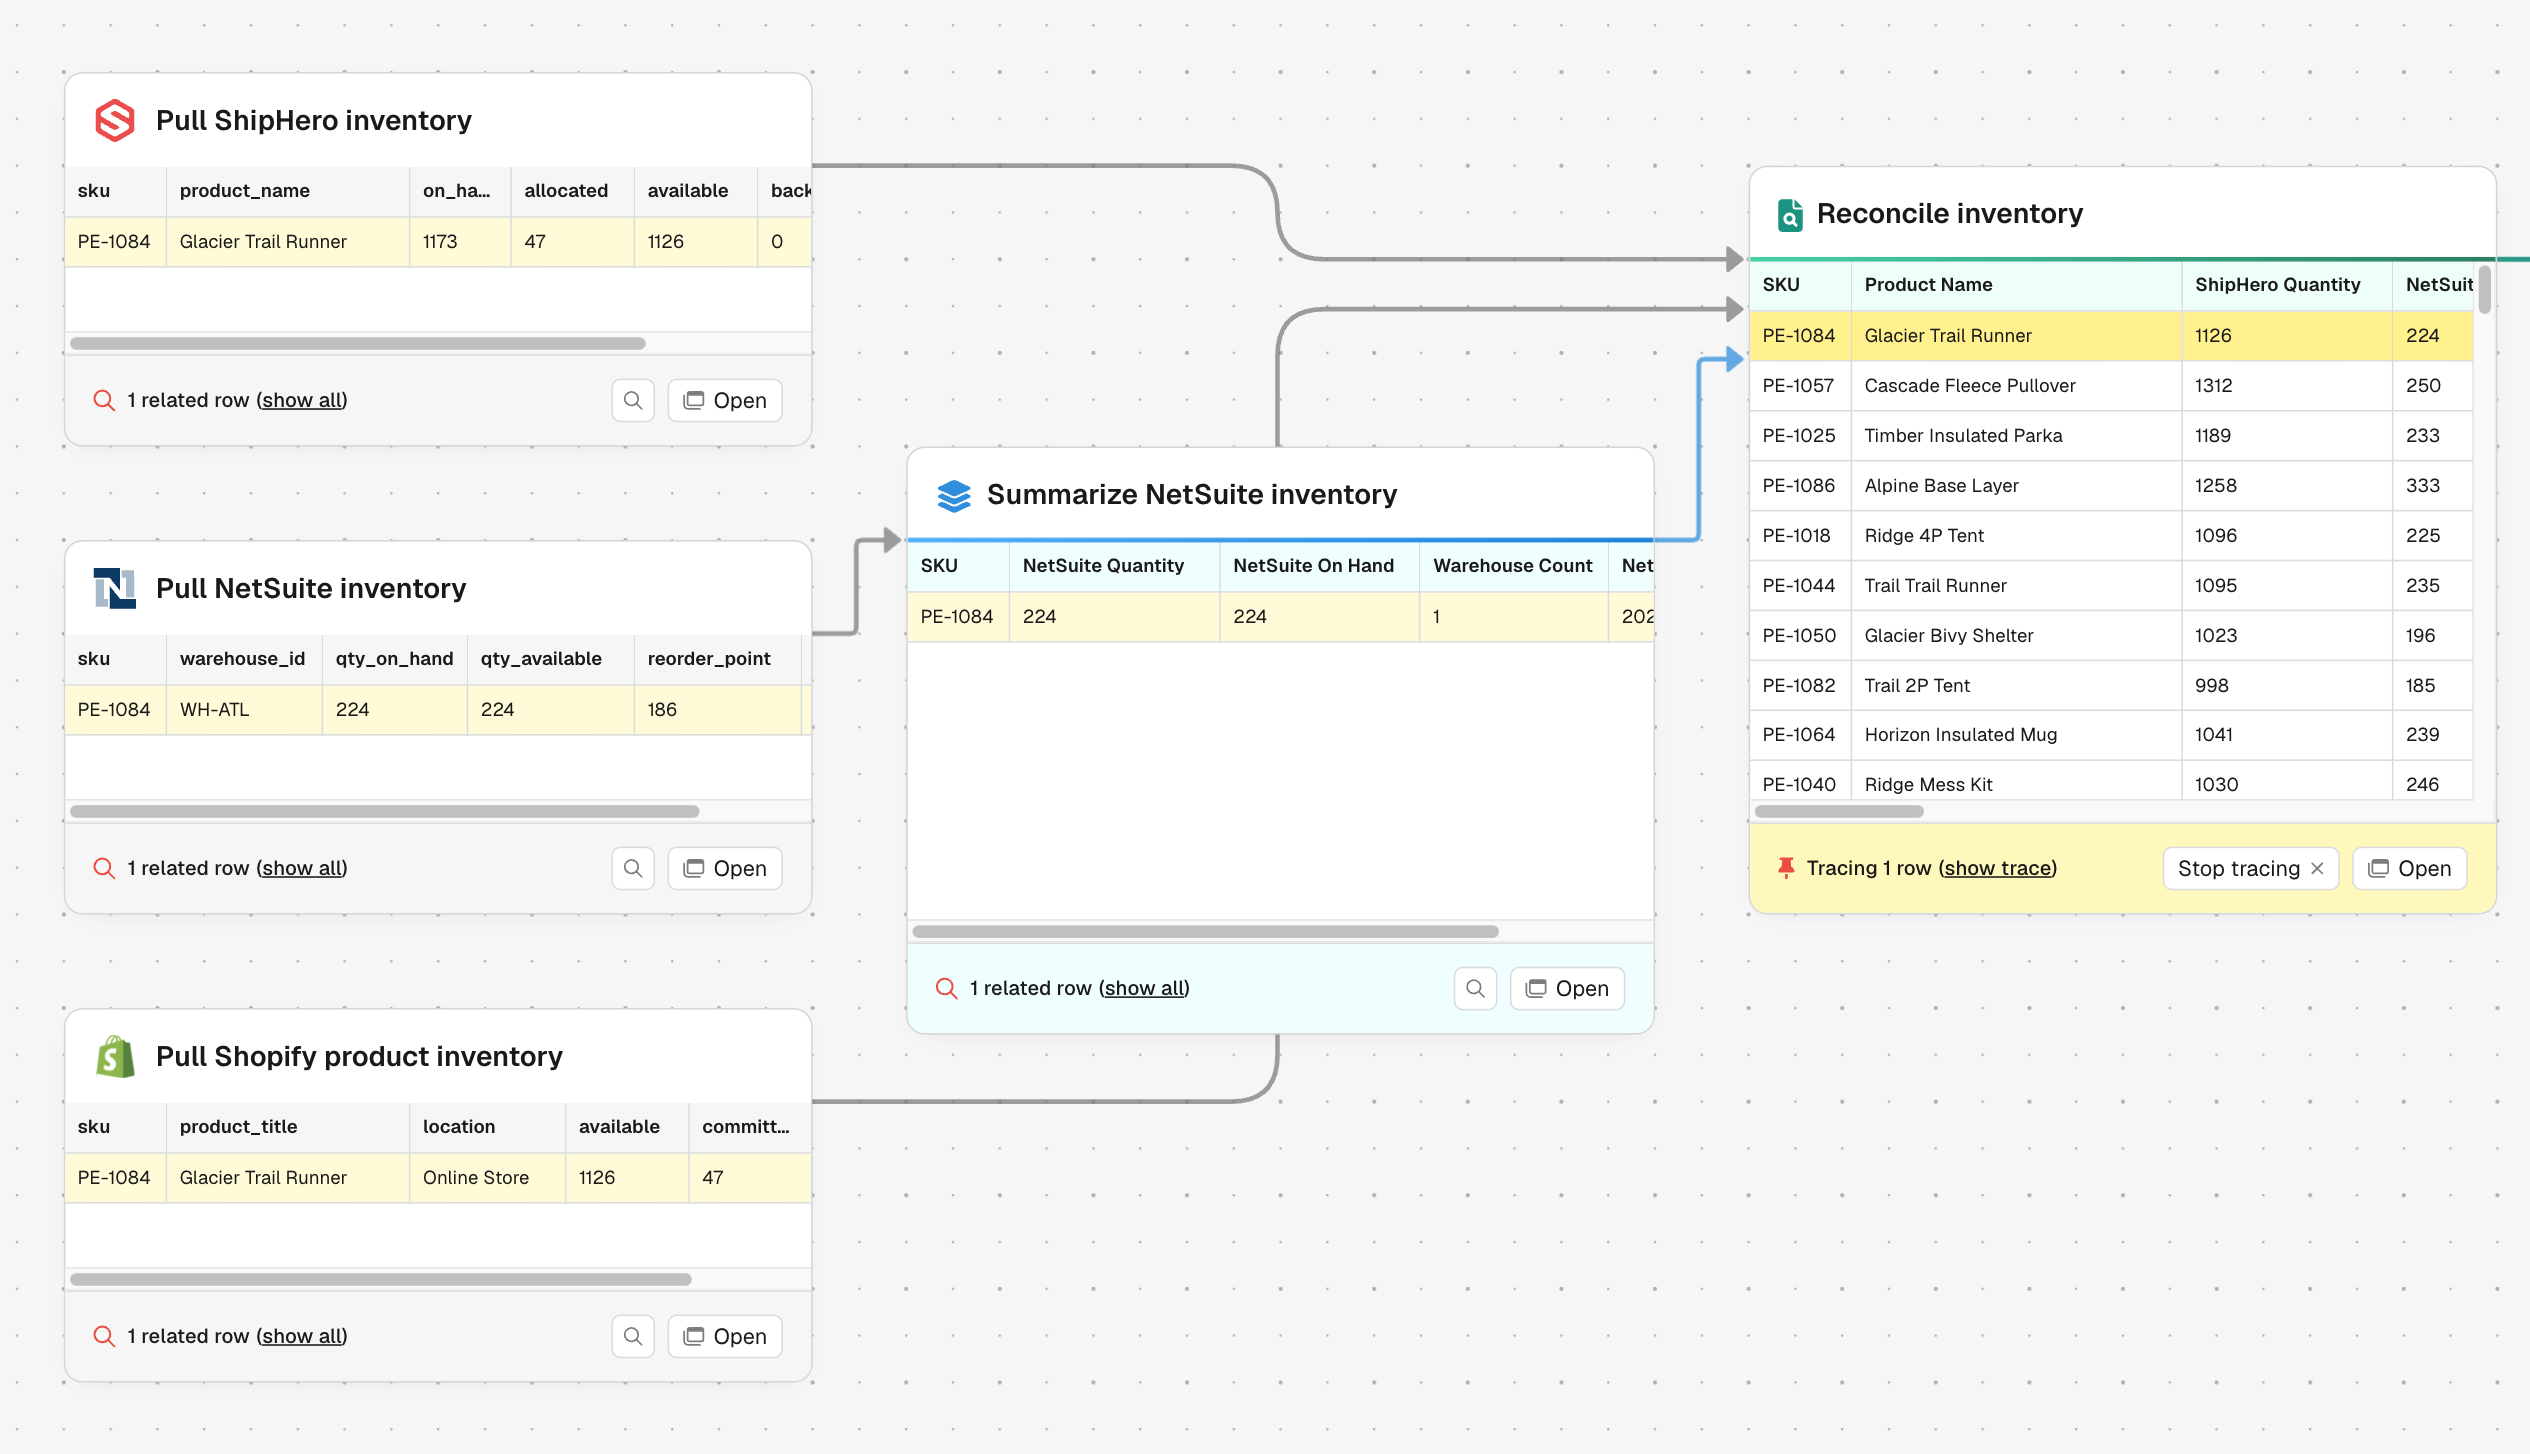
Generic LLM tools are black boxes. You get a result, but you can't explain how you got there, which makes audits near-impossible and puts your critical processes at risk. Data tracing changes that. Parabola now automatically maps your data's journey through a flow: pick a row, and every related row lights up across the connected steps, so you can see exactly how your data evolves.
Generate and email PDFs from your flow
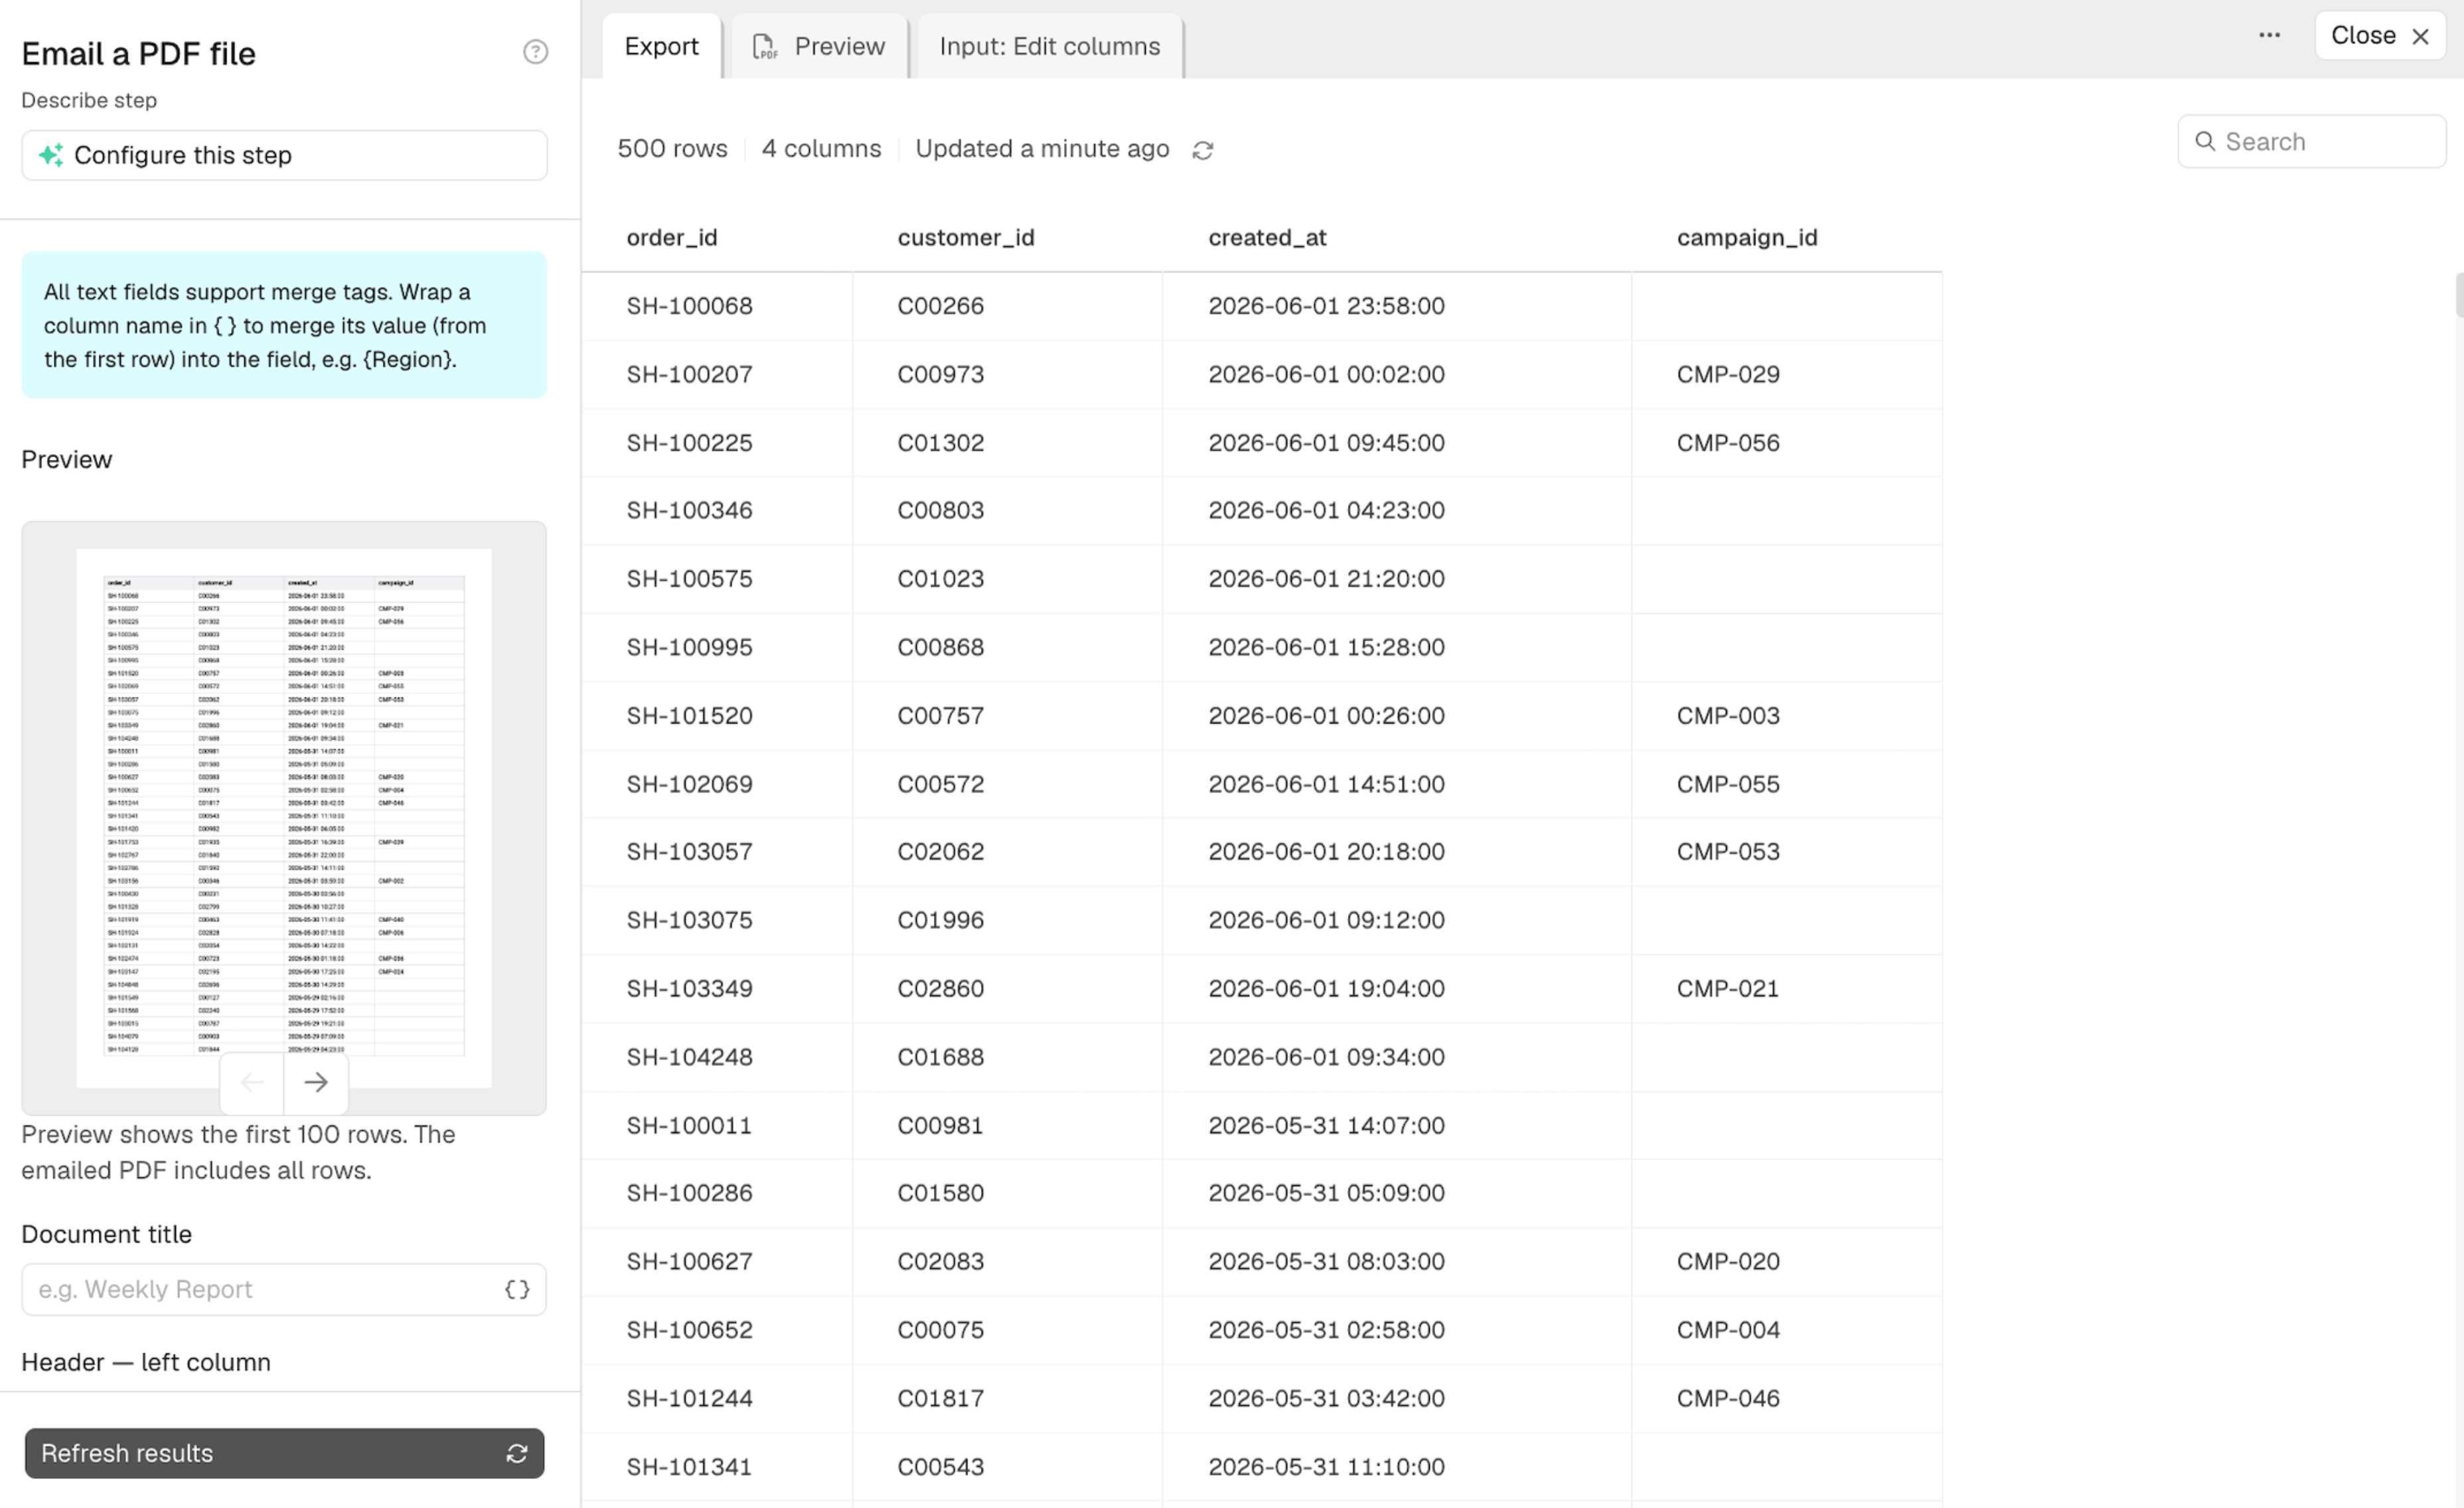
It's finally here. After many (many) asks, the new Email a PDF step turns the data in your flow into a print-ready document and sends it to your intended recipients. You design the layout, title, headers, footers, logo, signature, and page size, and Parabola does the rest.
Upload files straight into Prowork chat
Drop files into Prowork chat, or right onto the flow canvas. Prowork reads each file and can reference it while building. It works with PDFs, DOCXs, MDs, and more.
Pull your data from SharePoint
Our new SharePoint integration is live, paired with a new file picker that makes finding exactly the data you need easy.
Other updates
- Big dataset support: we've 5x'd Parabola's data-size limits for Excel, CSVs, and SharePoint.
- Faster flow search: search the Flows page by inbound email address or webhook URL, a quicker way to land on the exact flow you had in mind.
- Big integrations: view data and configure integrations directly from the canvas.
- Prowork × NetSuite: pull data with SuiteQL, modify it, and write it back with a single chat prompt.
A reminder: agentic visualizations are live
Ever spent hours in a BI platform, Excel, or PowerPoint just to land a basic bar chart? Us too, and we're over it. Now you can describe the chart you want to Prowork and it builds it for you, drawing from a catalog of over 1,000 options. Restyle, recolor, or switch chart types just by chatting.
What's in the works?
Stay tuned for updates on agents that improve your flows while you're away, and Artifacts designed for sharing and collaboration.
Customer stories
.DVABUZQA.png)