Free template
Build an Automated Website Conversion Dashboard
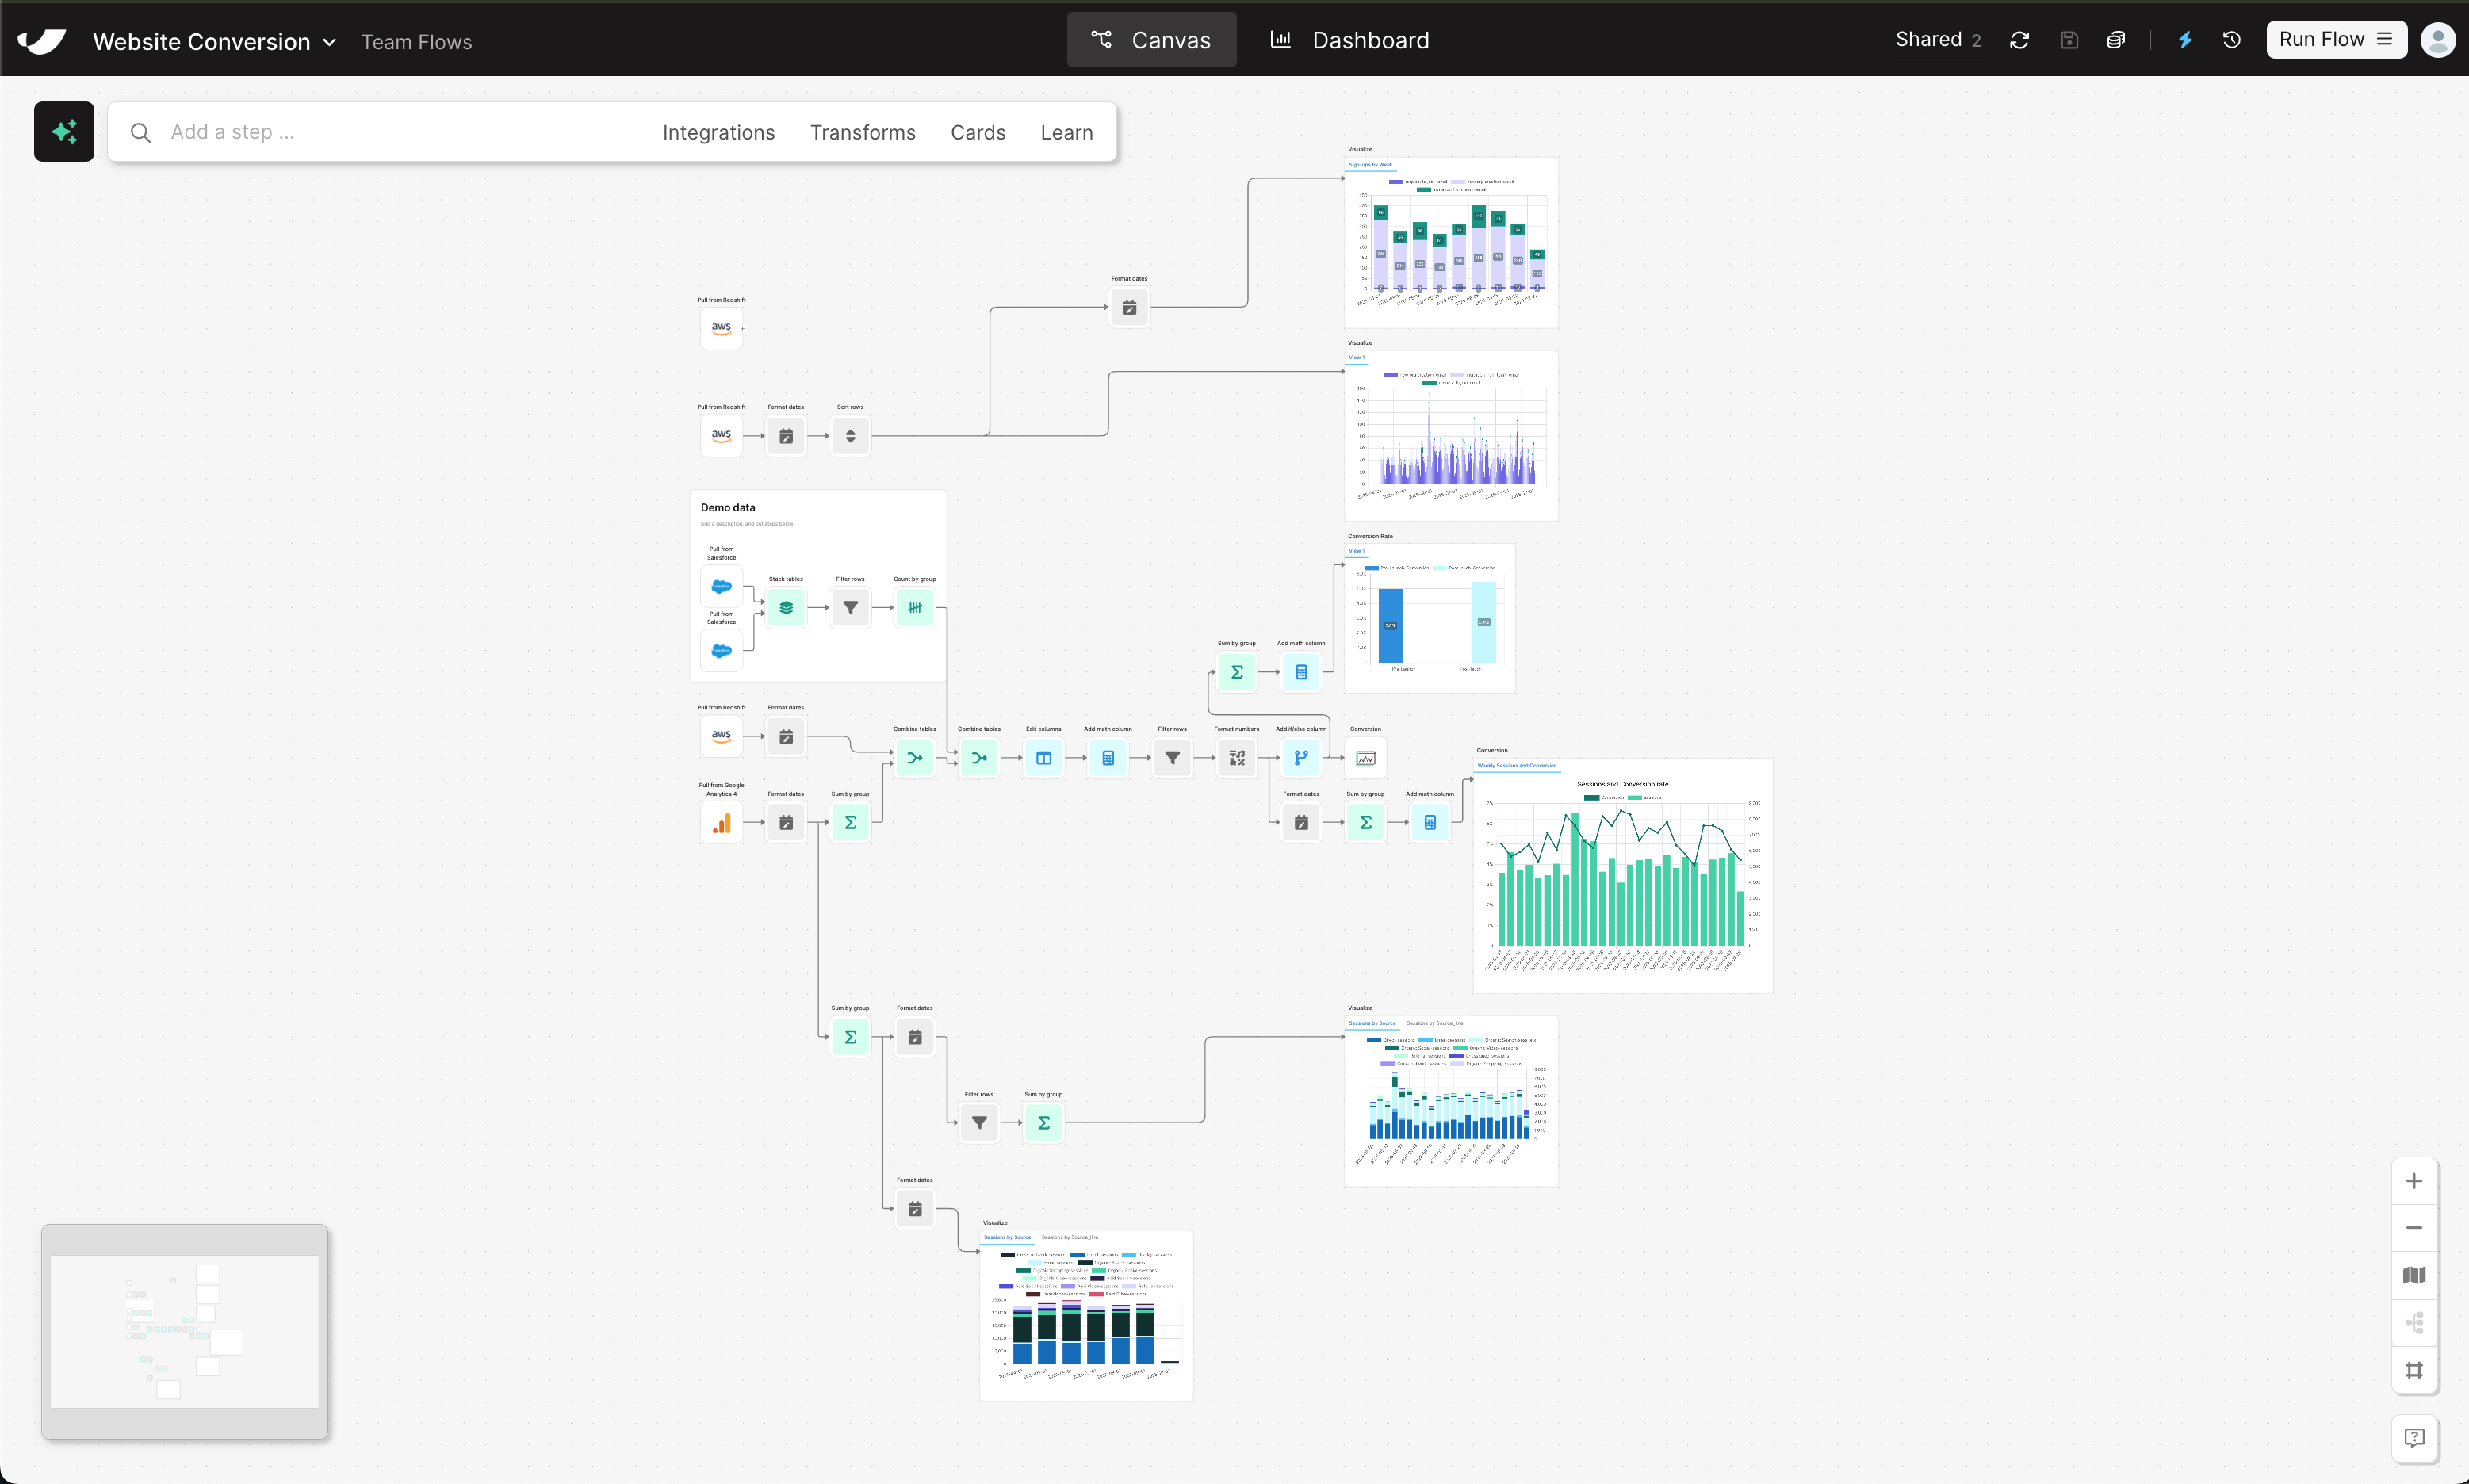
Build an automated website conversion dashboard in Parabola — combine session data and Salesforce conversions to track rates and trends in one live view.
Trusted by ops & finance teams at hundreds of leading brands


How it works
How to Build an Automated Website Conversion Dashboard in 5 Steps
- 1Import traffic and engagement data from your data warehouse or analytics platform to capture total sessions and site activity.
- 2Bring in your form submissions, demo requests, or closed-won deals to represent conversion events.
- 3Join both datasets to calculate key website conversion metrics by channel, campaign, or landing page.
- 4Automatically compute conversion rate percentages and growth trends using live, connected data.
- 5Build clear, shareable dashboards inside Parabola showing traffic, conversion rates, and performance over time.
Why this template
Why Automate Website Conversion Reporting
Manual website reporting slows down RevOps and Marketing teams—and relying solely on GA4 often leaves data gaps. Parabola automates the website conversion workflow, connecting traffic and conversion data from sources like Redshift, Salesforce, or Google Analytics into one dashboard.
With Parabola, you can:
- Centralize website performance metrics: View sessions, leads, and conversion rates in one automated report.
- Drop data silos: Combine analytics and CRM data without code or BI resources.
- Track trends over time: Identify what drives conversions and spot opportunities to improve funnel performance.
Keep going