Clear-to-build summaries

Match component supply against finished SKU demand using your BOM. Flag at-risk SKUs eight weeks out before production schedules slip.

The prompt

I want to analyze my capable-to-build data to understand which components will constrain production in the next 8 weeks. Build me a flow that matches component supply against finished SKU demand using our BOM, calculates any shortages, and flags each component-SKU-week as at risk or good to build.

Just copy and paste the prompt into a new Parabola flow to get started.
Parabola flow flagging build risk by component using demand and BOM data

What Parabola builds

A workflow with six steps you can edit:

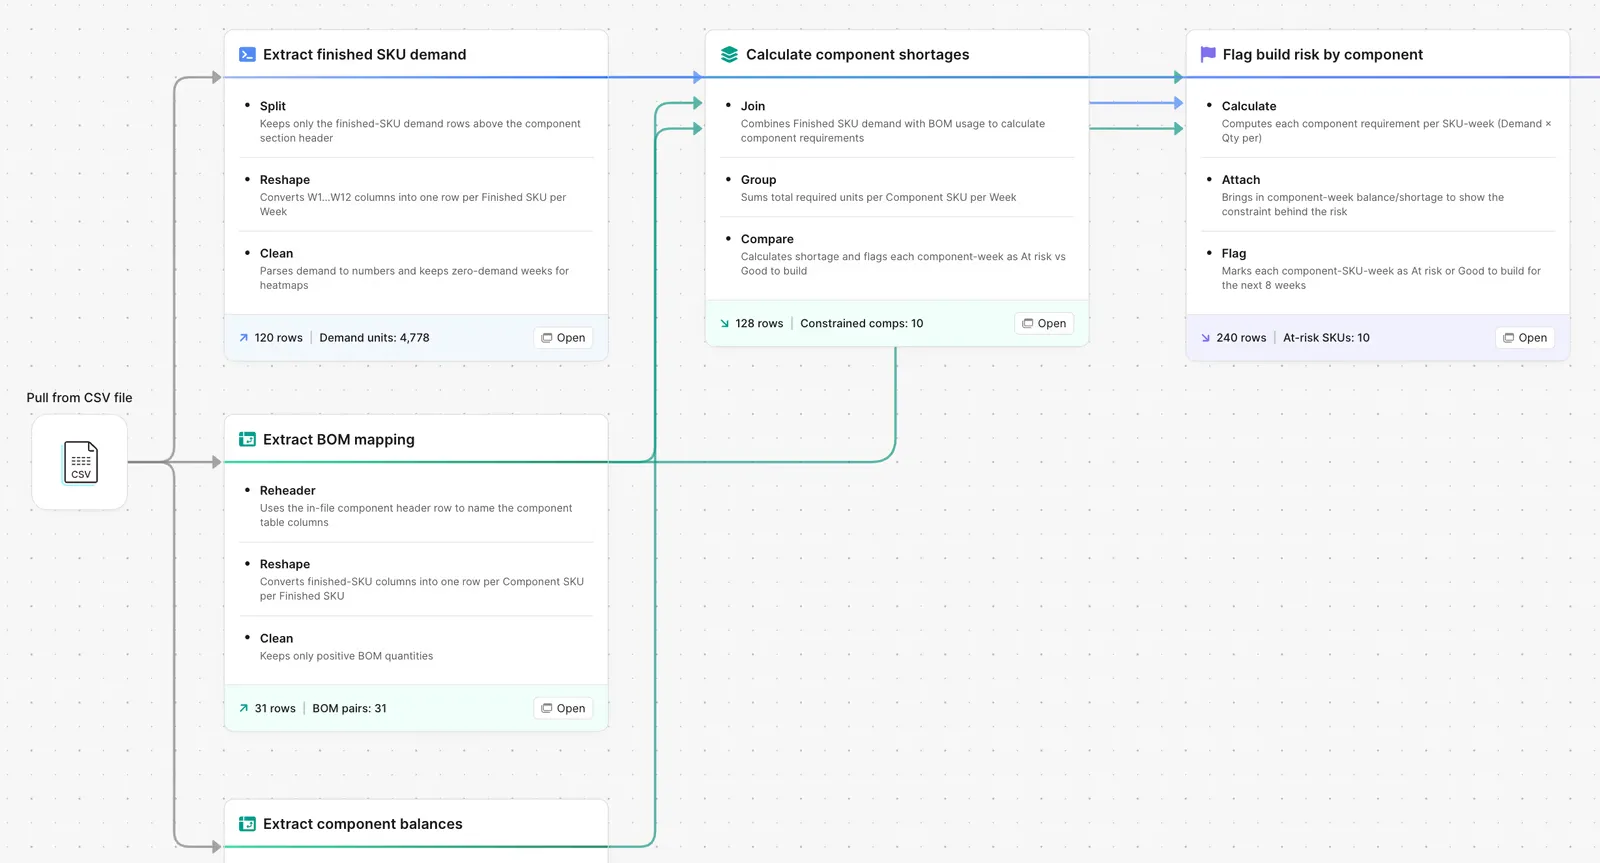
1. Pull the demand. Finished SKU demand by week from your planning system or forecast model.

2. Pull the BOM. Component-to-SKU mapping with per-unit quantities.

3. Explode the demand. Convert finished SKU demand into component-level demand by week.

4. Pull the supply. On-hand plus inbound supply by component, by week.

5. Compare supply vs demand. Net position per component-week.

6. Label every SKU-week. Good to build, at risk, or no demand. The output goes to whoever owns the rebalance.

Why teams stop doing this manually

A clear-to-build summary is the supply chain version of a stress test. It is the one report that tells production whether the next eight weeks are going to ship or whether the plant is going to call at 6am asking for an emergency PO.

The manual version is a workbook where the demand tab feeds the BOM tab feeds the supply tab feeds the summary tab. Every connection is a formula and every formula breaks when the planning system adds a SKU or the procurement team renames a component. The analyst maintaining it ends up doing more workbook surgery than supply analysis.

The cost shows up downstream. Production runs short on a component nobody flagged. The line stops. Someone air-freights a substitute. By the time anyone explains the variance the finished-good ship date has already slipped.

How it works

Step 1. Paste the prompt.

Open Parabola, paste the prompt in section 2, and let it ask follow-up questions about your demand source, BOM structure, and supply feeds.

Step 2. Connect your data.

Planning system or forecast model for demand, ERP or PLM for the BOM, MRP or ERP for supply.

Step 3. Run it every cycle.

Weekly is standard, daily during peak. New BOM? Update the reference. New component? It flows through automatically.

FAQ

Does this work if my BOM is multi-level?

Yes. The BOM explosion step walks the tree and rolls component demand up to the lowest sourceable level.

Can the flow handle alternate components or substitutes?

Yes. Add a substitutes reference table. When a primary component is short, the flow checks the substitute supply before flagging at risk.

What supply sources do you support?

On-hand from your ERP, open POs from procurement, scheduled receipts from inbound logistics. Each gets a source pipeline that feeds the comparison.

Can I run a separate version for critical components only?

Yes. Filter the BOM to a critical-components list and run the same comparison just for those. Some teams keep both versions running side by side.

How is this different from MRP?

MRP gives you the answer. The flow gives you the explanation. When MRP says "you are short," the flow shows which finished SKUs are affected, which week, and which substitutions are possible.
See the shortage before the line stops.
Paste the prompt, point it at your demand, BOM, and supply, and let the build status update itself every week.
Start for free