
1. Pull on-hand from each source. Cin7, Shopify, ShipHero, NetSuite, your 3PL portal. Whatever the systems are, the flow connects to each one.
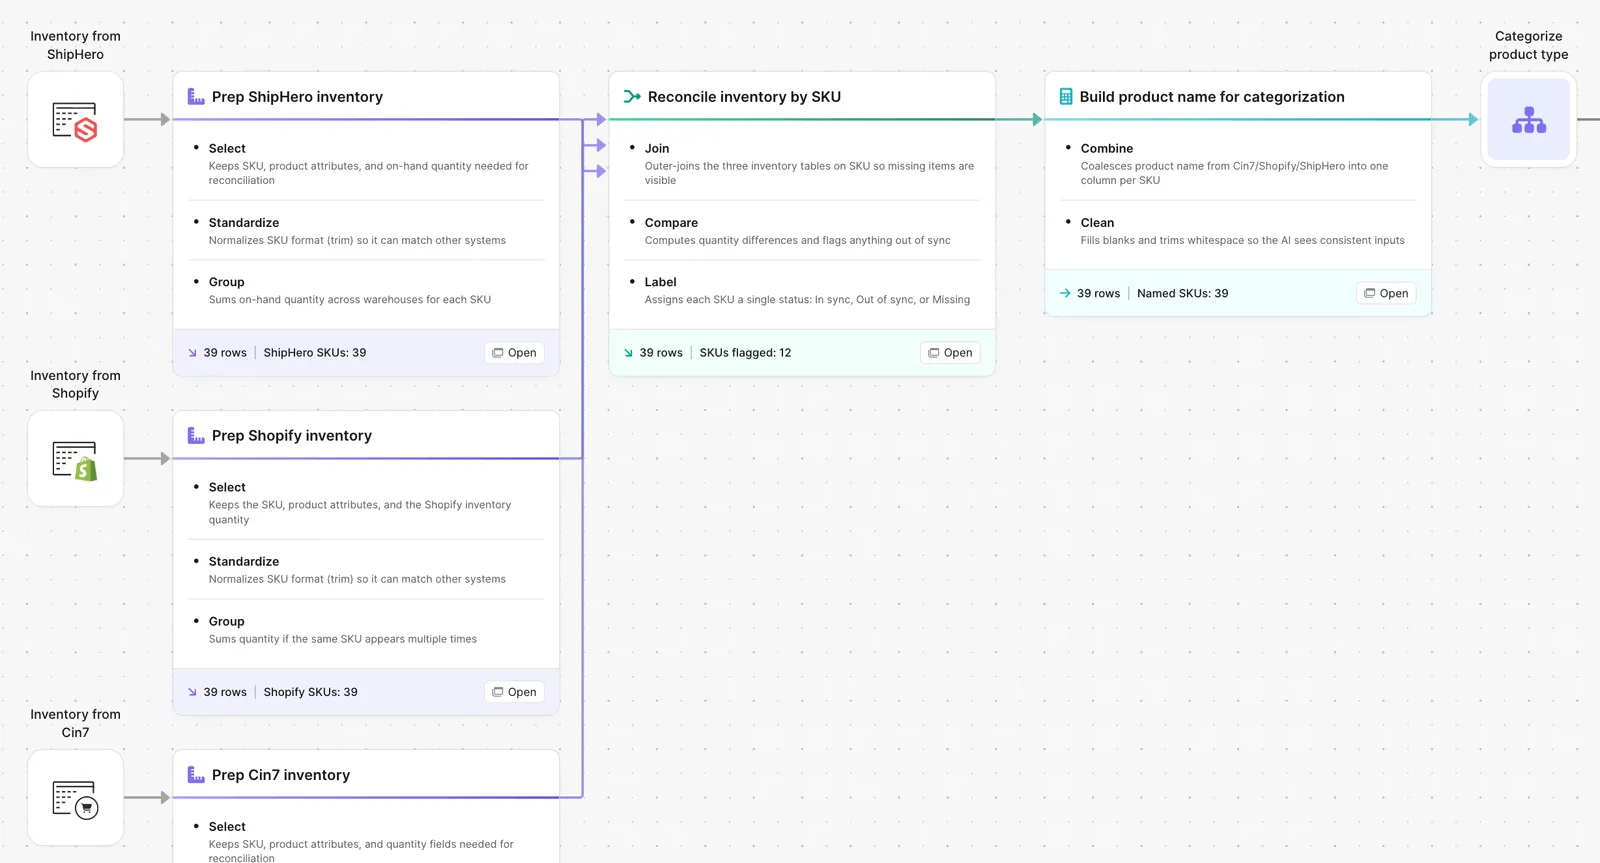
2. Standardize the SKU. Trim spaces, normalize casing, strip the retailer prefix. Same SKU across systems means same row across systems.
3. Outer join the systems. One row per SKU with one column per source.
4. Calculate the deltas. Difference between each pair of systems, in units and percent.
5. Label every SKU. In sync, out of sync, missing in system A, missing in system B. The label is the column the ops team reads first.
6. Filter retired SKUs. The recon shouldn't flag a SKU you stopped selling six months ago. Optional rule to ignore anything tagged retired.
7. Output the report. Full reconciliation table for the record, plus a filtered view of just the discrepancies sorted with the worst first.