Sales channel consolidation

Combine Shopify, Amazon, retail, and wholesale sales into one normalized table. See revenue by month and channel without rebuilding the report every cycle.

The prompt

I want to combine and analyze my sales data across Shopify, Amazon, and Target. Build me a flow that normalizes each channel into the same format, stacks them into one table, and shows me revenue by month and channel.

Just copy and paste the prompt into a new Parabola flow to get started.
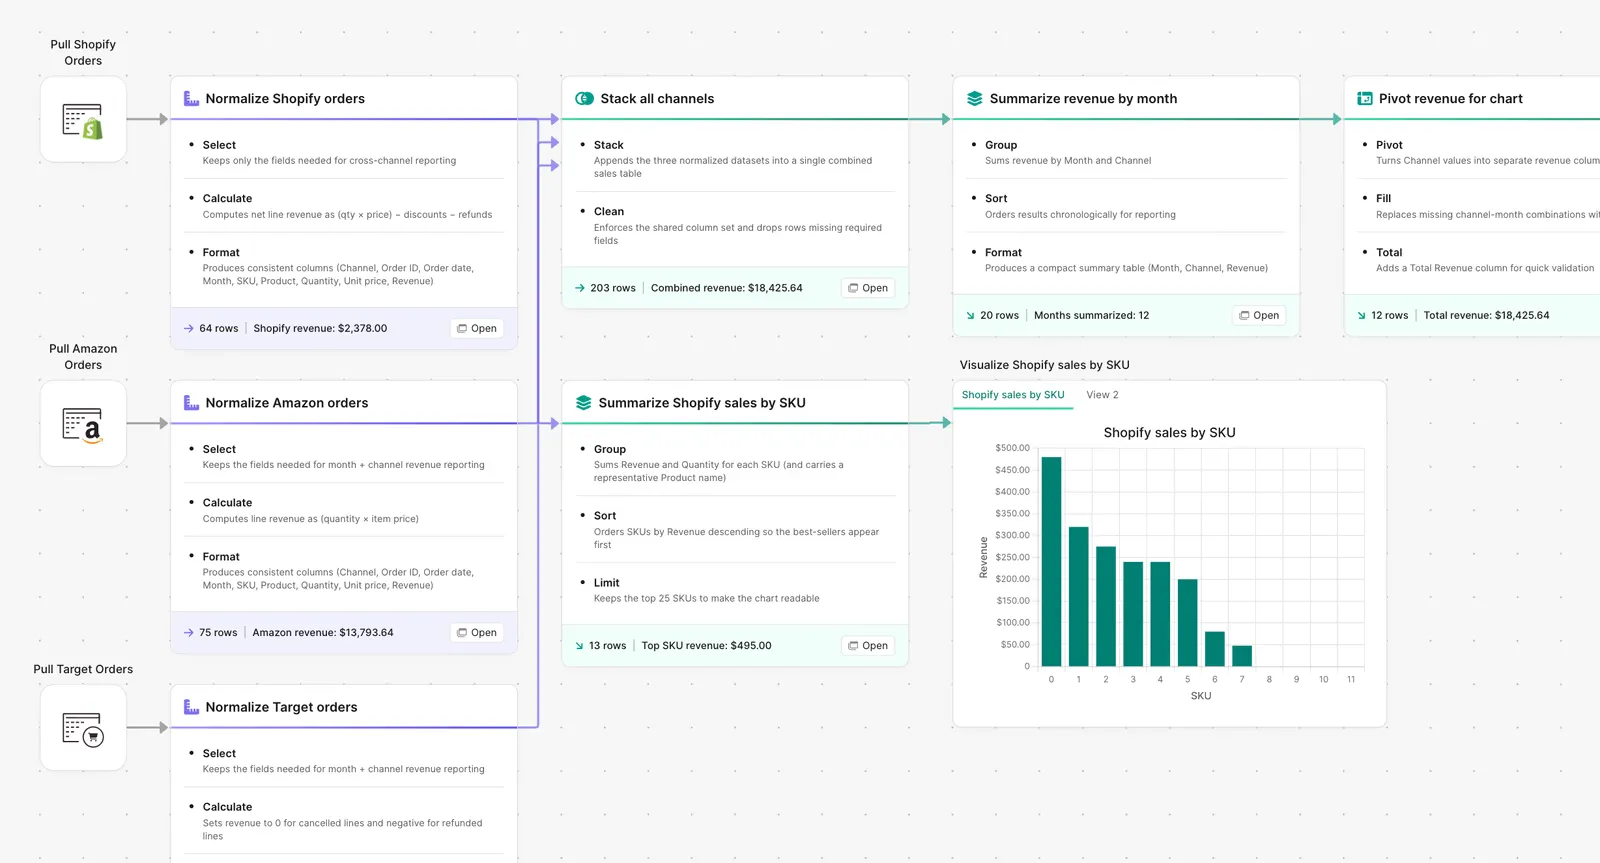
Parabola flow consolidating Shopify, Amazon, and Target orders into one revenue report

What Parabola builds

A workflow with five steps you can edit:

1. Pull sales from each channel. Shopify, Amazon Seller Central, retail partner portals, wholesale EDI.

2. Standardize the schema. Each channel uses different field names for SKU, quantity, gross sales, fees, returns. The flow maps them all into a single common schema.

3. Stack them into one table. One row per order line, one column for channel.

4. Roll up by month and channel. Revenue, units, AOV, returns rate at whatever granularity you need.

5. Output the report. Full table for the record, plus a pivot for finance and a Slack message with the weekly headline.

Why teams stop doing this manually

Every channel exports its data differently. Shopify gives you one schema. Amazon's payment report has another. Target's vendor portal exports a CSV that looks nothing like either. Wholesale ships an EDI 810. Before anyone can ask the actual question (how is the brand performing by channel) the team has to normalize four formats into one.

The manual version is a workbook with one tab per channel, a master pivot, and a set of formulas that break every time a channel renames a column. The first iteration takes a week. The maintenance takes a day every Monday morning. The reporting cadence slips until "weekly" means "every other week when nothing else is on fire."

The right answer is not a bigger workbook. It is the normalization rules in one place, the join in another, and a refresh on whatever cadence finance and merchandising actually need.

How it works

Step 1. Paste the prompt.

Open Parabola, paste the prompt in section 2, and let it ask follow-up questions about your channel mix and reporting granularity.

Step 2. Connect your data.

API connections to Shopify, Amazon, retailer portals, and wholesale feeds.

Step 3. Run it every cycle.

Weekly or monthly. New channel? Add a source pipeline. New reporting view? Add it to the output.

FAQ

Can this handle EDI 810s from wholesale partners?

Yes. EDI 810 lands in the AP inbox, the flow parses each line, and it joins the rest of the channel data through the standard mapping.

What if Amazon renames a column in their report?

The mapping table at the top of the flow is the only thing that needs an update. The rest of the workflow keeps running.

Can I report at multiple granularities from the same flow?

Yes. Output a monthly summary for finance, a weekly headline for the leadership digest, and a raw line-item table for the analytics team, all from one flow.

How does this handle returns and refunds?

Returns and refunds get their own line type in the normalized schema. Gross sales, net sales, and refund rate are all available as output fields.

How is this different from a BI tool?

BI tools assume clean data. The hard part of multi-channel reporting is normalizing inconsistent exports before they ever reach the BI tool. Parabola does the upstream cleaning and feeds the BI tool a single trusted table.
One table, every channel, every month.
Paste the prompt, point it at your channel feeds, and let the report build itself.
Start for free