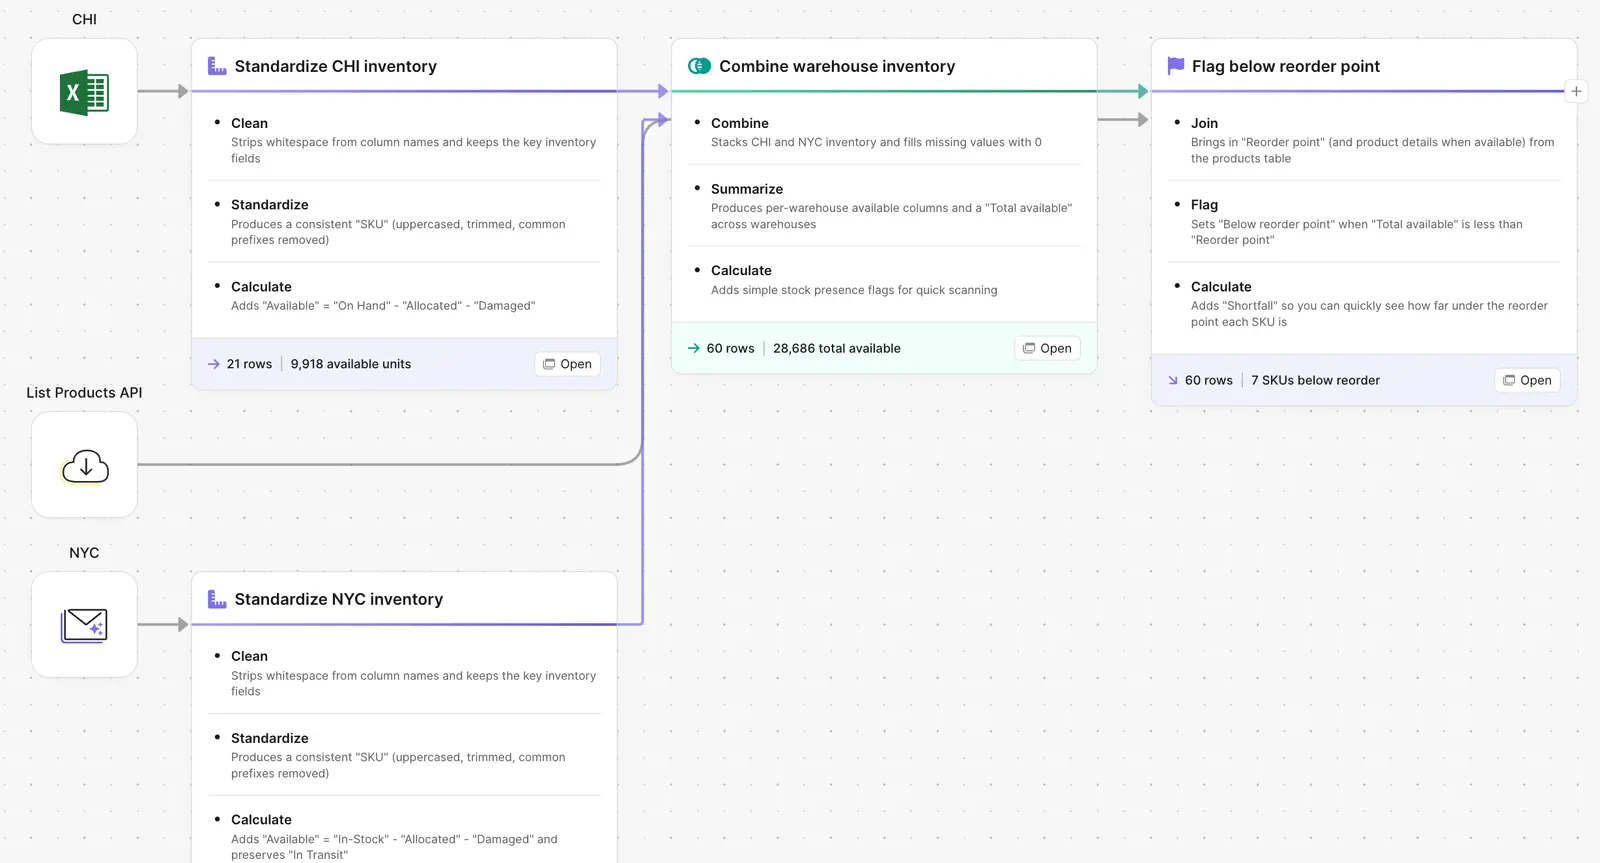
Consolidated inventory reporting
Use Template![](https://cdn.prod.website-files.com/663559c9207f91d5a1ba91e4/67a1aad2ebccd717030dde6d_Consol%20inventory.png)
How to automate consolidated inventory reporting
Proper inventory management is critical for preventing stockouts, rush orders, and SLA breaches — but when you consolidate data in spreadsheets, the data is already stale by the time you hit ‘Share.’ Add in the fact that every system names columns differently, and all of the sudden it becomes really difficult to maintain a source of truth in the absence of an ERP.
Parabola streamlines inventory consolidation reporting by integrating directly with systems like Shopify, 3PL-managed WMS systems, and email. Beyond its system integration capabilities, Parabola also transforms inventory data into the format you need to make it actionable, allowing you to standardize column values across systems, combine datasets based on SKU values, and create custom inventory visibility dashboards. Take it a step further by automating alerts for discrepancies to maintain real-time visibility into inventory health across your entire supply chain.
Video overview
Why Parabola
Automating inventory management in Parabola has been a huge unlock for growing our business. We can finally keep up with demand and plan for future growth.
Inventory consolidation reporting is the process of combining inventory data from multiple systems, such as Shopify, Amazon, and 3PL-managed WMS systems to create a unified view of inventory levels. This process helps prevent stockouts and fulfillment delays, and enables better inventory forecasting.
- Pull inventory data using steps like Pull from Shopify, Pull from Amazon Seller Central, and Pull from API.
- Standardize SKU values and column names using steps like Edit columns to ensure consistent data across systems.
- Combine data across sources using the Combine tables step, merging based on shared identifiers like SKU and warehouse location.
- Consider using the Add if/else column step to categorize records and flag potential issues, such as low stock or missing SKUs.
- Create a reporting dashboard using the Visualize step. Alternatively, send your data to an external source using steps like Send to Google Sheets and Email a file attachment.
- If you're new to APIs, reach out to help@parabola.io or explore this course (https://parabola.io/product/overview/using-apis-in-parabola) to set up your integration. You can also always start by importing a CSV file exported from your system (recommended).
- Normalize column names and SKU formats early in your flow to ensure clean joins across datasets.
- Consider adding error-checking steps like Filter rows to identify missing or inconsistent data before reconciliation.
- Use Group by to calculate aggregated metrics like total inventory per warehouse or across channels.
- Set your Flow on an automated schedule to keep inventory visibility updated in real-time.
- To start building your inventory management Flow, use the Template above and check out Parabola University.
- Explore case studies from Great Jones and Just Food For Dogs.