What is Facebook Ads?
Facebook Ads is a digital advertising platform that allows businesses to create and manage targeted ad campaigns across Facebook, Instagram, Messenger, and the Audience Network. It provides robust audience targeting, performance tracking, and budget optimization tools, making it a powerful solution for businesses looking to reach and engage their ideal customers.
How to use Parabola’s Facebook Ads integration
Parabola’s Facebook Ads integration helps businesses automate campaign reporting and optimize ad performance.
- Import and analyze Facebook Ads performance data automatically
- Transform raw ad data into actionable insights for better decision-making
- Sync Facebook Ads data with other business tools for a comprehensive marketing strategy
Learn more about Parabola’s Facebook Ads integration below.
Pull from Facebook Ads
Use the Pull from Facebook Ads step to connect to any Facebook Ads account and pull in custom reports or columns and breakdowns.
Connect your Facebook Ads account
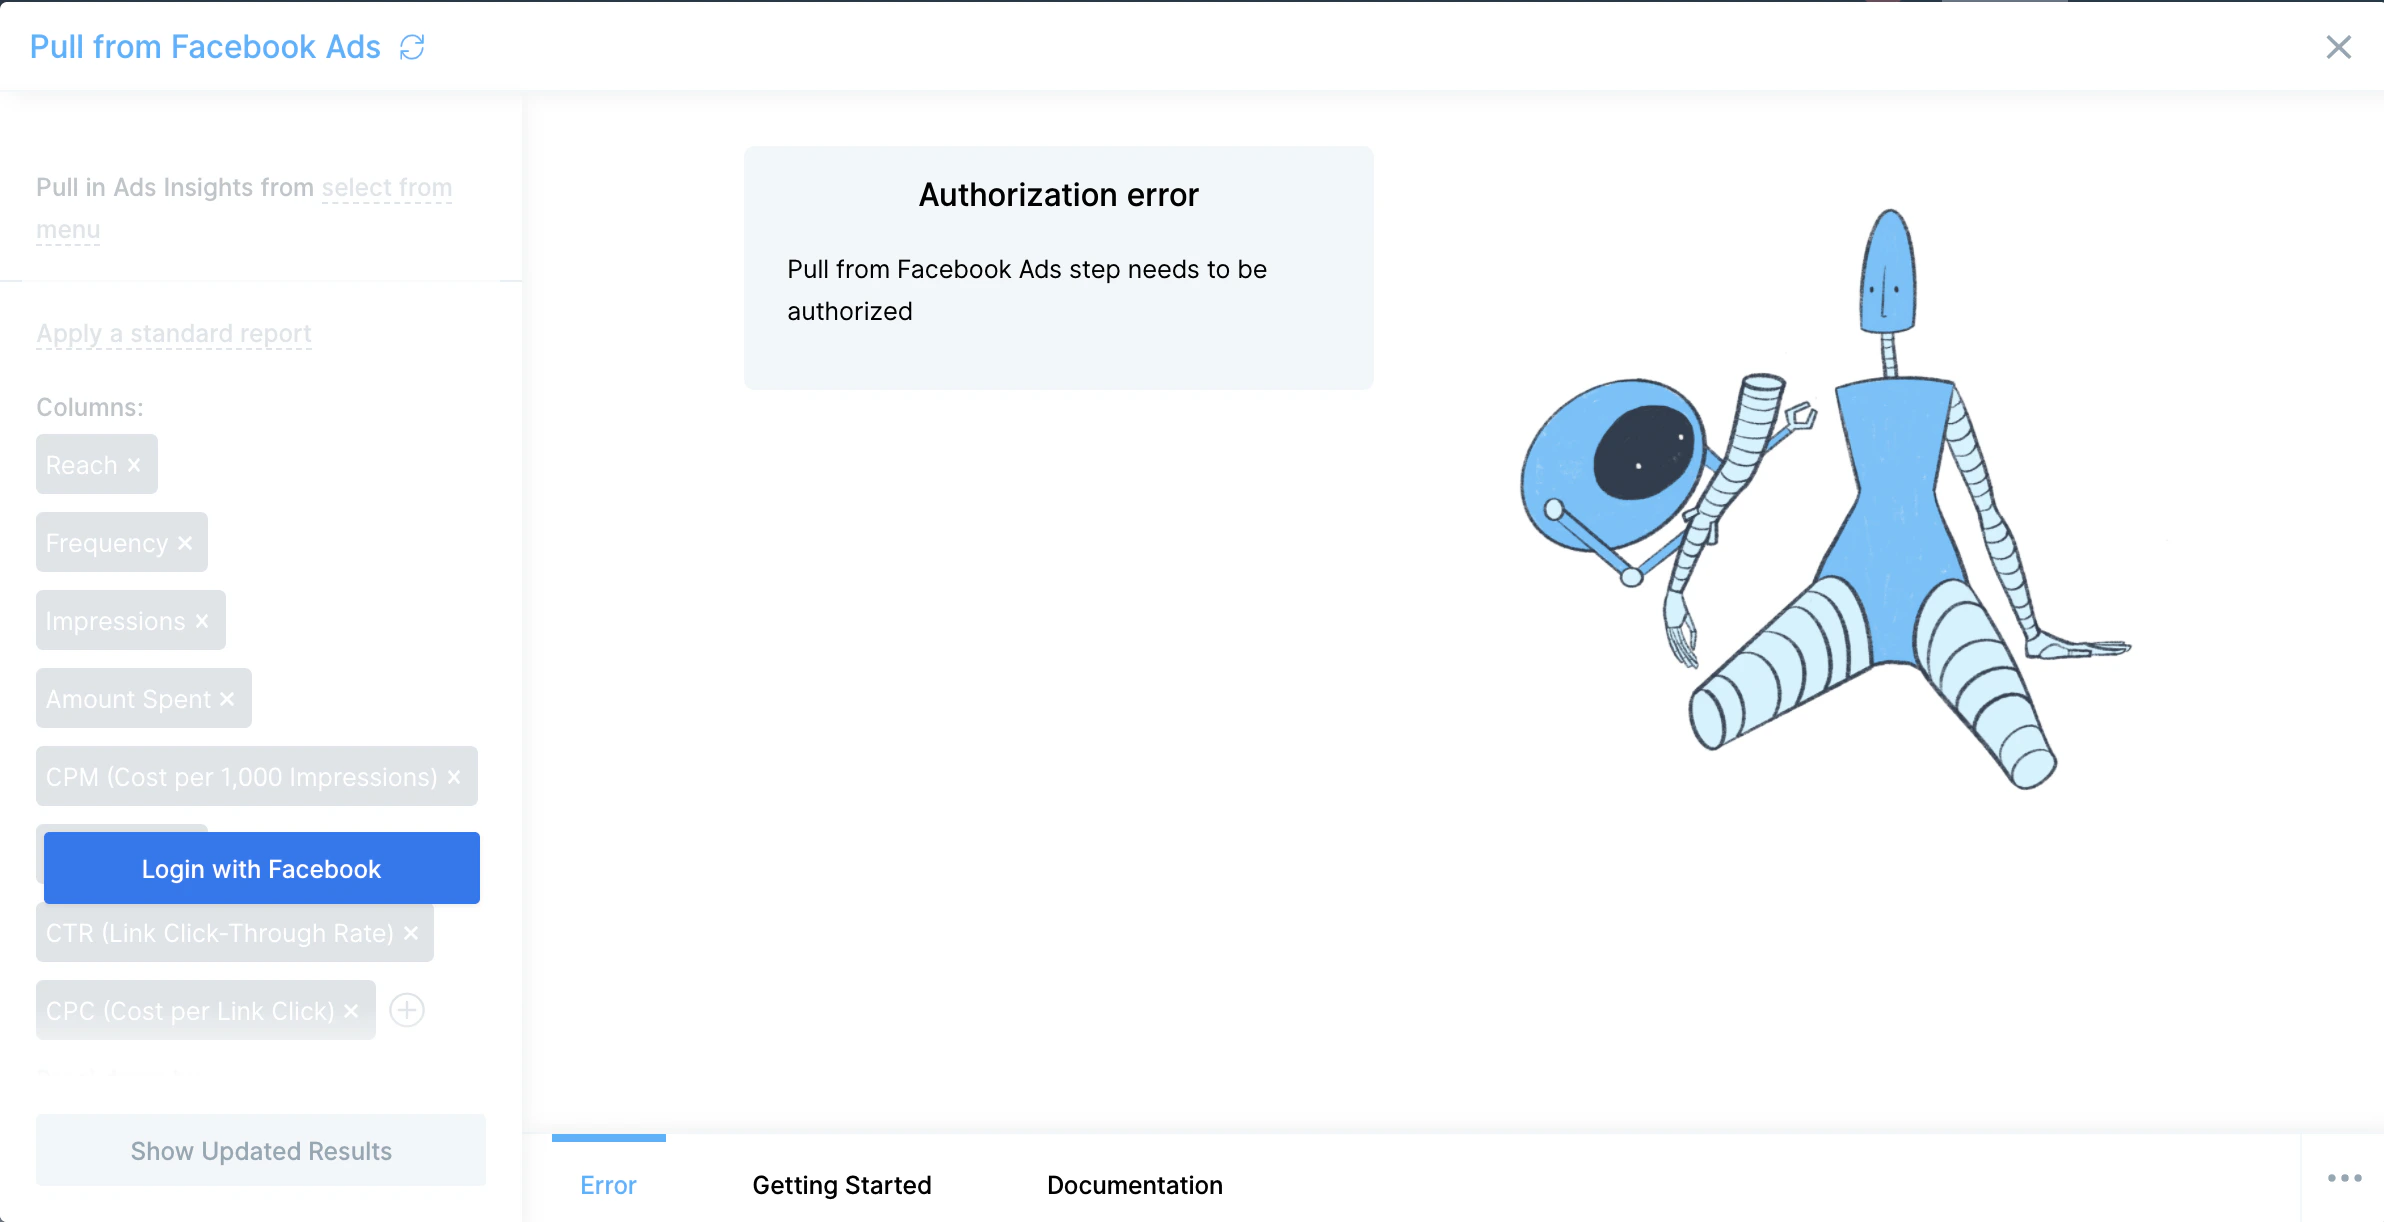
Double-click on the reviewing in webflow step and click the blue button to “Login with Facebook”. A pop-up window will appear asking you to log in to your Facebook account to connect your data to Parabola.
If you ever need to change the Facebook Ads account that your step is connected to, or connect to multiple Facebook Ads account within a single flow, click “Edit accounts” at the top of the step. Head here for more info.
Default settings
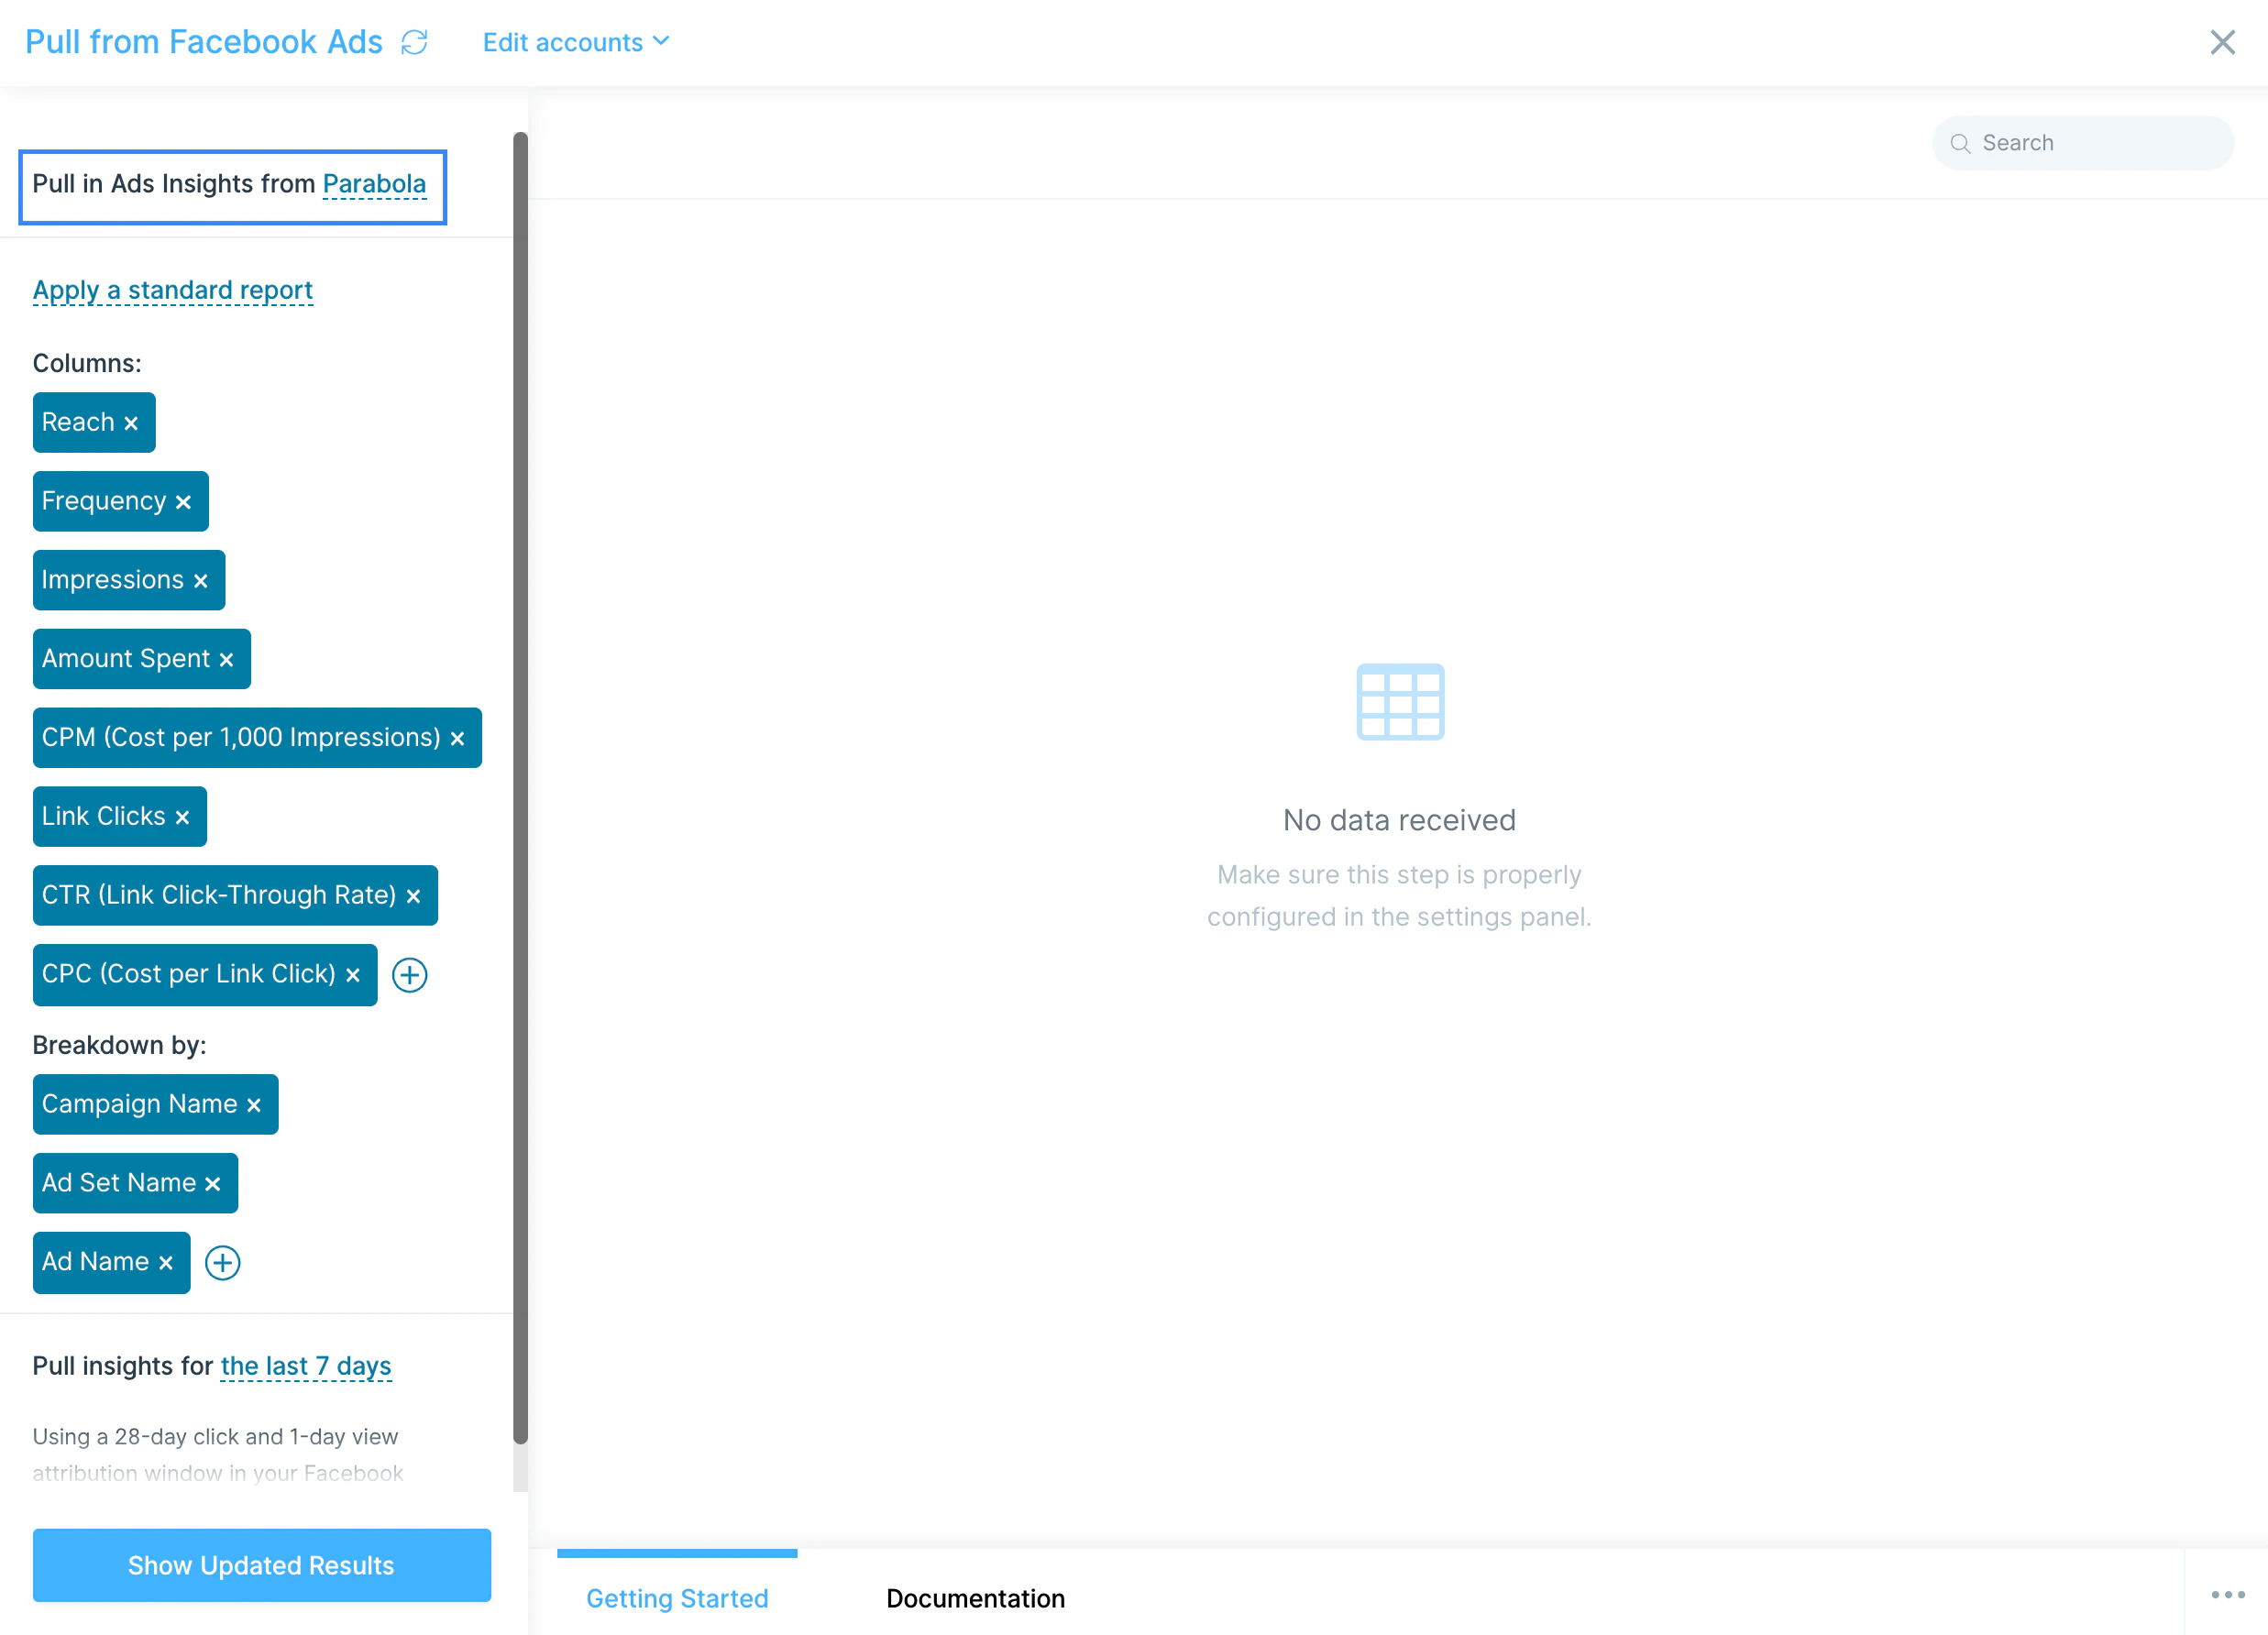
The default settings for this flow will allow you to see data from your Facebook Ads account right away. If you have multiple Ads accounts, be sure to select the correct account here:
By default, the step will pull in insight for the last 7 days.
Selected columns:
- Reach
- Frequency
- Impressions
- Amount Spent
- CPM (Cost per 1,000 impressions)
- Link Clicks
- CTR (Link Click-Through Rate)
- CPC (Cost per Link Click)
Selected breakdown:
- Campaign Name
- Ad Set Name
- Ad Name
Presets
We’ve added a lot of standard reports that Facebook Ads shows in their Ads Manager page. Selecting a standard report will update your Columns and Breakdowns selection fields to show the columns that will be imported.
These standard reports can be used as it, or can also start as a great starting point to further customize your report.
Available standard reports:
- All Levels
- Campaign
- Ad Set
- Ad
- Objective
- Age
- Gender
- Age and Gender
- Country
- Region
- DMA Region
- Business Locations
- Placement
- Placement and Device
- Platform
- Platform and Device
- Time of Day (Ad Account)
- Time of Day (Viewer)
- Canvas Component
- Conversion Device
- Product ID
- Carousel Card
- Reactions
- Video View Type
- Video Sound
Custom settings
To further customize your Facebook Ads data being pulled into Parabola, you can select Columns and Breakdowns.
Each breakdown will also add its own column, and break each row into multiple rows. For example, you could look at your Reach column, and break it down by Campaign to see the reach of each campaign
Custom date ranges
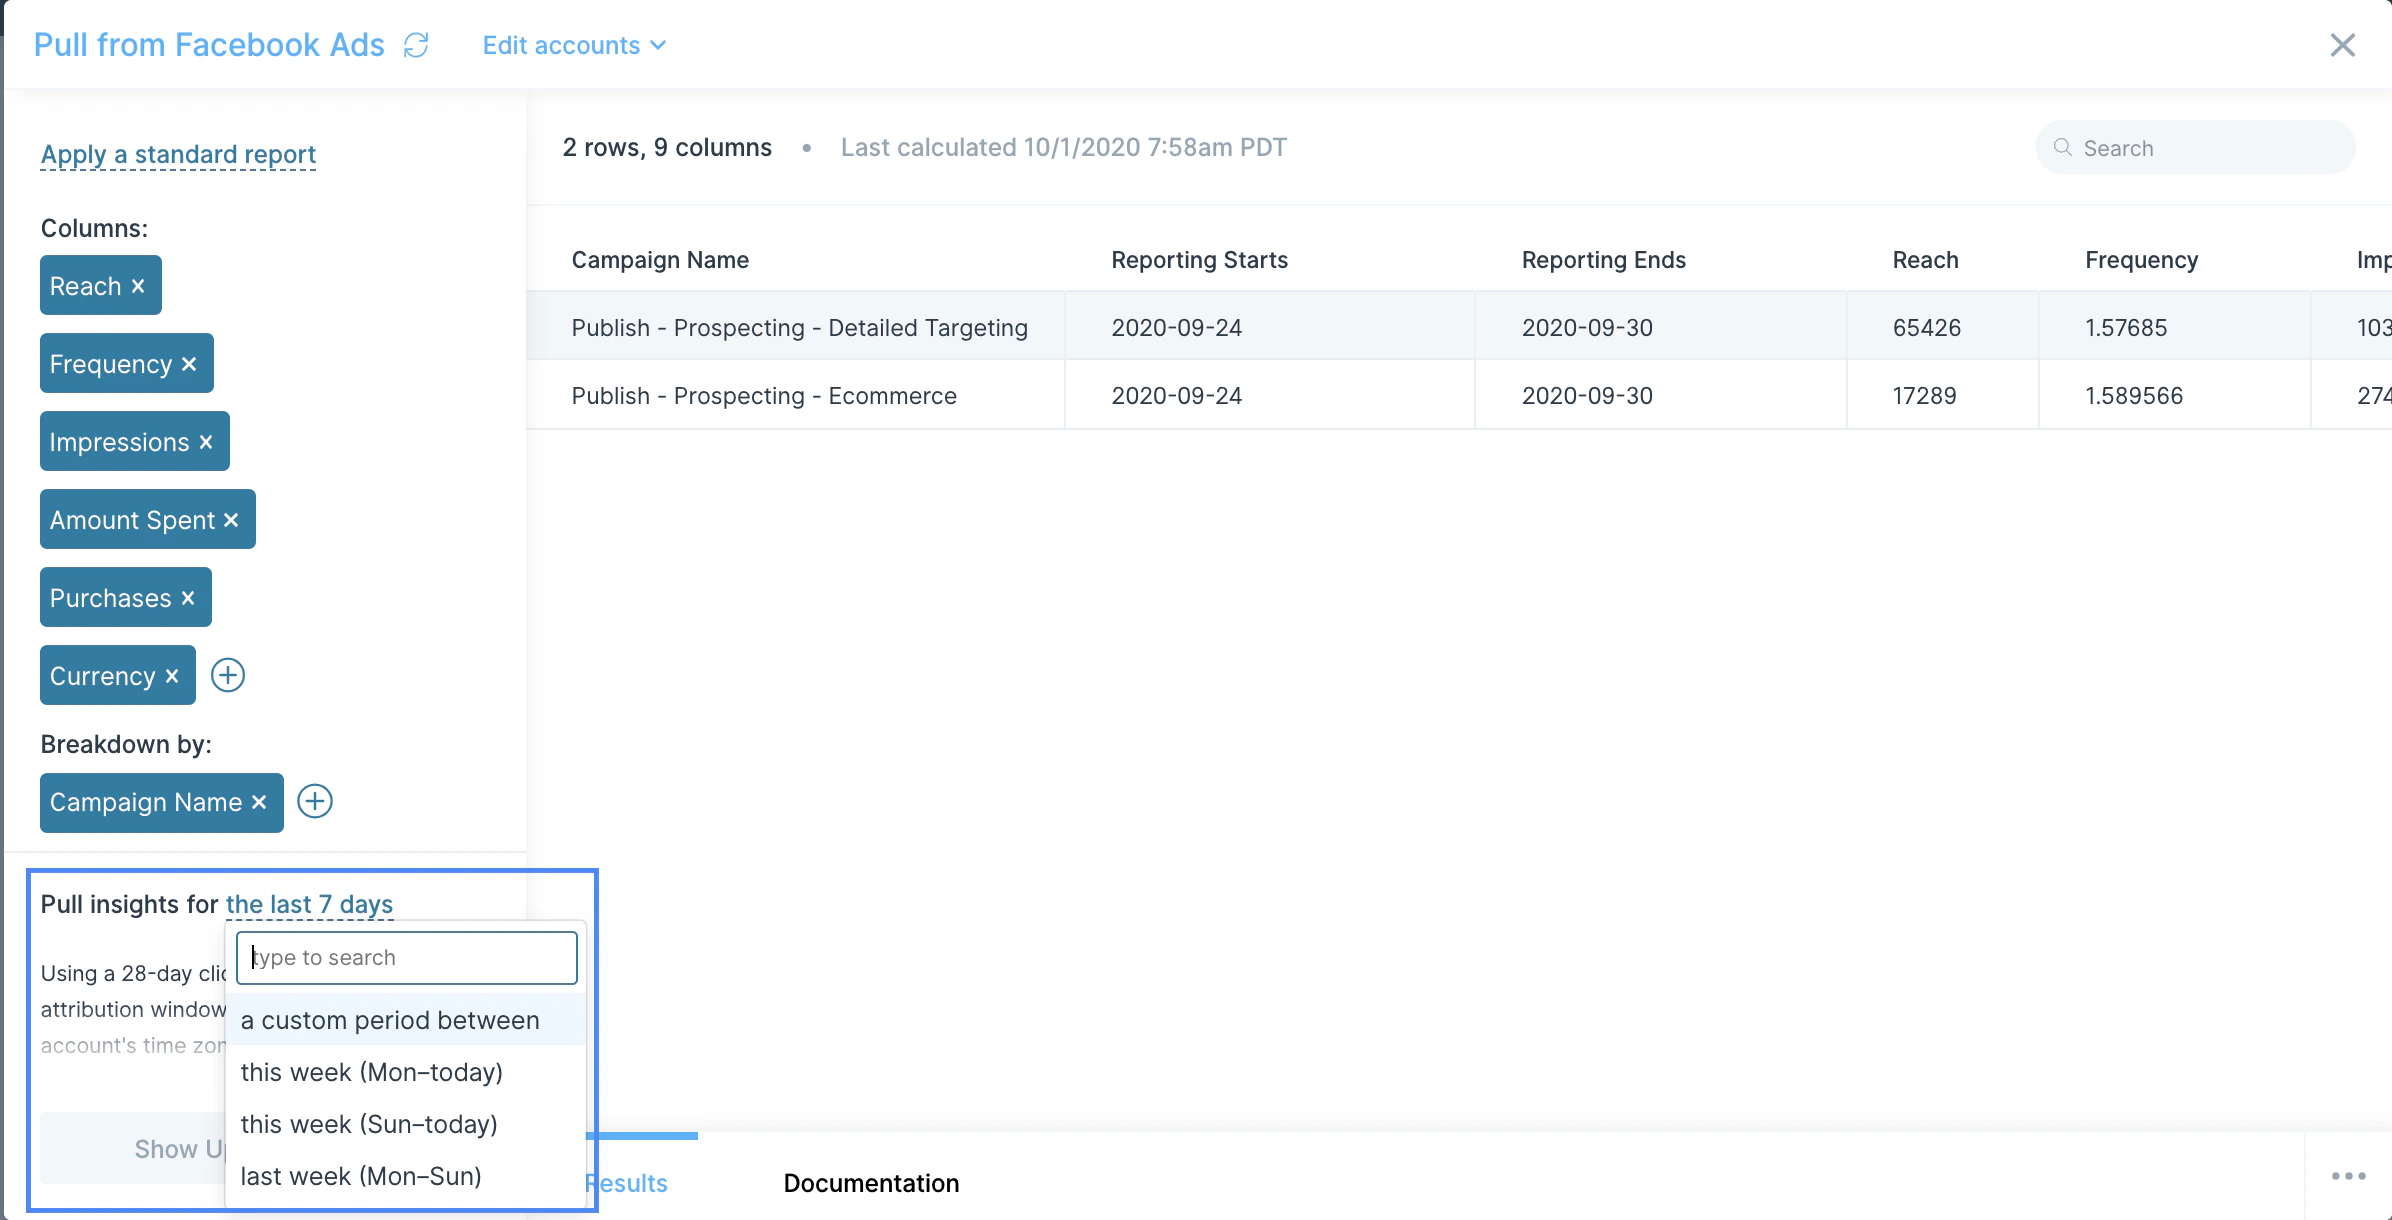
You can either select a preset relative date or a custom date range in this step.
Select a preset relative date range, such as the Last 7 Days, to pull data from a range that will update every time this flow runs.
Select a custom period between, such as September 17, 2020 - September 24, 2020 to pull from a static date range that will always pull from that set range when the flow runs.
At the bottom of the step, we’ll display the attribution window that is being used to product your report:
Using a 28-day click and 1-day view attribution window in your Facebook account’s time zone.
Your Facebook account time zone will be used to determine how to pull data from your selected date range.
Known issues
Currently there is a known issue in the Facebook API that has not been resolved by their team yet. It causes certain requests to timeout or error when they should work. Our team is keeping tabs on the issue and will remove this known issue when it has been fixed by Facebook. In the meantime, you may need to remove certain columns of breakdowns from your settings in order to get the step working and returning data!
Helpful tips
- This step is available starting at our Plus plan.
Last modified on March 16, 2026