

Usage
Credits are calculated every time you run a Prowork flow or have AI complete complex tasks. The amount used in a given run depends on the number of unique steps and the complexity of the process being automated. If a step isn’t successfully executed, or has zero input and output rows, it doesn’t count.- What consumes credits? Steps, visualizations, and artifacts.
- When does it happen? Every run, whether you clicked Run flow or a schedule, webhook, or inbound email fired it.
Usage analytics
Users across all Prowork plans have access to embedded usage analytics and reports. These reports are meant purely for analytical purposes and do not impact any account-specific billing. Only org admins, billing admins, and reporting admins have access to them. For accounts that have access, the reports are on the Billing & Usage page of your Prowork account. All credit usage data is updated once per day; the previous day’s credits are reflected at approximately 3am EST the following day.Who can see usage
Reports
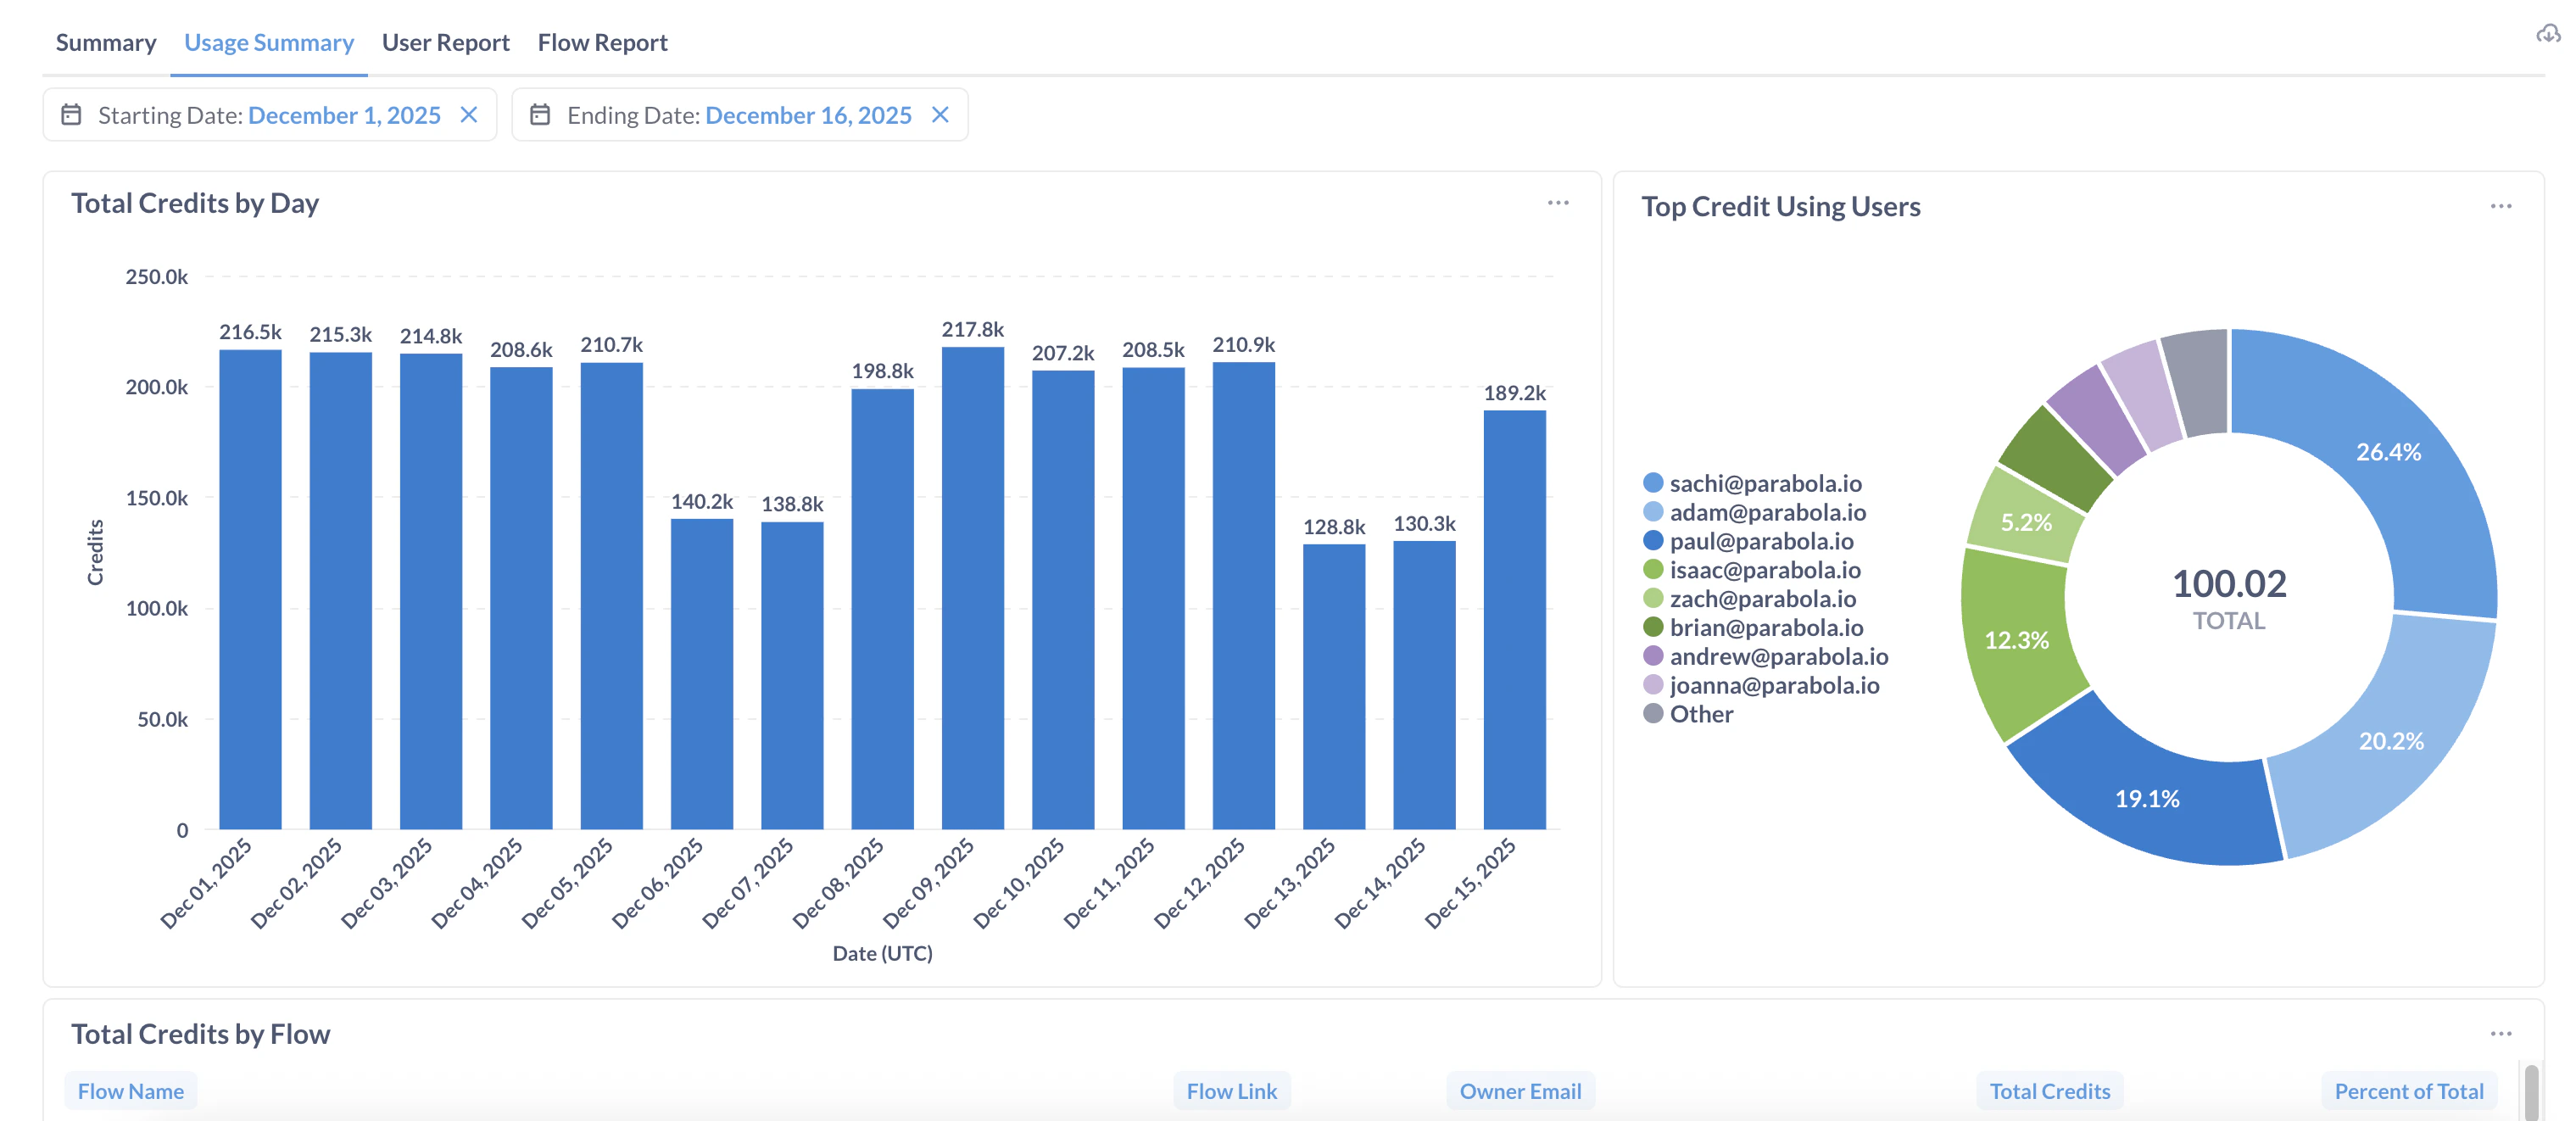
There are currently four reports available. Summary- Total flows. Every flow in the account, whatever its last run date.
- Flows created last 30 days.
- Users added last 30 days. Counts users added whether or not they verified their account.
- Total credits last 30 days. Team-wide, regardless of the current billing period.
- Total credits by day
- Top credit using users (by percentage)
- Total credits by flow
- Total flows owned, and how many of those include AI
- Created flows last 30 days
- Unique flows run last 30 days
- Total flow runs last 30 days
- Total credits last 30 days
- Unique flow ID
- Flow name
- Owner email
- Includes AI
- Total runs last 30 days
- Total credits last 30 days
The AI fields on both reports look at the flow’s most recent successful run, and are left blank for flows that haven’t run. User Report and Flow Report data is a snapshot from the most recent date with usage, as of yesterday at midnight UTC.
Downloading reports
All data in the usage reports is downloadable as a PDF, CSV, Excel, or JSON file. Either way, files download to the default download location on your device. For a PDF:- Select the cloud icon in the top right of the report
- Click download as a PDF
- Hover over the three dots icon of the specific report you want
- Click download results
Troubleshooting
You may see a field show null or blank. There are a few reasons a value can appear empty rather than zero:- No usage yet. A brand-new flow or user with no runs in the reporting window has nothing to report, rather than a broken measurement.
- The day’s data hasn’t landed. Usage data updates once per day, reflected at approximately 3am EST for the previous day. Checking earlier the same day, today’s numbers won’t be there yet.
- The field only applies once the flow has run. Includes AI is left blank for flows that haven’t run, because there’s no most recent execution to check.