

What you can build
A few examples of what an Artifact can be. The shape it takes depends entirely on what you ask for:- A “Q1 sales recap” one-pager to send to a stakeholder
- A slide-deck-style recap you click through section by section, shared as a link instead of exported as a deck
- A weekly executive summary: KPI tiles up top, a few supporting charts below
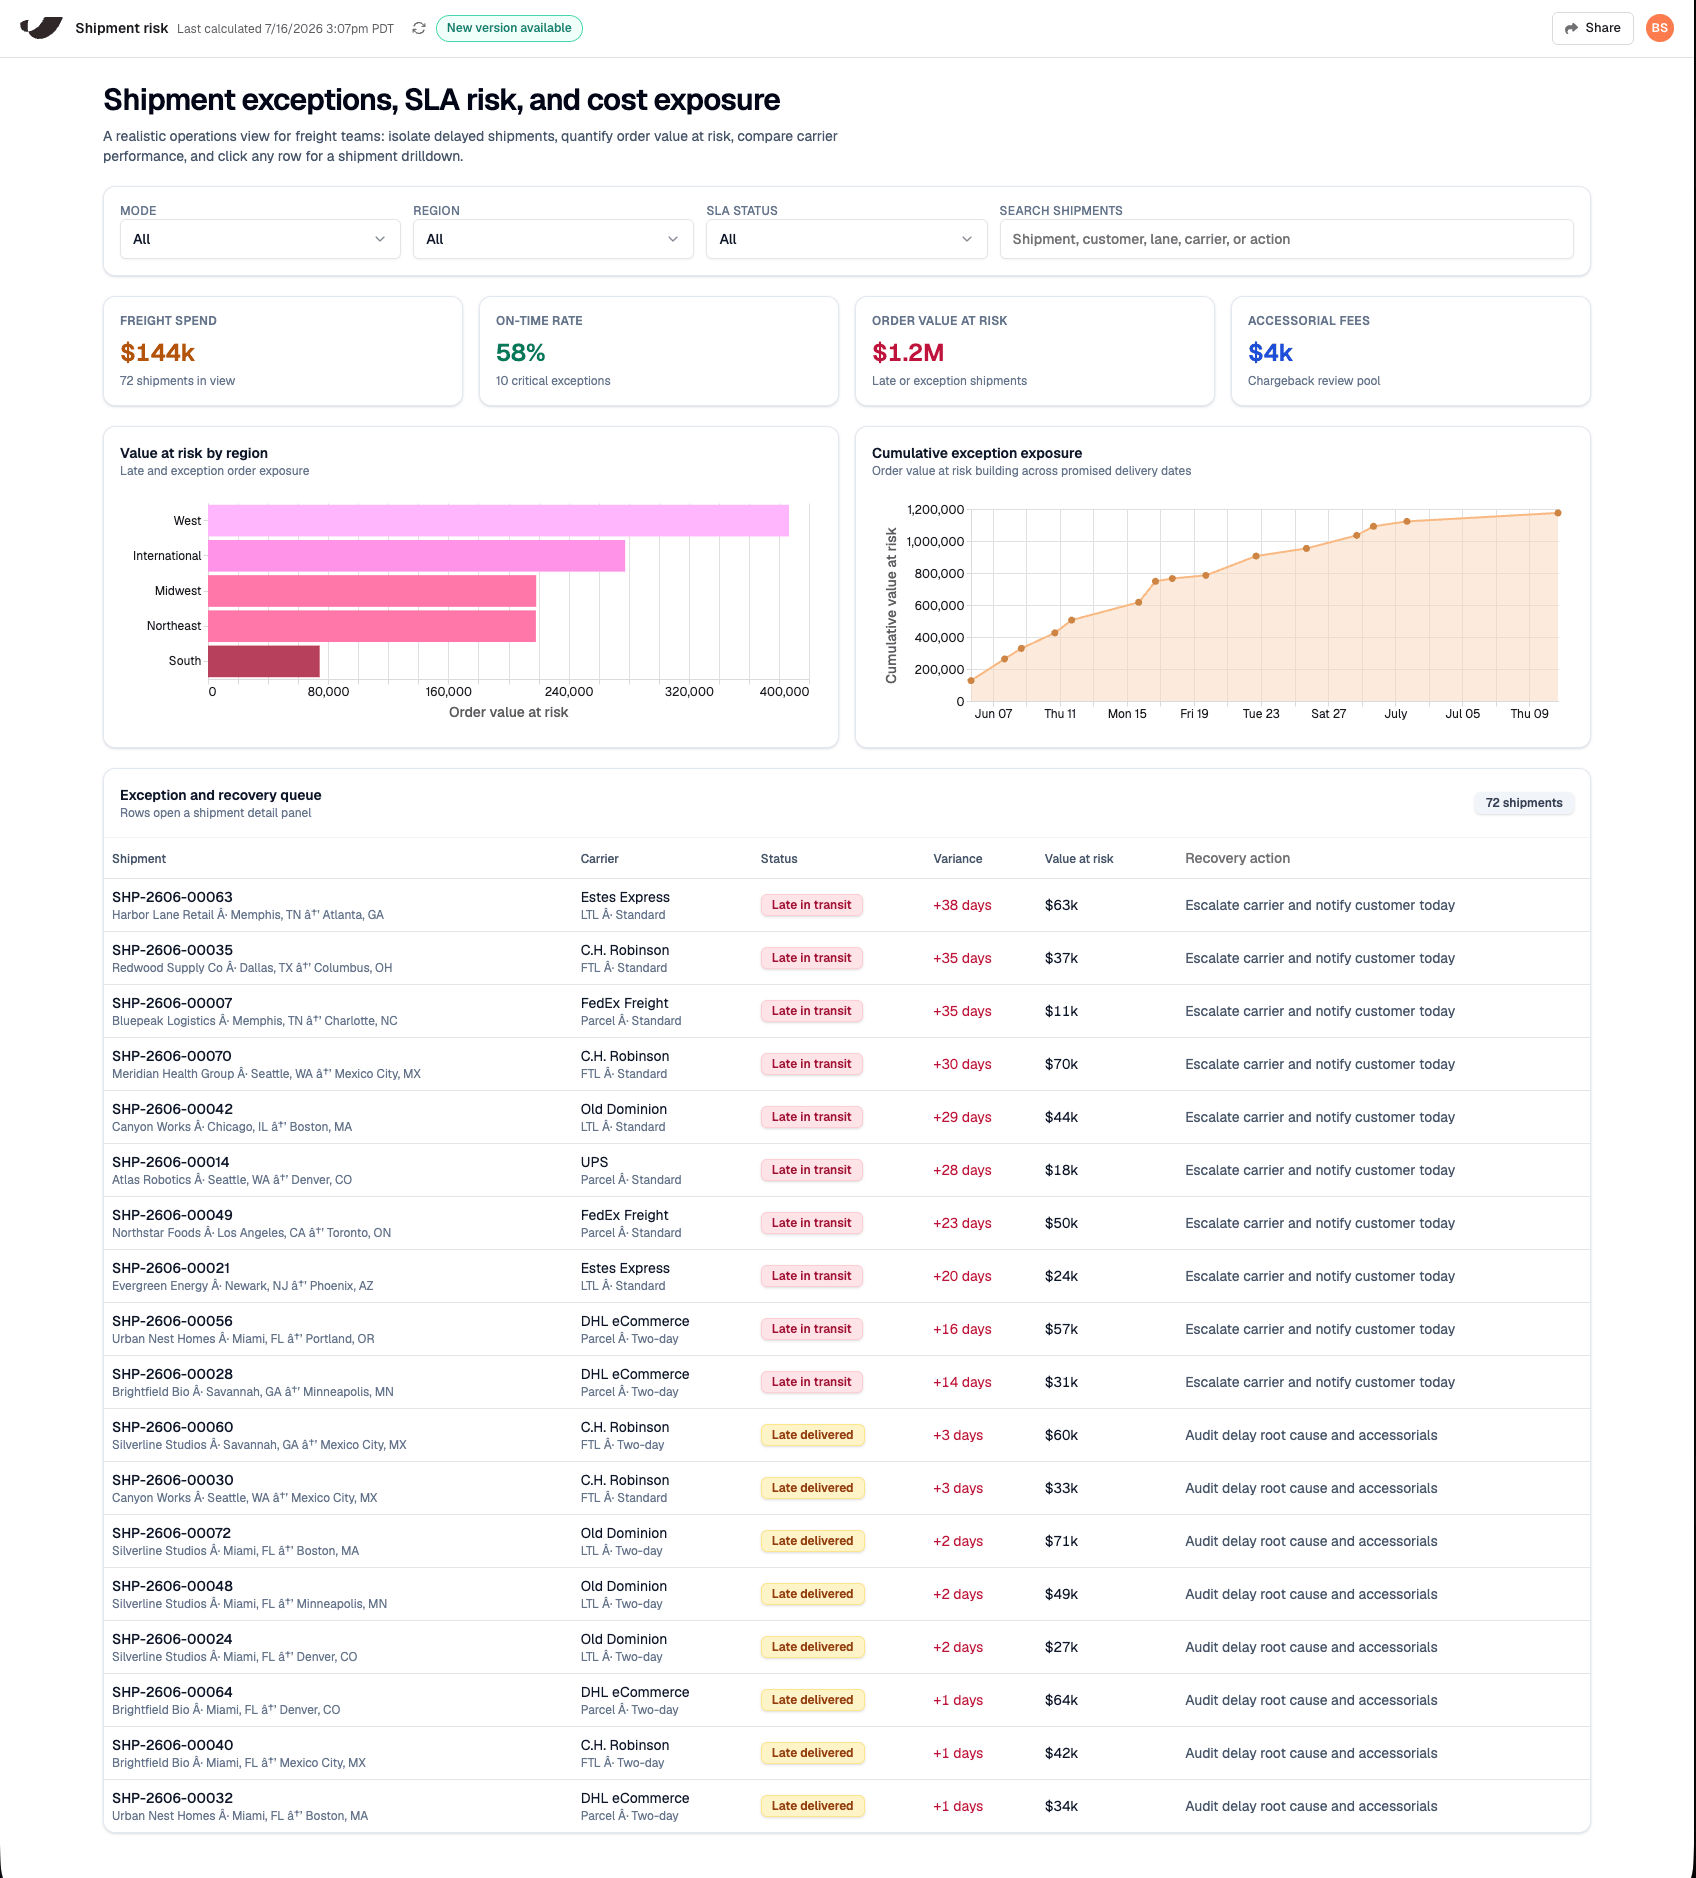
- An ops dashboard with a filter bar, a grid of charts, and a searchable table
- An inventory or reorder tracker with a searchable table and stock-level highlights
- A vendor or carrier scorecard ranking supplier performance
- A month-end close dashboard surfacing exceptions and totals at a glance
- Just a single bar chart filling the step
From summary to detail
Most Artifacts follow the same shape.- KPI tiles surface the headline numbers up top: total revenue, on-time rate, whatever someone would ask for first.
- Charts underneath show that number’s shape over time or across categories.
- An interactive table gives anyone who wants more than the summary a way into the actual rows behind it.
Filter, sort, & drill in
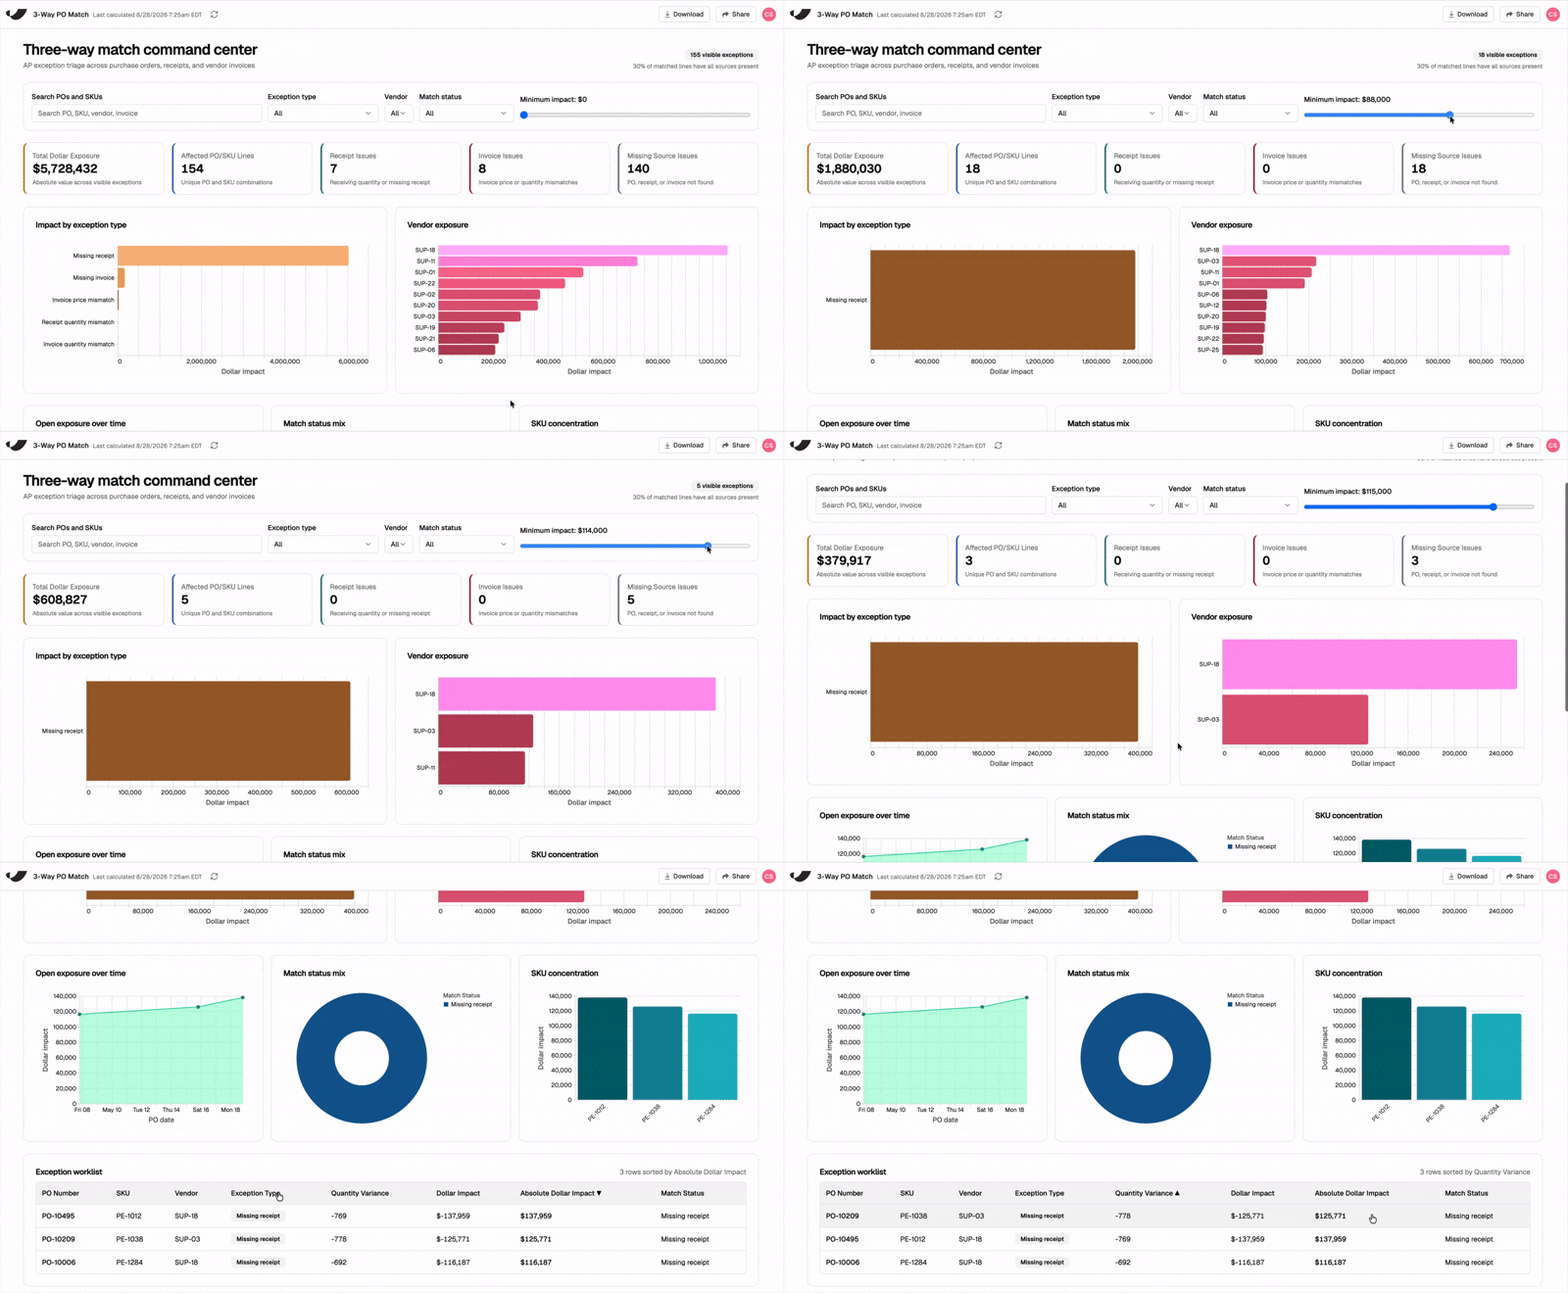
An Artifact isn’t a static image. It’s interactive by default, and every control acts on the same live data at once. Ask Prowork for any of these, or describe the behavior you want and let it choose:- Filter bars. Narrow the whole page to a segment, date range, or category
- Search boxes. Type to find matching rows in a table
- Tabs. Split content across sections you click between
- Toggles. Switch between views, metrics, or on/off states
- Sliders. Set a range or threshold and watch the view respond
- Sortable columns. Click a column header to reorder a table
- Expand and collapse. Open and close sections or grouped rows
- Drill-downs. Click a row to open a detail panel with more about that record
Build an artifact
Describe what you want to Prowork. No manual setup, no code:- “Visualize this data”
- “Make me a dashboard”
- “Chart revenue by region”
Next: Prompt an artifact
How to describe what you want well, and how to style or brand it.