Take a look at this Parabola University video to watch the Sum by group step at work.
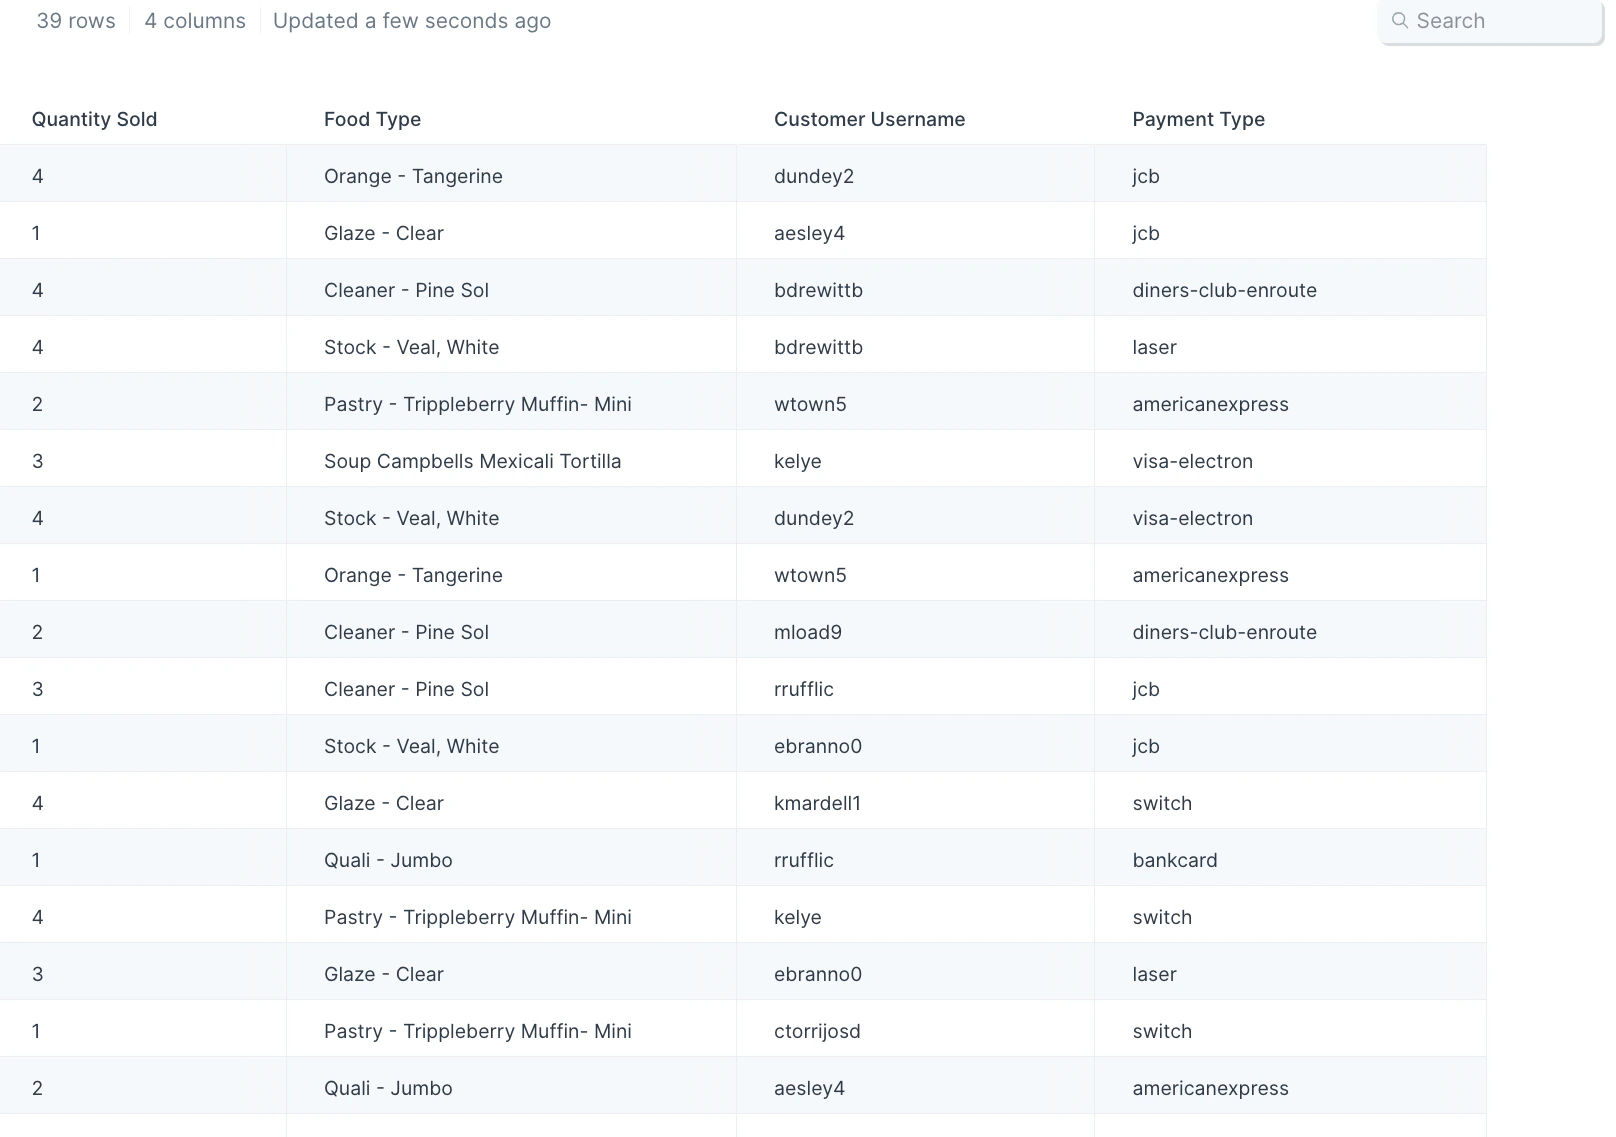
Our input data has 39 rows of order information showing the quantity sold, food type, customer username, and payment type per order.
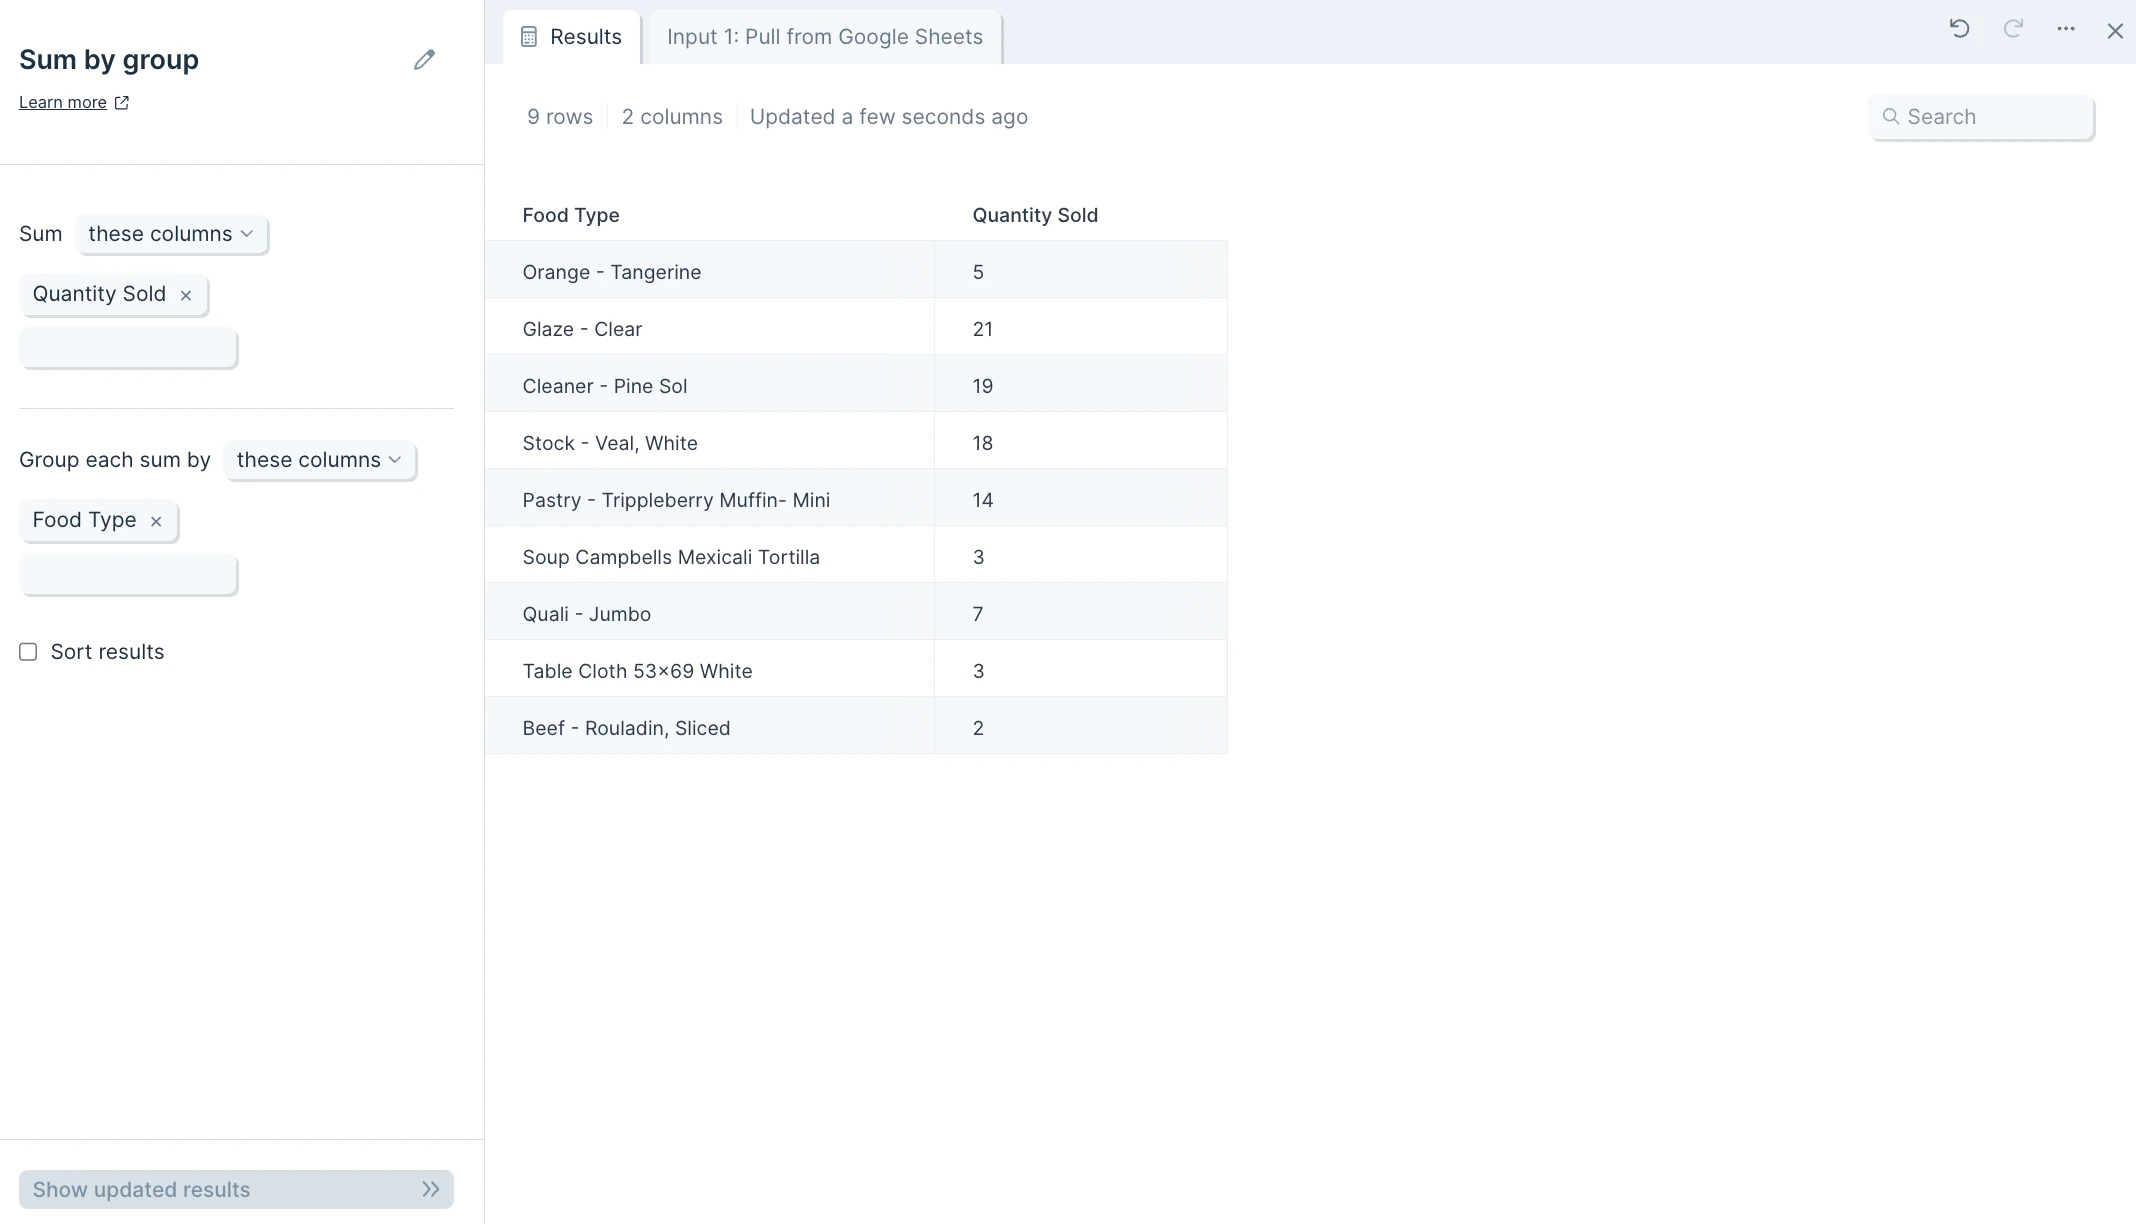
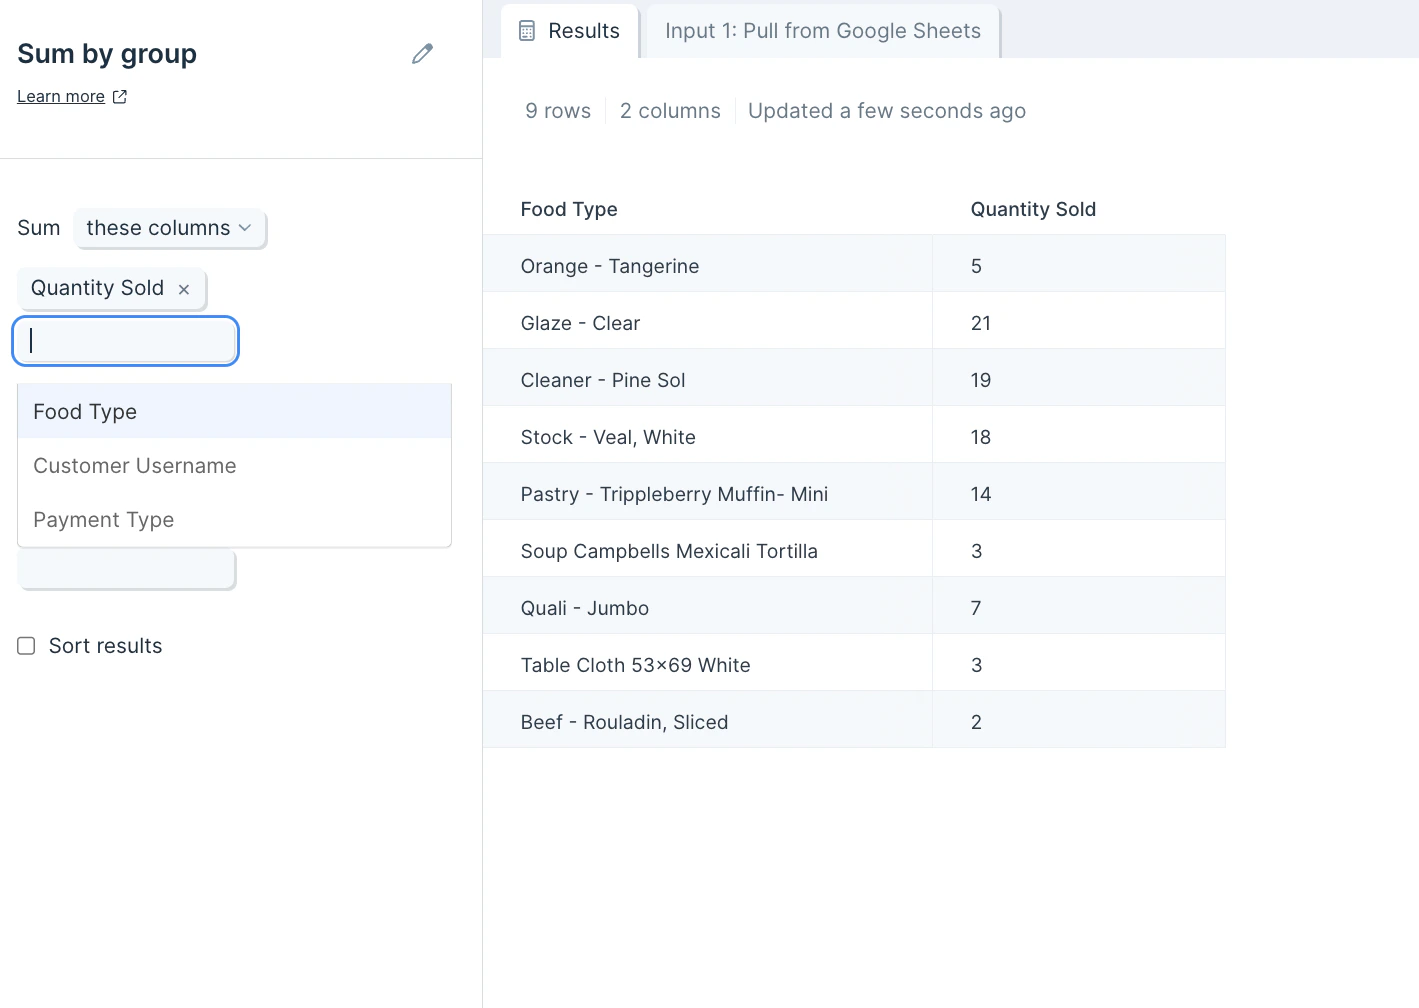
After we connect this data to the step, it’ll produce an output of 9 rows that sum quantities sold per food type in the “Quantity Sold” column.
Default settings
Once connected to your flow, this step will auto-select a column to find the total amount per data group/category like quantity sold per food type. The result will display your grouped values and the total sum of them as a new table.
Custom settings
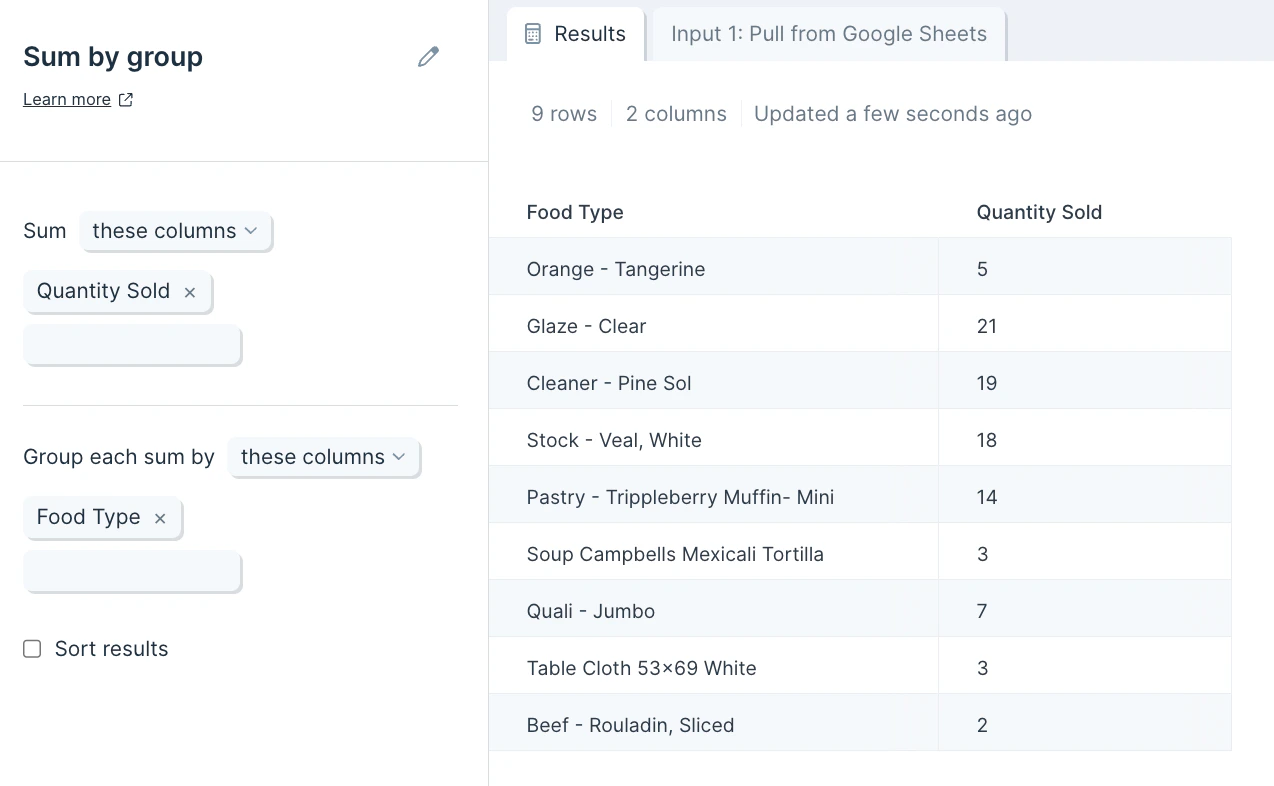
If you’d like to choose other columns for your sum calculation and which rows the calculation is grouped by, you can change the auto-selected ones by clicking into the blue boxes on the left-side toolbar.
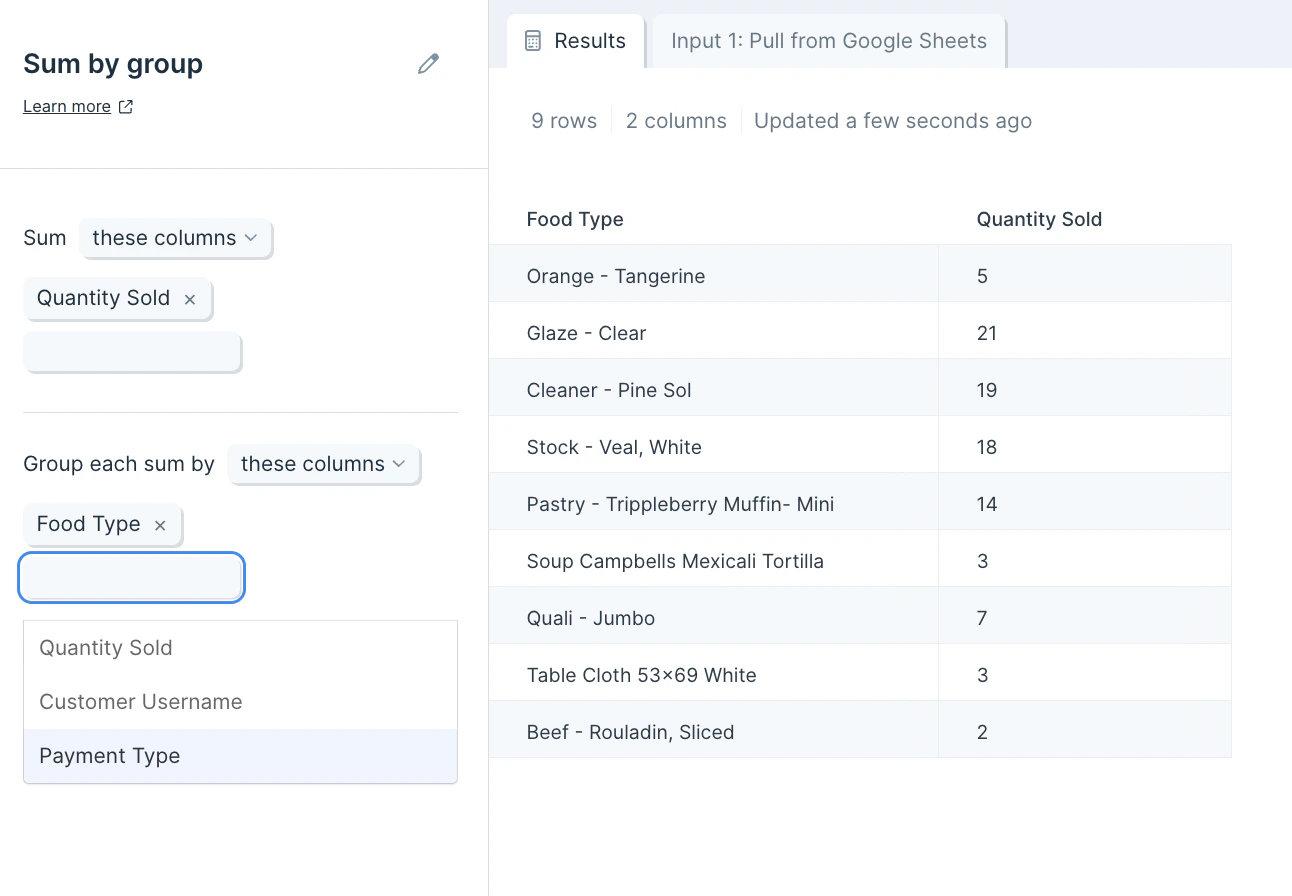
You can also select multiple columns to sum and multiple rows to group by, or choose which columns to exclude.
Last modified on February 18, 2026